Direct and Sensitive Determination of Atropine Sulfate at Polymer ...
15
Int. J. Electrochem. Sci., 7 (2012) 10365 - 10379 International Journal of ELECTROCHEMICAL SCIENCE www.electrochemsci.org Direct and Sensitive Determination of Atropine Sulfate at Polymer Electrode in Presence of Surface Active Agents Nada F. Atta 1,* , Ahmed Galal 1 , Rasha A. Ahmed 2 1 Department of Chemistry, Faculty of Science, University of Cairo, 12613 Giza, Egypt Tel.: +20 0235676561, Fax: +20 0235727556, 2 Forensic Chemistry Laboratories, Medico Legal Department, Ministry of Justice, Cairo, Egypt * E-mail: [email protected] Received: 13 August 2012 / Accepted: 2 October 2012 / Published: 1 November 2012 A novel, selective, rapid and simple electrochemical method is demonstrated for the first time for the determination of atropine sulfate, using poly (3, 4-ethylene-dioxythiophene) (PEDOT) electrode film modified platinum electrode in presence of sodium dodecyl sulfate (SDS). The modified electrode displays an obvious increase in the peak current (8 times) compared to the bare platinum electrode (Pt). The results indicate that PEDOT/Pt electrode in presence of SDS remarkably enhances the electrocatalytic activity towards the oxidation of Atropine sulfate. Cyclic voltammetry (CV), linear sweep voltammetry (LSV), and Electrochemical impedance spectroscopy (EIS) are used to verify the voltammetric behavior of Atropine sulfate in micelles media. Simultaneous determination of Atropine and morphine, and selective determination of atropine sulfate in presence of codeine, ascorbic acid and uric acid are obtained with high sensitivity and good resolution. The PEDOT/Pt in presence of SDS has also been successfully applied to the determination of Atropine sulfate in atropine sulfate injection in the linear ranges of 0.1 to 0.8 μmol L -1 and 2.5 to 100 μmol L -1 with low detection limits of 27 and 64 nM, respectively. The results indicate that the PEDOT/Pt electrode can successfully be applied for the analysis of pharmaceutics in biological fluids. Keywords: PEDOT; SDS; Atropine sulfate; Morphine; Codeine; Electrochemical Analysis. 1. INTRODUCTION Atropine, the tropane alkaloid could be readily extracted from the seeds of Datura metel and it is commonly used as antispasmodic, anticholinergic and antidote [1]. Its structure contains an aromatic ring, carbonyl group and oxygen atom as shown in schematic diagram 1. Atropine sulfate as an active alkaloid lowers the parasympathetic activity of all muscles and glands regulated by the parasympathetic nervous system as it blocks acetylcholine receptor sites. This occurs because atropine
Transcript of Direct and Sensitive Determination of Atropine Sulfate at Polymer ...
Int. J. Electrochem. Sci., 7 (2012) 10365 - 10379
International Journal of
ELECTROCHEMICAL SCIENCE
www.electrochemsci.org
Direct and Sensitive Determination of Atropine Sulfate at
Polymer Electrode in Presence of Surface Active Agents
Nada F. Atta1,*
, Ahmed Galal1, Rasha A. Ahmed
2
1Department of Chemistry, Faculty of Science, University of Cairo, 12613 Giza, Egypt
Tel.: +20 0235676561, Fax: +20 0235727556, 2Forensic Chemistry Laboratories, Medico Legal Department, Ministry of Justice, Cairo, Egypt
*E-mail: [email protected]
Received: 13 August 2012 / Accepted: 2 October 2012 / Published: 1 November 2012
A novel, selective, rapid and simple electrochemical method is demonstrated for the first time for the
determination of atropine sulfate, using poly (3, 4-ethylene-dioxythiophene) (PEDOT) electrode film
modified platinum electrode in presence of sodium dodecyl sulfate (SDS). The modified electrode
displays an obvious increase in the peak current (8 times) compared to the bare platinum electrode (Pt).
The results indicate that PEDOT/Pt electrode in presence of SDS remarkably enhances the
electrocatalytic activity towards the oxidation of Atropine sulfate. Cyclic voltammetry (CV), linear
sweep voltammetry (LSV), and Electrochemical impedance spectroscopy (EIS) are used to verify the
voltammetric behavior of Atropine sulfate in micelles media. Simultaneous determination of Atropine
and morphine, and selective determination of atropine sulfate in presence of codeine, ascorbic acid and
uric acid are obtained with high sensitivity and good resolution. The PEDOT/Pt in presence of SDS
has also been successfully applied to the determination of Atropine sulfate in atropine sulfate injection
in the linear ranges of 0.1 to 0.8 μmol L-1
and 2.5 to 100 μmol L-1
with low detection limits of 27 and
64 nM, respectively. The results indicate that the PEDOT/Pt electrode can successfully be applied for
the analysis of pharmaceutics in biological fluids.
Keywords: PEDOT; SDS; Atropine sulfate; Morphine; Codeine; Electrochemical Analysis.
1. INTRODUCTION
Atropine, the tropane alkaloid could be readily extracted from the seeds of Datura metel and it
is commonly used as antispasmodic, anticholinergic and antidote [1]. Its structure contains an aromatic
ring, carbonyl group and oxygen atom as shown in schematic diagram 1. Atropine sulfate as an active
alkaloid lowers the parasympathetic activity of all muscles and glands regulated by the
parasympathetic nervous system as it blocks acetylcholine receptor sites. This occurs because atropine

Int. J. Electrochem. Sci., Vol. 7, 2012
10366
is a competitive antagonist of the muscarinic acetylcholine receptors (acetylcholine being the main
neurotransmitter used by the parasympathetic nervous system). Therefore, it may cause swallowing
difficulties and reduced secretions.
Atropine is used in the treatment of bradycardia (an extremely low heart rate), asystole and
pulseless electrical activity (PEA) in cardiac arrest. This works because the main action of the vagus
nerve of the parasympathetic system on the heart is to decrease heart rate. Atropine blocks this action
and, therefore, may speed up the heart rate. Atropine can be used to reduce the effect of the poisoning
by blocking muscarinic acetylcholine receptors, which would otherwise be over stimulated by
excessive acetylcholine accumulation.
Atropine has wide medical applications, e.g. for dilating the pupils in the ophthalmic
operations, as an antispasmodic and as an antidote for poisoning of opium, eserine and muscarine [2].
A variety of methods are employed for the determination of atropine such as spectrophotometry [3],
ion-selective electrode (ISE) [4], liquid chromatography [5]. However, spectrophotometry suffers from
the low sensitivity. The liquid chromatography is more sensitive but expensive apparatus, long
procedures and a number of chemicals are involved. In ISE method the response is affected by
electrical properties of the film and electric double-layer capacitance.
Cyclic voltammetry is often the first experiment performed in an electrochemical study of a
compound, a biological material, or an electrode surface. It is effectively used in the fields of
environmental electrochemistry, organic chemistry, inorganic chemistry, and biochemistry. The
effectiveness of CV results from its capability for rapidly observing the redox behavior over a wide
potential range.
Further, the electroanalytical techniques have been shown to be excellent for the determination
of pharmaceutical compounds in different matrices. Many of the active constituents of formulations, in
contrast to excipients, can be readily oxidized. The selectivity of this method is normally excellent
because the analyte can be readily identified by its voltammetric peak potential. Advances in
experimental electrochemical techniques in the field of analysis of drugs are because of their
simplicity, low cost, and relatively short analysis time compared to other techniques [6, 7]. The use of
various electrodes, viz. mercury [8–14], solids [15–21], and modified electrodes [22–26], for
electroanalytical measurements has increased in recent years because of their applicability to the
determination of active compounds that undergo oxidation reactions which is a matter of great
importance in the field of clinical and pharmaceutical analysis. Other works as Molecular imprinted
polymers [27, 28] are also used but this process is time consuming. polymerization of o-
phenylenediamine (o-PD) with aniline (An) to imprint the template atropine was studied [29]. A bulk
acoustic wave (BAW) device was used as a transducer to imprint atropine sulfate over o-
phenylenediamine (o-PD). Some surfactants (such as cyclodextrin [30] and sodium dodecyl sulfate
[31]) are typically used as additives in the electrophoretic buffers.
Moreover, selective assessing elements of sensors is important as a procedure of modification
that is not easy and perhaps decreases the performance properties of sensor which greatly limits the
application of this artificial material as sensing components of chemical sensor. Therefore, simple and
convenient new and simple electrochemical methods for the determination of the important drug

Int. J. Electrochem. Sci., Vol. 7, 2012
10367
atropine sulfate are increasingly needed. The alkaloid, atropine, is unstable in aqueous solution but
atropine sulfate is stable [32]
In this work, we found that atropine sulfate is effectively adsorbed and accumulated on PEDOT
/Pt electrode in the presence of anionic surfactant SDS. Therefore a novel, simple, rapid and sensitive
voltammetric method for atropine determination is explored. Simultaneous determination of atropine
in presence of other alkaloids namely, morphine and codeine is also demonstrated with high response
and good resolution. As a potential application, the electrochemical detection of atropine in injection
and spiked urine samples was performed.
Schematic diagram 1.
2. EXPERIMENTAL
2.1. Materials and reagents
All chemicals were used as received without further purification. 3, 4-ethylenedioxy) thiophene
EDOT, lithium per chlorate (LiClO4), acetonitrile (high-performance liquid chromatography [HPLC]
grade), Atropine sulfate, ascorbic acid, uric acid, and sodium dodecyl sulfate were supplied by Aldrich
Chem. Co. (Milwaukee, WI. USA). Codeine, morphine were supplied from Forensic chemistry
Laboratory, Medico Legal Department, Ministry of Justice, Cairo, Egypt. Aqueous solutions were
prepared using double distilled water. B-R buffer of pH 2-9 are prepared from (0.12 mol L-1
Boric
acid, 0.12 mol L-1
acetic acid and 0.12 mol L-1
orthophosphoric acid) and adjusted by 0.2 mol L-1
NaOH.
2.1.1. Preparation of PEDOT modified Pt- electrode
Electrochemical polymerization and characterization were carried out with a three-
electrode/one-compartment glass cell. The working electrode was platinum disc (diameter: 1.5 mm).
The auxiliary electrode was (10 cm long/ 2.0 mm diameter), platinum wire. All the potentials in the
electrochemical studies were referenced to Ag/AgCl (3.0 mol L-1
NaCl) electrode. The Pt-electrode
was polished by a BAS-polishing kit with 0.3 and 0.05 μm alumina slurry, rinsed and then sonicated in
double-distilled water before starting each experiment. The electrochemical polymerization of the

Int. J. Electrochem. Sci., Vol. 7, 2012
10368
EDOT was carried out by the cyclic voltammetric method in non aqueous solution containing 0.01 mol
L-1
EDOT, and 0.1 mol L-1
LiClO4 in Acetonitrile.
2.2. Instrumental and experimental set-up
2.2.1. Electrochemical measurements
The electrosynthesis of the polymer and its electrochemical characterization were performed
using an Epsilon electrochemical analyzer (Bioanalytical systems, BAS, West Lafayette, USA).
Cyclic voltammetry (CV) and Linear scan voltammetry (LSV) were used for studying the
electrochemical behavior of atropine sulfate using modified PEDOT/Pt electrode in presence of SDS
with scan rate 50 mV s-1
in the designated potential range as indicated.
2.2.2. Impedance measurements
Electrochemical impedance spectroscopy was performed using a Gamry-750 system and a
lock-in-amplifier that are connected to a personal computer. The parameters in electrochemical
impedance experiment were as follows: applied potential value at 650 mV, frequency range of 0.1-
100000 Hz with AC amplitude of 5 mV on PEDOT/Pt electrode and tested in 0.3 mmol L-1
atropine
sulfate in presence and absence of 150 μmol L-1
0.1 mol L-1
SDS in B-R pH 7.4. The data analysis
software is provided with the instrument and applied a non-linear least-square fitting with the
Levenberg-Marquadt algorithm.
2.3. Analysis of Atropine sulfate in urine
The utilization of the proposed method in real sample analysis was also investigated by direct
analysis of atropine sulfate in human urine samples. Atropine sulfate was dissolved in urine to make a
stock solution with concentration of 3 mmol L-1
. Standard successive additions of 10 μL of 3 mmol L-1
atropine sulfate in urine were added to the 5 mL buffer pH 7.4 containing 150 μL SDS.
3. RESULTS AND DISCUSSION
3.1 Electrocatalytic oxidation of atropine at the PEDOT/Pt Electrode
Figure 1 shows the cyclic voltammograms of 0.3 mmol L-1
atropine sulfate at PEDOT/PT in
SDS (a), PEDOT/Pt (b), and Pt (c) in 0.1 mol L-1
B-R (pH 7.4). One well-defined anodic peak of
atropine sulfate at +0.67 V is observed at the PEDOT/Pt electrode in presence of SDS figure 1(a)
which displays 4 and 8-fold increase in current response relative to that at the PEDOT/Pt (b), and Pt
electrode (c), respectively. This oxidation peak is due to the oxidation of atropine sulfate in which the
functional group involved in this oxidation is the tertiary substituted nitrogen atom of the atropine

Int. J. Electrochem. Sci., Vol. 7, 2012
10369
molecule, an electrolytic N- dealkylation almost certainly occur to produce formaldehyde and a
secondary amino compound, [32]. The PEDOT/Pt electrode (b) also showed a similar voltammetric
peak at +0.62 V with lower current response. Only a very weak current response has been observed in
case of using bare Pt electrode (c).
The anionic surfactant SDS enhances greatly the anodic current peak of atropine sulfate which
is attributed to the adsorption of the anionic surfactant SDS onto electrode surface forming a
negatively charged hydrophilic film with the polar head group points to the bulk of the solution[33].
This negatively charged hydrophilic layer facilitates reaching atropine sulfate to the electrode surface
faster, and as consequence, the reaction becomes easier. This micellar effect on the oxidation of
atropine sulfate is basically an electrostatic interaction between the surfactant film adsorbed on the
electrode and the protonated atropine sulphate. The lower oxidation potential and higher current
response clearly indicate that PEDOT/Pt electrode has excellent electrocatalytic activity towards
atropine, which is attributed to the presence of anionic SDS.
Figure 1. Cyclic voltammograms of 3.0 × 10⁻⁴
mol L-1
atropine sulfate/ 0.1 mol L-1
B-R, pH 7.4, at
PEDOT/Pt electrode in the presence of SDS (a), PEDOT / Pt electrode (b), and Pt electrode (c),
at scan rates 50 mVs-1
3.2. Calibration graph
Figure 2A shows linear sweep voltammograms of different concentration of atropine sulfate at
the PEDOT/Pt electrode in presence of 150 μL 0.1 mol L-1
SDS in 0.1 mol L-1
B-R buffer solutions.
The results show that the anodic peak current increases with the increase of atropine sulfate
concentration. The calibration curve Figure 2B corresponding to peak current is linear versus different
E/V(vs. Ag/AgCl)
0.00.20.40.60.81.01.2
Cur
rent
/ A
0.0
20
40
-20
-40
-60
-80
-100
a
b
c

Int. J. Electrochem. Sci., Vol. 7, 2012
10370
concentrations of atropine sulfate in the linear ranges 0.1 μmol L-1
to 0.8 μmol L-1
and 1.2 μmol L-1
to
100 μmol L-1
, with correlation coefficients of 0.999 and 0.995 and with low detection limits of 27
nmol L-1
and 64 nmol L-1
respectively.
E/V (vs. Ag/AgCl)
0.0 0.2 0.4 0.6 0.8 1.0 1.2
Cu
rren
t /
A
0.0
-20
-40
-60
-80
-100
20
(A)
[AT]M
0 20 40 60 80 100 120
Cu
rren
t /
A
25
30
35
40
45
50
55
0.0 0.2 0.4 0.6 0.8 1.0
0
2
4
6
8
10
12
14
16
18
20
22
(B)
Figure 2. (A) LSVs of different concentrations of atropine sulfate (0.1 µmol L-1
- 0.1 mmol L-1
) in 10
ml of 0.1 mol L-1
B-R pH 7.4 containing 150 µL 0.1 mol L-1
SDS at PEDOT /Pt electrode. (B)
Calibration curve for atropine sulfate of different concentrations from (1.2 to 100 μ molL-1
) and
from (0.1 to 0.8 µmol L-1
) (inset).
3.3. Stability of response of the modified electrode
In order to investigate the stability of the PEDOT/Pt electrode in presence of SDS, the CV for
0.3 mmol L-1
atropine sulfate in 150 μL 0.1 mol L-1
SDS, 0.1 mol L-1
B-R (pH 7.4) solution were
recorded for every 10 minutes intervals and over 20 successive runs without any deterioration of the
polymer film. It is found that anodic peak current remains basically the same. Repetitive measurements
indicate that this electrode has a good reproducibility and does not undergo surface fouling during the
voltammetric measurements. After measurements the electrode was kept in pH 7.4 B-R solution at
room temperature. Repeating the experiment after longer time it was found that the current response
decreased about 2% after 1 week and 5.1% after 2 weeks of usage.
3.4 The effect of pH
Atropine sulfate absorption in human depends on the pH-values of the medium. Thus, when the
pH values of the gastric juice are low, absorption of atropine sulfate is slower in the stomach and
quicker in the intestines. Therefore, studying the effect of the pH is very important. Cyclic

Int. J. Electrochem. Sci., Vol. 7, 2012
10371
voltammograms show the effect of changing the pH on the electrochemical response of atropine
sulfate at the modified PEDOT electrode. The experiments were performed in different pH values,
namely 2.3, 4.5, 7.4 and 9.0 in presence of SDS as shown in Figure 3A. Figure 3B shows that at pH
2.3 and 4.5 the oxidation peak potential is lower than that in pH 7.4. While at pH 9.0 no oxidation peak
appears, this takes place in absence (a) and presence (b) of SDS. Figure 3C shows the effect of
changing pH of B-R buffer on the current response of 0.3 mmol L-1
atropine sulfate in the absence (a)
and in presence (b) of 150 µL 0.1 mol L-1
SDS. The peak current of atropine increases at pH 7.4 in
absence and presence of SDS. No current signal was observed in pH 9. Thus, electrochemical
measurements are conducted in pH 7.4, (physiological media).
E/V(vs.Ag/AgCl)
0.00.20.40.60.81.01.2
Cu
rren
t /
A
0.0
-20
-40
-60
20
40
60
ab
c
d
(A)
pH
0 2 4 6 8 10
po
ten
tia
l p
eak
0.0
0.2
0.4
0.6
0.8
a
b
(B)
pH
0 2 4 6 8 10
An
od
ic p
eak
cu
rren
t /
A
0
10
20
30
40
50
a
b
(C)
Figure 3. (A) Cyclic voltammograms of PEDOT / Pt electrode in 3.0 × 10⁻⁴
mol L-1
atropine sulfate /
0.1 mol L-1 B-R in presence (A) of SDS: at different pH values (a-d) pH 2.3, pH 4.0, pH 6, pH
7.4, pH 9 scan rate 50 mV.s-1
.
A plot of the anodic peak potential (B) and anodic peak current (C) values as a function of the
pH of the solution at PEDOT/Pt electrode (a) in absence and (b) in presence of SDS.

Int. J. Electrochem. Sci., Vol. 7, 2012
10372
3.5. Effect of scan rate
The effect of scan rate on the oxidative peak potential and peak current of atropine sulfate at
the surface of PEDOT/Pt in presence and absence of 150 μL 0.1 mol L-1
SDS in 0.1 mol L-1
B-R buffer
solution was studied. Figure 4A, shows the cyclic voltammetric curves of atropine obtained at different
scan rates 30-150 mVs−1
to investigate the kinetics of electrode reactions and verify whether the
presence of SDS affects the diffusion process. Figure 4B shows a linear relation between oxidative
peak current and square root of scan rate from 30 to 150 m V s−1
that is observed for atropine sulfate in
absence (a) and presence (b) of 150 μL 0.1 mol L-1
SDS, 0.1 mol L-1
B-R buffer solutions. This
linearity suggests that the electrochemical reaction of atropine at the surface of PEDOT/Pt is a
diffusion process that is followed by an adsorption step.
Moreover, in case of SDS the current increases which indicates that the anionic surfactant SDS
accelerates the diffusion of the cationic atropine sulfate. Moreover, the cyclic voltammetric results
show that the oxidative peak potentials of atropine sulfate in absence of SDS are shifted slightly to
more positive values with increasing scan rate from 30 to 150 m V s−1
. In presence of SDS the
oxidative peak potentials of atropine are shifted to more positive values with increasing scan rate from
30 to 150 m V s−1
with noticeable increase in the current values.
The dependence of the anodic peak current density on the scan rate has been used for the
estimation of the “apparent” diffusion coefficient, Dapp, for the compounds studied. Dapp values were
calculated from Randles Sevcik equation [34]
ip = 2.69 × 10⁵n
3/2AC0D
1/2ν
1/2
Where ip is the peak current density (Acm−2
), n is the number of electrons transferred at
T=298K, A is the geometrical electrode area (0.0176 cm2), C0 is the analyte concentration (3×10
−7
molcm−3
), and D is the diffusion coefficient of the electroactive species (cm2 s
−1). Apparent surface
area used in the calculations did not take into account the surface roughness, which is an inherent
characteristic for all polymer films formed using the electrochemical techniques. Dapp values at
PEDOT/Pt electrode in absence and presence of SDS for atropine sulfate are 9.0 10-4
cm2
s-1
and 3.0
10-3
cm2 s
-1, respectively. The anionic surfactant SDS affects remarkably the diffusion component
of the charge transfer at the electrode surface as indicated by the Dapp values. The diffusion coefficient
can be considered as an average value of the diffusion process in the bulk, within the surfactant
aggregates in solution and the surfactant layer adsorbed at the surface of the electrode. The size of the
diffusion layer at the electrode surface proximity changes with the voltage scan used. At relatively
slow voltage scans the diffusion layer grows much further towards the solution side and further from
the electrode surface. Therefore, as the scan rate increases the flux to the electrode surface increases
considerably. At relatively higher scan rates and in presence of SDS that mainly aggregates at the
electrode surface and forms a pair with the drug in electrolyte, the diffusion layer grows less further
from the vicinity of the electrode[35]. The values indicated for Dapp show that the diffusion is enhanced
in presence of SDS.

Int. J. Electrochem. Sci., Vol. 7, 2012
10373
E/V(vs.Ag/AgCl)
Cu
rren
t /
A
-60
-40
-20
0
20
40
60
80
00.20.40.60.81.01.2
(A)
scan rate 1/2
6 8 10 12
An
od
ic p
ea
k c
urre
nt/
A
20
30
40
50
60
70
a
b(B)
Figure 4. (A) Cyclic voltammograms of 3.0 × 10⁻⁴
mol L-1
atropine sulfate / 0.1 mol L-1
B-R, pH 7.4,
at PEDOT / Pt electrode at different scan rates (30, 70, 110, 130 and 150 mV s-1
. in presence of
150 µL 0.1 mol L-1
SDS. (B) A plot of the anodic peak current values as a function of the
square root of the scan rate at PEDOT/Pt electrode (a) in absence and (b) in presence of SDS.
3.6. Simultaneous determination of Morphine and Atropine
E/V(vs. Ag/AgCl)
0.0 0.2 0.4 0.6 0.8 1.0
Cur
rent
/ A
MO
Atropine
0.0
-5
-10
-15
-20
-25
5
(A)
Figure 5. LSVs of different concentrations of a solution formed by successive injections of 10 µL
from a solution containing a mixture of 0.6 mg atropine and 0.01 gm morphine / 1
mL to 10
mL of 0.1 mol L-1
B-R pH 7.4 containing 150 µL 0.1 mol L-1
SDS at PEDOT /Pt electrode.
Since Morphine and Atropine are alkaloids, a mixture of Morphine and Atropine are commonly
used in premedication in anesthesia. Moreover, they both play an important role in respiratory system
and alveoli during surgery.
Successive additions of 10 μL from solution containing a 1 mL mixture of 0.6 mg atropine and
0.01 gm morphine is tested in 10 mL of 0.1 mol L-1
B-R pH 7.4, and in presence of 150 μL 0.1 mol L-1
SDS. This experiment was performed in order to study the simultaneous determination of the two
alkaloids [36, 37]. The LSVs in Figure 5 show a well-defined peak for the oxidation of MO at +422
mV; a second less-defined peak appears at + 648 mV for the oxidation of Atropine sulfate after
successive additions . This indicates that in presence of relatively high concentration of morphine
compared to atropine, it is possible to successfully determine morphine and atropine selectively. The
two peaks appear for the oxidation of MO and Atropine with a separation of more than 226 mV. From

Int. J. Electrochem. Sci., Vol. 7, 2012
10374
the calibration curve corresponding to the data of atropine in the linear range from 0.13 μmol L-1
to
96 μmol L-1
, with correlation coefficient of 0.999 the detection limit was 78 nmol L-1
and for MO in
the linear range from 0.01 μmol L-1
to 2.6 μmol L-1
and from 5 μmol L-1
to 270 μmol L-1
, with
correlation coefficients of 0.999 and 0.994 the detection limits were 50 nmol L-1
and 73 nmol L-
1(figures not shown).
3.7. Determination of Atropine sulfate in presence of Codeine
The combination of the spasmolytic action of atropine with the pain-relieving properties of
codeine brings the drug near to morphine in the intensity of pain-relieving action. Figure 6A shows
that the oxidation peak of codeine appears at +0.86 V in absence (curve a) and in presence (curve b) of
150 μL 0.1 mol L-1
SDS at PEDOT/Pt electrode in 0.1 mol L-1
B-R (pH 7.4).
Figure 6. (A) Cyclic voltammograms for 3 mmol L-1
codeine in 0.1 mol L-1
B-R pH 7.4 at PEDOT /Pt
electrode in absence (a) in presence of 100 µL SDS 0.1 mol L-1
(b). (B) Cyclic
voltammograms for equimolar solution 0.3 mmol L-1
for each of atropine sulfate and codeine in
0.1 mol L-1
B-R pH 7.4, at PEDOT/Pt electrode with two successive additions of 100 μL 0.1
mol L-1
SDS, scan rate 50 mV.s-1
.
Figure 6B shows a voltammetric response of 0.3 mmol L-1
atropine sulfate solution containing
0.3 mmol L-1
codeine at the PEDOT/Pt electrode in presence of successive additions of 150 μL SDS in
0.1 mol L-1
B-R at pH 7.4. The results indicated that the PEDOT/Pt electrode in presence of SDS can
easily discriminate atropine from codeine (CO) [37, 38]. The adsorption of atropine sulfate by the
PEDOT/Pt electrode involved interactions between atropine molecules and the anionic surfactant.
Codeine did not show significant interference and an oxidation peak at +0.69 V for atropine sulfate is
observed. The proposed method is useful for toxicological analysis.
3.8. Determination of Atropine sulfate in presence of ascorbic and uric acids
To verify the feasibility of the selective determination of atropine at PEDOT/Pt electrode in
presence of 150 μL of 0.1 mol L-1
SDS, the electrochemical behavior of a solution containing a
E/V (vs.Ag/AgCl)
0.00.20.40.60.81.01.21.4
Cu
rren
t /
A
-40
-20
0
20
40
60
80
100
120
140
a
b
(A)
E/V(vs.Ag/AgCl)
0.00.20.40.60.81.01.21.4
Cu
rren
t /
A
-50
0
50
100
(B)

Int. J. Electrochem. Sci., Vol. 7, 2012
10375
mixture of atropine sulfate, UA and AA is studied. LSV mode was used to study the oxidation of a
solution containing a mixture of 0.3 mmol L-1
atropine sulfate, 3 mmol L-1
UA and 30 mmol L-1
AA at
(a) PEDOT/Pt and (b) PEDOT/Pt in presence of SDS. As indicated in Figure 7, at the working pH 7.4
the oxidation peaks are resolved at the PEDOT/Pt electrode with the peak potentials at 87 mV, 496 mV
and 800 mV for AA, UA, and AT, respectively (Figure 7, curve a).
Figure 7. LSV for a mixture solution of 30 mmol L-1
AA, 3 mmol L-1
UA, 0.3 mmol L-1
AT sulfate, in
0.1 mol L-1
B-R pH 7.4 at PEDOT /Pt electrode in absence (a) in presence of 150 µL SDS 0.1
mol L-1
(b) scan rate 50 mV s-1
.
The large separation of the peak potentials allows selective and simultaneous determination of
AA, UA, and AT in their mixture. Using PEDOT/ Pt in presence of SDS (Figure 7, curve b), a sharp
well defined oxidation peak of AT appeared at 800 mV and a relatively smaller oxidation peaks for
UA and AA appear at 466 mV and 244 mV, respectively. The oxidation peak current increases for AT
in presence of SDS. Moreover, there is a noticeable decrease in the oxidation peak currents for UA and
AA. Therefore, the high response for atropine was observed due to the electrostatic interaction of the
anionic surfactant with the protonated AT in pH 7.4, but in case of AA and UA repulsion takes
place[39] (Figure 7, curve b). Therefore, it is possible to determine atropine sulfate selectively in
presence of relatively high concentrations of AA, and UA.
3.9. Determination of Atropine sulfate in urine
The proposed method in real sample analysis is also examined in human urine samples. In this
set of experiments, Atropine sulfate is dissolved in urine to make a stock solution with 3 mmol L-1
concentration. Standard additions of 10 µL of 3 mmol L-1
atropine sulfate in urine are added to 5 mL
B-R pH 7.4 containing 150 μL SDS, the corresponding LSV is then measured. The results showed that
the oxidation peak current increases by increasing the atropine concentration. The calibration plot
E/V(vs.AgAgCl)
-0.2 0.0 0.2 0.4 0.6 0.8 1.0 1.2
Cu
rren
t /
A
0
20
40
60
80
100
AA
UA AT a
b
Int. J. Electrochem. Sci., Vol. 7, 2012
10376
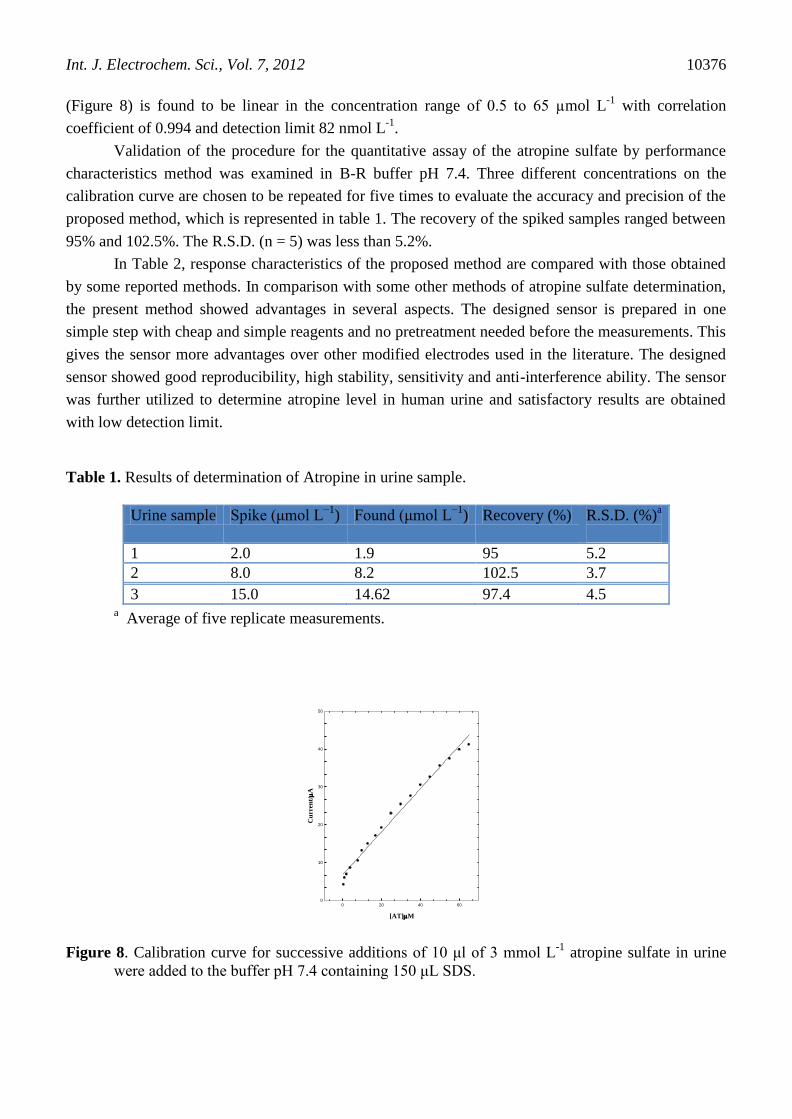
(Figure 8) is found to be linear in the concentration range of 0.5 to 65 µmol L-1
with correlation
coefficient of 0.994 and detection limit 82 nmol L-1
.
Validation of the procedure for the quantitative assay of the atropine sulfate by performance
characteristics method was examined in B-R buffer pH 7.4. Three different concentrations on the
calibration curve are chosen to be repeated for five times to evaluate the accuracy and precision of the
proposed method, which is represented in table 1. The recovery of the spiked samples ranged between
95% and 102.5%. The R.S.D. (n = 5) was less than 5.2%.
In Table 2, response characteristics of the proposed method are compared with those obtained
by some reported methods. In comparison with some other methods of atropine sulfate determination,
the present method showed advantages in several aspects. The designed sensor is prepared in one
simple step with cheap and simple reagents and no pretreatment needed before the measurements. This
gives the sensor more advantages over other modified electrodes used in the literature. The designed
sensor showed good reproducibility, high stability, sensitivity and anti-interference ability. The sensor
was further utilized to determine atropine level in human urine and satisfactory results are obtained
with low detection limit.
Table 1. Results of determination of Atropine in urine sample.
Urine sample Spike (μmol L−1
) Found (μmol L−1
) Recovery (%) R.S.D. (%)a
1 2.0 1.9 95 5.2
2 8.0 8.2 102.5 3.7
3 15.0 14.62 97.4 4.5 a Average of five replicate measurements.
[AT]M
0 20 40 60
Cu
rren
t/
A
0
10
20
30
40
50
Figure 8. Calibration curve for successive additions of 10 μl of 3 mmol L-1
atropine sulfate in urine
were added to the buffer pH 7.4 containing 150 μL SDS.

Int. J. Electrochem. Sci., Vol. 7, 2012
10377
Table 2. Comparison of the proposed method with other methods for the determination of atropine
sulfate
Method Application Calibration
range (mM)
Detection
limit (M)
Recovery
(%)
References
ISE Pharmaceutical 0.017–20 106.8 [40]
spectrophotometry Pharmaceutical 2.910−3
–1.4
10−2
99.0 [3]
FIA-ISPs Pharmaceutical 0.02–100 2.010−6
98–102 [41]
HPLC Pharmaceutical
Biological fluids 2.610
−3–0.13 2.610
−6 90.7–97.7 [5]
PQC Pharmaceutical 0.01 [42]
This work urine 0.510−3
-
6510−3
82 10−9
95-102
3.9. Electrochemical impedance spectroscopy (EIS) of Atropine sulfate
It is well known that electrochemical alternating current impedance technique is a useful tool
for studying the interface properties of surface-modified electrodes [43, 44]. Therefore, EIS was used
to investigate the nature of atropine sulfate interaction at PEDOT/Pt surface in presence of SDS. In
EIS, the semicircle diameter equals the electron transfer resistance. Figure 9A shows the complex
plane diagram (Nyquist plot) of atropine sulfate at PEDOT/Pt electrode in the presence (a) and absence
of SDS (b) at oxidation potential 650 mV. From this comparison, it is clear that the impedance
responses of atropine sulfate show great difference after addition of SDS. On the other hand, in the
absence of SDS, the impedance spectra display a semicircle with a larger diameter. However, after
addition of 150 μL 0.1 Μ SDS, the diameter of semicircle diminishes markedly. Thus, the charge
transfer resistance of electrooxidation of atropine sulfate decreases greatly, and the charge transfer
rate is enhanced by SDS. The data proves that SDS facilitates the electron transfer between atropine
and electrode and indicates that adsorption is taking place at the electrode surface.
A B
Figure 9. (A) Nyquist diagrams (−Z″ vs. Z′) for the EIS measurements at PEDOT/ Pt electrode at
potential 650 mV for atropine sulfate (a) in presence of SDS and (b) in absence of SDS in 0.1
mol L−1
B-R pH 7.4. Amplitude: 5 mV, frequency range: 0.1–10000 Hz. (B) The equivalent
circuit.
Z
0 2e+4 4e+4 6e+4 8e+4 1e+5 1e+5 1e+5 2e+5 2e+5 2e+5
-Z''
-1.2e+5
-1.0e+5
-8.0e+4
-6.0e+4
-4.0e+4
-2.0e+4
0.0
2.0e+4
a
b
Int. J. Electrochem. Sci., Vol. 7, 2012
10378
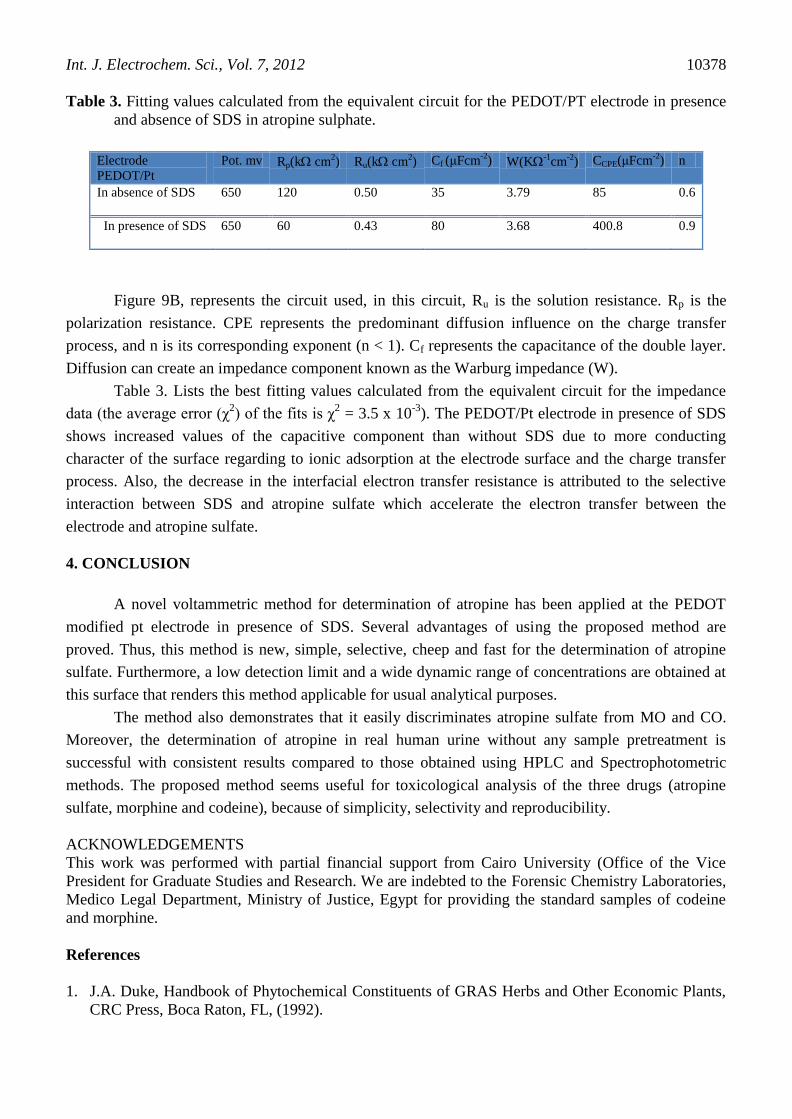
Table 3. Fitting values calculated from the equivalent circuit for the PEDOT/PT electrode in presence
and absence of SDS in atropine sulphate.
Electrode
PEDOT/Pt
Pot. mv Rp(k cm2) Ru(k cm
2) Cf (μFcm
-2) W(K
-1cm
-2) CCPE(μFcm
-2) n
In absence of SDS 650
120 0.50 35 3.79 85 0.6
In presence of SDS 650
60 0.43 80 3.68 400.8 0.9
Figure 9B, represents the circuit used, in this circuit, Ru is the solution resistance. Rp is the
polarization resistance. CPE represents the predominant diffusion influence on the charge transfer
process, and n is its corresponding exponent (n < 1). Cf represents the capacitance of the double layer.
Diffusion can create an impedance component known as the Warburg impedance (W).
Table 3. Lists the best fitting values calculated from the equivalent circuit for the impedance
data (the average error (χ2) of the fits is χ
2 = 3.5 x 10
-3). The PEDOT/Pt electrode in presence of SDS
shows increased values of the capacitive component than without SDS due to more conducting
character of the surface regarding to ionic adsorption at the electrode surface and the charge transfer
process. Also, the decrease in the interfacial electron transfer resistance is attributed to the selective
interaction between SDS and atropine sulfate which accelerate the electron transfer between the
electrode and atropine sulfate.
4. CONCLUSION
A novel voltammetric method for determination of atropine has been applied at the PEDOT
modified pt electrode in presence of SDS. Several advantages of using the proposed method are
proved. Thus, this method is new, simple, selective, cheep and fast for the determination of atropine
sulfate. Furthermore, a low detection limit and a wide dynamic range of concentrations are obtained at
this surface that renders this method applicable for usual analytical purposes.
The method also demonstrates that it easily discriminates atropine sulfate from MO and CO.
Moreover, the determination of atropine in real human urine without any sample pretreatment is
successful with consistent results compared to those obtained using HPLC and Spectrophotometric
methods. The proposed method seems useful for toxicological analysis of the three drugs (atropine
sulfate, morphine and codeine), because of simplicity, selectivity and reproducibility.
ACKNOWLEDGEMENTS
This work was performed with partial financial support from Cairo University (Office of the Vice
President for Graduate Studies and Research. We are indebted to the Forensic Chemistry Laboratories,
Medico Legal Department, Ministry of Justice, Egypt for providing the standard samples of codeine
and morphine.
References
1. J.A. Duke, Handbook of Phytochemical Constituents of GRAS Herbs and Other Economic Plants,
CRC Press, Boca Raton, FL, (1992).

Int. J. Electrochem. Sci., Vol. 7, 2012
10379
2. Chinese Pharmacopoeia, 3rd Edition, Vol. 2, Chemical Engineering Press, Beijing, China, (1985),
542.
3. M.S. Mahrous, M.E. Abdel-Hamid, H.G. Dabees, Y.A. Beltagy, J. Pharm. Belg. 47 (1992) 135.
4. Y. Long, L. Lei, W. Li, D. He, L. Nie, S. Yao, Analyst 124 (1999) 1629.
5. I. Papadoyannis, A. Zotou, V. Samanidou, M. Georgarakis, Instrum. Sci. Technol. 22 (1994) 83.
6. N. F. Atta, A. Galal, R. A. Ahmed, Electroanalysis, 23(3) (2011) 737.
7. N. F. Atta, A. Galal, R. A. Ahmed, J. Electrochem Soc., 158, (4) (2011) F52.
8. A. Ambrosi, R. Antiochia, L. Campanella, R. Dragone, I. Lavagnini, J. Hazard. Mater. 122 (2005)
219.
9. W. Guo, H. Lin, L. Liu, J. Song, J. Pharm. Biomed. Anal. 34 (2004) 1137.
10. R.A. Toledo, M. Castilho, L.H. Mazo, J. Pharm. Biomed. Anal. 36 (2005) 1113.
11. E. Winter, L. Codognoto, S. Rath, Anal. Lett. 40 (2007) 1197.
12. A. Alvarez-Lueje, S. Brain-Isasi, L.J. Nunez-Vergara, J.A. Squella, Talanta 75 (2008) 691.
13. A.A. Gazy, E.M. Hassan, M.H. Abdel-Hay, T.S. Belal, J. Pharm. Biomed. Anal. 43 (2007) 1535.
14. B. Dogan, D. Canbaz, S.A. Ozkan, B. Uslu,, Pharmazie 61 (2006) 409.
15. Z. Mandic, Z. Weitner, M. Ilijas, J. Pharm. Biomed. Anal. 33 (2003) 647.
16. R. Fernandez Torres, M. Callejan Mochon, J.C. Jimenez Sanchez, M.A. Bello Lopez, A. Guiraum
Perez, Talanta 53 (2001) 1179.
17. S. Michalkiewicz, Bioelectrochemistry 73 (2008) 30.
18. T. Wahdan, N.A. El-Ghany, Il Farmaco 60 (2005) 830.
19. M.S. El-Shahawi, S. Bahaffi, T. El-Mogy, Anal. Bioanal. Chem. 387 (2007)719.
20. A. Golcu, S.A. Ozkan, Pharmazie 61 (2006) 760.
21. A.E. Radi, N. Abd-Elghany, T. Wahdan , Chem. Pharm. Bull. 55 (2007) 1379.
22. R. Jain, V.K. Gupta, N. Jadon, K. Radhapyari, J. Electroanal. Chem. 648 (2010) 20.
23. C. Yin Wang, X. Ya Hu, Talanta 67 (2005) 625.
24. P.B. Desai, R.M. Kotkar, A.K. Srivastava, J. Solid State Electrochem. 12 (2008) 1067.
25. W. Lai-Hao, T. Shu-Jen, Anal. Chim. Acta 441 (2001) 107.
26. S. Komorsky-Lovric, B. Nigovic, J. Pharm. Biomed. Anal. 36 (2004) 81.
27. A.G. Mayes, K. Mosbach, Trends Anal. Chem. 16 (1997)321.
28. B. Sellergren, Trends Anal. Chem. 16 (1997) 310.
29. H. Peng, C. Liang, A. Zhou, Y. Zhang, Qingji, X. S. Yao, Anal. Chim. Acta 423 (2000) 221.
30. J.G. Li, Y. Chun, H.X. Ju, Electroanalysis 19 (2007) 1569.
31. S. Cherkaoui, L. Mateus, P. Christen, J.L. Veuthey, Chromatographia 49 (1999)54.
32. P. Leroy A. Nicolas, J. Pharm. Biomed. Anal. 5 (1987) 477.
33. N. F. Atta, A. Galal, R.A. Ahmed, Bioelectrochemistry 80 (2011) 132.
34. H.S.Wang, A.M. Zhang, H. Cui, D.J. Liu, R.M. Liu, Microchem. J. 64 (2000) 67.
35. N. F. Atta, A. Galal, R.A. Ahmed, Int. J. Electrochem. Sci. 6 (2011) 5097.
36. C. Nerin, A. Garnica, J. Cacho, Anal. Chem., 57 (1985) 34.
37. M. Sarwar, T. Aman, Microchem. J 30 (1984) 304.
38. T. Aman, A. Hassan, I. Khokhar, A. Rashid, Anal. Lett. 27(1994) 1833.
39. N.F. Atta, A. Galal, E.H. El-Ads, Electrochim. Acta 69 (2012) 102.
40. H. Hattori, T. Arinobu, M. Iwai, O. Suzuki, H. Seno, Jap. J. Forens. Toxic. 21(2003) 47.
41. M.T. Muldoon, L.H. Stanker, Anal. Chem. 69 (1997) 803.
42. H.B. Cai, Talanta 40 (1993) 1445.
43. R. Roto, G. Villemure, J. Electroanal. Chem. 527 (2002) 123.
44. M.I. V´azquez, J. Benavente, J. Membr. Sci. 219 (2003) 59.
© 2012 by ESG (www.electrochemsci.org)