DIRECT AND INDIRECT EFFECTS OF THE WFP VALUE-BASED … · under the overall leadership of Arif...
22
JULY 2014 ECONOMIC IMPACT STUDY: DIRECT AND INDIRECT EFFECTS OF THE WFP VALUE-BASED FOOD VOUCHER PROGRAMME IN LEBANON WFP/ Sandy Maroun
Transcript of DIRECT AND INDIRECT EFFECTS OF THE WFP VALUE-BASED … · under the overall leadership of Arif...

JULY 2014
ECONOMIC IMPACT STUDY:DIRECT AND INDIRECT EFFECTS OF THE WFP VALUE-BASED FOOD VOUCHER PROGRAMME IN LEBANON
WFP/ Sandy Maroun

Disclaimer
All rights reserved. Reproduction and dissemination of material in this information product for educational or other non-commercial uses are authorized without any prior written permission from the copyright holders provided the source is fully acknowledged.Reproduction of material in this information product for resale or other commercial purposes is prohibited without written permission. Applications for such permission should be addressed to [email protected].
© WFP 2014
1

Table of ContentsList of Tables 2List of Figures 2Executive Summary 3Assessment objectives and methodology 4Lebanon’s economy, the response to the Syria crisis and WFP’s e-card programme 4 The international market as a key source of food supply 5 The value-based electronic food voucher programme (e-card programme) 6Project performance 7 Market analysis 7 Price trends 9 How participating retailers use e-card income 11 How quickly do beneficiaries spend their e-card allocations? 13 Why do food-insecure beneficiaries monetize their e-card entitlement? 14Indirect impacts 16 Analysis of indirect effects: input-output model 16 Estimating the multipliers (Leontief inverse) 17Conclusions and recommendations 18 Conclusions 18 Recommendations 19Key references 20
List of tablesTable 1: Number and amount (in US$) of e-cards distributed by month in 2014 6Table 2: Sectoral inputs to the food sector (Lebanese Pounds, billion) 16Table 3: Multipliers for the agriculture and food products sectors 17
List of figuresFigure 1: Total cereal consumption, production and imports in Lebanon 5Figure 2: Map of CR3 ratio (Jan–April 2014) 8Figure 3: Number of e-card beneficiaries per store 8Figure 4: WFP food voucher price index and the consumer price index (CPI) for food and non-alcoholic beverages in Lebanon 9Figure 5: Food basket price in WFP-contracted and non-contracted stores (Bekaa Region) 9Figure 6: Comparison of the value of the WFP food basket in WFP-contracted stores in competitive versus non-competitive markets (CR3>50) 10Figure 7: Price of WFP food basket by store size 11Figure 8: Average distribution of one dollar of e-card revenue by retailers 12Figure 9: Cumulative share of monthly sales (January–April 2014) 13Figure 10: Cumulative sales by store type 14
List of boxesBox 1: The shelter gap 15
2

Acknowledgments
This report was prepared jointly by Jean-Martin Bauer, Susanna Sandström and Hiba Audi under the overall leadership of Arif Husain, Chief Economist and Deputy Director, Policy, Programme and Innovation, Analysis and Nutrition Service (WFP).
The authors acknowledge the contributions of Ekram El-Huni and Imad Osman-Saleh in ensuring and facilitating access to refugees, cooperating partners and supermarkets in Lebanon. They also acknowledge the support provided by the WFP sub-offices and the World Vision in organizing focus group discussions and field trips.
The authors thank the Lebanese Central Administration of Statistics, the Central Bank of Lebanon, The UNDP Project at the Ministry of Economy and Trade, Banque Libano-Française, NGO cooperating partners, donor agencies, the World Bank, fellow academics - Dr. Ali Chalak and Dr. Kanj Hamade - and UN sister agencies in Lebanon: United Nations Development Project, United Nations High Commissioner for Refugees and the Office for the Coordination of Humanitarian Affairs for providing the information and support needed to produce this report.
Comments on successive versions of this report were received from Marie Enlund and Syria regional emergency coordinator’s office.
Executive Summary
This study examines the direct and indirect impacts of WFP’s e-card programme on the Lebanese economy. It is part of a broader United Nations initiative to assess the economic impacts of humanitarian assistance in Lebanon. The e-card programme is an important element of the international humanitarian response for Syrian refugees. It is expected to transfer US$345 million to over one million vulnerable refugees in 2014, using a network of 300 contracted stores throughout Lebanon.
Specifically, this study provides: i) an assessment of programme performance; ii) an estimate of direct economic effects; and iii) an estimate of indirect economic effects. The findings of the study are based on quantitative and qualitative data analysis. The study was informed by interviews with government counterparts, United Nations agencies, donors, NGOs and academia. Data collected from participating retailers and the e-card transactions database was used to estimate direct economic impacts. The indirect economic impacts were assessed using an input-output model.
This study shows that the e-card offers a quick and efficient mechanism to deliver food assistance to beneficiaries. Transactions data shows that beneficiaries spend two thirds of their monthly e-card allocation within five days, confirming that e-card transfers circulate rapidly through the economy.
The e-card programme has had a large direct impact on participating stores, where revenue has doubled on average. It has created 1,300 jobs in participating stores and has led to US$3 million investments in capital expenditure, as larger stores have increased floor space and storage.
Generally, out of every dollar spent through the e-card 84 cents go towards purchasing goods; 5 cents for wages; 4 cents for operating costs; 1 cent for taxes; and 6 cents for profit. Large stores handle the majority of e-card transactions, and stores in Beirut face the highest operating costs.
3
Around 100 large stores seem to have captured the lion’s share of e-card transactions. There is evidence of high market concentration in over half of the districts. The price of a standard food basket in contracted stores in these districts appears to be slightly higher and more volatile than in districts with more competitive e-card markets.
The input-output model suggests the e-card programme has significant indirect economic benefits, with a multiplier value of 1.51 in the food products sector. This means that if WFP distributes the planned amount of US$345 million, it could create additional indirect benefits of US$517 million for the Lebanese food products sector. The impact on the agriculture sector is expected to be less because of its relatively small size in the Lebanese economy.
To get the most benefit from the programme, WFP should continue with value-based e-card vouchers. It should open additional stores in underserved areas and improve the criteria for store selection. WFP should monitor competition and open more stores in places where competition is at risk. Finally, inadequate assistance for shelter and non-food items has driven some refugees to sell e-card entitlements. More assistance in these sectors would allow the e-card holders to meet their food and non-food needs more effectively.
Assessment objectives and methodology
This study aims to estimate the economic benefits of the value-based electronic food voucher programme (e-card programme) implemented by the World Food Programme (WFP) for Syrian refugees in Lebanon. The study seeks to provide a clearer picture of how the programme functions, its impact on the local markets and its contribution towards localized direct and indirect economic benefits, thereby informing the future implementation of this type of programme.
The study employs a three-pronged approach. The first component assesses project performance in terms of market competitiveness and price formation. The second component estimates the direct effects of the e-card programme by analysing participating stores’ business models. The third component estimates the indirect sectoral multiplier effects of the programme using an input-output analysis.
Real-time transaction data from the e-card system has been used for the study, together with price data collected by WFP and partners, and data provided by government agencies. The mission1 also relied on focus groups and interviews conducted with refugees, retailers, market officials, NGOs and other key stakeholders.
Lebanon’s economy, the response to the Syria crisis and WFP’s e-card programme
Lebanon’s economy and the impact of the Syria crisis
The Lebanese economy is widely affected by the large influx of refugees and the economic spill-over of the Syrian crisis. The crisis has led to a sharp decline in real GDP growth, an increase in government expenditure, a surge in demand for public services (health, education and transportation) and high unemployment. Furthermore, heightened political instability and insecurity is affecting overall economic activity in the country2.

Acknowledgments
This report was prepared jointly by Jean-Martin Bauer, Susanna Sandström and Hiba Audi under the overall leadership of Arif Husain, Chief Economist and Deputy Director, Policy, Programme and Innovation, Analysis and Nutrition Service (WFP).
The authors acknowledge the contributions of Ekram El-Huni and Imad Osman-Saleh in ensuring and facilitating access to refugees, cooperating partners and supermarkets in Lebanon. They also acknowledge the support provided by the WFP sub-offices and the World Vision in organizing focus group discussions and field trips.
The authors thank the Lebanese Central Administration of Statistics, the Central Bank of Lebanon, The UNDP Project at the Ministry of Economy and Trade, Banque Libano-Française, NGO cooperating partners, donor agencies, the World Bank, fellow academics - Dr. Ali Chalak and Dr. Kanj Hamade - and UN sister agencies in Lebanon: United Nations Development Project, United Nations High Commissioner for Refugees and the Office for the Coordination of Humanitarian Affairs for providing the information and support needed to produce this report.
Comments on successive versions of this report were received from Marie Enlund and Syria regional emergency coordinator’s office.
Executive Summary
This study examines the direct and indirect impacts of WFP’s e-card programme on the Lebanese economy. It is part of a broader United Nations initiative to assess the economic impacts of humanitarian assistance in Lebanon. The e-card programme is an important element of the international humanitarian response for Syrian refugees. It is expected to transfer US$345 million to over one million vulnerable refugees in 2014, using a network of 300 contracted stores throughout Lebanon.
Specifically, this study provides: i) an assessment of programme performance; ii) an estimate of direct economic effects; and iii) an estimate of indirect economic effects. The findings of the study are based on quantitative and qualitative data analysis. The study was informed by interviews with government counterparts, United Nations agencies, donors, NGOs and academia. Data collected from participating retailers and the e-card transactions database was used to estimate direct economic impacts. The indirect economic impacts were assessed using an input-output model.
This study shows that the e-card offers a quick and efficient mechanism to deliver food assistance to beneficiaries. Transactions data shows that beneficiaries spend two thirds of their monthly e-card allocation within five days, confirming that e-card transfers circulate rapidly through the economy.
The e-card programme has had a large direct impact on participating stores, where revenue has doubled on average. It has created 1,300 jobs in participating stores and has led to US$3 million investments in capital expenditure, as larger stores have increased floor space and storage.
Generally, out of every dollar spent through the e-card 84 cents go towards purchasing goods; 5 cents for wages; 4 cents for operating costs; 1 cent for taxes; and 6 cents for profit. Large stores handle the majority of e-card transactions, and stores in Beirut face the highest operating costs.
4
Around 100 large stores seem to have captured the lion’s share of e-card transactions. There is evidence of high market concentration in over half of the districts. The price of a standard food basket in contracted stores in these districts appears to be slightly higher and more volatile than in districts with more competitive e-card markets.
The input-output model suggests the e-card programme has significant indirect economic benefits, with a multiplier value of 1.51 in the food products sector. This means that if WFP distributes the planned amount of US$345 million, it could create additional indirect benefits of US$517 million for the Lebanese food products sector. The impact on the agriculture sector is expected to be less because of its relatively small size in the Lebanese economy.
To get the most benefit from the programme, WFP should continue with value-based e-card vouchers. It should open additional stores in underserved areas and improve the criteria for store selection. WFP should monitor competition and open more stores in places where competition is at risk. Finally, inadequate assistance for shelter and non-food items has driven some refugees to sell e-card entitlements. More assistance in these sectors would allow the e-card holders to meet their food and non-food needs more effectively.
Assessment objectives and methodology
This study aims to estimate the economic benefits of the value-based electronic food voucher programme (e-card programme) implemented by the World Food Programme (WFP) for Syrian refugees in Lebanon. The study seeks to provide a clearer picture of how the programme functions, its impact on the local markets and its contribution towards localized direct and indirect economic benefits, thereby informing the future implementation of this type of programme.
The study employs a three-pronged approach. The first component assesses project performance in terms of market competitiveness and price formation. The second component estimates the direct effects of the e-card programme by analysing participating stores’ business models. The third component estimates the indirect sectoral multiplier effects of the programme using an input-output analysis.
Real-time transaction data from the e-card system has been used for the study, together with price data collected by WFP and partners, and data provided by government agencies. The mission1 also relied on focus groups and interviews conducted with refugees, retailers, market officials, NGOs and other key stakeholders.
Lebanon’s economy, the response to the Syria crisis and WFP’s e-card programme
Lebanon’s economy and the impact of the Syria crisis
The Lebanese economy is widely affected by the large influx of refugees and the economic spill-over of the Syrian crisis. The crisis has led to a sharp decline in real GDP growth, an increase in government expenditure, a surge in demand for public services (health, education and transportation) and high unemployment. Furthermore, heightened political instability and insecurity is affecting overall economic activity in the country2.
1 Jean-Martin Bauer (WFP HQ), Susanna Sandström (WFP HQ), and Hiba Audi (WFP Lebanon).2 World Bank. 2013. Lebanon Economic and Social Impact Assessment of the Syrian Conflict. Report No. 81098-LB.

In 2013, the real GDP growth rate was just 0.9 percent3, even lower than the 1.6 percent recorded in 2006 during the conflict with Israel4. The public debt to GDP ratio in 2013 was 141 percent, reversing the declining trend observed in previous years5. The Syrian crisis has had a particularly acute impact on the tourism and trade sectors. Lebanon’s economy is largely codependent on the Syrian economy because of the proximity of the two countries and their role as trading partners. The instability in Syria has spilled over to the service sector in Lebanon, especially tourism, with the number of international visitors steadily declining since 2010. The structurally weak labour market is also under stress from the refugee influx. According to the International Labour Organization, unemployment in Lebanon was more than 22 percent in 20136.
The international market as a key source of food supply
The Syrian crisis has also impacted food trade between Lebanon and Syria7. Lebanon is a net food importer that relies extensively on imports to meet its food consumption requirements: 85 percent of cereal requirements are imported8. The average aggregate grain consumption in the three years following the Syrian crisis (2011–2013) was 11 percent higher than the average of the preceding three years. Yet there has been no discernable domestic supply response to the increased demand caused by the influx of refugees. United States Department of Agriculture (USDA) data shows that even though aggregate cereal consumption has increased from 0.9 million mt a year (2004–2008) to 1.2 million mt a year, the supply side has not responded. National grain production has remained stagnant at just under 200,000 mt over the past decade (figure 1). Faced with an increase in aggregate food demand, Lebanon has mainly responded by increasing imports rather than production.
Wheat accounts for the bulk of grain imports, followed by rice and maize. According to FAO and the World Bank (2012), the Black Sea (Russia and Ukraine) region is a major exporter for Lebanon9. In 2013, trade flows fell, particularly for food products and consumer goods10.
5
Figure 1: Total cereal consumption, production and imports in Lebanon
Source: Authors’ calculations derived from USDA production, supply and distribution data (2014)
3 World Bank. 2014. Lebanon Economic Monitor. A sluggish economy in a highly volatile environment. Spring 2014.4 World Bank. 2014. GDP Growth (annual %). http://data.worldbank.org/indicator/NY.GDP.MKTP.KD.ZG/countries/LB-xq?display=graph5International Monetary Fund. 2014. Lebanon- 2014 Article IV Consultation Mission Concluding Statement.6 International Labour Organization. 2013. Global Employment Trends 2013. Recovering from a second jobs dip. 7 Ibid.8 USDA. 2014. Production, Supply and Distribution database (PSD): Cereal Lebanon.9 FAO & World Bank. 2012. The Grain Chain. 10 World Bank. 2013. Lebanon Economic and Social Impact Assessment of the Syrian Conflict. Report No. 81098-LB.

The value-based electronic food voucher programme (e-card programme)
Since May 2014, the United Nations High Commissioner for Refugees (UNHCR) has registered 1,029,778 Syrian refugees in Lebanon, and 58,188 individuals still await registration11. Given the large influx of refugees, the sixth edition of the UNHCR-led Regional Refugee Response Plan (RRP6) for 2014 appealed for US$1.7 billion funding for multi-sectoral assistance12. The RRP6 covers eight sectors: protection, food security, education, health, shelter, basic needs, social cohesion and livelihood response. The food security sector accounts for US$550 million, of which US$501 million is for food assistance to be provided by WFP13.
WFP started providing food assistance in June 2012 following a request from the Lebanese Government in May 2012. The e-card programme is WFP’s main method of assisting Syrian refugees in Lebanon. E-cards were adopted as the primary modality of assistance after establishing that local markets were elastic enough to meet increased demand without adversely affecting local supply and prices. E-cards account for 97 percent of WFP’s in-country portfolio: only newly arrived refugees receive one-off food parcels. Incidentally, this is also WFP’s largest voucher programme in the world.
In 2013, the WFP e-card programme injected over US$187 million into some of the poorest localities of the country hosting the highest refugee concentrations. Table 1 presents statistics on e-card distribution by the number of e-cards distributed by month and the total amount. The number of beneficiaries has steadily increased since the beginning of 2014, reaching 732,318 in May 2014. Thus far, the programme has distributed US$98.5 million as part of the plan to reach 1,125,000 beneficiaries and inject US$345.6 million into the Lebanese economy by the end of 2014.
WFP began moving from value-based paper vouchers to the electronic pre-paid e-card in September 2013. Families receive one e-card that is automatically charged with US$30 credit per person each month. The e-cards can then be redeemed in any of 300 small, medium and large stores spread across the country. In addition to allowing beneficiaries to purchase the food items of their choice, the automatic recharging of credit means that beneficiaries no longer have to attend large-scale monthly distributions, thereby avoiding transportation costs and waiting times.
6
Table 1: Number and amount (in US$) of e-cards distributed by month in 2014
Month e-cards Amount (US$)
553,535
620,408
669,774
708,091
732,318
16,606,050.00
18,612,240.00
20,093,220.00
21,242,730.00
21,969,540.00
January
February
March
April
May
11UNHCR. 2014. Syria Regional Refugee Response - Lebanon.12Ibid.13 UNHCR. 2014. Syria Regional Response Plan - RRP6. Funding status as at 26 May 2014.

E-cards also give beneficiaries purchasing flexibility by allowing purchases at multiple times, as opposed to the paper vouchers which had to be redeemed fully at one time. Furthermore, through the e-cards, merchants receive their payments promptly since stores, partners and WFP no longer need to manually collect and re-count the vouchers before payment. The modality also allows Syrian families to select their preferred food items, thereby meeting their individual consumption and nutritional needs more effectively. The e-card programme has thus helped to return some sense of normality to the lives of the refugees.
Since December 2013, e-card coverage was expanded to all parts of the country using a network of experienced NGOs. These include the Danish Refugee Council, World Vision International, Premiere Urgence-Aide Medical Internationale, Action Contre la Faim, Save the Children and INTERSOS. WFP is also working with the Ministry of Social Affairs and the World Bank to provide food assistance through e-cards to the most vulnerable Lebanese.
Project performance
Market analysis
Market competitiveness is determined by analysing the market share of e-cards, the number of participating stores by caza (district) and the average number of beneficiaries per store. Analysis by caza provides important insights into the spatial density of stores and market competition.
All stores participating in WFP’s e-card programme must meet certain conditions such as offering a preset menu of food items and clearly labelling prices. There are three categories of store contracted by WFP:
7
Large stores: These are typically supermarkets with a large variety of items and inventories. They are privately owned and not affiliated with international chains. They are registered with the Chamber of Commerce and are subject to taxes. In the first quarter of 2014, WFP contracted 94 large stores, which is a third of all stores contracted and represents 49 percent of all e-card programme transactions. Medium stores: These have relatively less variety of items and inventories, as well as smaller floor space compared to large stores. WFP contracted 133 medium stores during the first quarter of 2014, which is almost half of all stores contracted. Medium stores account for 36 percent of all e-card programme transactions. Small stores: These include neighbourhood stores known as ba’al’ that serve a local clientele who purchase smaller quantities but more frequently. They are run by self-employed owners and they pay fewer taxes than large stores. About 64 small stores were contracted by WFP in the first quarter of 2014, representing just 15 percent of all e-card programme transactions.
Insights on competition can be gained by analysing the concentration of stores and number of refugees per store. Excessive market concentration is generally a risk to competition as it makes collusion between stores easier. We have calculated the concentration ratio of the top three stores (CR3), that is, the amount of business garnered by the three largest firms. The higher the ratio, the more concentrated the market. A CR3 ratio of 0 to 50 percent is indicative of low concentration and a healthy degree of competition. A ratio between of 50 and 80 percent is indicative of an oligopoly, and anything above 80 percent is close to a monopoly.

We used the e-card transaction database to calculate the CR3 ratio by caza. On average, the CR3 ratio is 73 percent, meaning that the top three stores in each caza capture 73 percent of e-card sales. This suggests that the e-card business is generally oligopolistic. There are, however, important geographic disparities in the CR3 (figure 2). Of the 26 cazas, 13 can be termed ‘oligopolistic to monopolistic’ as over 80 percent of the business is captured by three stores. A further 8 cazas are oligopolies, while the remaining 5 cazas show a low degree of concentration. This means that only one fifth of the districts have competitive voucher markets. The cazas with the lowest CR3 and an acceptable degree of competition are those with over 20 stores. There is no relationship between CR3 and store size: small, medium and large stores are present in all types of market regardless of the degree of concentration.
8
Figure 2: Map of CR3 ratio (Jan–April 2014)
Figure 3: Number of e-card beneficiaries per store
Our analysis revealed an average 2,000 registered e-card beneficiaries for each participating store. However, some important geographic differences exist (figure 3). In five cazas14, there are more than 4,000 registered beneficiaries per store — twice the programme average. That is an indication of low store density, meaning that beneficiaries may have to travel longer distances to reach a store or they may have less choice than in cazas with better store coverage. Three of these cazas have mostly large stores, but the other two have a mix of store types. This suggests that all types of cazas – not just those with large stores - have a high number of refugees per store.
The analysis found that the cazas of Aley, Koura and Minnieh-Dannie have concentrated e-card markets and a very high number of beneficiaries per store. WFP should consider opening additional stores in these cazas to increase beneficiary choice and limit the risk of non-competitive market outcomes.
14 Aaley, Baabda, Koura, Minieh-Dannieh and Saida.
Source: WFP transactions data
Source: WFP transactions data

Price trends
In this section, we compare the prices in WFP stores with general food price development and with a sample of non-participating stores15. The comparisons are based on the prices of the WFP food basket items used to calculate the food voucher value16. We also study price trends in WFP-contracted shops based on the competitiveness of the markets. Finally, we compare the prices by store size.
The price of the WFP’s food basket has increased by 13.7 percent since June 2013, compared to a 6.6 percent increase in the consumer price index for food and non-alcoholic beverages (figure 4)17. There are no major price differences between the value of the WFP basket in contracted versus non-contracted stores in the Bekaa Valley region (figure 5). The average value of the food basket in WFP-contracted stores between June 2013 and March 2014 was US$30.80, and in non-contracted stores, US$30.60.
Figure 4: WFP food voucher price index and the consumer price index (CPI) for food and non-alcoholic beverages in Lebanon
Figure 5: Food basket price in WFP-contracted and non-contracted stores (Bekaa Region)
Source: WFP price database and the Central Administration of Statistics (2014)
Note: June–July 2013 based on an average sample of 125 non-contracted stores andJanuary–April 2014 on an average of 217 non-contracted stores. The average sample sizefor the contracted stores is 69
Source: WFP price database and price datasets from INTERSOS, IRC, Care and Solidarité
9
15 These results should be taken as merely indicative because the price data is of poor quality and is not based on representative samples. 16The WFP voucher value is based on a monthly ration per person of 6 kg of rice, 3.9 kg of bulgur, 1.5 kg of pasta, 1.5 kg of white beans, 1.5 kg of sugar, 0.9 litres of sunflower oil, 0.3 kg of salt and 1.2 kg of canned meat, plus 10 percent of the calculated price for dairy and vegetables. This basket provides 2,100 kcal per person per day.17June 2013 is chosen as the base month since no consumer price data is available for the period January 2013 to May 2013.

Figure 6: Comparison of the value of the WFP food basket in WFP-contracted stores in competitive versus non-competitive markets (CR3>50)
Note: Based on a sample of 28 stores in non-competitive markets and 85 stores incompetitive markets
Source: WFP price database
Comparing the value of the WFP basket in WFP-contracted stores in competitive versus non-competitive voucher markets (as defined by CR3>50), we found an average voucher value of US$29.90 on competitive markets versus US$31.90 on non-competitive markets: an average difference of 6.3 percent (figure 6)18. In addition to market structure, many other factors may drive these results, such as regional price differences. However, even excluding expensive cazas such as Beirut and surroundings, price differences still seem to persist. Further investigation and better data is needed to understand the drivers of these trends.
Prices on the competitive market seem to have been increasing recently. If this is the case, the difference between the two markets will be smaller. Yet while the spikier curve of the non-competitive markets is a consequence of a smaller sample size (because of the smaller number of stores), it also reflects the risks of non-competitive markets: not only higher prices in general, but also the risk of price spikes.
As figure 7 shows, the price of a standard food basket tends to be higher in small stores compared to medium and large stores. While the price of the average food basket was relatively similar in large stores (USD$30.20) and medium stores (US$29.98), it was noticeably higher in small stores (USD$31.30). Lower prices in medium and large stores may be attributed to economies of scale. Although the monthly e-card allocation of US$30 is enough on average to cover the food basket in medium and large stores, it falls slightly short of covering the cost of the same basket in small stores.The results of the price analysis suggest that WFP should continue to follow price development closely. Rather than controlling prices, which will only lead to market distortions, a more appropriate solution would be to increase the number of stores in selected areas in order to increase competition.
10
18 The difference is statistically significant in some months.

Figure 7: Price of WFP food basket by store size
Direct economic impacts of the e-card programme
How participating retailers use e-card income
In order to assess the direct impacts of the e-card programme, focus group discussions were held with retailers representing large, medium and small stores in different parts of the country. In order to capture location-specific issues, the same exercise was repeated in Tripoli, the Bekaa Valley, Beirut and south Lebanon. Retailers were interviewed separately to ensure confidentiality. Considering the qualitative nature of this exercise, the estimates are midpoints rather than point estimates.
According to the focus group discussions, the e-card programme has significantly impacted retail business in the country. Store owners reported that on average their sales have more than doubled since they joined the programme; the highest increases were reported by retailers in the Bekaa Valley. Medium stores seem to have increased their turnover the most — sometimes tripling their business, while small stores reported much smaller gains. Often small stores lack the capital to expand in order to capture a larger share of the programme.
The increase in sales has led retailers to hire more staff. Small stores have increased their staff from one or two employees before the programme to an average of four. Medium stores have typically increased their staff from three to six employees, and large stores from an average of twelve to twenty employees.
Figure 8 shows how participating stores generally explain the revenue breakdown from e-card sales. The figures that follow vary geographically and by store size.
11
WFP/ Sandy Maroun
Cost of goods sold – 0.84 cents. The lion’s share of e-card sales revenue is used to purchase the food items sold to beneficiaries. While most of these items are imported, traders do carry fresh produce from Lebanon such as potatoes, eggs, poultry and onions. Focus group discussions indicated that retailers were responsive to Syrian demand, for example by purchasing Syrian brands. If the e-card programme distributes US$345 million in 2014 as planned, US$290 million will be spent by retailers to purchase food.
Wages – 0.05 cents. Retailers’ second largest expense is wages, which will total US$17 million and mostly accrue to Lebanese workers and a few Syrian employees. Operating costs – 0.04 cents. This covers rent, utilities and insurance costs. Focus group discussions show that medium and small stores pay more in operating costs than large stores thanks to economies of scale. Also, stores in affluent areas have higher operating costs because rents are higher. An estimated US$14 million will be spent on operating costs if the e-card programme transfers US$345 million in 2014.
Taxes – 0.01 cents. Large and medium stores are subject to value-added tax and a municipal fee. Small stores just pay a nominal, flat municipal registration fee. The difference in tax exposure allows small stores to compete in the market. If fully implemented in 2014, the e-card programme will generate US$3-3.5 million in additional taxes for various local and central government authorities. Perhaps unsurprisingly, stores located in Beirut pay more taxes than those located outside the capital.
Profit – 0.06 cents. Medium stores seem to have higher margins than small or large stores. The focus group discussions showed that the stores in the north seem less profitable than those in the rest of the country; the high level of insecurity there makes it more expensive to deliver goods.
12
Figure 8: Average distribution of one dollar of e-card revenue by retailers
Source: Trader focus group discussions

To meet the increased demand from refugees, many contracted stores have undertaken capital investments to expand floor space, increase storage capacity or purchase equipment such as freezers. The focus group interviews suggest that participating stores have invested US$3.6 million in additional capital expenditures. Over two thirds of this investment has been made by large stores — about US$25,000 per store. Medium stores have spent an average of US$6,000 per store. Small retailers, who account for a quarter of all outlets, have invested US$5,000 per store. The small stores make up 9 percent of total overall capital expenditure associated with the programme.
The e-card programme has created employment. Staff levels in participating retail stores have risen from 1,700 to 3,000 since the start of the programme. Overall, same-store employment increased by 74 percent in participating stores. The staff levels rose much more in small and medium stores than in large stores. More specifically, smaller stores responded to the increased demand by spending more on labour, while larger stores invested more in capital.
In the aggregate, food markets in Lebanon are generally responsive and have adjusted well to the increased demand. The programme has played a part in supporting the supply chain in high-risk areas of the country that face insecurity and high refugee concentrations. Retailers in these areas operate in a very risky environment that has been further disrupted by the Syrian crisis. The e-card programme has helped stabilize refugee demand and has encouraged contracted retailers to invest and recruit under clear rules of business. This suggests that by opting for an e-card programme, WFP has had a positive effect on the integrity of the food supply chain in some high-risk areas. The e-card programme also avoids the risk of transferring funds to remote or highly insecure areas of the country where private banks do not operate.
How quickly do beneficiaries spend their e-card allocations?
E-card transaction records were analysed to understand how quickly beneficiaries spend their entitlements. The data shows that beneficiaries spend 60 percent of their e-card credit within the first 5 days and 80 percent within the first 10 days (figure 9).
Source: WFP transactions data
Figure 9: Cumulative share of monthly sales (January–April 2014)
13
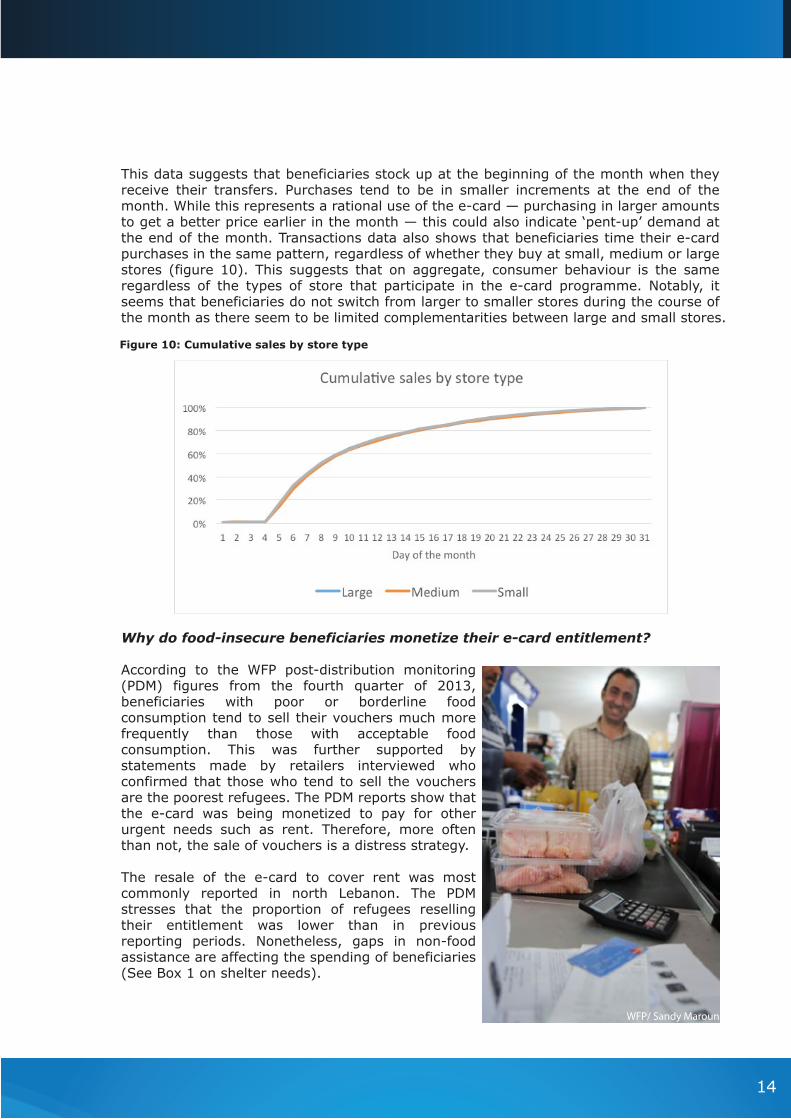
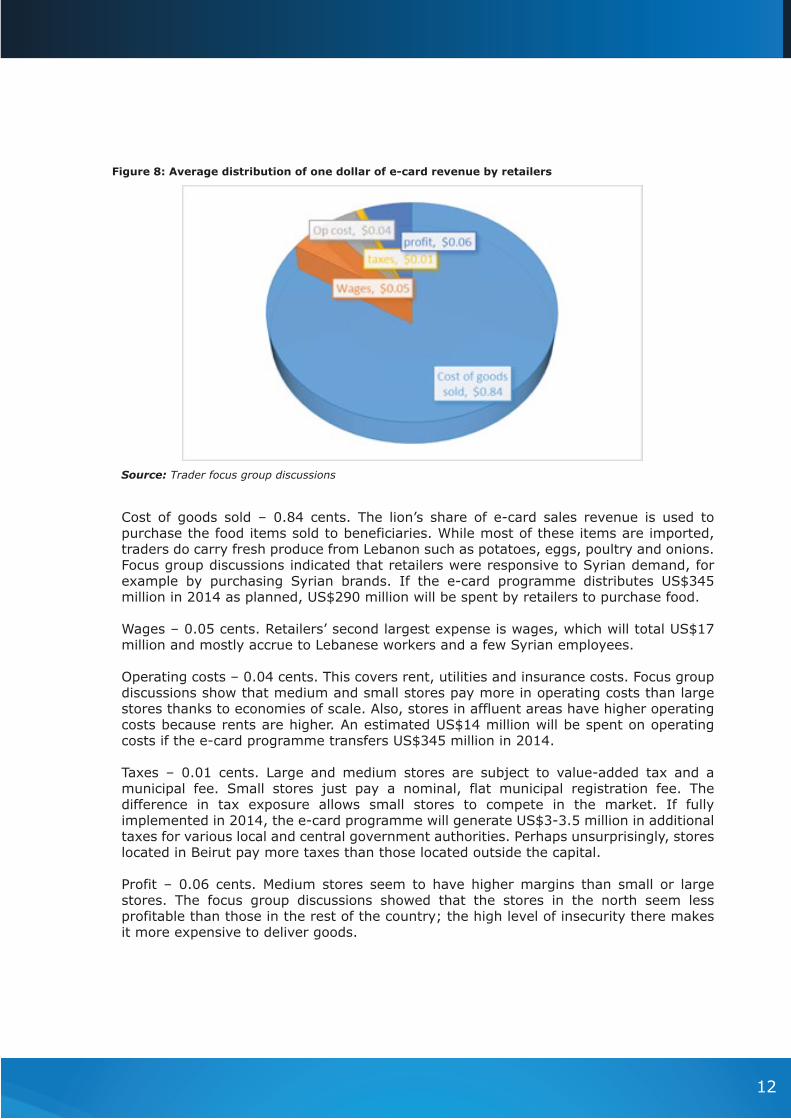
Figure 10: Cumulative sales by store type
This data suggests that beneficiaries stock up at the beginning of the month when they receive their transfers. Purchases tend to be in smaller increments at the end of the month. While this represents a rational use of the e-card — purchasing in larger amounts to get a better price earlier in the month — this could also indicate ‘pent-up’ demand at the end of the month. Transactions data also shows that beneficiaries time their e-card purchases in the same pattern, regardless of whether they buy at small, medium or large stores (figure 10). This suggests that on aggregate, consumer behaviour is the same regardless of the types of store that participate in the e-card programme. Notably, it seems that beneficiaries do not switch from larger to smaller stores during the course of the month as there seem to be limited complementarities between large and small stores.
Why do food-insecure beneficiaries monetize their e-card entitlement?
According to the WFP post-distribution monitoring (PDM) figures from the fourth quarter of 2013, beneficiaries with poor or borderline food consumption tend to sell their vouchers much more frequently than those with acceptable food consumption. This was further supported by statements made by retailers interviewed who confirmed that those who tend to sell the vouchers are the poorest refugees. The PDM reports show that the e-card was being monetized to pay for other urgent needs such as rent. Therefore, more often than not, the sale of vouchers is a distress strategy.
The resale of the e-card to cover rent was most commonly reported in north Lebanon. The PDM stresses that the proportion of refugees reselling their entitlement was lower than in previous reporting periods. Nonetheless, gaps in non-food assistance are affecting the spending of beneficiaries (See Box 1 on shelter needs).
14
WFP/ Sandy Maroun
Box 1: The shelter gap
According to the latest UNHCR shelter assessment published in April 2014, the need for shelter is high and increasing among the Syrian refugee population. More Syrian families are now living in substandard accommodation because of high rental costs and inelastic supply on the rental market.
The assessment found that 41 percent of refugees reside with other families; almost half share their accommodation with two other families. Around 12 percent of refugee families have no other option than to reside in used garages, work sites or one-room structures.
The assessment indicated that the number of refugees living in apartments has fallen from 65 percent to 57 percent since August 2013. The number living in informal settlements increased from 12.7 percent in August 2013 to 16 percent in April 2014, reflecting the unavailability of proper housing as more and more refugees enter Lebanon.
The RRP6 has allocated funds for refugee shelter. Since 2012, according to UNHCR, 78,481 people have benefited from cash-for-shelter assistance, which has targeted the most vulnerable families. While these funds have covered the shelter needs of some families, there is still a large gap in shelter assistance.
On the other hand, some beneficiaries sell their e-card entitlement to purchase other types of food or to shop at more convenient non-contracted stores. When contracted stores are too far away, some beneficiaries will monetize the e-card to purchase food from somewhere closer. Therefore, a better geographic distribution of contracted stores will also help to reduce the monetization of the e-card. WFP is working on expanding its network of contracted stores in order to cater for refugee needs.
Focus group interviews with refugees also suggest that protection issues can lead to beneficiaries being deprived of their e-cards. Retailers reported that some community leaders are able to accumulate a large number of e-cards and redeem them. This phenomenon is linked to the broader protection issues facing Syrian refugees in Lebanon.
Beneficiary inclusion error may also explain why some beneficiaries resell their e-card balances. Indeed, a small minority of registered beneficiaries consider the time value of money more important than its actual value in food. For such individuals, reselling the e-card balance at a discount of 15 to 20 percent is a rational decision. UNHCR, WFP and others have continuously invested in vulnerability assessments that have minimized inclusion error to ensure that the bulk of assistance targets the most vulnerable. In practice, however, targeting comes at a cost. Achieving zero inclusion error is neither feasible nor desirable: if the cost of targeting exceeds the value of the ration, it is probably more efficient simply to provide a ration. This means that a limited number of non-vulnerable refugees will continue to receive e-card allocations that might be sold.
WFP has strengthened its monitoring to the point where retailers are very reluctant to monetize or exchange e-cards. The risk has therefore been transferred to beneficiaries, who may lose their cards or end up going through intermediaries.
15

Source: Central Administration of Statistics, 2013
Table 2: Sectoral inputs to the food sector (Lebanese Pounds, billion)
Indirect impacts
Analysis of indirect effects: input-output model
The indirect effects of value-based food vouchers on the Lebanese economy have been estimated using an input-output table produced by the Central Administration of Statistics for 2011. These tables outline the relationship between different sectors of the Lebanese economy, showing how much of one good is needed to produce another. This allows us to analyse the links between sectors and to estimate the inter-sectoral effects. For the e-card programme, we have analysed the food sector and its links with other relevant sectors to determine the multiplier effects.
We used a 26 by 26 matrix to give a clearer description of the predictive multipliers for the sectors covered by the e-card programme. Table 2 outlines the main contributors to the food sector in Lebanon.
16
Inputs tofood
products
Totalindustryoutput
Agriculture, livestock & fishing
Mining & quarrying
Manufacture of food products
Manufacture of beverages & tobacco
Manufacture of textiles, clothing & leather
Manufacture of wood & paper products; printing
Manufacture of petroleum, chemicals, rubber & plastics
Manufacture of other non-metallic mineral products
Manufacture of metal products, machinery & equipment
Furniture & other manufacturing
Electricity
Water supply; sewerage, waste management, etc.
Construction
Commercial trade & motor vehicle repairs
Transport
Accommodation & food service activities
Information & communication
Financial & insurance activities
Real estate activities
Professional, scientific & technical activities
Administrative & support service activities
Public administration & international activities
Education
Human health & social work activities
Personal service activities
Total intermediate inputs
1,928
6
471
17
1
36
132
34
12
47
9
11
14
35
4
32
113
117
71
68
2
1
1
7
3,193
3,094
448
4,084
1,048
827
1,313
1,638
1,936
4,053
962
5,037
1,162
11,359
15,733
3,684
3,811
3,410
6,058
10,181
4,859
3,248
6,167
5,212
3,583
2,714
105,621
Sector
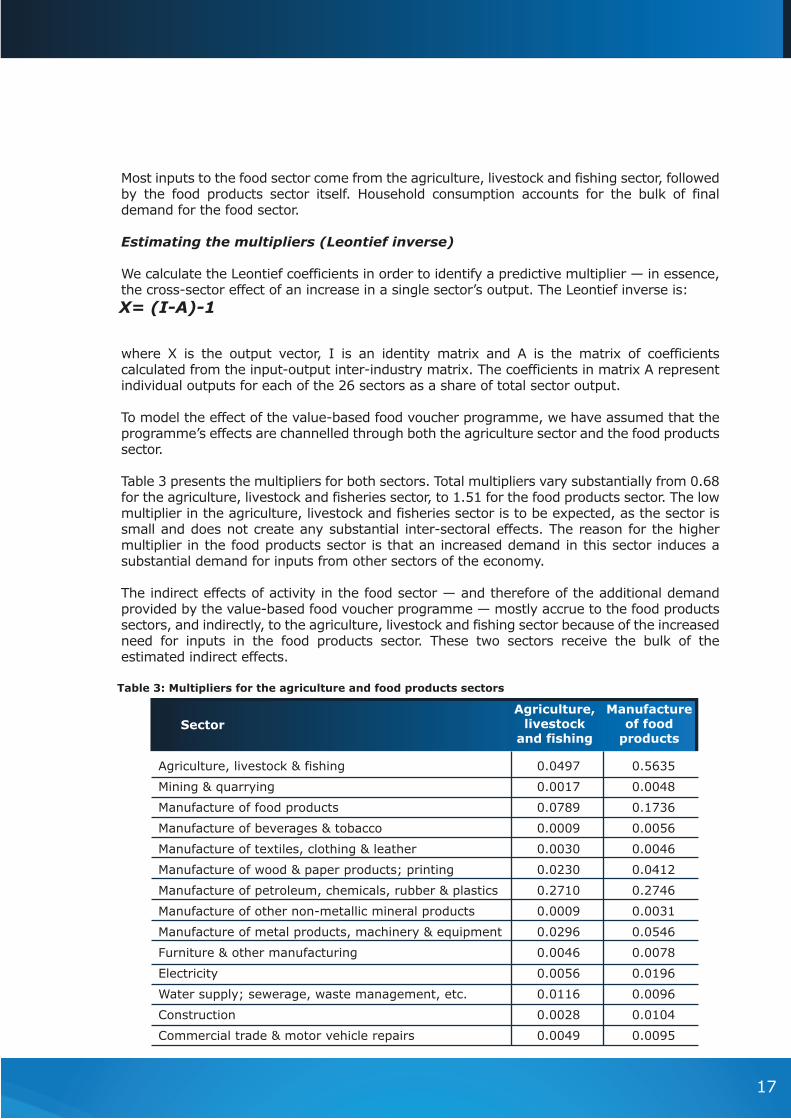
Table 3: Multipliers for the agriculture and food products sectors
Most inputs to the food sector come from the agriculture, livestock and fishing sector, followed by the food products sector itself. Household consumption accounts for the bulk of final demand for the food sector.
Estimating the multipliers (Leontief inverse)
We calculate the Leontief coefficients in order to identify a predictive multiplier — in essence, the cross-sector effect of an increase in a single sector’s output. The Leontief inverse is:
where X is the output vector, I is an identity matrix and A is the matrix of coefficients calculated from the input-output inter-industry matrix. The coefficients in matrix A represent individual outputs for each of the 26 sectors as a share of total sector output.
To model the effect of the value-based food voucher programme, we have assumed that the programme’s effects are channelled through both the agriculture sector and the food products sector.
Table 3 presents the multipliers for both sectors. Total multipliers vary substantially from 0.68 for the agriculture, livestock and fisheries sector, to 1.51 for the food products sector. The low multiplier in the agriculture, livestock and fisheries sector is to be expected, as the sector is small and does not create any substantial inter-sectoral effects. The reason for the higher multiplier in the food products sector is that an increased demand in this sector induces a substantial demand for inputs from other sectors of the economy.
The indirect effects of activity in the food sector — and therefore of the additional demand provided by the value-based food voucher programme — mostly accrue to the food products sectors, and indirectly, to the agriculture, livestock and fishing sector because of the increased need for inputs in the food products sector. These two sectors receive the bulk of the estimated indirect effects.
17
X= (I-A)-1
Agriculture,livestock
and fishing
Manufactureof food
products
Agriculture, livestock & fishing
Mining & quarrying
Manufacture of food products
Manufacture of beverages & tobacco
Manufacture of textiles, clothing & leather
Manufacture of wood & paper products; printing
Manufacture of petroleum, chemicals, rubber & plastics
Manufacture of other non-metallic mineral products
Manufacture of metal products, machinery & equipment
Furniture & other manufacturing
Electricity
Water supply; sewerage, waste management, etc.
Construction
Commercial trade & motor vehicle repairs
0.0497
0.0017
0.0789
0.0009
0.0030
0.0230
0.2710
0.0009
0.0296
0.0046
0.0056
0.0116
0.0028
0.0049
0.5635
0.0048
0.1736
0.0056
0.0046
0.0412
0.2746
0.0031
0.0546
0.0078
0.0196
0.0096
0.0104
0.0095
Sector

Source: authors, derived from Central Administration of Statistics data, 2013
Conclusions and recommendationsConclusions
The direct effects of the e-card programme are large. It is estimated that the programme has created 1,300 jobs and resulted in over US$3.6 million of investments in contracted stores, mostly by large retailers.
The analysis of indirect economic effects shows that for each dollar spent through the e-card programme, additional benefits worth US$1.50 accrue to the Lebanese economy. This means that a planned voucher transfer of US$345 million in 2014 will result in as much as US$517 million in indirect benefits. These benefits will mostly accrue to Lebanon’s vibrant food products sector. Similar multiplier effects were observed in a recently conducted study in Jordan. 19These results show that in addition to saving lives, WFP’s emergency assistance is also helping to mitigate some of the social impacts documented in the World Bank’s Economic and Social Impact Assessment of the Syrian conflict.
The indirect impacts on the agriculture sector are more limited, because the sector is small and has a limited capacity to respond to higher prices or increased demand from the refugees. Although it may be tempting to ask retailers to buy more Lebanese agricultural produce — thereby benefiting agriculture sector — the very low multipliers suggest that doing so would be counterproductive and would only reduce the much higher multiplier obtained in the food products sector.
The programme benefits are concentrated in the hands of a small number of actors, especially the 100 large stores that account for the majority of e-card turnover. This raises the question of WFP picking ‘winners and losers’ when it selects stores to participate in the programme. Market monitoring shows that in areas with low store density, the price of the food basket tends to be slightly higher and more volatile than in other areas. WFP’s approach to store selection should therefore aim to promote competitive markets, thereby ensuring stable prices and the appropriate selection, quality and quantity of products available to the beneficiaries. Specifically, more stores should be opened in underserved cazas and access to the e-card market should be opened up. WFP should also refrain from setting prices for goods in the stores and should allow beneficiaries to shop for the best bargains.
18
Agriculture,livestock
and fishing
Manufactureof food
products
Transport
Accommodation & food service activities
Information & communication
Financial & insurance activities
Real estate activities
Professional, scientific & technical activities
Administrative & support service activities
Public administration & international activities
Education
Human health & social work activities
Personal service activities
Total
0.0265
0.0029
0.0363
0.0450
0.0102
0.0386
0.0214
0.0014
0.0004
0.0002
0.0028
0.6739
0.0380
0.0054
0.0489
0.0711
0.0454
0.0616
0.0453
0.0020
0.0009
0.0004
0.0056
1.5070
Sector
19 Husain A., Bauer, J.M., & Sandström, S. 2014. Economic impact study: Direct and indirect impact of the WFP food voucher programme in Jordan. Rome, Italy, WFP.

The emphasis placed on small stores and the exclusion of large supermarket chains deserves reconsideration. Small stores are almost a quarter of all contracted stores yet they only account for 15 percent of the e-card revenue; they have higher prices, offer less consumer choice and represent a relatively large monitoring burden. WFP has not contracted international supermarket chains in Lebanon under the e-card programme. It may be advantageous to work with these large stores to deliver the WFP food basket at more competitive prices. WFP is currently developing a new strategy for contracting stores in Lebanon. This strategy will re-evaluate the contracting of international supermarket chains.
Post-distribution monitoring reports show that the most vulnerable refugees are reselling a portion of their e-card entitlement to cover for other urgent needs. More assistance in non-food sectors, especially for shelter and non-food items, and increasing the number of contracted stores is needed to limit the incentives to monetize the e-cards.
It is clear that the retail food sector in Lebanon is remarkably resilient and capable of adjusting to substantially increased demand from the refugees. The arrival of Syrian refugees has increased the population of Lebanon by 30 percent, yet even the short-term inflationary pressures in the food sector have remained reasonable. This confirms that a value-based voucher programme supported by stronger, more responsive supply chains tends to limit inflation under increased demand. Retailers highlighted the importance of knowing changes in demand in advance as this gives them the time and confidence to expand operations systematically. This is probably the biggest advantage of value-based vouchers over cash interventions, particularly when demand shifts are large and when tensions between the refugee and host populations could be fuelled by price rises in essential goods.
Recommendations
The overarching recommendation would be to promote beneficiary choice and minimize market distortions.
Recommendation 1: Promote value-based vouchers. Like cash, value-based vouchers are an income transfer. Yet they are more market friendly because they minimize uncertainty for both retailers and consumers. Vouchers give retailers the time and confidence to expand operations to ensure that excess refugee demand is met systematically with more choice, good quality and competitive prices and without creating inflationary pressures for refugees and residents.
Recommendation 2: Promote competition by opening more stores. WFP should add more stores in underserved areas and/or where there is evidence of excessive market concentration. Priority areas include the cazas of Aaley, Baabda, Koura, Minieh-Dannieh and Saida, where the number of refugees per store is well above the programme average. The 13 cazas with highly concentrated market structures should be prioritized for new stores. As a rule of thumb, there should be at least 20 stores in each caza in order to achieve an acceptable level of competition between stores. In the future, WFP should monitor concentration ratios by caza to determine whether additional stores should be opened.
Recommendation 3: Explore potential efficiency gains by contracting large supermarket chains. WFP should consider working with large supermarket chains, in order to realize economies of scale and provide beneficiaries with more choice at lower prices. Consequently, WFP might be able to obtain discounts from large stores considering the amount of new business that the e-cards are generating.
19

20
Recommendation 4: Raise awareness on lack of funds for food and non-food assistance. Gaps in non-food assistance are creating incentives for many refugee households to monetize their e-cards. The issue of shelter in north Lebanon is particularly important and deserves urgent attention.
Recommendation 5: Improve information systems. The disparate nature of price data collection by humanitarian agencies operating in Lebanon makes it difficult to understand what impacts the e-card or other programmes are having on the market. Information must be collected using common methodologies and formats so agencies and the government can monitor programme outcomes more effectively. An open-access market data commons should be created to help participating agencies share information. An inventory tracking system could also be set up in stores to improve how we monitor sales through the e-card programme.
Key references
Central Administration of Statistics. 2013. Lebanon National Accounts 2011. Lebanon.
FAO & World Bank. 2012. The Grain Chain. Retrieved from: http://www.fao.org/fileadmin/user_upload/tci/docs/The%20Grain%20Chain_ENG.pdf
Husain A., Bauer, J.M., & Sandström, S. 2014. Economic impact study: Direct and indirect impact of the WFP food voucher programme in Jordan. Rome, Italy, WFP.
International Labour Organization. 2013. Global Employment Trends 2013. Recovering from a second jobs dip.
International Monetary Fund. 2014. Lebanon – 2014 Article IV Consultation Mission: Concluding Statement. Retrieved from: http://www.imf.org/external/np/ms/2014/050914.htm
UNHCR. 2014. Syria Regional Refugee Response - Lebanon. Retrieved from: http://data.unhcr.org/syrianrefugees/country.php?id=122
UNHCR. 2014. Syria Regional Response Plan - RRP6. Funding status as at 26 May 2014. Retrieved from: http://data.unhcr.org/syrianrefugees/documents.php?page=1&view=grid
United States Department of Agriculture. 2014. PSD Cereal Lebanon. Foreign Agricultural Service.
World Bank. 2013. Lebanon: Economic and Social Impact Assessment of the Syrian Conflict. Report No. 81098-LB. Retrieved from: http://www-wds.worldbank.org/external/default/WDSContentServer/WDSP/IB/2013/09/24/000333037_20130924111238/Rendered/PDF/810980LB0box379831B00P14754500PUBLIC0.pdf
World Bank. 2014. Lebanon Economic Monitor. A sluggish economy in a highly volatile environment. Spring 2014.

For more information, contact:
Arif HusainChief Economist and Deputy Director, Policy, Programmeand Innovation Division - Analysis and Nutrition Service
World Food ProgrammeVia Cesare Giulio Viola, 68/70 - 00148 Rome, Italy
www.wfp.org/food-security