Conveyor Chain - Products and Sizes - Renold plc - Manufacturer of
Annual Report 2016/17Dipped Products PLC
For the latest financialinformation, refer to ourinvestor relations pagewww.dpl.com/reporting
Introductory Information3 About this Report
4 An Overview of our Company
5 Group Structure
6 Market Reach
7 Awards and Accolades
8 Performance Highlights
10 Our Value Addition in 2016/17
Our Leadership14 Joint Letter from the Chairman
& Managing Director
18 Board of Directors
20 Management Team
Stewardship and Governance 24 Value Creation Model
26 Stakeholder Engagement
27 Contextual Trends
32 Our Material Issues
34 Managing Risk
36 Strategic Framework
38 Our Commitment to the Sustainable Development Goals
42 Operational Review
45 Value Creation Against Our Capitals
69 Corporate Governance
88 Related Party Transactions Review Committee Report
Contents89 Audit Committee
91 Annual Report of the
Board of Directors on the Affairs of the
Company
95 Statement of Directors’ Responsibilities
Financial Statements96 Financial Calendar
98 Independent Auditors Report
99 Statements of Profit or Loss
100 Statements of Comprehensive Income
101 Statements of Financial Position
102 Statements of Changes in Equity
104 Statements of Cash Flows
106 Notes to the Financial Statements
168 Decade at a Glance
170 The Share
174 Group Structure
176 Glossary
177 GRI Content Index Tool
181 Notice of Meeting
182 Notes
183 Form of Proxy
IBC Corporate Information
A simple word, yet one that means so much. At Dipped Products we have always celebrated a spirit of affirmation, of positivity, of willingness to think, to work, to commit to the goals
we want to achieve.
As a very successful manufacturing company and leader in our field, we want to share the value we create, to understand people's hopes and dreams
and play our part in making those dreams come true.
We also want to understand and resolve the needs of our time, improving lives and enabling access to better health and education in the social
responsibility work we do with the many communities we impact.
Because we care about creating meaningful value for all our stakeholders, as we strive to be a company that is active, supportive, responsive….
and affirmative.

AffirmativeDipped Products PLC / Annual Report 2016/17
InnovationInnovation is critical in catering to the rapidly changing requirements and preferences of our market. Our dedicated R&D team persistentlymonitors emerging trends and harness research capabilities to develop new products and applications.
ProductsIn Hand Protection, we manufacture over 300 variants of 124 productvarieties of supported and unsupported household, industrial, medical and value-added gloves with numerous applications. InPlantations, we produce over more than 12,000 MT and 3,000 MT of tea and rubber respectively, both of which are renowned for superior quality and command premium pricing at the auctions.
MarketsIn Hand Protection, our products are sold in over 70 countries world-wide. We have developed long-standing relationships with our customers, underpinned by superior quality of our products and a high level of responsiveness. Our tea and rubber produce is exported to over 50 countries world-wide.
DPL is a fully integrated rubber glove manufacturer producing a continuing stream of high value new product innovations in protective hand wear that are renowned for their quality and performance.
We service up to 5 percent demand for household and industrial gloves in developed and emerging markets worldwide, and are ranked among the world’s largest manufacturers in the hand protection industry. Our experience and expertise over the past 4 decades - combined with continuous product development based on our customers’ expectations, preferences and inputs - have clearly differentiated us in the market as a supplier of natural and synthetic latex based domestic, industrial and medical gloves.
3Affirmative Dipped Products PLC / Annual Report 2016/17
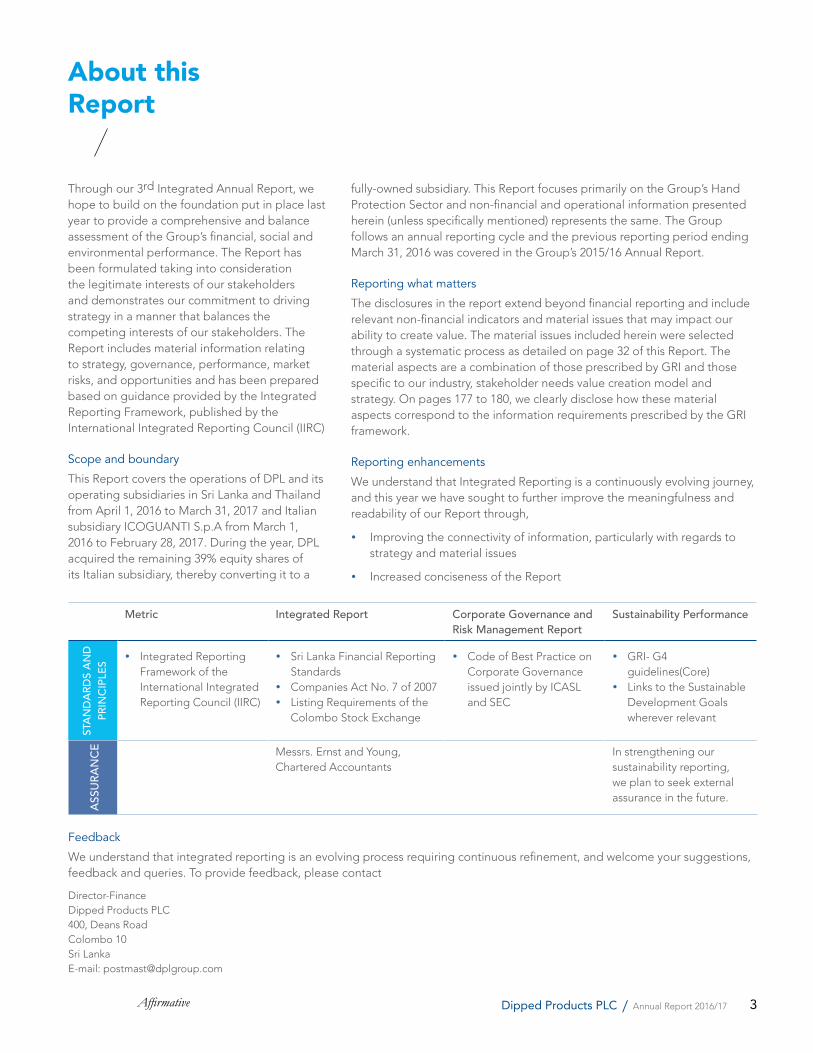
About this Report
Through our 3rd Integrated Annual Report, we hope to build on the foundation put in place last year to provide a comprehensive and balance assessment of the Group’s financial, social and environmental performance. The Report has been formulated taking into consideration the legitimate interests of our stakeholders and demonstrates our commitment to driving strategy in a manner that balances the competing interests of our stakeholders. The Report includes material information relating to strategy, governance, performance, market risks, and opportunities and has been prepared based on guidance provided by the Integrated Reporting Framework, published by the International Integrated Reporting Council (IIRC)
Scope and boundary
This Report covers the operations of DPL and its operating subsidiaries in Sri Lanka and Thailand from April 1, 2016 to March 31, 2017 and Italian subsidiary ICOGUANTI S.p.A from March 1, 2016 to February 28, 2017. During the year, DPL acquired the remaining 39% equity shares of its Italian subsidiary, thereby converting it to a
Feedback
We understand that integrated reporting is an evolving process requiring continuous refinement, and welcome your suggestions, feedback and queries. To provide feedback, please contact
Director-FinanceDipped Products PLC400, Deans RoadColombo 10Sri LankaE-mail: [email protected]
fully-owned subsidiary. This Report focuses primarily on the Group’s Hand Protection Sector and non-financial and operational information presented herein (unless specifically mentioned) represents the same. The Group follows an annual reporting cycle and the previous reporting period ending March 31, 2016 was covered in the Group’s 2015/16 Annual Report.
Reporting what matters
The disclosures in the report extend beyond financial reporting and include relevant non-financial indicators and material issues that may impact our ability to create value. The material issues included herein were selected through a systematic process as detailed on page 32 of this Report. The material aspects are a combination of those prescribed by GRI and those specific to our industry, stakeholder needs value creation model and strategy. On pages 177 to 180, we clearly disclose how these material aspects correspond to the information requirements prescribed by the GRI framework.
Reporting enhancements
We understand that Integrated Reporting is a continuously evolving journey, and this year we have sought to further improve the meaningfulness and readability of our Report through,
Improving the connectivity of information, particularly with regards to strategy and material issues
Increased conciseness of the Report
Metric Integrated Report Corporate Governance and Risk Management Report
Sustainability Performance
STAN
DARD
S AN
D PR
INCI
PLES
Integrated Reporting Framework of the International Integrated Reporting Council (IIRC)
Sri Lanka Financial Reporting Standards
Companies Act No. 7 of 2007 Listing Requirements of the
Colombo Stock Exchange
Code of Best Practice on Corporate Governance issued jointly by ICASL and SEC
GRI- G4 guidelines(Core)
Links to the Sustainable Development Goals wherever relevant
ASSU
RANC
E Messrs. Ernst and Young, Chartered Accountants
In strengthening our sustainability reporting, we plan to seek external assurance in the future.
4 AffirmativeDipped Products PLC / Annual Report 2016/17
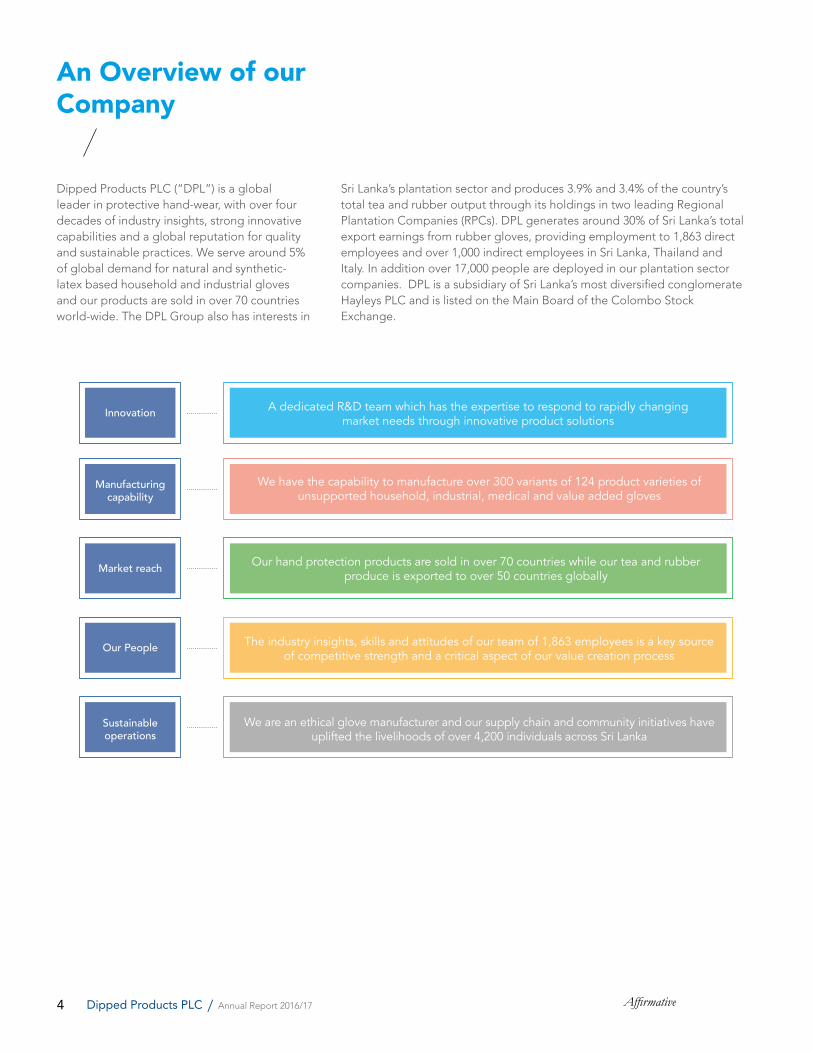
An Overview of our Company
Dipped Products PLC (“DPL”) is a global leader in protective hand-wear, with over four decades of industry insights, strong innovative capabilities and a global reputation for quality and sustainable practices. We serve around 5% of global demand for natural and synthetic-latex based household and industrial gloves and our products are sold in over 70 countries world-wide. The DPL Group also has interests in
Sri Lanka’s plantation sector and produces 3.9% and 3.4% of the country’s total tea and rubber output through its holdings in two leading Regional Plantation Companies (RPCs). DPL generates around 30% of Sri Lanka’s total export earnings from rubber gloves, providing employment to 1,863 direct employees and over 1,000 indirect employees in Sri Lanka, Thailand and Italy. In addition over 17,000 people are deployed in our plantation sector companies. DPL is a subsidiary of Sri Lanka’s most diversified conglomerate Hayleys PLC and is listed on the Main Board of the Colombo Stock Exchange.
Innovation
Manufacturing capability
Market reach
Our People
Sustainable operations
A dedicated R&D team which has the expertise to respond to rapidly changing market needs through innovative product solutions
We have the capability to manufacture over 300 variants of 124 product varieties of unsupported household, industrial, medical and value added gloves
Our hand protection products are sold in over 70 countries while our tea and rubber produce is exported to over 50 countries globally
The industry insights, skills and attitudes of our team of 1,863 employees is a key source of competitive strength and a critical aspect of our value creation process
We are an ethical glove manufacturer and our supply chain and community initiatives have uplifted the livelihoods of over 4,200 individuals across Sri Lanka
5Affirmative Dipped Products PLC / Annual Report 2016/17
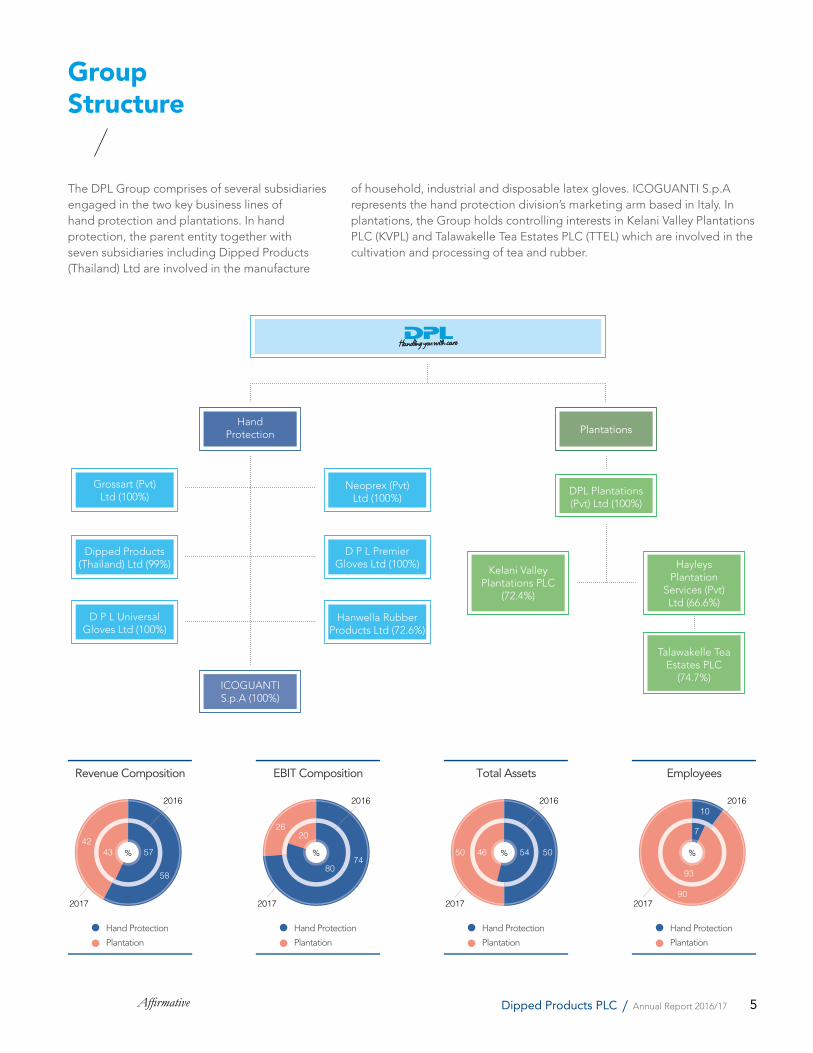
Group Structure
The DPL Group comprises of several subsidiaries engaged in the two key business lines of hand protection and plantations. In hand protection, the parent entity together with seven subsidiaries including Dipped Products (Thailand) Ltd are involved in the manufacture
of household, industrial and disposable latex gloves. ICOGUANTI S.p.A represents the hand protection division’s marketing arm based in Italy. In plantations, the Group holds controlling interests in Kelani Valley Plantations PLC (KVPL) and Talawakelle Tea Estates PLC (TTEL) which are involved in the cultivation and processing of tea and rubber.
Hand Protection
Grossart (Pvt) Ltd (100%)
Dipped Products (Thailand) Ltd (99%)
D P L Universal Gloves Ltd (100%)
Neoprex (Pvt) Ltd (100%)
DPL Plantations (Pvt) Ltd (100%)
Kelani ValleyPlantations PLC
(72.4%)
Hayleys Plantation
Services (Pvt) Ltd (66.6%)
Talawakelle Tea Estates PLC
(74.7%)ICOGUANTI S.p.A (100%)
D P L Premier Gloves Ltd (100%)
Hanwella Rubber Products Ltd (72.6%)
Plantations
Revenue Composition
42
2017
58
Hand Protection
Plantation
5743 %
2016
EBIT Composition
26
2017
74
Hand Protection
Plantation
80
20
%
2016
Total Assets
50
2017
50
Hand Protection
Plantation
5446 %
2016
Employees
902017
10
Hand Protection
Plantation
7
93
%
2016

6 AffirmativeDipped Products PLC / Annual Report 2016/17
Market Reach
In hand protection, we have focused on refining our marketing model to be flexible and agile while allocating resources to the areas which present the greatest potential for growth. Our products are sold in 5 regions and over 70 countries, bearing testimony to our ability to effectively cater to unique regional consumer preferences.
Asia/Africa
Customerprofile2016-15% Customerprofile2017-17%
Australia/New Zealand
Customerprofile2016-7% Customerprofile2017-5%
Europe/Russia
Customerprofile2016-43% Customerprofile2017-40%
North America
Customerprofile2016-19% Customerprofile2017-18%
South America
Customerprofile2016-16% Customerprofile2017-20%

7Affirmative Dipped Products PLC / Annual Report 2016/17
Awards and Accolades
PlasticsandRubberInstituteofSriLankaMeritAward
PresidentialExportAwardsHighestvalueaddedexporterintheRubberandRubberbasedproductscategory
JASTECAGoldAwardCSRSustainability

8 AffirmativeDipped Products PLC / Annual Report 2016/17
Performance Highlights
Metric 2017 2016 % Y-o-y
FINANCIAL CAPITAL
Strategic Priority-Growth
Revenue Rs. mn 24,334 21,931 10.96
Operating profit Rs. mn 1,490 910 63.64
Profit before tax Rs. mn 1,057 691 53.09
Profit after tax Rs. mn 918 476 92.82
Return on equity (%) % 8.26 4.26 93.90
Return on capital employed (%) % 8.71 5.47 59.21
Financial Stability
Total assets Rs. mn 23,170 21,358 8.48
Total liabilities Rs. mn 11,736 10,788 8.79
Shareholders’ funds Rs. mn 9,122 8,164 11.73
Non Controlling Interest Rs. mn 2,312 2,406 (3.90)
Total debt Rs. mn 5,118 4,350 17.65
Debt/Equity No. of times 0.45 0.41 8.77
Net debt (cash)/Equity No. of times 0.41 0.38 7.05
Debt/Total assets % 22 20 8.45
Shareholder information
No of shares In Issue Number mn 59.86 59.86 -
Earnings per share Rs. 12.58 5.82 116.15
Dividends per share Rs. 2.50 2.00 25.00
Net asset value per share Rs. 152.39 136.39 11.73
Closing price Rs. 76.00 73.00 4.11
Market capitalization Rs. mn 4,549 4,370 4.11
P/E ratio No. of times 6.04 12.60 (52.05)
Dividend payout % 19.87 34.36 (42.17)
Dividend cover No. of times 5.00 2.90 72.41
Dividend yield % 3.30 2.74 20.45
MANUFACTURED CAPITAL
Property, plant and equipment Rs. mn 12,414 12,189 1.85
Capital expenditure Rs. mn 1,037 2,752 (62.33)
9Affirmative Dipped Products PLC / Annual Report 2016/17
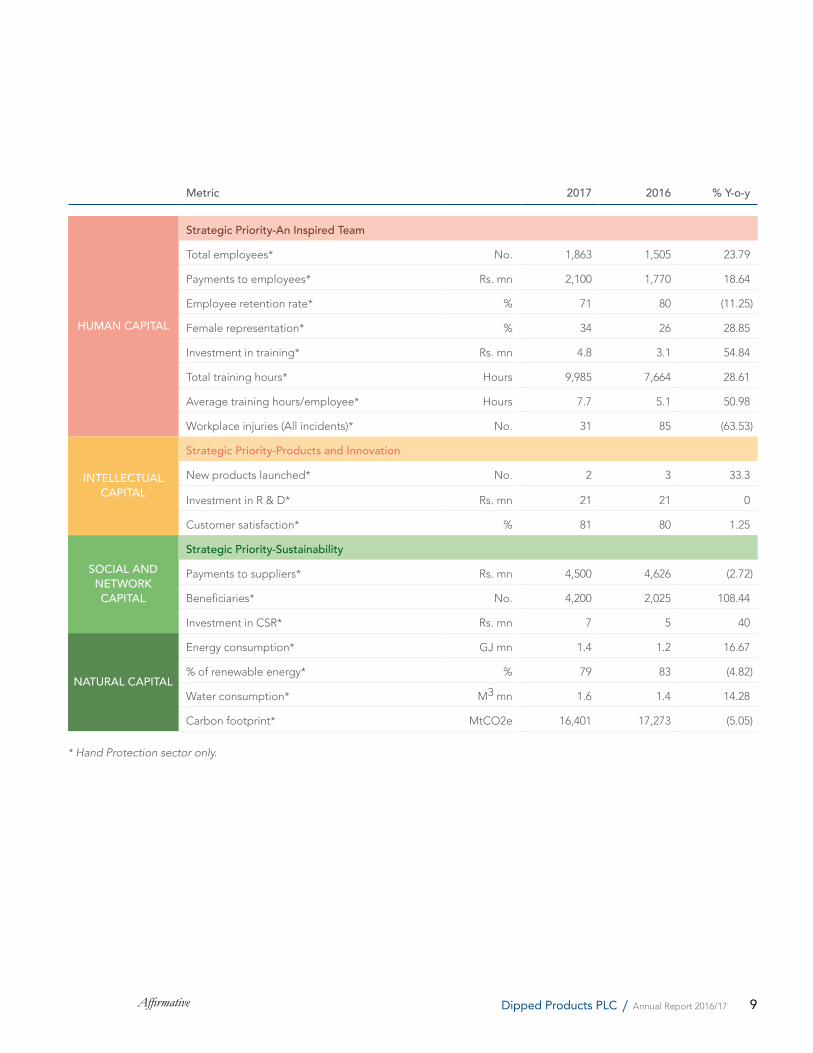
Metric 2017 2016 % Y-o-y
HUMAN CAPITAL
Strategic Priority-An Inspired Team
Total employees* No. 1,863 1,505 23.79
Payments to employees* Rs. mn 2,100 1,770 18.64
Employee retention rate* % 71 80 (11.25)
Female representation* % 34 26 28.85
Investment in training* Rs. mn 4.8 3.1 54.84
Total training hours* Hours 9,985 7,664 28.61
Average training hours/employee* Hours 7.7 5.1 50.98
Workplace injuries (All incidents)* No. 31 85 (63.53)
INTELLECTUALCAPITAL
Strategic Priority-Products and Innovation
New products launched* No. 2 3 33.3
Investment in R & D* Rs. mn 21 21 0
Customer satisfaction* % 81 80 1.25
SOCIAL ANDNETWORKCAPITAL
Strategic Priority-Sustainability
Payments to suppliers* Rs. mn 4,500 4,626 (2.72)
Beneficiaries* No. 4,200 2,025 108.44
Investment in CSR* Rs. mn 7 5 40
NATURAL CAPITAL
Energy consumption* GJ mn 1.4 1.2 16.67
% of renewable energy* % 79 83 (4.82)
Water consumption* M3 mn 1.6 1.4 14.28
Carbon footprint* MtCO2e 16,401 17,273 (5.05)
* Hand Protection sector only.
10 AffirmativeDipped Products PLC / Annual Report 2016/17
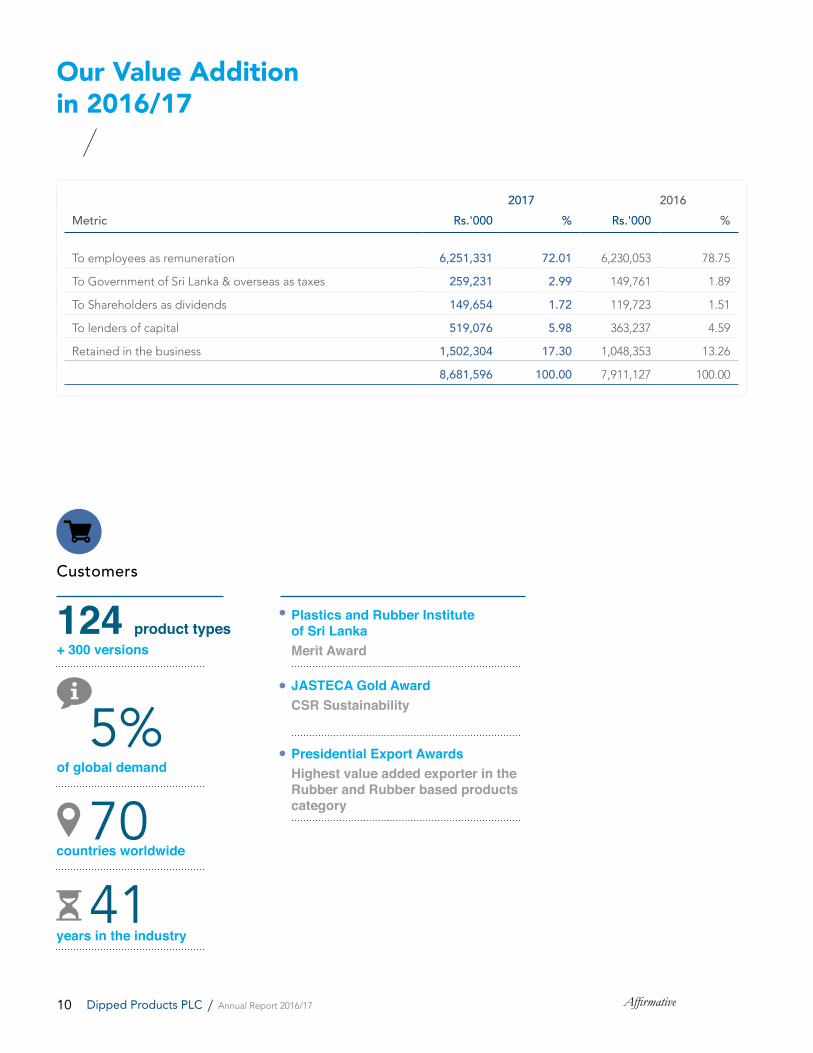
Our Value Addition in 2016/17
Customers
+300versions
yearsintheindustry
124producttypes
countriesworldwide70
ofglobaldemand
5%
41
JASTECAGoldAwardCSRSustainability
PlasticsandRubberInstituteofSriLankaMeritAward
PresidentialExportAwardsHighestvalueaddedexporterintheRubberandRubberbasedproductscategory
2017 2016Metric Rs.'000 % Rs.'000 %
To employees as remuneration 6,251,331 72.01 6,230,053 78.75
To Government of Sri Lanka & overseas as taxes 259,231 2.99 149,761 1.89
To Shareholders as dividends 149,654 1.72 119,723 1.51
To lenders of capital 519,076 5.98 363,237 4.59
Retained in the business 1,502,304 17.30 1,048,353 13.26
8,681,596 100.00 7,911,127 100.00
11Affirmative Dipped Products PLC / Annual Report 2016/17
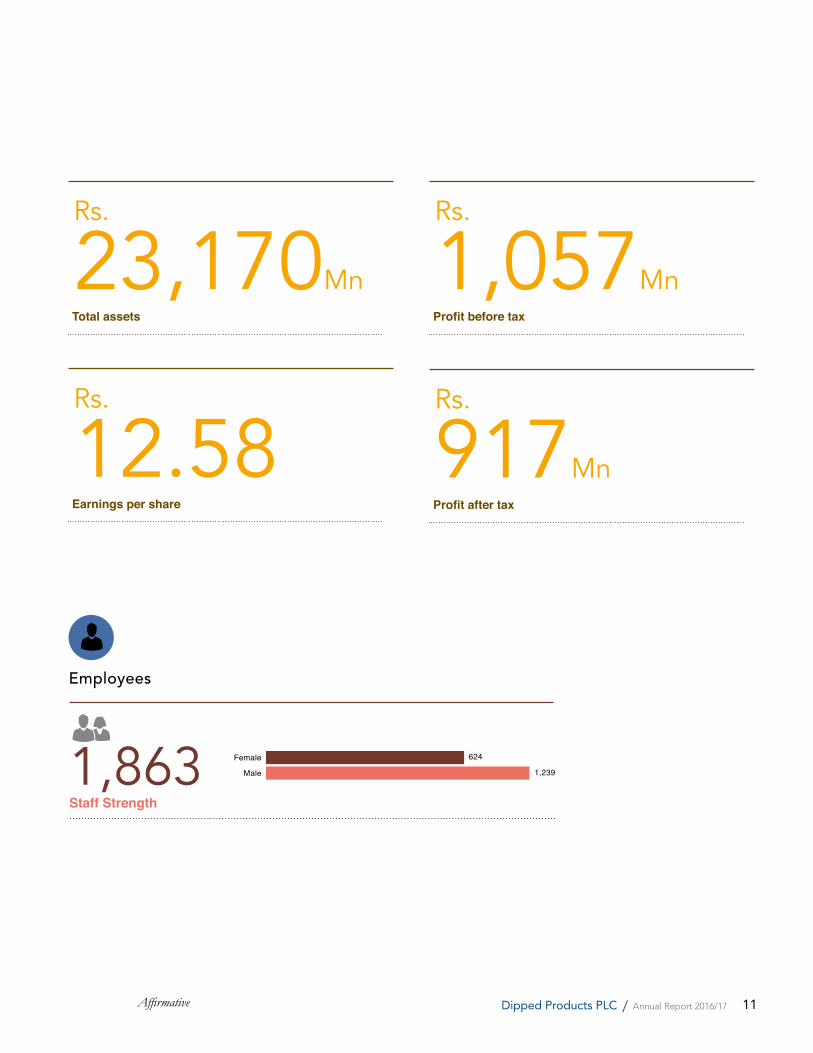
Employees
StaffStrength
624
1,239
Female
Male1,863
Rs.
23,170Mn
Rs.
12.58
Rs.
1,057Mn
Rs.
917Mn
Totalassets
Earningspershare
Profitbeforetax
Profitaftertax

12 AffirmativeDipped Products PLC / Annual Report 2016/17
13Affirmative Dipped Products PLC / Annual Report 2016/17
We will commit to the goals we want to achieve
Decisive
Our Leadership14 Joint Letter from the Chairman
& Managing Director
18 Board of Directors
20 Management Team
14 AffirmativeDipped Products PLC / Annual Report 2016/17
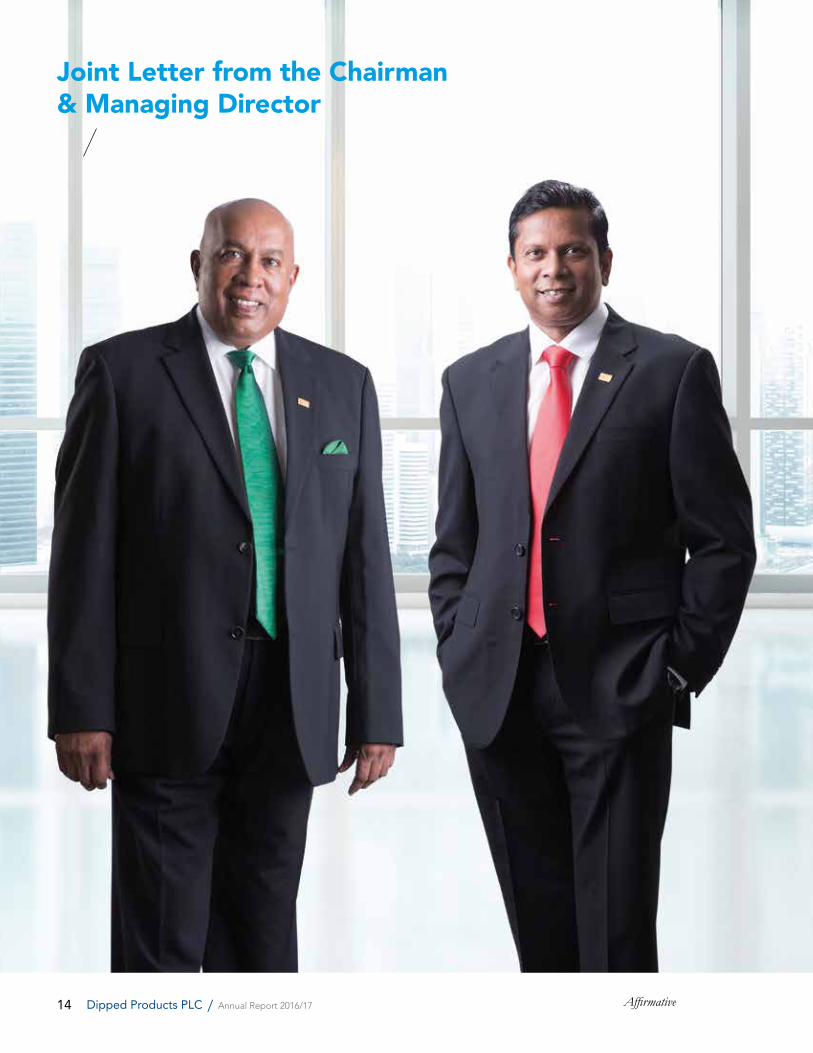
Joint Letter from the Chairman & Managing Director

15Affirmative Dipped Products PLC / Annual Report 2016/17
Dear Shareholder,
DPL delivered a strong performance achieving Rs. 24 billion turnover and Rs. 1.06 billion profit before tax (PBT) for the 2016/17 financial year. The top line growth was supported by rapid penetration in our traditional markets as well as through intense drive to develop customers in new markets that resulted in growing our overall global footprint. Enabling factors including supply chain cost reduction, improved production efficiencies, reduction in staff attrition rates and measures to embed cross-functional team work culture have helped the company to register a significant growth in profitability over the previous year. Importantly, it was a year where we regained customer confidence
DPL delivered a strong performance achieving Rs. 24 billion turnover and Rs. 1.06 billion profit before tax
and strengthened internal operations after a challenging period since 2014 that the company had to undergo. It is our pleasure to present to you the 41st Annual Report of Dipped Products PLC providing a review of our performance during the financial year ending March 31, 2017.
A challenging operating environment
Relatively slow economic growth in our markets with several key markets remaining subdued during most of 2016 was one of the important challenges that the business faced during the financial year. Rubber recorded a sharp increase in price during the last quarter of the year which had a significant impact to profitability.
Our performance in the Tea plantations sector was affected during the year due to restrictions on weedicides, labour cost and adverse weather conditions whereas favourable tea prices especially during the last quarter enabled the plantation sector to end the financial year with a positive note.
Financial Performance
Dipped Products delivered profit before tax of Rs.1,057 million and profit after tax (PAT) of Rs. 918 million for the year reflecting volume growth, economies of scale and productivity improvement. Our initiatives to capture growth opportunities by reaching out to our customers in the respective markets have rewarded our performance by 11% improvement to sales revenue and nearly doubling of the profit before tax versus the previous financial year. DPL also achieved the historically highest level of glove shipments during the year. In Hand Protection, we were able to deliver on our year on year cost reduction and productivity improvement targets enabled by de-bottlenecking operational constraints in areas such as glove packing, chlorination and drying, and addition of lower cost heating capacity to factories, investing over Rs.272 million in the respective projects.
Profitability of the Hand Protection sector had a negative impact due to delays in commencing commercial operations of the new industrial glove manufacturing facility in Biyagama.
0
5,000
10,000
15,000
20,000
25,000
30,000
Revenue growth
2013 2014 2015 2016 2017
Rs. Mn
Hand protection Plantations
Growth+11% Turnover
+53% PBT+93% PAT
For the latest financialinformation, refer to ourinvestor relations pagewww.dpl.com/reporting
16 AffirmativeDipped Products PLC / Annual Report 2016/17
Joint Letter from the Chairman & Managing Director
Numerous unexpected technical and operational matters that came up have been resolved through the year. Delivering commercial orders from this subsidiary of DPL picked up during the last quarter and we expect the industrial glove operations to be in much stronger shape in the coming months.
Strategic positioning for growth
DPL is one of the leading private labelled manufacturers in household and industrial gloves. As a part of the initiatives to strengthen our marketing activities, we invested Euro 3.2 million to purchase the remaining 39% equity stake in ICOGUANTI S.p.A, the European marketing arm of the Group in May, 2016. With this investment, we will be able to give a strong impetus to broaden our reach across European markets in order to harness the significant potential that the region offers, especially in industrial hand protection. With over 30 new customers from the global market added to our Hand Protection portfolio during the Financial Year using our regional marketing strategy, we are confident that continued customer acquisition will support our growth into the future. Customer satisfaction improved during the year and the resurgence in customer confidence has been a noteworthy achievement during the year.
Cost Leadership through Responsible Production
This was a year of consolidating our operations to drive stability and cost leadership. Accordingly, we implemented a number of initiatives to drive cost leadership embedding principles of responsible production in to our production processes. This enabled us to reduce lead times while enhancing the reliability of supply and maintaining quality of the product which has improved overall productivity. We have reduced our energy consumption per pair by 11% during the year. Manufacturing facilities in Kottawa and Biyagama are now entirely powered through renewable energy sources which have also served to reduce our emissions.
It was indeed gratifying to receive the Gold Award from the Japan Sri Lanka Technical and Cultural Association in recognition of our efforts to develop the world’s first ethical rubber gloves manufactured using ‘Fair Trade’ principles that ensure that the rubber is sustainably and ethically sourced from smallholder farmers. These efforts and underpinned by our flagship Sustainability Project, Firstlight, supports livelihood of over 2,000 farmers who are educated in sustainable agricultural practices in tapping of rubber. We now source approximately 40% of our requirement from these farmers to whom we supplied inputs enabling us to manage the quality and reliability of supply of Latex.
Our CSR project in Horowpathana to provide clean, potable water for CKD affected residents of the Parangiyawadiya village is now complete with the smooth operation of the Reverse Osmosis Plant. We are now moving into the second phase of this project focusing on educational support to schools in the village.
Both Tea and Rubber from Kelani Valley Plantations and Talawakele Tea Estates fetch premium prices for their products. This reflects their strong commitment to good agricultural practices, responsible production and to uplifting the livelihood of over 150,000 residents on the estates through their multifaceted CSR project “ A Home for Every Plantation Worker”.
Dividend
We are pleased to authorise a dividend of Rs.2.50 per share amounting to Rs.150 million as an interim dividend for the financial year 2016/2017.
Looking Forward
Global growth picked up during the first quarter of 2017 and forecasts are for higher paced growth in 2017, although there are significant downside risks. These include protectionism,
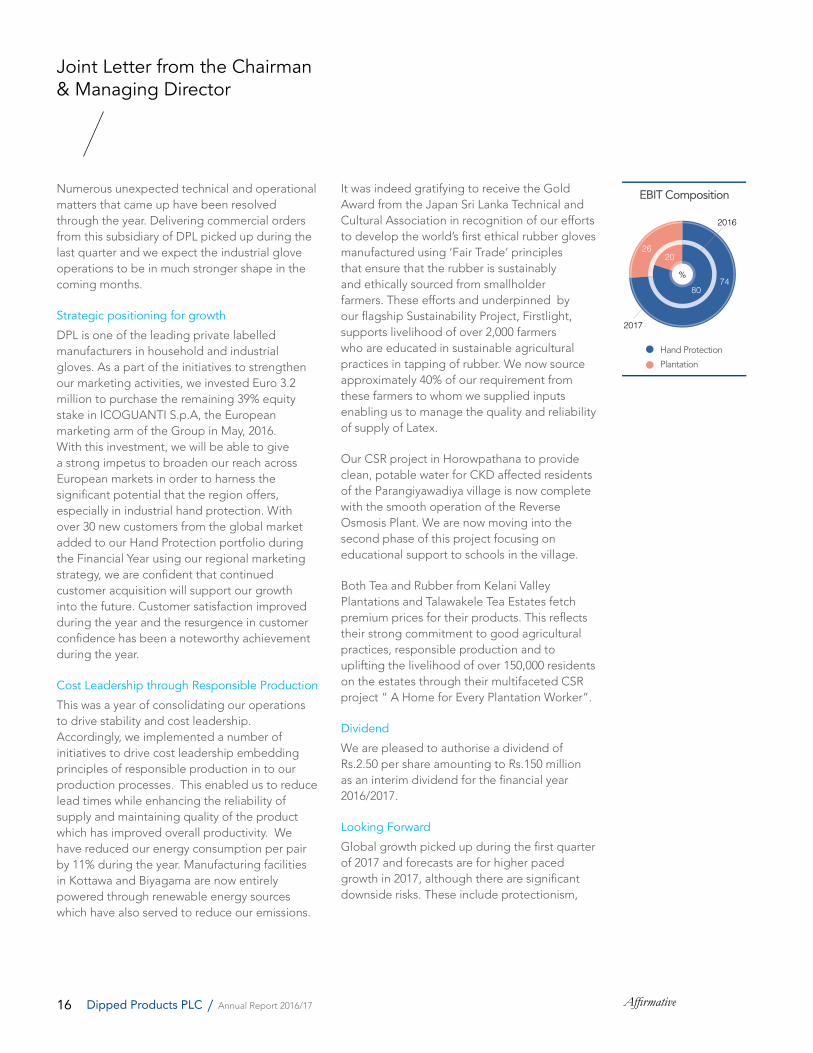
EBIT Composition
26
2017
74
Hand Protection
Plantation
80
20
%
2016
17Affirmative Dipped Products PLC / Annual Report 2016/17
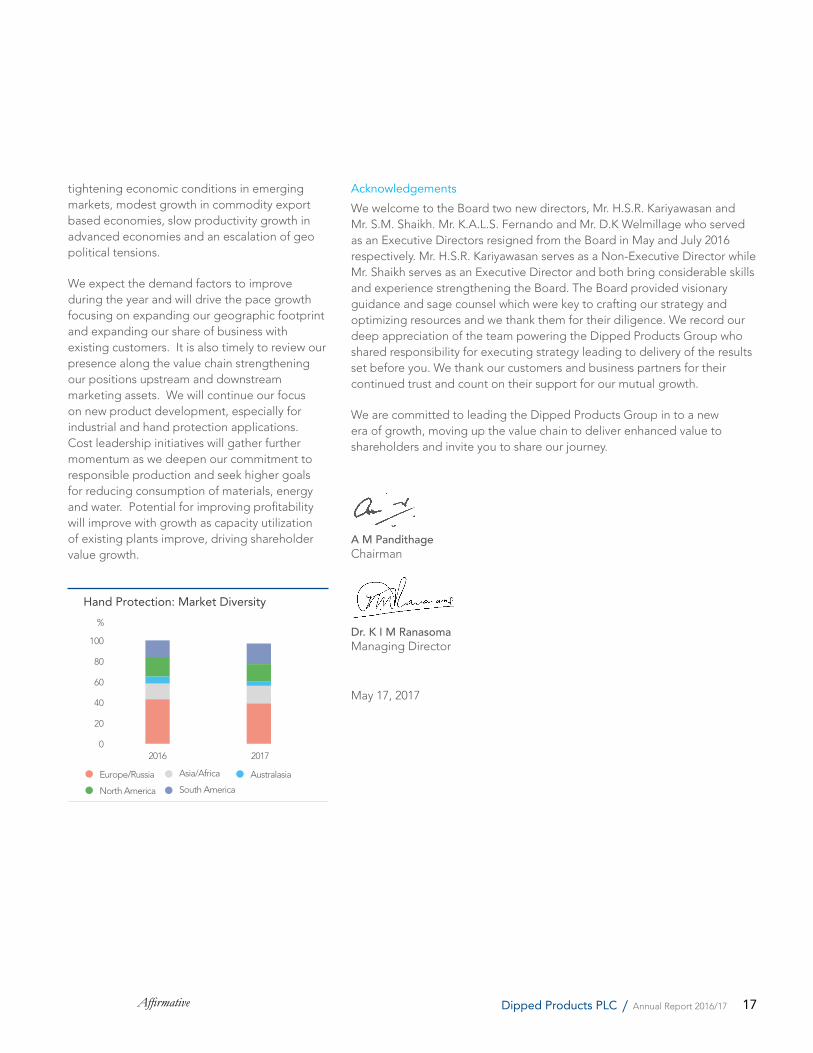
tightening economic conditions in emerging markets, modest growth in commodity export based economies, slow productivity growth in advanced economies and an escalation of geo political tensions.
We expect the demand factors to improve during the year and will drive the pace growth focusing on expanding our geographic footprint and expanding our share of business with existing customers. It is also timely to review our presence along the value chain strengthening our positions upstream and downstream marketing assets. We will continue our focus on new product development, especially for industrial and hand protection applications. Cost leadership initiatives will gather further momentum as we deepen our commitment to responsible production and seek higher goals for reducing consumption of materials, energy and water. Potential for improving profitability will improve with growth as capacity utilization of existing plants improve, driving shareholder value growth.
Acknowledgements
We welcome to the Board two new directors, Mr. H.S.R. Kariyawasan and Mr. S.M. Shaikh. Mr. K.A.L.S. Fernando and Mr. D.K Welmillage who served as an Executive Directors resigned from the Board in May and July 2016 respectively. Mr. H.S.R. Kariyawasan serves as a Non-Executive Director while Mr. Shaikh serves as an Executive Director and both bring considerable skills and experience strengthening the Board. The Board provided visionary guidance and sage counsel which were key to crafting our strategy and optimizing resources and we thank them for their diligence. We record our deep appreciation of the team powering the Dipped Products Group who shared responsibility for executing strategy leading to delivery of the results set before you. We thank our customers and business partners for their continued trust and count on their support for our mutual growth.
We are committed to leading the Dipped Products Group in to a new era of growth, moving up the value chain to deliver enhanced value to shareholders and invite you to share our journey.
A M Pandithage Chairman
Dr. K I M RanasomaManaging Director
May 17, 2017
0
20
40
60
80
100
Hand Protection: Market Diversity
2016 2017
%
Europe/Russia Asia/Africa Australasia
North America South America
18 AffirmativeDipped Products PLC / Annual Report 2016/17
Board of Directors
A M PANDITHAGEChairman
Chairman and Chief Executive of Hayleys PLC. Appointed to the Board of Dipped Products PLC in 2007. Fellow of the Chartered Institute of Logistics & Transport (UK). Honorary Consul of United Mexican States (Mexico) to Sri Lanka. Committee Member of the Ceylon Chamber of Commerce. Council Member of the Employers’ Federation of Ceylon. Member of the Maritime Advisory Council of the Ministry of Ports & Shipping. Member of the Maritime Advisory Council of the Ceylon Association of Ships’ Agents. Member of the National Steering Committee on Skills Sector Development of the Department of National Planning.
DR K I M RANASOMAManaging Director
Joined DPL in August 2010 as an Executive Director and took over as Managing Director from April 2011. Appointed to the Hayleys Group Management Committee in January 2011 and to the Board of Hayleys in April 2011. Former Country Chairman/Managing Director of Shell Gas Lanka Limited and Shell Terminal Lanka Limited. Holds First Class Honours Degree in Engineering from the University of Peradeniya, a Doctorate from Cambridge University, UK and an MBA with Distinction from Wales University,UK.
DHAMMIKA PERERA*
Appointed to the Board in November 2010. Quintessential business leader, with interests in a variety of key industries including Hydropower generation, Manufacturing, Hospitality, Entertainment, Banking and Finance
and enriches the Board with over 27 years of experience in building formidable businesses through unmatched strategic foresight.
He serves as the Chairman of Vallibel One PLC, Royal Ceramics Lanka PLC, Lanka Ceramic PLC, Lanka Tiles PLC, Lanka Walltiles PLC, The Fortress Resorts PLC, Vallibel Power Erathna PLC and Delmege Limited. He is the Co-Chairman of Hayleys PLC and The Kingsbury PLC, Executive Deputy Chairman of LB Finance PLC and Deputy Chairman of Horana Plantations PLC, Executive Director of Vallibel Finance PLC. He also serves on the Boards of Amaya Leisure PLC, Haycarb PLC, Hayleys Fabric PLC, Hayleys Global Beverages (Pvt) Ltd and Sun Tan Beach Resorts Ltd.
F MOHIDEEN**
Appointed to the Board in 2008. Holds a degree in BSc Mathematics from the University of London and a MSc in Econometrics from the London School of Economics. Served as the Deputy Secretary to the Treasury and Director General, External Resources Department of the Ministry of Finance and Planning.
S C GANEGODA*
Rejoined Hayleys in March 2007. Appointed to the Hayleys Group Management Committee in July 2007 and to the Board of Hayleys in September 2009. Appointed to the DPL Board in October 2009. FCA, Sri Lanka and a Member, Institute of Certified Management Accountants, Australia. Holds an MBA from the Postgraduate Institute of Management, University of Sri Jayawardenepura, Sri Lanka. Worked for Hayleys Group between 1987 and
2002. Held several senior management positions in large private sector entities in Sri Lanka and overseas. Has responsibility for the strategic business development units of Hayleys PLC and the Fantons Group.
M BOTTINO ICOGUANTI
Appointed to the Board in November 2010. Joined ICOGUANTI S.p.A, in 1994 and functions to date as its Managing Director. Holds a First class degree in Mechanical Engineering from the University of Genova and MBA from SOGEA, Italy. Previously held Executive and Senior management positions in several large private sector entities in Italy over a period of 28 years including Ansaldo, Morteo Soprefin and ILVA Steel.
S RAJAPAKSE **
Appointed to the Board in July 2013. Managing Partner of BDO Partners, Chartered Accountants. Fellow of the Chartered Accountants of Sri Lanka and holds an MBA from Postgraduate Institute of management, University of Sri Jayewardenepura. Past President of the Institute of Chartered Accountants of Sri Lanka. Serves as a Non- executive Independent Director of Softlogic Insurance PLC and Haycarb PLC.
N A R R S NANAYAKKARA Finance
Joined DPL in 1991. Appointed to the Board in July 2014. Holds a Degree in B Sc Physical Science from University of Sri Jayewardenepura and Fellow member of Chartered Institute of Management Accountants - UK.
19Affirmative Dipped Products PLC / Annual Report 2016/17
S P PEIRIS **
Appointed to the Board in July 2014. Director of Bartleet Religare Securities (Pvt) Ltd., (BRS) and has over 25 years of experience in different capacities in the Capital Market of Sri Lanka through BRS. Leading Licensed Stockbroker in the industry, accounts for a well-established client network and has introduced many High net worth and Institutional clients to the Colombo Stock Market.
K D G GUNARATNE **
Appointed to the Board in August 2015. Member of the Western Province Council during the period 1989 to 2009.
Currently serves as the Chairman of Lanka Hotels & Residencies (Pvt) Ltd and Urban Investments & Development Company (Pvt) Ltd. Director of Lanka Walltiles PLC, Lanka Tiles PLC, Lanka Ceramic PLC, Horana Plantations PLC and Insurance & Financial Services (Pvt) Ltd.
S M SHAIKHCommercial
Appointed to the DPL Board in May 2016. Holds an MBA with an Aircraft Engineering background. Long and diversified experience in Industrial Marketing and Management including several years in Hand Protection sector. Served in several industries including Aviation, Textiles, Cement, Energy, Safety and as an independent management and industrial consultant for multiple projects.
H S R KARIYAWASAN *
Appointed to the DPL Board in May 2016. Currently the Managing Director of Haycarb PLC. A member of the Hayleys Group Management Committee and a Director of Hayleys PLC since 2010.
Holds a B.Sc. Engineering (Electronics & Telecommunications) Degree from the University of Moratuwa, Sri Lanka. Fellow Member of the Chartered Institute of Management Accountants – UK and a Six Sigma (Continuous Improvement Methodology) Black Belt, Certified by the Motorola University, Malaysia. Former Director/ General Manager of Ansell Lanka (Pvt) Ltd, and served as the Chairman of the Manufacturing Association of Export Processing Zone, Biyagama.
* Non-Executive** Independent Non-Executive
20 AffirmativeDipped Products PLC / Annual Report 2016/17
Our success is driven by the skills, ethics, shared values and unique competencies of the DPL team ....
Management Team
HAND PROTECTION
A M PandithageChairman
Dr K I M RanasomaManaging Director
M BottinoManaging Director ICOGUANTI
N A R R S NanayakkaraDirector (Finance)
S M ShaikhDirector (Commercial)
General ManagersB K C R RatnasiriEngineering
H C RanasingheProjects
S A N PushpakumaraMedical Gloves
A MuthukudaOperations (Non Zone)
K M D I PrasadMarketing
A P C SampathHuman Resources
A H Haputhanthri Operations (Asst. GM, Zones)
Divisional ManagersDr. R M U N RatnayakeGroup R&D
M P LokumanageFactory Manager (DL/GL/NL)
W T C KumaraFactory Manager (HRPL)
T K HathurusingheFactory Manager (DUGL)
A C WimalawardenaFactory Manager (DPGL)
R W DassanayakeGroup Logistics
Ms. N D K SumanasekaraGroup Procurement
K K D P SenanayakeTechnical (DPTL)
Dr. M P J BadathurugeGroup Quality
S W A PremachandraProject Implementation
H M A KumaraFinance
N P BaddageCentrifuging & Latex Supply
Ms. S V WanigasekaraRegional Business Development
K M C S K PereraPlanning
P Sutthirat Human Resources (DPTL)
Ms. Jittinun ChokhawFinance (DPTL)
G KarunarathneGroup Process
K D A JayanadaIT & ERP
N SamoleeEMS/QMS (DPTL)
S D P R SilvaEngineering Maintenance (DL)
S M G B SamarakoonTrimming, Sorting & Packing (HRPL)
D SenavirathnaEngineering (DPTL)
H N H JayasingheProduction (DL/GL/NL)
C M ManuelProduction Planning
E G C S PremadasaSafety
W M G WickramasingheContinuous Improvement
T S SamarathungaProduct Development
T I JayaweeraFinance
T H L SeneviratneProduction (DUGL)
U A G J RupasingheEnergy & Sustainability
P L D R CoorayRegional Business Development
K M NibrasRegional Business Development
21Affirmative Dipped Products PLC / Annual Report 2016/17
PLANTATIONS
A M PandithageChairman
W G R RajaduraiManaging Director - KVPL/TTEL
Kelani Valley Plantations PLC
S Siriwardena Director, CEO
General ManagersY U S PremathilakeLow Country
A Weerakoon Up Country
N NavaparitthikulLab & Water Treatment (DPTL)
S JindaratBusiness Development (DPTL)
S A C P KumarHuman Resources
Ms. S N MayadunneQuality Assurance
D N DissanayakeRegional Business Development
D G ThanadakkaraBusiness Development (Medical Gloves)
H S R JayasinheProcurement
J A Rodrigo Marketing & Corporate Affairs
Regional General ManagersB C Gunasekera Panawatte (Rubber Group I)
S F Fernando
Dewalakanda (Rubber Group II)
Deputy General ManagersD I Gallearachchi Robgill
A P SenanayakePedro
K de J Seneviratne Regional Administration
R G D Fernando Rubber Marketing & Administration
N A A K Nissanka Finance
C B Dharmakirthy Halgolla
Talawakelle Tea Estates PLC
D S Seneviratne Director, CEO
General ManagersS B AlawattegamaPlantations
M T D RodrigoStrategic Performance Management
Senior Regional General ManagerN P AbeysingheDessford
Deputy General ManagersP G G JayathilakeSnr DGM, Mattakelle
D M H U MahadivulwewaSnr DGM, Kiruwanaganga
G K WijesekeraSnr DGM, Great Western
A C M BandaranayakeDGM, Palmerston
Ms. V PereraDGM, Finance

22 AffirmativeDipped Products PLC / Annual Report 2016/17
23Affirmative Dipped Products PLC / Annual Report 2016/17
We are quick to react and adapt to the ever-changing environment
Responsive
Stewardship and Governance 24 Value Creation Model 26 Stakeholder Engagement 27 Contextual Trends 32 Our Material Issues34 Managing Risk 36 Strategic Framework 38 Our Commitment to the Sustainable Development Goals 42 Operational Review45 Value Creation against our Capitals
69 Corporate Governance 88 Related Party Transactions Review Committee Report 89 Audit Committee91 Annual Report of the Board of Directors on the Affairs of the Company 95 Statement of Directors’ Responsibilities
24 AffirmativeDipped Products PLC / Annual Report 2016/17
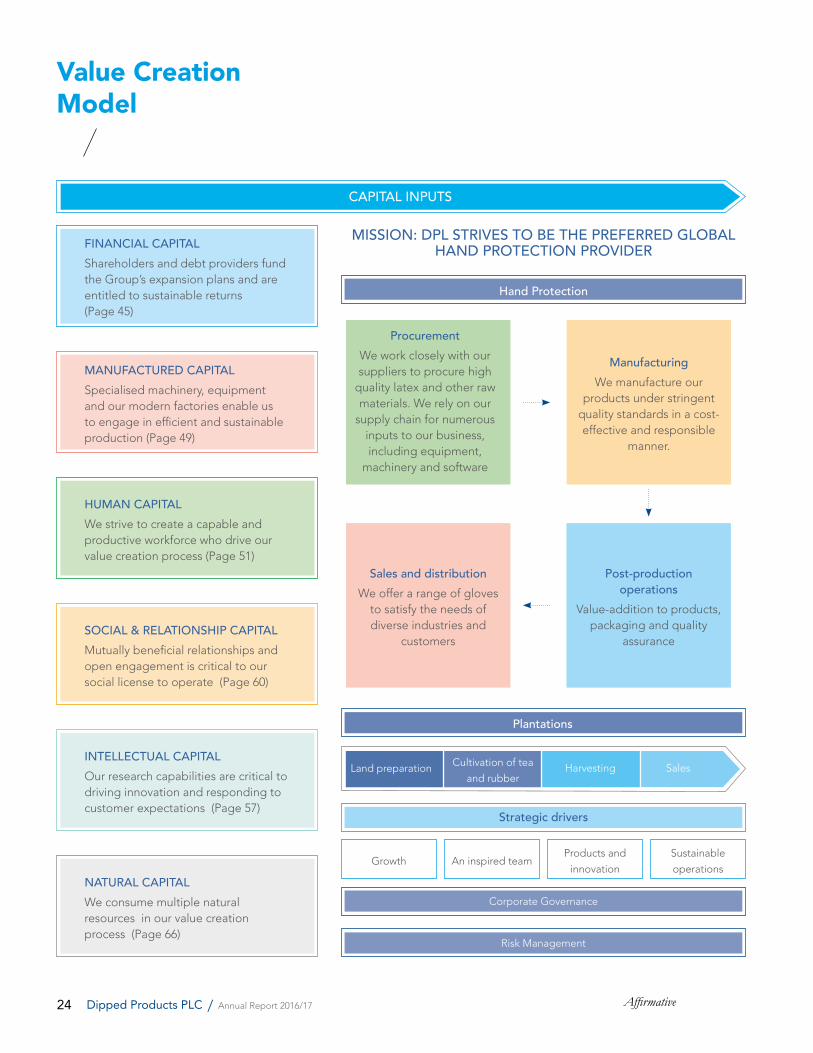
CAPITAL INPUTS
ProcurementWe work closely with our suppliers to procure high
quality latex and other raw materials. We rely on our
supply chain for numerous inputs to our business, including equipment,
machinery and software
ManufacturingWe manufacture our
products under stringent quality standards in a cost-effective and responsible
manner.
Value Creation Model
FINANCIAL CAPITALShareholders and debt providers fund the Group’s expansion plans and are entitled to sustainable returns(Page 45)
HUMAN CAPITALWe strive to create a capable and productive workforce who drive our value creation process (Page 51)
SOCIAL & RELATIONSHIP CAPITALMutually beneficial relationships and open engagement is critical to our social license to operate (Page 60)
INTELLECTUAL CAPITALOur research capabilities are critical to driving innovation and responding to customer expectations (Page 57)
NATURAL CAPITALWe consume multiple natural resources in our value creation process (Page 66)
Sales and distributionWe offer a range of gloves
to satisfy the needs of diverse industries and
customers
Post-production operations
Value-addition to products, packaging and quality
assurance
MISSION: DPL STRIVES TO BE THE PREFERRED GLOBAL HAND PROTECTION PROVIDER
Hand Protection
Plantations
Strategic drivers
Corporate Governance
Risk Management
Growth An inspired teamProducts and
innovation
Sustainable
operations
Land preparation Cultivation of tea
and rubberHarvesting Sales
MANUFACTURED CAPITALSpecialised machinery, equipment and our modern factories enable us to engage in efficient and sustainable production (Page 49)
25Affirmative Dipped Products PLC / Annual Report 2016/17
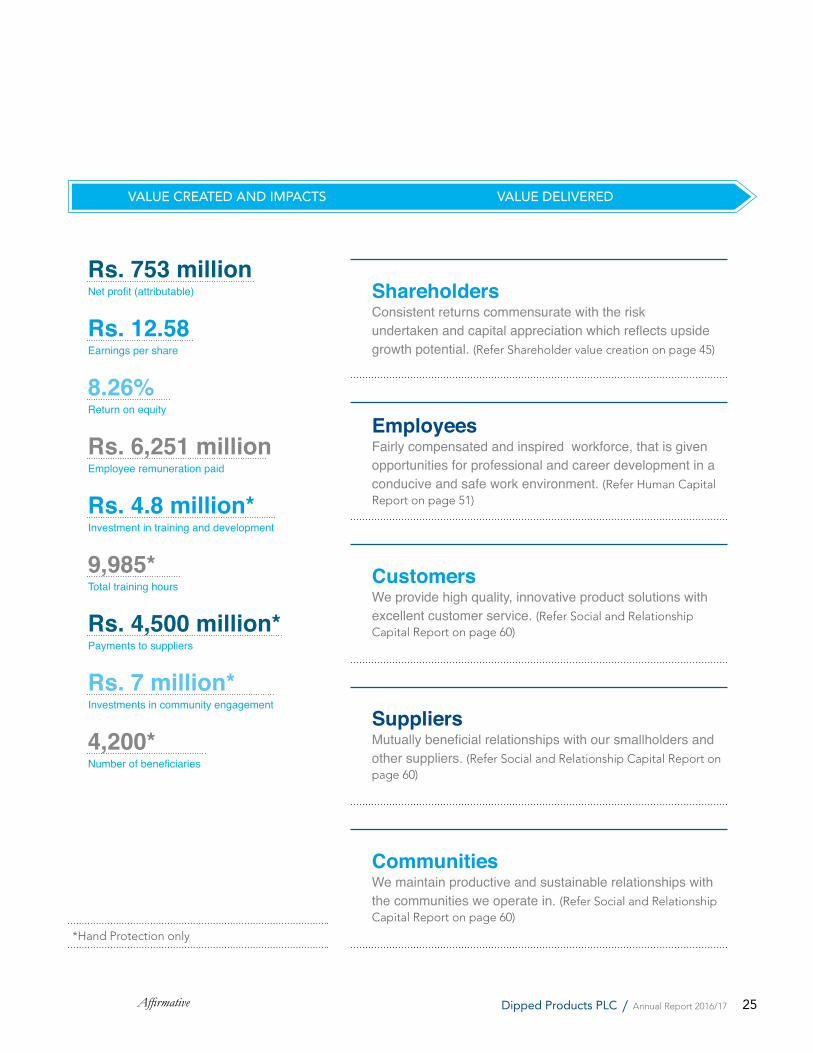
VALUE CREATED AND IMPACTS VALUE DELIVERED
Earnings per shareRs.12.58
Return on equity8.26%
Employee remuneration paidRs.6,251million
Investment in training and developmentRs.4.8million*
Total training hours9,985*
Payments to suppliersRs.4,500million*
Investments in community engagementRs.7million*
Number of beneficiaries4,200*
Net profit (attributable)Rs.753million
*Hand Protection only
Shareholders Consistent returns commensurate with the risk undertaken and capital appreciation which reflects upside growth potential. (Refer Shareholder value creation on page 45)
Customers We provide high quality, innovative product solutions with excellent customer service. (Refer Social and Relationship Capital Report on page 60)
Employees Fairly compensated and inspired workforce, that is given opportunities for professional and career development in a conducive and safe work environment. (Refer Human Capital Report on page 51)
Suppliers Mutually beneficial relationships with our smallholders and other suppliers. (Refer Social and Relationship Capital Report on page 60)
Communities We maintain productive and sustainable relationships with the communities we operate in. (Refer Social and Relationship Capital Report on page 60)
26 AffirmativeDipped Products PLC / Annual Report 2016/17
Stakeholder Engagement
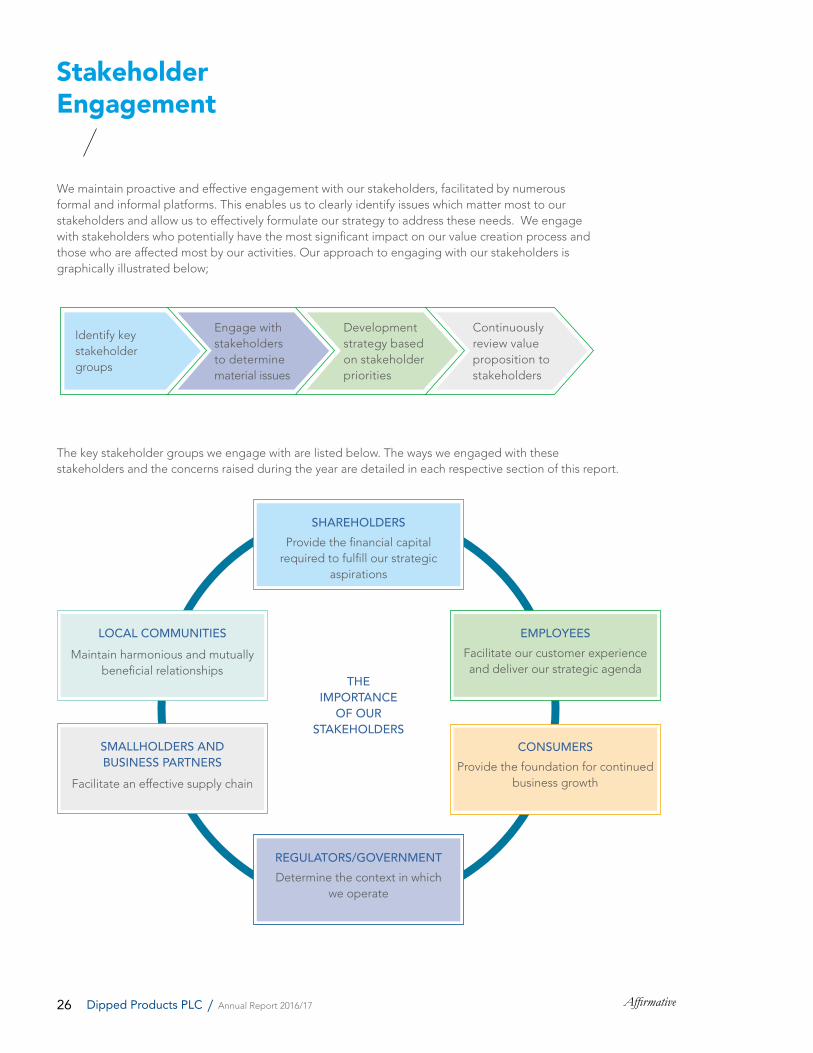
We maintain proactive and effective engagement with our stakeholders, facilitated by numerous formal and informal platforms. This enables us to clearly identify issues which matter most to our stakeholders and allow us to effectively formulate our strategy to address these needs. We engage with stakeholders who potentially have the most significant impact on our value creation process and those who are affected most by our activities. Our approach to engaging with our stakeholders is graphically illustrated below;
The key stakeholder groups we engage with are listed below. The ways we engaged with these stakeholders and the concerns raised during the year are detailed in each respective section of this report.
Identify key stakeholder groups
Engage with stakeholders to determine material issues
Development strategy based on stakeholder priorities
Continuously review value proposition to stakeholders
SHAREHOLDERSProvide the financial capital
required to fulfill our strategic aspirations
EMPLOYEESFacilitate our customer experience and deliver our strategic agenda
CONSUMERSProvide the foundation for continued
business growth
REGULATORS/GOVERNMENTDetermine the context in which
we operate
SMALLHOLDERS AND BUSINESS PARTNERS
Facilitate an effective supply chain
THE IMPORTANCE
OF OUR STAKEHOLDERS
LOCAL COMMUNITIES Maintain harmonious and mutually
beneficial relationships
27Affirmative Dipped Products PLC / Annual Report 2016/17
Contextual Trends
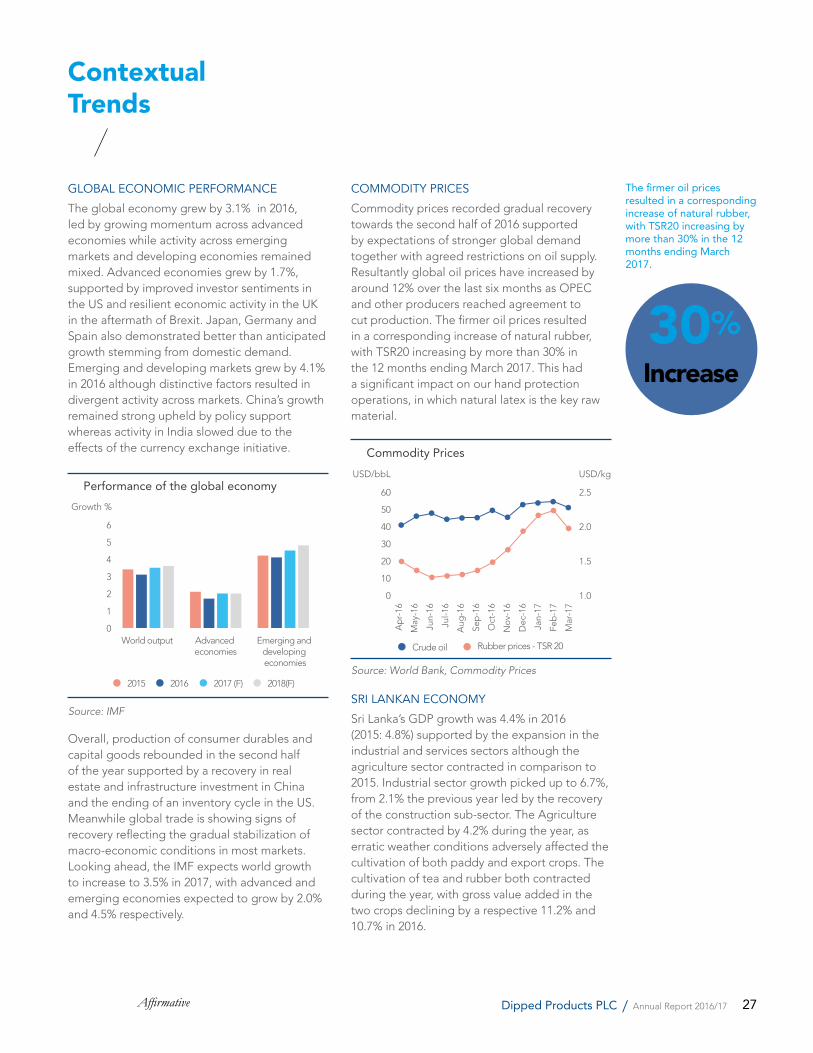
GLOBAL ECONOMIC PERFORMANCE
The global economy grew by 3.1% in 2016, led by growing momentum across advanced economies while activity across emerging markets and developing economies remained mixed. Advanced economies grew by 1.7%, supported by improved investor sentiments in the US and resilient economic activity in the UK in the aftermath of Brexit. Japan, Germany and Spain also demonstrated better than anticipated growth stemming from domestic demand. Emerging and developing markets grew by 4.1% in 2016 although distinctive factors resulted in divergent activity across markets. China’s growth remained strong upheld by policy support whereas activity in India slowed due to the effects of the currency exchange initiative.
0
1
2
3
4
5
6
Performance of the global economy
World output Advanced economies
Emerging and developing economies
Growth %
2015 2016 2017 (F) 2018(F)
Source: IMF
Overall, production of consumer durables and capital goods rebounded in the second half of the year supported by a recovery in real estate and infrastructure investment in China and the ending of an inventory cycle in the US. Meanwhile global trade is showing signs of recovery reflecting the gradual stabilization of macro-economic conditions in most markets. Looking ahead, the IMF expects world growth to increase to 3.5% in 2017, with advanced and emerging economies expected to grow by 2.0% and 4.5% respectively.
COMMODITY PRICES
Commodity prices recorded gradual recovery towards the second half of 2016 supported by expectations of stronger global demand together with agreed restrictions on oil supply. Resultantly global oil prices have increased by around 12% over the last six months as OPEC and other producers reached agreement to cut production. The firmer oil prices resulted in a corresponding increase of natural rubber, with TSR20 increasing by more than 30% in the 12 months ending March 2017. This had a significant impact on our hand protection operations, in which natural latex is the key raw material.
0
10
20
30
40
50
60
Commodity Prices
Ap
r-16
May
-16
Jun-
16
Jul-1
6
Aug
-16
Sep
-16
Oct
-16
No
v-16
Dec
-16
Jan-
17
Feb
-17
Mar
-17
USD/bbL USD/kg
Crude oil Rubber prices - TSR 20
1.0
1.5
2.0
2.5
Source: World Bank, Commodity Prices
SRI LANKAN ECONOMY
Sri Lanka’s GDP growth was 4.4% in 2016 (2015: 4.8%) supported by the expansion in the industrial and services sectors although the agriculture sector contracted in comparison to 2015. Industrial sector growth picked up to 6.7%, from 2.1% the previous year led by the recovery of the construction sub-sector. The Agriculture sector contracted by 4.2% during the year, as erratic weather conditions adversely affected the cultivation of both paddy and export crops. The cultivation of tea and rubber both contracted during the year, with gross value added in the two crops declining by a respective 11.2% and 10.7% in 2016.
30%Increase
The firmer oil prices resulted in a corresponding increase of natural rubber, with TSR20 increasing by more than 30% in the 12 months ending March 2017.
28 AffirmativeDipped Products PLC / Annual Report 2016/17
140
142
144
146
148
150
152
154
Exchange Rate
Aug
-16
Jul-1
6
Jun-
16
May
-16
Ap
r-16
Sep
-16
Oct
-16
No
v-16
Dec
-16
Jan-
17
Feb
-17
Mar
-17
Rs./USD
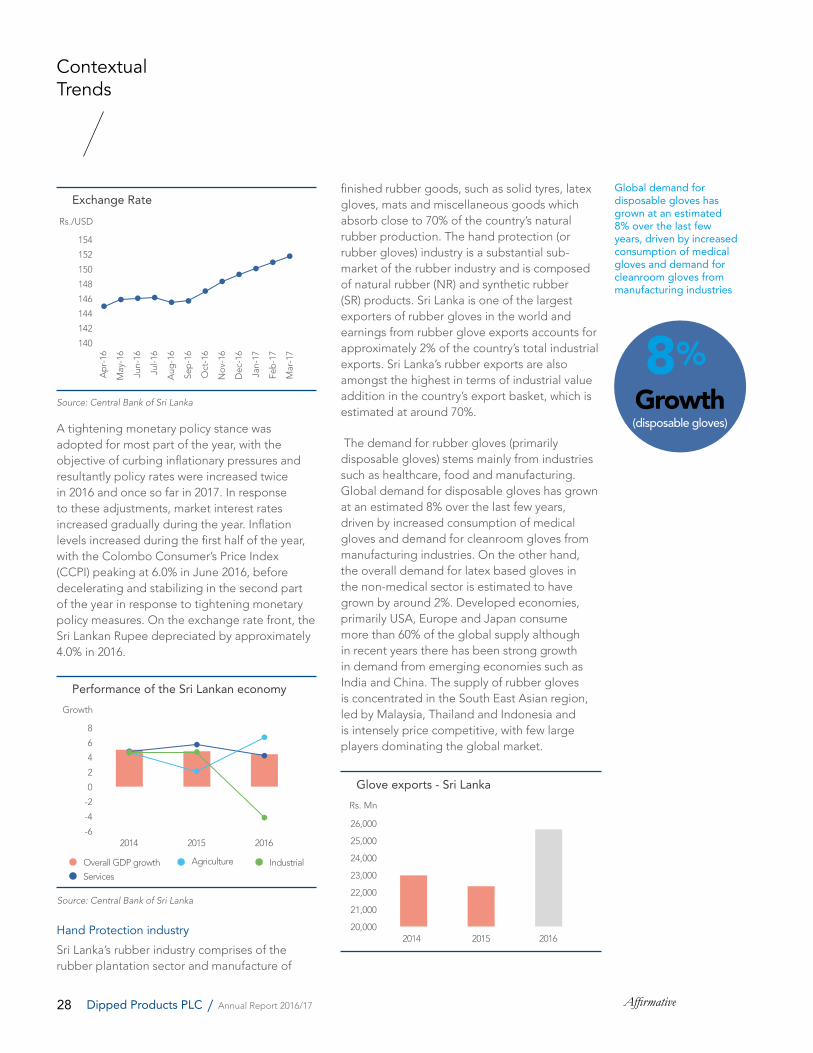
A tightening monetary policy stance was adopted for most part of the year, with the objective of curbing inflationary pressures and resultantly policy rates were increased twice in 2016 and once so far in 2017. In response to these adjustments, market interest rates increased gradually during the year. Inflation levels increased during the first half of the year, with the Colombo Consumer’s Price Index (CCPI) peaking at 6.0% in June 2016, before decelerating and stabilizing in the second part of the year in response to tightening monetary policy measures. On the exchange rate front, the Sri Lankan Rupee depreciated by approximately 4.0% in 2016.
-6
-4
-2
0
2
4
6
8
Performance of the Sri Lankan economy
2014 2015 2016
Growth
Overall GDP growth Agriculture Industrial
Services
Hand Protection industry
Sri Lanka’s rubber industry comprises of the rubber plantation sector and manufacture of
Contextual Trends
finished rubber goods, such as solid tyres, latex gloves, mats and miscellaneous goods which absorb close to 70% of the country’s natural rubber production. The hand protection (or rubber gloves) industry is a substantial sub-market of the rubber industry and is composed of natural rubber (NR) and synthetic rubber (SR) products. Sri Lanka is one of the largest exporters of rubber gloves in the world and earnings from rubber glove exports accounts for approximately 2% of the country’s total industrial exports. Sri Lanka’s rubber exports are also amongst the highest in terms of industrial value addition in the country’s export basket, which is estimated at around 70%.
The demand for rubber gloves (primarily disposable gloves) stems mainly from industries such as healthcare, food and manufacturing. Global demand for disposable gloves has grown at an estimated 8% over the last few years, driven by increased consumption of medical gloves and demand for cleanroom gloves from manufacturing industries. On the other hand, the overall demand for latex based gloves in the non-medical sector is estimated to have grown by around 2%. Developed economies, primarily USA, Europe and Japan consume more than 60% of the global supply although in recent years there has been strong growth in demand from emerging economies such as India and China. The supply of rubber gloves is concentrated in the South East Asian region, led by Malaysia, Thailand and Indonesia and is intensely price competitive, with few large players dominating the global market.
20,000
21,000
22,000
23,000
24,000
25,000
26,000
Glove exports - Sri Lanka
2014 2015 2016
Rs. Mn
8%Growth(disposable gloves)
Global demand for disposable gloves has grown at an estimated 8% over the last few years, driven by increased consumption of medical gloves and demand for cleanroom gloves from manufacturing industries
Source: Central Bank of Sri Lanka
Source: Central Bank of Sri Lanka
29Affirmative Dipped Products PLC / Annual Report 2016/17
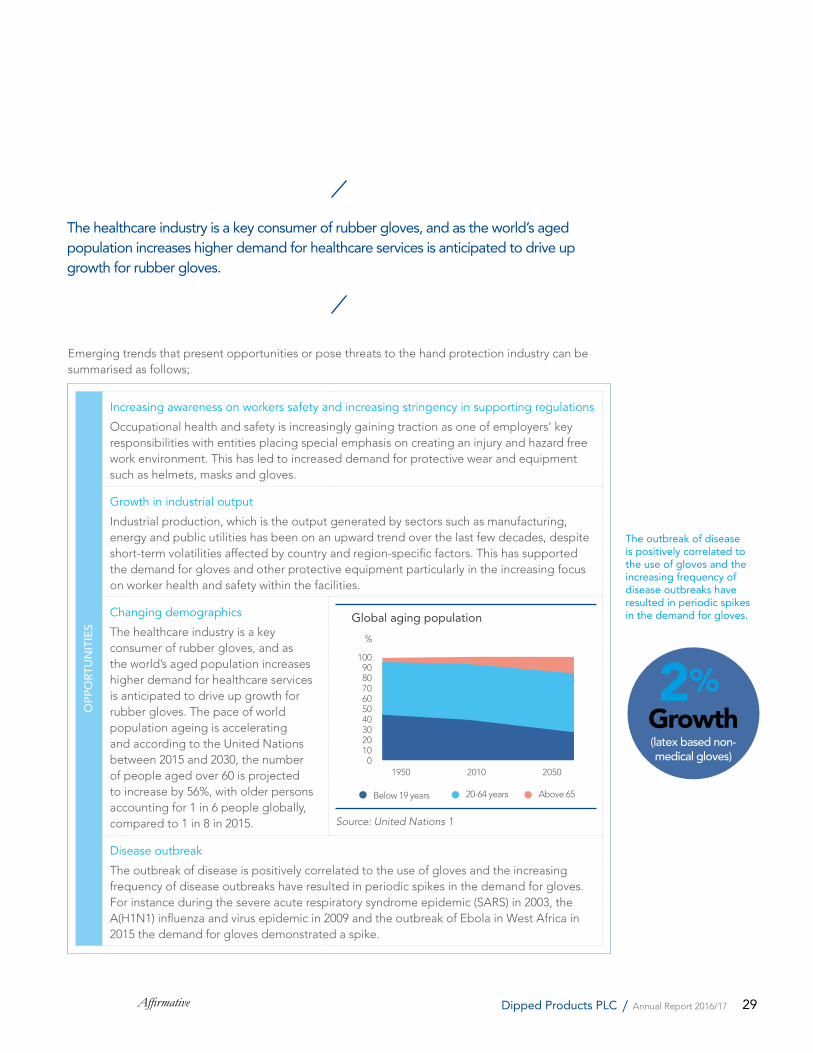
Emerging trends that present opportunities or pose threats to the hand protection industry can be summarised as follows;
2%Growth (latex based non-medical gloves)
The outbreak of disease is positively correlated to the use of gloves and the increasing frequency of disease outbreaks have resulted in periodic spikes in the demand for gloves.
OPP
ORT
UNIT
IES
Increasing awareness on workers safety and increasing stringency in supporting regulations
Occupational health and safety is increasingly gaining traction as one of employers’ key responsibilities with entities placing special emphasis on creating an injury and hazard free work environment. This has led to increased demand for protective wear and equipment such as helmets, masks and gloves.
Growth in industrial output
Industrial production, which is the output generated by sectors such as manufacturing, energy and public utilities has been on an upward trend over the last few decades, despite short-term volatilities affected by country and region-specific factors. This has supported the demand for gloves and other protective equipment particularly in the increasing focus on worker health and safety within the facilities.
Changing demographics
The healthcare industry is a key consumer of rubber gloves, and as the world’s aged population increases higher demand for healthcare services is anticipated to drive up growth for rubber gloves. The pace of world population ageing is accelerating and according to the United Nations between 2015 and 2030, the number of people aged over 60 is projected to increase by 56%, with older persons accounting for 1 in 6 people globally, compared to 1 in 8 in 2015. Source: United Nations 1
0102030405060708090
100
Global aging population
Below 19 years 20-64 years Above 65
1950 2010 2050
%
Disease outbreak
The outbreak of disease is positively correlated to the use of gloves and the increasing frequency of disease outbreaks have resulted in periodic spikes in the demand for gloves. For instance during the severe acute respiratory syndrome epidemic (SARS) in 2003, the A(H1N1) influenza and virus epidemic in 2009 and the outbreak of Ebola in West Africa in 2015 the demand for gloves demonstrated a spike.
The healthcare industry is a key consumer of rubber gloves, and as the world’s aged population increases higher demand for healthcare services is anticipated to drive up growth for rubber gloves.
30 AffirmativeDipped Products PLC / Annual Report 2016/17
OPP
ORT
UNIT
IES
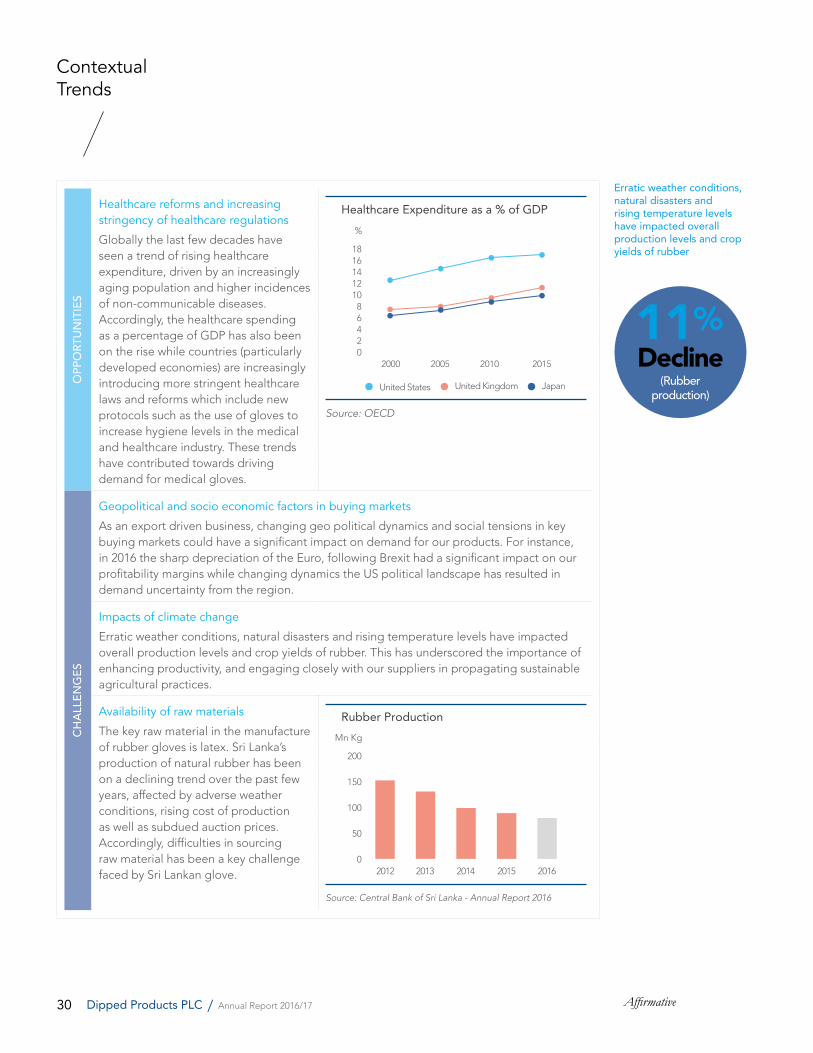
Healthcare reforms and increasing stringency of healthcare regulations
Globally the last few decades have seen a trend of rising healthcare expenditure, driven by an increasingly aging population and higher incidences of non-communicable diseases. Accordingly, the healthcare spending as a percentage of GDP has also been on the rise while countries (particularly developed economies) are increasingly introducing more stringent healthcare laws and reforms which include new protocols such as the use of gloves to increase hygiene levels in the medical and healthcare industry. These trends have contributed towards driving demand for medical gloves.
Source: OECD
02468
1012141618
Healthcare Expenditure as a % of GDP
United States United Kingdom Japan
2000 2005 2010 2015
%
CHAL
LENG
ES
Geopolitical and socio economic factors in buying markets
As an export driven business, changing geo political dynamics and social tensions in key buying markets could have a significant impact on demand for our products. For instance, in 2016 the sharp depreciation of the Euro, following Brexit had a significant impact on our profitability margins while changing dynamics the US political landscape has resulted in demand uncertainty from the region.
Impacts of climate change
Erratic weather conditions, natural disasters and rising temperature levels have impacted overall production levels and crop yields of rubber. This has underscored the importance of enhancing productivity, and engaging closely with our suppliers in propagating sustainable agricultural practices.
Availability of raw materials
The key raw material in the manufacture of rubber gloves is latex. Sri Lanka’s production of natural rubber has been on a declining trend over the past few years, affected by adverse weather conditions, rising cost of production as well as subdued auction prices. Accordingly, difficulties in sourcing raw material has been a key challenge faced by Sri Lankan glove.
0
50
100
150
200
Rubber Production
2012 2013 2014 2015 2016
Mn Kg
Source: Central Bank of Sri Lanka - Annual Report 2016
Erratic weather conditions, natural disasters and rising temperature levels have impacted overall production levels and crop yields of rubber
Contextual Trends
11%Decline
(Rubber production)
31Affirmative Dipped Products PLC / Annual Report 2016/17
CHAL
LENG
ES
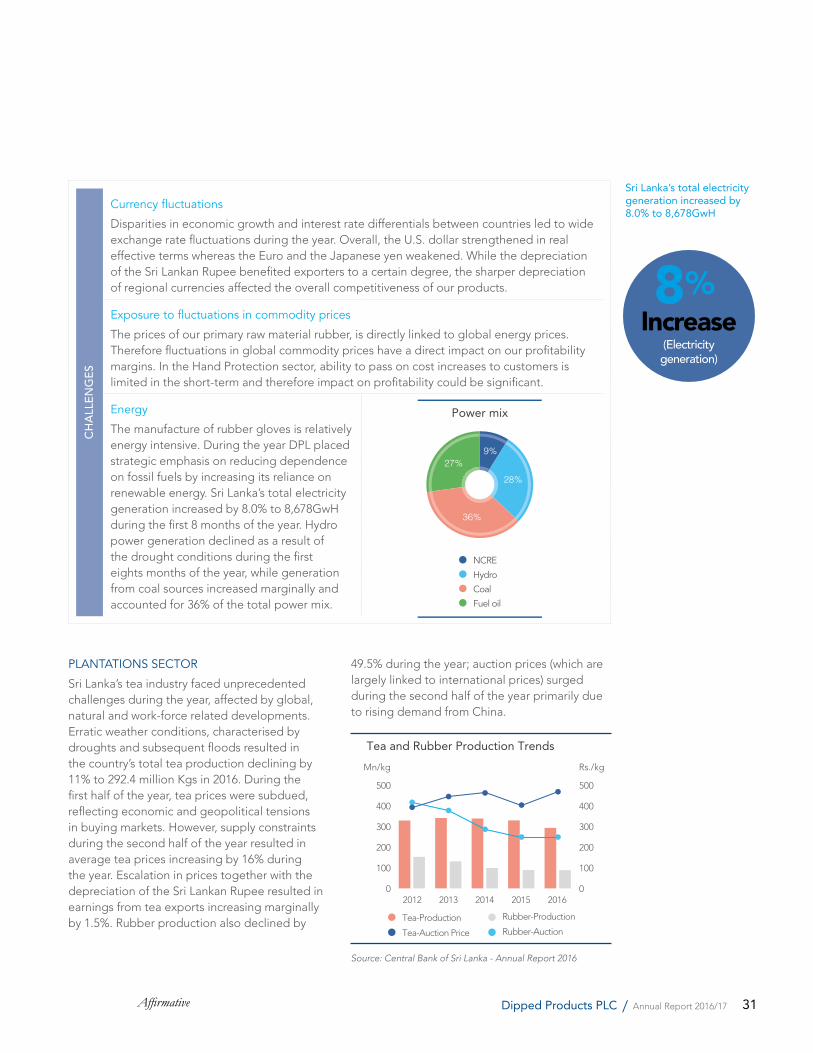
Currency fluctuations
Disparities in economic growth and interest rate differentials between countries led to wide exchange rate fluctuations during the year. Overall, the U.S. dollar strengthened in real effective terms whereas the Euro and the Japanese yen weakened. While the depreciation of the Sri Lankan Rupee benefited exporters to a certain degree, the sharper depreciation of regional currencies affected the overall competitiveness of our products.
Exposure to fluctuations in commodity prices
The prices of our primary raw material rubber, is directly linked to global energy prices. Therefore fluctuations in global commodity prices have a direct impact on our profitability margins. In the Hand Protection sector, ability to pass on cost increases to customers is limited in the short-term and therefore impact on profitability could be significant.
Energy
The manufacture of rubber gloves is relatively energy intensive. During the year DPL placed strategic emphasis on reducing dependence on fossil fuels by increasing its reliance on renewable energy. Sri Lanka’s total electricity generation increased by 8.0% to 8,678GwH during the first 8 months of the year. Hydro power generation declined as a result of the drought conditions during the first eights months of the year, while generation from coal sources increased marginally and accounted for 36% of the total power mix.
Sri Lanka’s total electricity generation increased by 8.0% to 8,678GwH
PLANTATIONS SECTOR
Sri Lanka’s tea industry faced unprecedented challenges during the year, affected by global, natural and work-force related developments. Erratic weather conditions, characterised by droughts and subsequent floods resulted in the country’s total tea production declining by 11% to 292.4 million Kgs in 2016. During the first half of the year, tea prices were subdued, reflecting economic and geopolitical tensions in buying markets. However, supply constraints during the second half of the year resulted in average tea prices increasing by 16% during the year. Escalation in prices together with the depreciation of the Sri Lankan Rupee resulted in earnings from tea exports increasing marginally by 1.5%. Rubber production also declined by
49.5% during the year; auction prices (which are largely linked to international prices) surged during the second half of the year primarily due to rising demand from China.
0
100
200
300
400
500
Tea and Rubber Production Trends
2012 2013 2014 2015 2016
Mn/kg Rs./kg
Tea-Production Rubber-Production
Tea-Auction Price Rubber-Auction
0
100
200
300
400
500
Source: Central Bank of Sri Lanka - Annual Report 2016
Power mix
27%9%
36%
28%
NCRE
Hydro
Coal
Fuel oil
8%Increase
(Electricity generation)
32 AffirmativeDipped Products PLC / Annual Report 2016/17
Our Material Issues
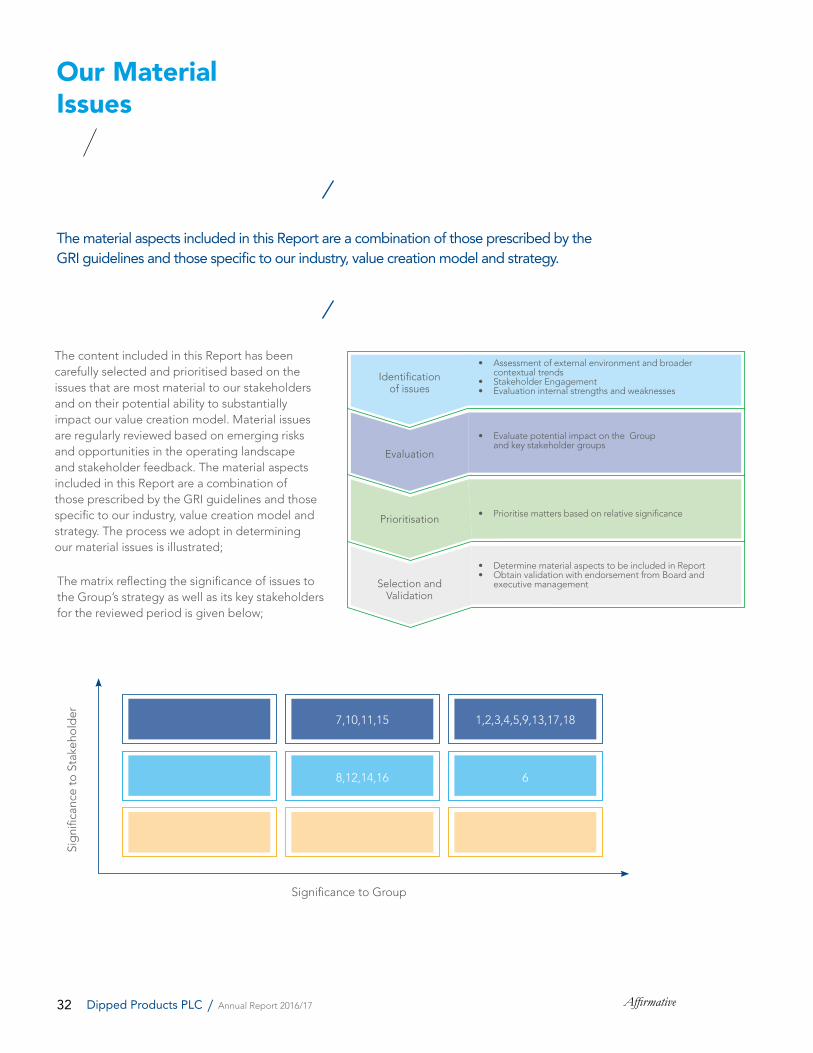
The content included in this Report has been carefully selected and prioritised based on the issues that are most material to our stakeholders and on their potential ability to substantially impact our value creation model. Material issues are regularly reviewed based on emerging risks and opportunities in the operating landscape and stakeholder feedback. The material aspects included in this Report are a combination of those prescribed by the GRI guidelines and those specific to our industry, value creation model and strategy. The process we adopt in determining our material issues is illustrated;
The material aspects included in this Report are a combination of those prescribed by the GRI guidelines and those specific to our industry, value creation model and strategy.
The matrix reflecting the significance of issues to the Group’s strategy as well as its key stakeholders for the reviewed period is given below;
Sig
nific
ance
to S
take
hold
er
Significance to Group
7,10,11,15
8,12,14,16
1,2,3,4,5,9,13,17,18
6
Identification of issues
Evaluation
Prioritisation
Selection and Validation
• Assessment of external environment and broader contextual trends
• Stakeholder Engagement• Evaluation internal strengths and weaknesses
• Evaluate potential impact on the Group and key stakeholder groups
• Prioritise matters based on relative significance
• Determine material aspects to be included in Report• Obtain validation with endorsement from Board and
executive management
33Affirmative Dipped Products PLC / Annual Report 2016/17
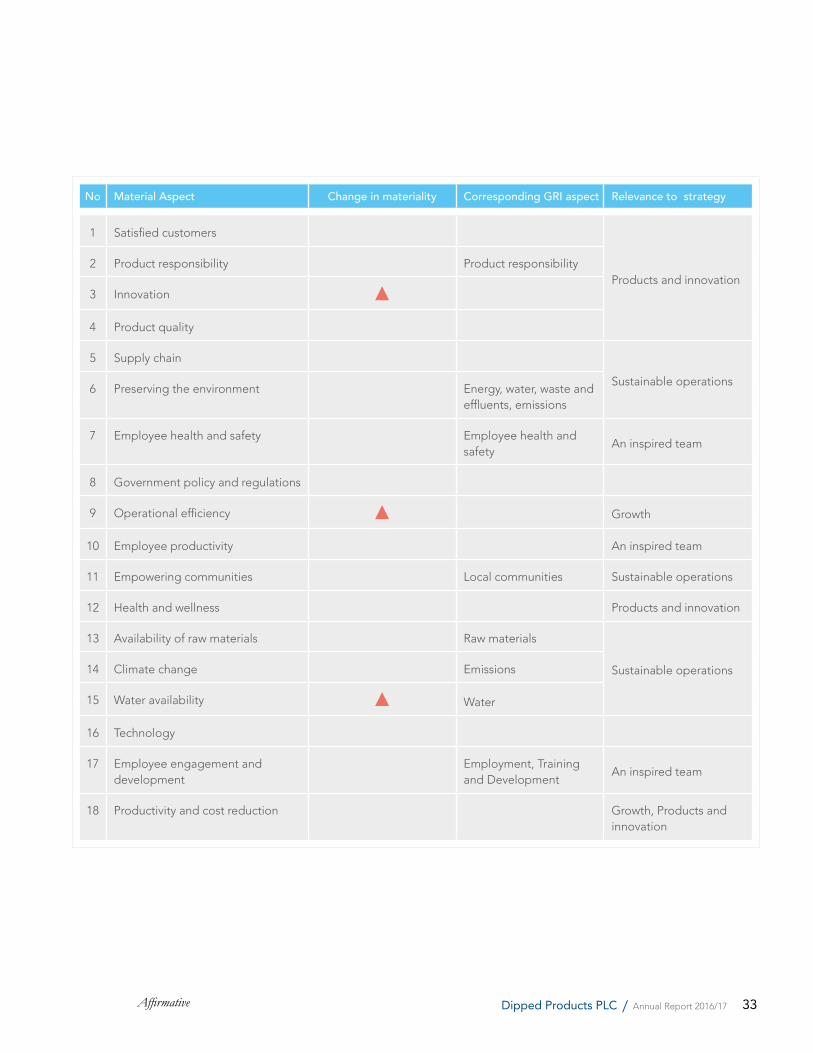
No Material Aspect Change in materiality Corresponding GRI aspect Relevance to strategy
1 Satisfied customers
Products and innovation2 Product responsibility Product responsibility
3 Innovation
4 Product quality
5 Supply chain
Sustainable operations6 Preserving the environment Energy, water, waste and
effluents, emissions
7 Employee health and safety Employee health and safety
An inspired team
8 Government policy and regulations
9 Operational efficiency Growth
10 Employee productivity An inspired team
11 Empowering communities Local communities Sustainable operations
12 Health and wellness Products and innovation
13 Availability of raw materials Raw materials
Sustainable operations14 Climate change Emissions
15 Water availability Water
16 Technology
17 Employee engagement and development
Employment, Training and Development
An inspired team
18 Productivity and cost reduction Growth, Products and innovation
34 AffirmativeDipped Products PLC / Annual Report 2016/17
Managing Risk
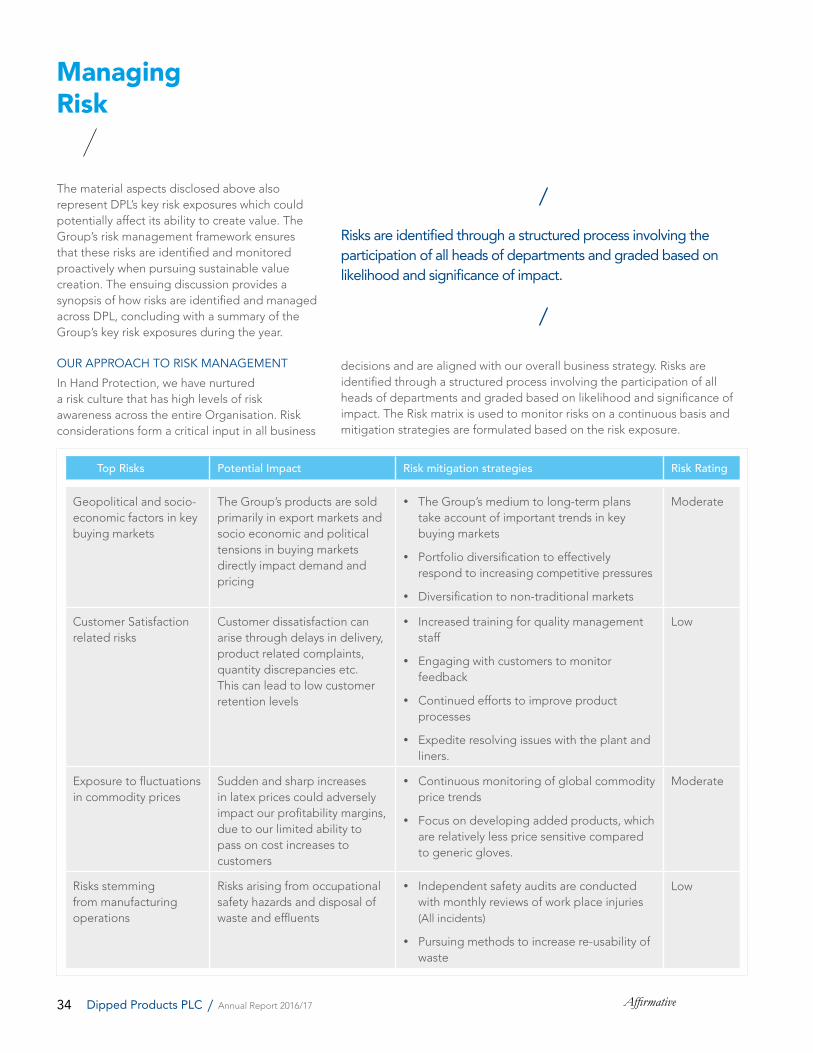
The material aspects disclosed above also represent DPL’s key risk exposures which could potentially affect its ability to create value. The Group’s risk management framework ensures that these risks are identified and monitored proactively when pursuing sustainable value creation. The ensuing discussion provides a synopsis of how risks are identified and managed across DPL, concluding with a summary of the Group’s key risk exposures during the year.
OUR APPROACH TO RISK MANAGEMENT
In Hand Protection, we have nurtured a risk culture that has high levels of risk awareness across the entire Organisation. Risk considerations form a critical input in all business
Top Risks Potential Impact Risk mitigation strategies Risk Rating
Geopolitical and socio-economic factors in key buying markets
The Group’s products are sold primarily in export markets and socio economic and political tensions in buying markets directly impact demand and pricing
The Group’s medium to long-term plans take account of important trends in key buying markets
Portfolio diversification to effectively respond to increasing competitive pressures
Diversification to non-traditional markets
Moderate
Customer Satisfaction related risks
Customer dissatisfaction can arise through delays in delivery, product related complaints, quantity discrepancies etc. This can lead to low customer retention levels
Increased training for quality management staff
Engaging with customers to monitor feedback
Continued efforts to improve product processes
Expedite resolving issues with the plant and liners.
Low
Exposure to fluctuations in commodity prices
Sudden and sharp increases in latex prices could adversely impact our profitability margins, due to our limited ability to pass on cost increases to customers
Continuous monitoring of global commodity price trends
Focus on developing added products, which are relatively less price sensitive compared to generic gloves.
Moderate
Risks stemming from manufacturing operations
Risks arising from occupational safety hazards and disposal of waste and effluents
Independent safety audits are conducted with monthly reviews of work place injuries (All incidents)
Pursuing methods to increase re-usability of waste
Low
decisions and are aligned with our overall business strategy. Risks are identified through a structured process involving the participation of all heads of departments and graded based on likelihood and significance of impact. The Risk matrix is used to monitor risks on a continuous basis and mitigation strategies are formulated based on the risk exposure.
Risks are identified through a structured process involving the participation of all heads of departments and graded based on likelihood and significance of impact.
35Affirmative Dipped Products PLC / Annual Report 2016/17
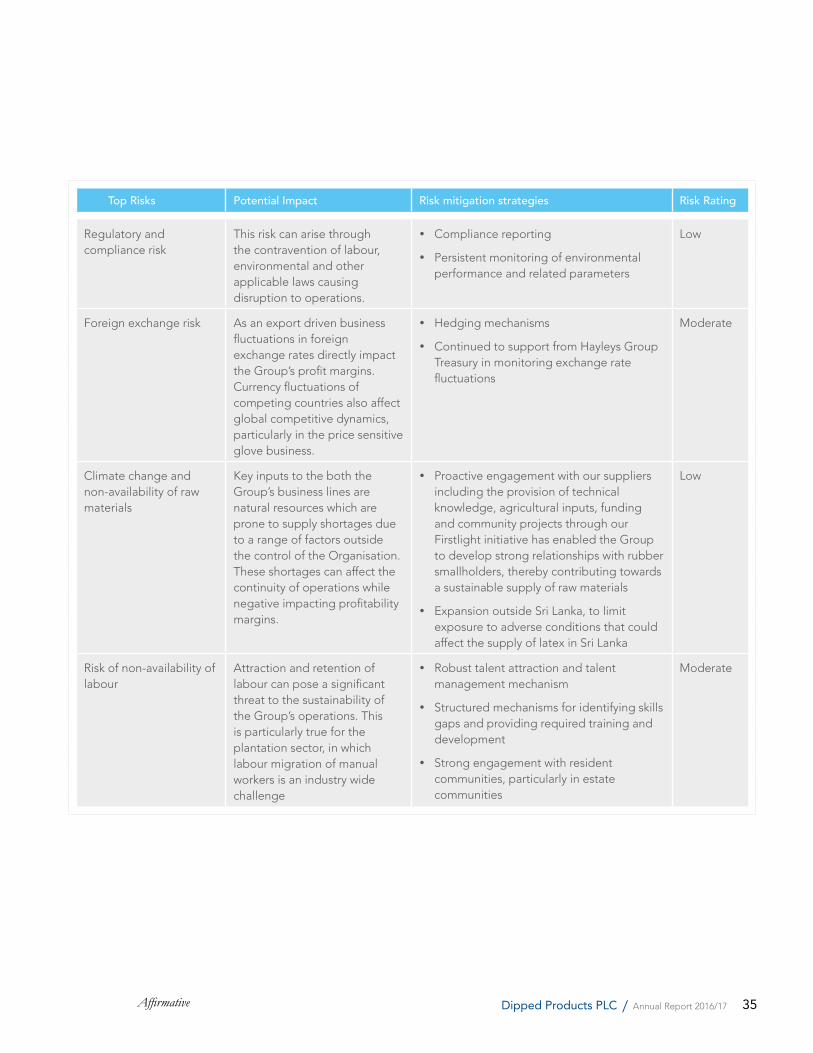
Top Risks Potential Impact Risk mitigation strategies Risk Rating
Regulatory and compliance risk
This risk can arise through the contravention of labour, environmental and other applicable laws causing disruption to operations.
Compliance reporting
Persistent monitoring of environmental performance and related parameters
Low
Foreign exchange risk As an export driven business fluctuations in foreign exchange rates directly impact the Group’s profit margins. Currency fluctuations of competing countries also affect global competitive dynamics, particularly in the price sensitive glove business.
Hedging mechanisms
Continued to support from Hayleys Group Treasury in monitoring exchange rate fluctuations
Moderate
Climate change and non-availability of raw materials
Key inputs to the both the Group’s business lines are natural resources which are prone to supply shortages due to a range of factors outside the control of the Organisation. These shortages can affect the continuity of operations while negative impacting profitability margins.
Proactive engagement with our suppliers including the provision of technical knowledge, agricultural inputs, funding and community projects through our Firstlight initiative has enabled the Group to develop strong relationships with rubber smallholders, thereby contributing towards a sustainable supply of raw materials
Expansion outside Sri Lanka, to limit exposure to adverse conditions that could affect the supply of latex in Sri Lanka
Low
Risk of non-availability of labour
Attraction and retention of labour can pose a significant threat to the sustainability of the Group’s operations. This is particularly true for the plantation sector, in which labour migration of manual workers is an industry wide challenge
Robust talent attraction and talent management mechanism
Structured mechanisms for identifying skills gaps and providing required training and development
Strong engagement with resident communities, particularly in estate communities
Moderate
36 AffirmativeDipped Products PLC / Annual Report 2016/17
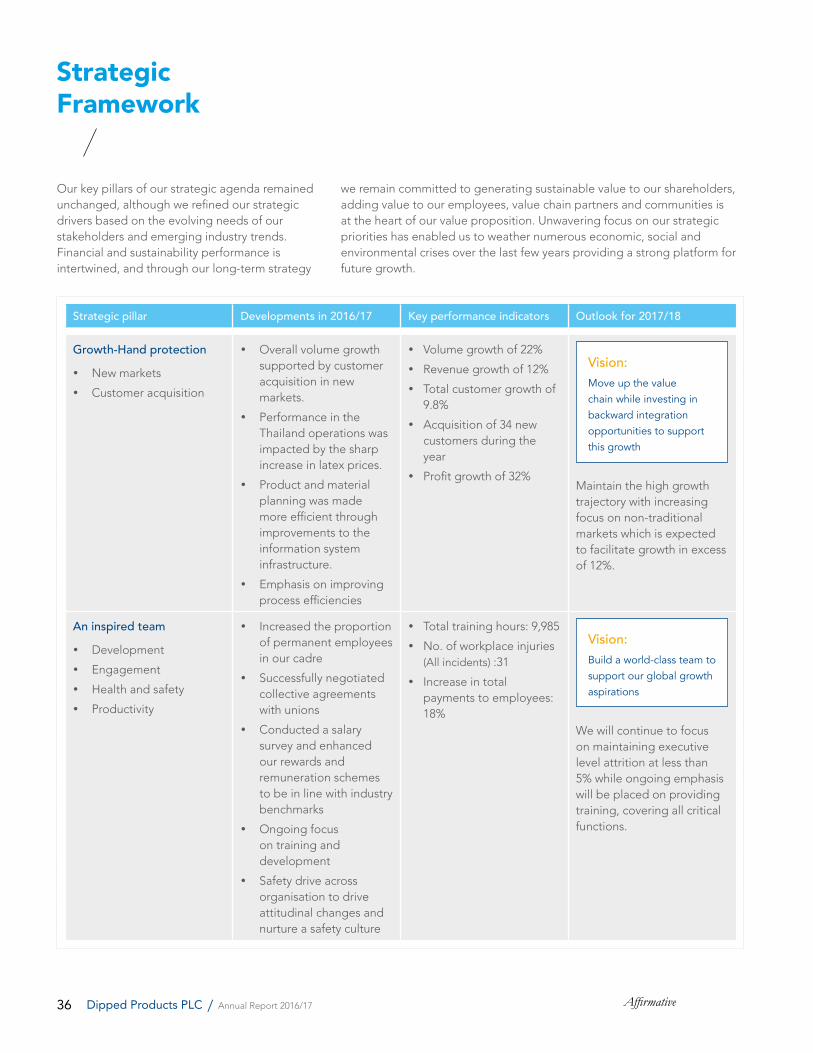
Strategic pillar Developments in 2016/17 Key performance indicators Outlook for 2017/18
Growth-Hand protection New markets
Customer acquisition
Overall volume growth supported by customer acquisition in new markets.
Performance in the Thailand operations was impacted by the sharp increase in latex prices.
Product and material planning was made more efficient through improvements to the information system infrastructure.
Emphasis on improving process efficiencies
Volume growth of 22%
Revenue growth of 12%
Total customer growth of 9.8%
Acquisition of 34 new customers during the year
Profit growth of 32%
Vision: Move up the value chain while investing in backward integration opportunities to support this growth
Maintain the high growth trajectory with increasing focus on non-traditional markets which is expected to facilitate growth in excess of 12%.
An inspired team Development
Engagement
Health and safety
Productivity
Increased the proportion of permanent employees in our cadre
Successfully negotiated collective agreements with unions
Conducted a salary survey and enhanced our rewards and remuneration schemes to be in line with industry benchmarks
Ongoing focus on training and development
Safety drive across organisation to drive attitudinal changes and nurture a safety culture
Total training hours: 9,985
No. of workplace injuries (All incidents) :31
Increase in total payments to employees: 18%
Vision: Build a world-class team to support our global growth aspirations
We will continue to focus on maintaining executive level attrition at less than 5% while ongoing emphasis will be placed on providing training, covering all critical functions.
Strategic Framework
Our key pillars of our strategic agenda remained unchanged, although we refined our strategic drivers based on the evolving needs of our stakeholders and emerging industry trends. Financial and sustainability performance is intertwined, and through our long-term strategy
we remain committed to generating sustainable value to our shareholders, adding value to our employees, value chain partners and communities is at the heart of our value proposition. Unwavering focus on our strategic priorities has enabled us to weather numerous economic, social and environmental crises over the last few years providing a strong platform for future growth.
37Affirmative Dipped Products PLC / Annual Report 2016/17
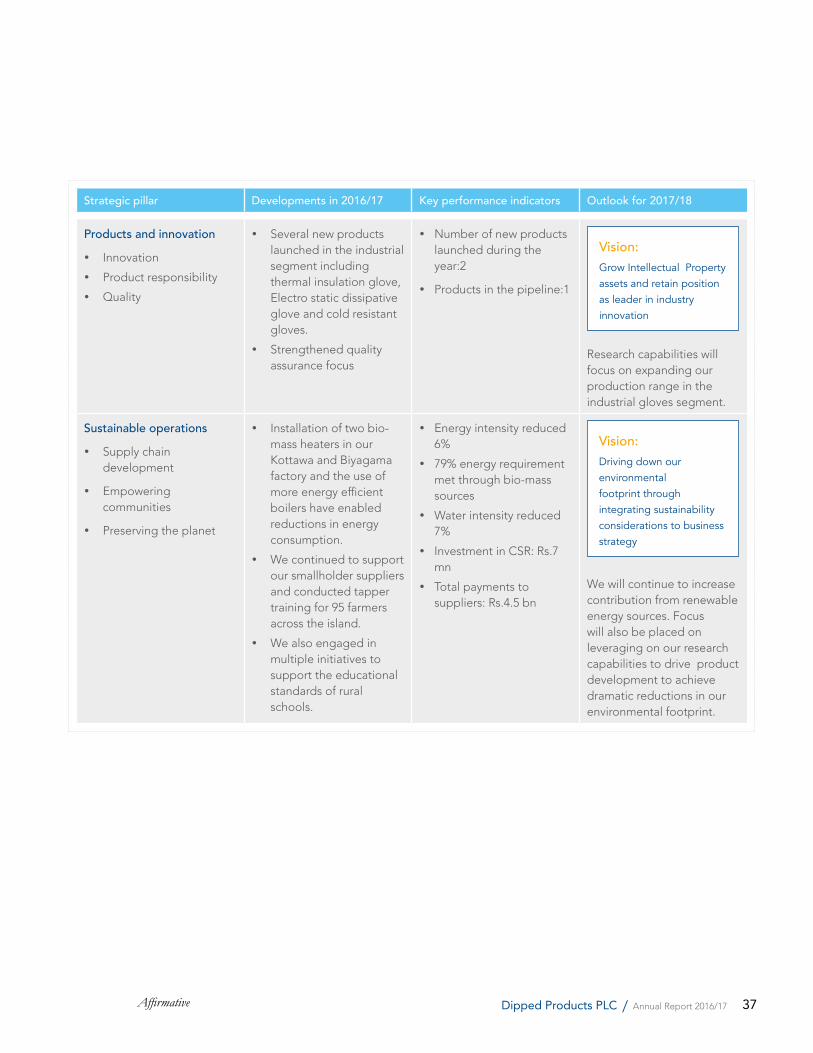
Strategic pillar Developments in 2016/17 Key performance indicators Outlook for 2017/18
Products and innovation Innovation
Product responsibility
Quality
Several new products launched in the industrial segment including thermal insulation glove, Electro static dissipative glove and cold resistant gloves.
Strengthened quality assurance focus
Number of new products launched during the year:2
Products in the pipeline:1
Vision: Grow Intellectual Property assets and retain position as leader in industry innovation
Research capabilities will focus on expanding our production range in the industrial gloves segment.
Sustainable operations Supply chain
development
Empowering communities
Preserving the planet
Installation of two bio-mass heaters in our Kottawa and Biyagama factory and the use of more energy efficient boilers have enabled reductions in energy consumption.
We continued to support our smallholder suppliers and conducted tapper training for 95 farmers across the island.
We also engaged in multiple initiatives to support the educational standards of rural schools.
Energy intensity reduced 6%
79% energy requirement met through bio-mass sources
Water intensity reduced 7%
Investment in CSR: Rs.7 mn
Total payments to suppliers: Rs.4.5 bn
Vision: Driving down our environmental footprint through integrating sustainability considerations to business strategy
We will continue to increase contribution from renewable energy sources. Focus will also be placed on leveraging on our research capabilities to drive product development to achieve dramatic reductions in our environmental footprint.
38 AffirmativeDipped Products PLC / Annual Report 2016/17
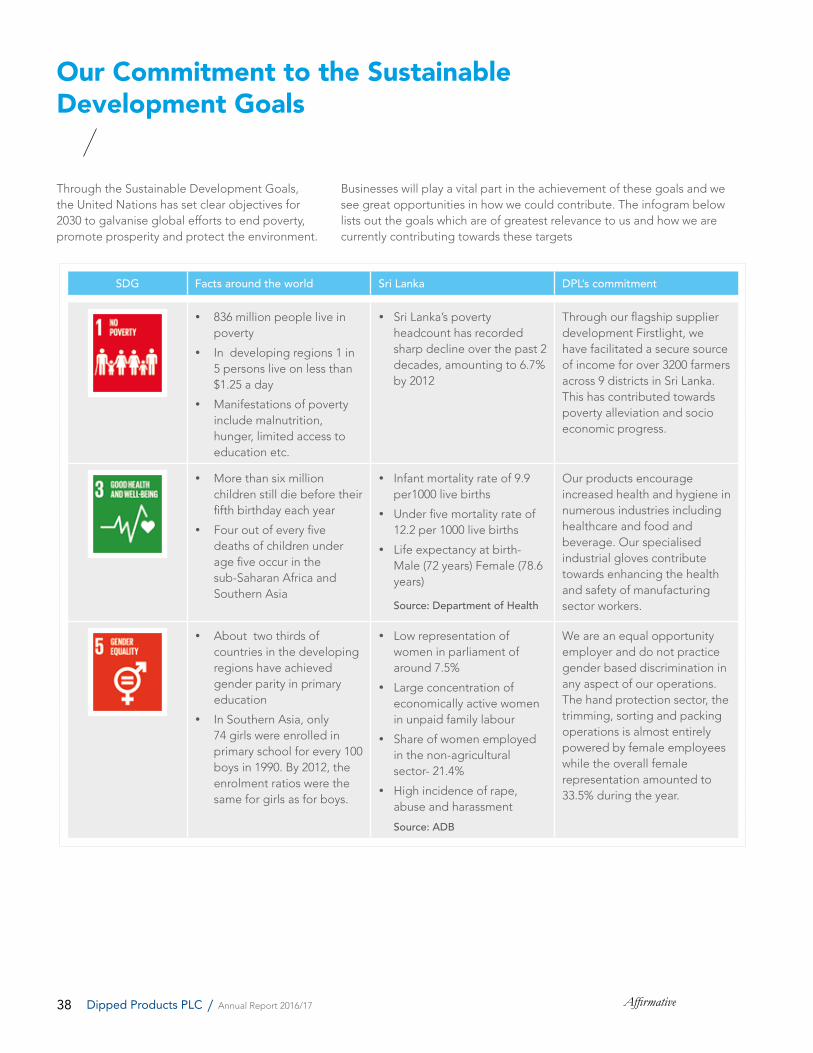
Through the Sustainable Development Goals, the United Nations has set clear objectives for 2030 to galvanise global efforts to end poverty, promote prosperity and protect the environment.
Our Commitment to the Sustainable Development Goals
SDG Facts around the world Sri Lanka DPL’s commitment
836 million people live in poverty
In developing regions 1 in 5 persons live on less than $1.25 a day
Manifestations of poverty include malnutrition, hunger, limited access to education etc.
Sri Lanka’s poverty headcount has recorded sharp decline over the past 2 decades, amounting to 6.7% by 2012
Through our flagship supplier development Firstlight, we have facilitated a secure source of income for over 3200 farmers across 9 districts in Sri Lanka. This has contributed towards poverty alleviation and socio economic progress.
More than six million children still die before their fifth birthday each year
Four out of every five deaths of children under age five occur in the sub-Saharan Africa and Southern Asia
Infant mortality rate of 9.9 per1000 live births
Under five mortality rate of 12.2 per 1000 live births
Life expectancy at birth- Male (72 years) Female (78.6 years)
Source: Department of Health
Our products encourage increased health and hygiene in numerous industries including healthcare and food and beverage. Our specialised industrial gloves contribute towards enhancing the health and safety of manufacturing sector workers.
About two thirds of countries in the developing regions have achieved gender parity in primary education
In Southern Asia, only 74 girls were enrolled in primary school for every 100 boys in 1990. By 2012, the enrolment ratios were the same for girls as for boys.
Low representation of women in parliament of around 7.5%
Large concentration of economically active women in unpaid family labour
Share of women employed in the non-agricultural sector- 21.4%
High incidence of rape, abuse and harassment
Source: ADB
We are an equal opportunity employer and do not practice gender based discrimination in any aspect of our operations. The hand protection sector, the trimming, sorting and packing operations is almost entirely powered by female employees while the overall female representation amounted to 33.5% during the year.
Businesses will play a vital part in the achievement of these goals and we see great opportunities in how we could contribute. The infogram below lists out the goals which are of greatest relevance to us and how we are currently contributing towards these targets
39Affirmative Dipped Products PLC / Annual Report 2016/17
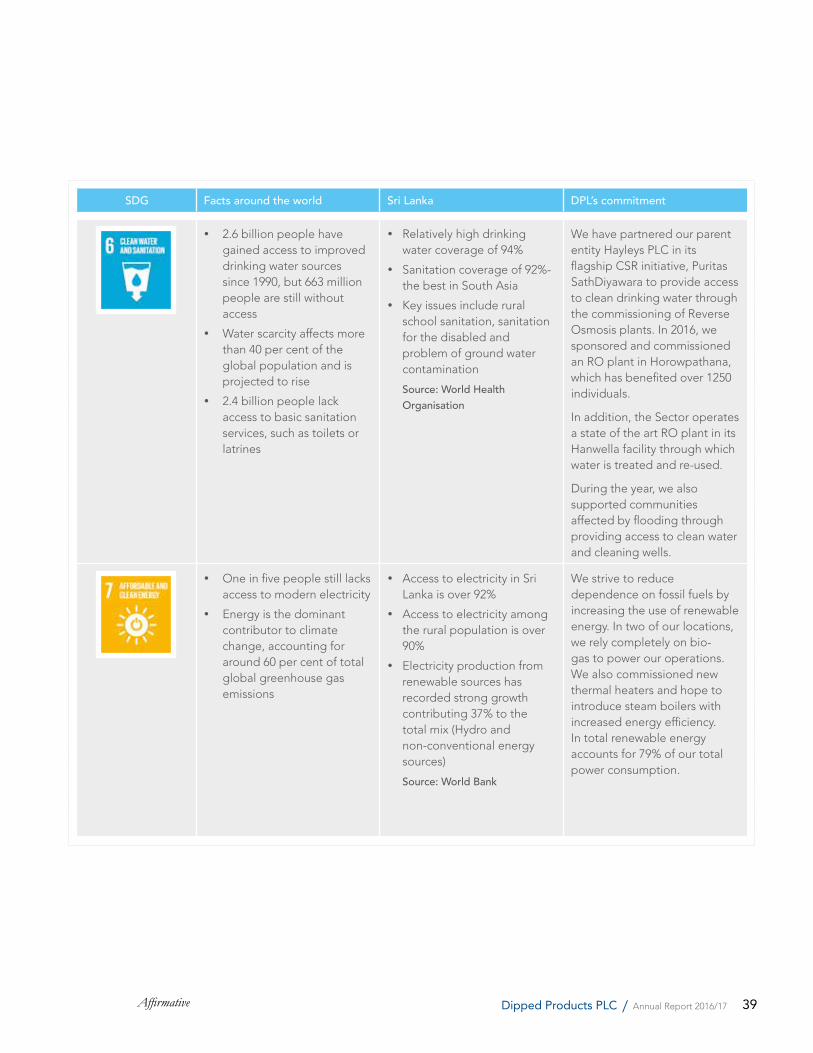
SDG Facts around the world Sri Lanka DPL’s commitment
2.6 billion people have gained access to improved drinking water sources since 1990, but 663 million people are still without access
Water scarcity affects more than 40 per cent of the global population and is projected to rise
2.4 billion people lack access to basic sanitation services, such as toilets or latrines
Relatively high drinking water coverage of 94%
Sanitation coverage of 92%- the best in South Asia
Key issues include rural school sanitation, sanitation for the disabled and problem of ground water contamination
Source: World Health Organisation
We have partnered our parent entity Hayleys PLC in its flagship CSR initiative, Puritas SathDiyawara to provide access to clean drinking water through the commissioning of Reverse Osmosis plants. In 2016, we sponsored and commissioned an RO plant in Horowpathana, which has benefited over 1250 individuals.
In addition, the Sector operates a state of the art RO plant in its Hanwella facility through which water is treated and re-used.
During the year, we also supported communities affected by flooding through providing access to clean water and cleaning wells.
One in five people still lacks access to modern electricity
Energy is the dominant contributor to climate change, accounting for around 60 per cent of total global greenhouse gas emissions
Access to electricity in Sri Lanka is over 92%
Access to electricity among the rural population is over 90%
Electricity production from renewable sources has recorded strong growth contributing 37% to the total mix (Hydro and non-conventional energy sources)
Source: World Bank
We strive to reduce dependence on fossil fuels by increasing the use of renewable energy. In two of our locations, we rely completely on bio-gas to power our operations. We also commissioned new thermal heaters and hope to introduce steam boilers with increased energy efficiency. In total renewable energy accounts for 79% of our total power consumption.
40 AffirmativeDipped Products PLC / Annual Report 2016/17
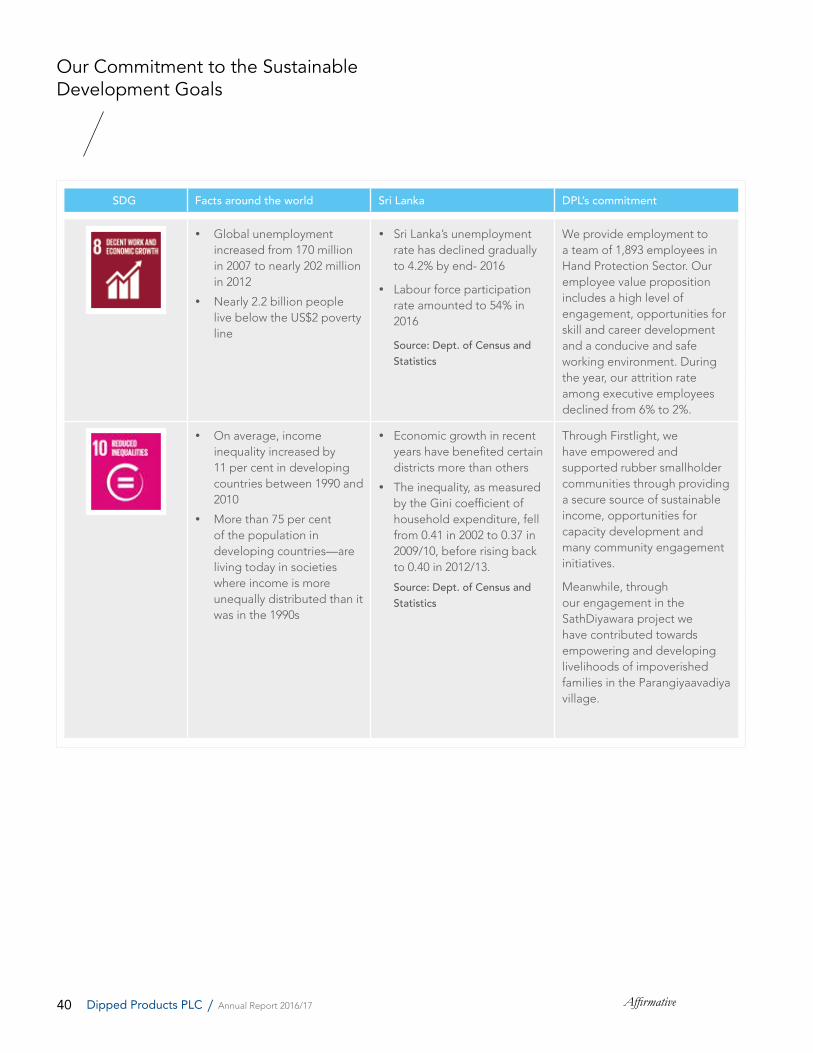
SDG Facts around the world Sri Lanka DPL’s commitment
Global unemployment increased from 170 million in 2007 to nearly 202 million in 2012
Nearly 2.2 billion people live below the US$2 poverty line
Sri Lanka’s unemployment rate has declined gradually to 4.2% by end- 2016
Labour force participation rate amounted to 54% in 2016
Source: Dept. of Census and Statistics
We provide employment to a team of 1,893 employees in Hand Protection Sector. Our employee value proposition includes a high level of engagement, opportunities for skill and career development and a conducive and safe working environment. During the year, our attrition rate among executive employees declined from 6% to 2%.
On average, income inequality increased by 11 per cent in developing countries between 1990 and 2010
More than 75 per cent of the population in developing countries—are living today in societies where income is more unequally distributed than it was in the 1990s
Economic growth in recent years have benefited certain districts more than others
The inequality, as measured by the Gini coefficient of household expenditure, fell from 0.41 in 2002 to 0.37 in 2009/10, before rising back to 0.40 in 2012/13.
Source: Dept. of Census and Statistics
Through Firstlight, we have empowered and supported rubber smallholder communities through providing a secure source of sustainable income, opportunities for capacity development and many community engagement initiatives.
Meanwhile, through our engagement in the SathDiyawara project we have contributed towards empowering and developing livelihoods of impoverished families in the Parangiyaavadiya village.
Our Commitment to the Sustainable Development Goals
41Affirmative Dipped Products PLC / Annual Report 2016/17
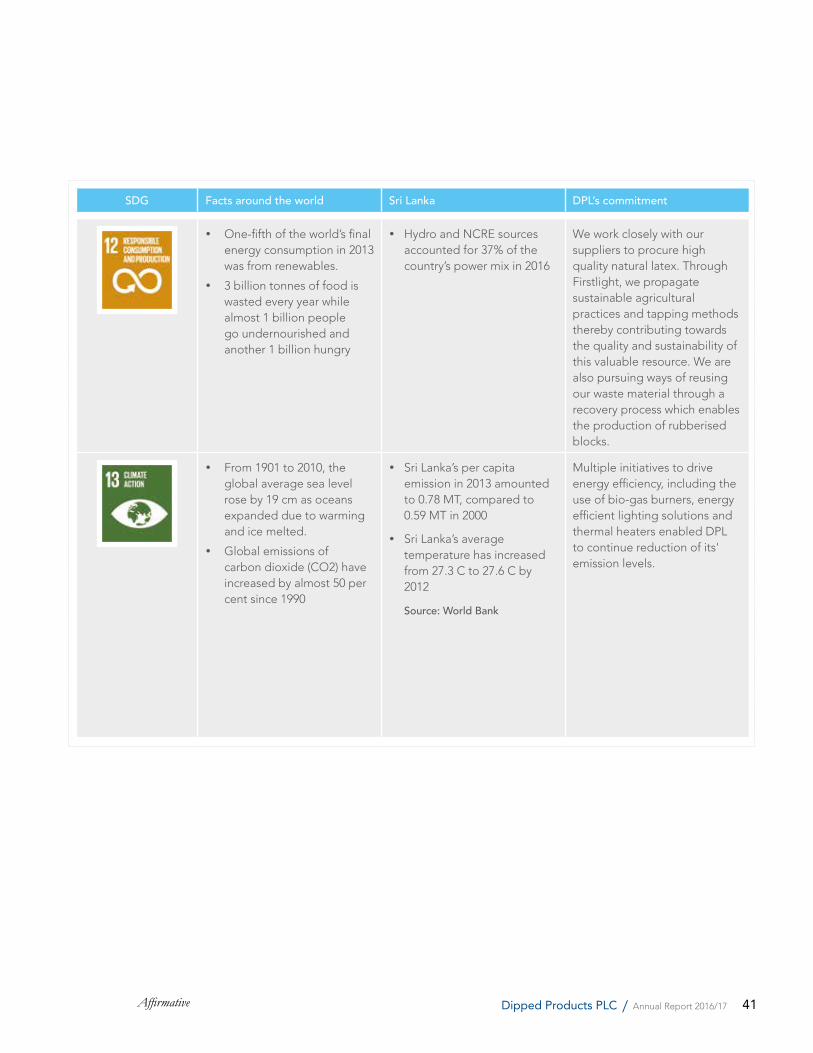
SDG Facts around the world Sri Lanka DPL’s commitment
One-fifth of the world’s final energy consumption in 2013 was from renewables.
3 billion tonnes of food is wasted every year while almost 1 billion people go undernourished and another 1 billion hungry
Hydro and NCRE sources accounted for 37% of the country’s power mix in 2016
We work closely with our suppliers to procure high quality natural latex. Through Firstlight, we propagate sustainable agricultural practices and tapping methods thereby contributing towards the quality and sustainability of this valuable resource. We are also pursuing ways of reusing our waste material through a recovery process which enables the production of rubberised blocks.
From 1901 to 2010, the global average sea level rose by 19 cm as oceans expanded due to warming and ice melted.
Global emissions of carbon dioxide (CO2) have increased by almost 50 per cent since 1990
Sri Lanka’s per capita emission in 2013 amounted to 0.78 MT, compared to 0.59 MT in 2000
Sri Lanka’s average temperature has increased from 27.3 C to 27.6 C by 2012
Source: World Bank
Multiple initiatives to drive energy efficiency, including the use of bio-gas burners, energy efficient lighting solutions and thermal heaters enabled DPL to continue reduction of its' emission levels.
42 AffirmativeDipped Products PLC / Annual Report 2016/17
Operational Review
HAND PROTECTION
Rs. mn 2017 2016 Y-o-y change(%)
Revenue 14,285 12,728 12%
Pre-tax profit 785 595 32%
Total assets 11,680 11,617 1%
Capital expenditure 415 835 -50%
Operating cash flow 276 857 -68%
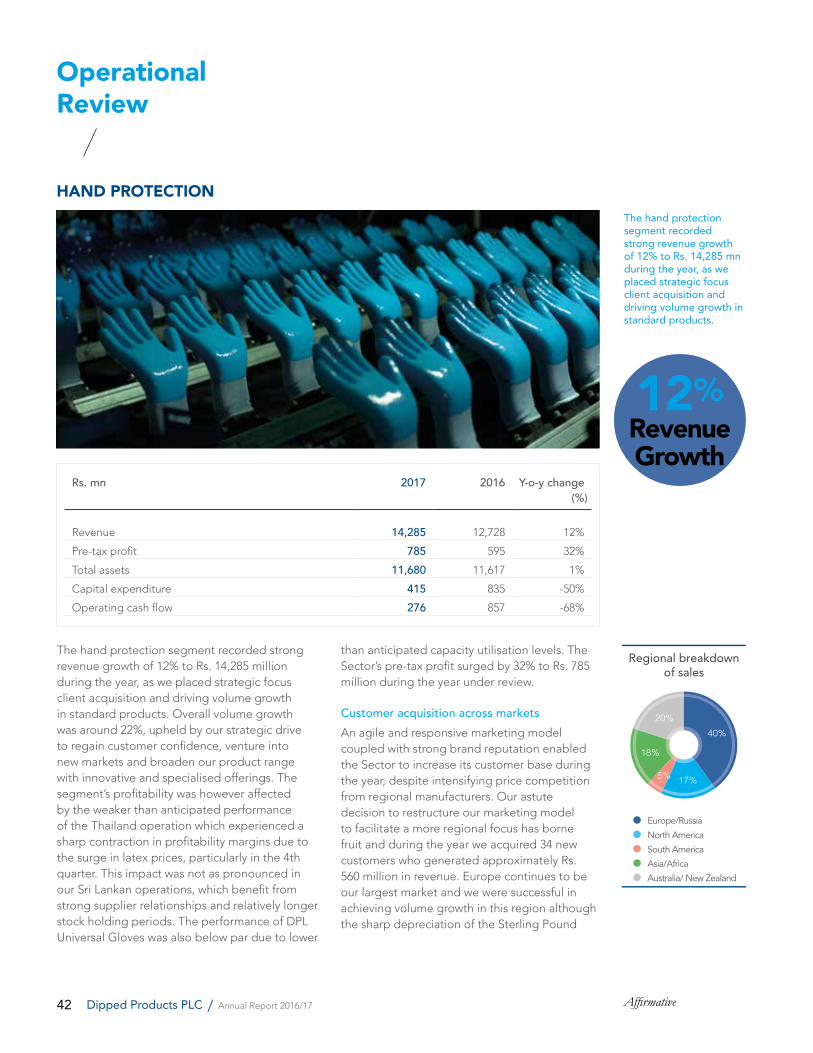
The hand protection segment recorded strong revenue growth of 12% to Rs. 14,285 mn during the year, as we placed strategic focus client acquisition and driving volume growth in standard products.
The hand protection segment recorded strong revenue growth of 12% to Rs. 14,285 million during the year, as we placed strategic focus client acquisition and driving volume growth in standard products. Overall volume growth was around 22%, upheld by our strategic drive to regain customer confidence, venture into new markets and broaden our product range with innovative and specialised offerings. The segment’s profitability was however affected by the weaker than anticipated performance of the Thailand operation which experienced a sharp contraction in profitability margins due to the surge in latex prices, particularly in the 4th quarter. This impact was not as pronounced in our Sri Lankan operations, which benefit from strong supplier relationships and relatively longer stock holding periods. The performance of DPL Universal Gloves was also below par due to lower
than anticipated capacity utilisation levels. The Sector’s pre-tax profit surged by 32% to Rs. 785 million during the year under review.
Customer acquisition across marketsAn agile and responsive marketing model coupled with strong brand reputation enabled the Sector to increase its customer base during the year, despite intensifying price competition from regional manufacturers. Our astute decision to restructure our marketing model to facilitate a more regional focus has borne fruit and during the year we acquired 34 new customers who generated approximately Rs. 560 million in revenue. Europe continues to be our largest market and we were successful in achieving volume growth in this region although the sharp depreciation of the Sterling Pound
Regional breakdownof sales
18%
20%40%
5% 17%
Europe/Russia
North America
South America
Asia/Africa
Australia/ New Zealand
12%RevenueGrowth
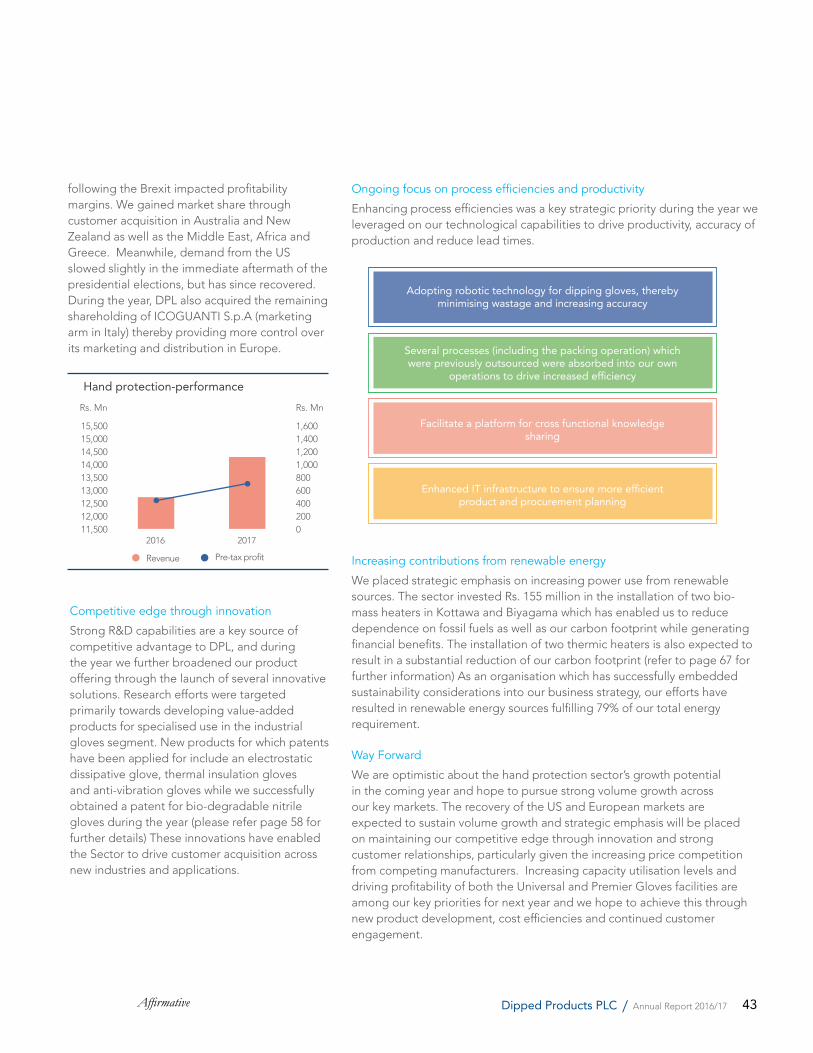
43Affirmative Dipped Products PLC / Annual Report 2016/17
Competitive edge through innovation
Strong R&D capabilities are a key source of competitive advantage to DPL, and during the year we further broadened our product offering through the launch of several innovative solutions. Research efforts were targeted primarily towards developing value-added products for specialised use in the industrial gloves segment. New products for which patents have been applied for include an electrostatic dissipative glove, thermal insulation gloves and anti-vibration gloves while we successfully obtained a patent for bio-degradable nitrile gloves during the year (please refer page 58 for further details) These innovations have enabled the Sector to drive customer acquisition across new industries and applications.
Adopting robotic technology for dipping gloves, thereby minimising wastage and increasing accuracy
Several processes (including the packing operation) which were previously outsourced were absorbed into our own
operations to drive increased efficiency
Facilitate a platform for cross functional knowledge sharing
Enhanced IT infrastructure to ensure more efficient product and procurement planning
following the Brexit impacted profitability margins. We gained market share through customer acquisition in Australia and New Zealand as well as the Middle East, Africa and Greece. Meanwhile, demand from the US slowed slightly in the immediate aftermath of the presidential elections, but has since recovered. During the year, DPL also acquired the remaining shareholding of ICOGUANTI S.p.A (marketing arm in Italy) thereby providing more control over its marketing and distribution in Europe.
11,50012,00012,50013,00013,50014,00014,50015,00015,500
Hand protection-performance
2016 2017
Rs. Mn Rs. Mn
Revenue Pre-tax profit
02004006008001,0001,2001,4001,600
Ongoing focus on process efficiencies and productivity
Enhancing process efficiencies was a key strategic priority during the year we leveraged on our technological capabilities to drive productivity, accuracy of production and reduce lead times.
Increasing contributions from renewable energy
We placed strategic emphasis on increasing power use from renewable sources. The sector invested Rs. 155 million in the installation of two bio-mass heaters in Kottawa and Biyagama which has enabled us to reduce dependence on fossil fuels as well as our carbon footprint while generating financial benefits. The installation of two thermic heaters is also expected to result in a substantial reduction of our carbon footprint (refer to page 67 for further information) As an organisation which has successfully embedded sustainability considerations into our business strategy, our efforts have resulted in renewable energy sources fulfilling 79% of our total energy requirement.
Way Forward
We are optimistic about the hand protection sector’s growth potential in the coming year and hope to pursue strong volume growth across our key markets. The recovery of the US and European markets are expected to sustain volume growth and strategic emphasis will be placed on maintaining our competitive edge through innovation and strong customer relationships, particularly given the increasing price competition from competing manufacturers. Increasing capacity utilisation levels and driving profitability of both the Universal and Premier Gloves facilities are among our key priorities for next year and we hope to achieve this through new product development, cost efficiencies and continued customer engagement.
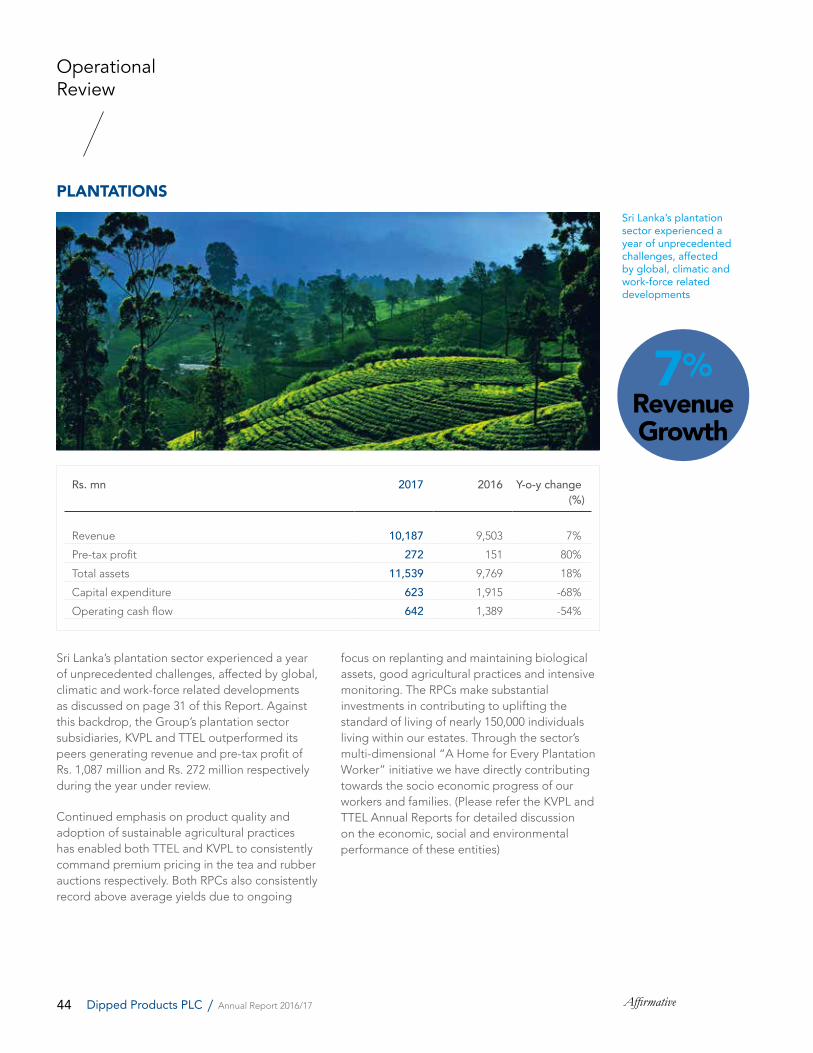
44 AffirmativeDipped Products PLC / Annual Report 2016/17
Operational Review
PLANTATIONS
Rs. mn 2017 2016 Y-o-y change(%)
Revenue 10,187 9,503 7%
Pre-tax profit 272 151 80%
Total assets 11,539 9,769 18%
Capital expenditure 623 1,915 -68%
Operating cash flow 642 1,389 -54%
Sri Lanka’s plantation sector experienced a year of unprecedented challenges, affected by global, climatic and work-force related developments as discussed on page 31 of this Report. Against this backdrop, the Group’s plantation sector subsidiaries, KVPL and TTEL outperformed its peers generating revenue and pre-tax profit of Rs. 1,087 million and Rs. 272 million respectively during the year under review.
Continued emphasis on product quality and adoption of sustainable agricultural practices has enabled both TTEL and KVPL to consistently command premium pricing in the tea and rubber auctions respectively. Both RPCs also consistently record above average yields due to ongoing
Sri Lanka’s plantation sector experienced a year of unprecedented challenges, affected by global, climatic and work-force related developments
focus on replanting and maintaining biological assets, good agricultural practices and intensive monitoring. The RPCs make substantial investments in contributing to uplifting the standard of living of nearly 150,000 individuals living within our estates. Through the sector’s multi-dimensional “A Home for Every Plantation Worker” initiative we have directly contributing towards the socio economic progress of our workers and families. (Please refer the KVPL and TTEL Annual Reports for detailed discussion on the economic, social and environmental performance of these entities)
7%RevenueGrowth
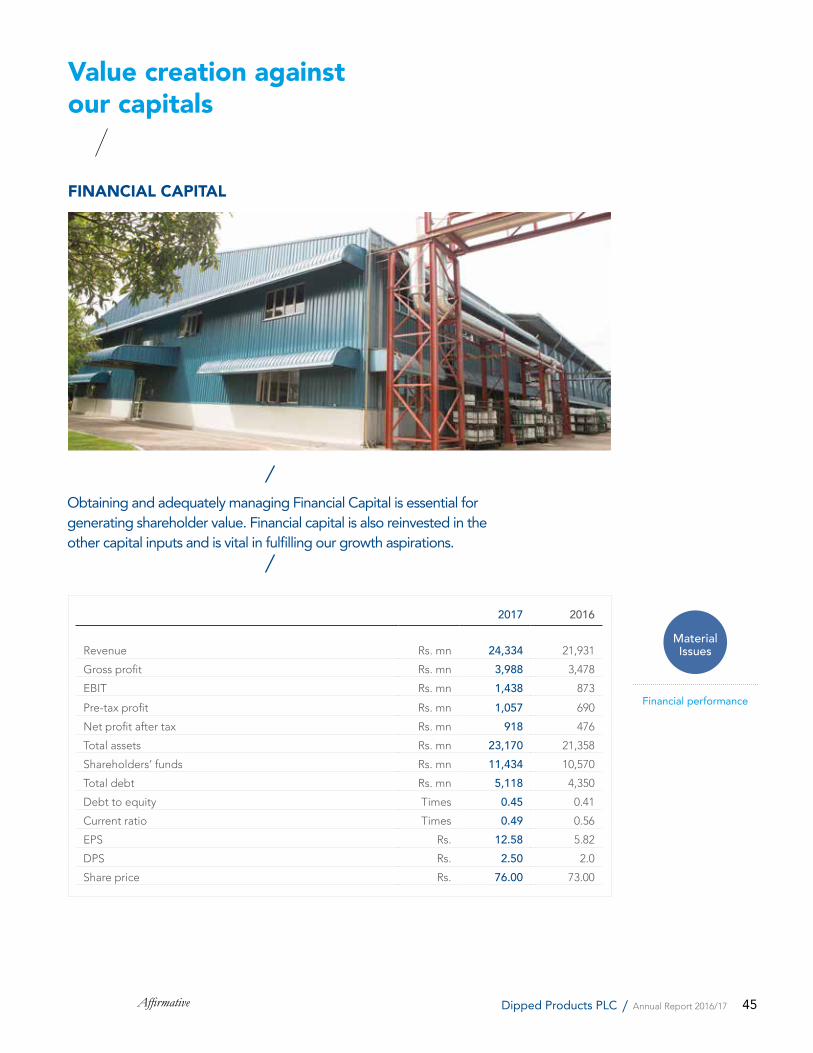
45Affirmative Dipped Products PLC / Annual Report 2016/17
Obtaining and adequately managing Financial Capital is essential for generating shareholder value. Financial capital is also reinvested in the other capital inputs and is vital in fulfilling our growth aspirations.
Value creation against our capitals
FINANCIAL CAPITAL
2017 2016
Revenue Rs. mn 24,334 21,931
Gross profit Rs. mn 3,988 3,478
EBIT Rs. mn 1,438 873
Pre-tax profit Rs. mn 1,057 690
Net profit after tax Rs. mn 918 476
Total assets Rs. mn 23,170 21,358
Shareholders’ funds Rs. mn 11,434 10,570
Total debt Rs. mn 5,118 4,350
Debt to equity Times 0.45 0.41
Current ratio Times 0.49 0.56
EPS Rs. 12.58 5.82
DPS Rs. 2.50 2.0
Share price Rs. 76.00 73.00
Financial performance
MaterialIssues
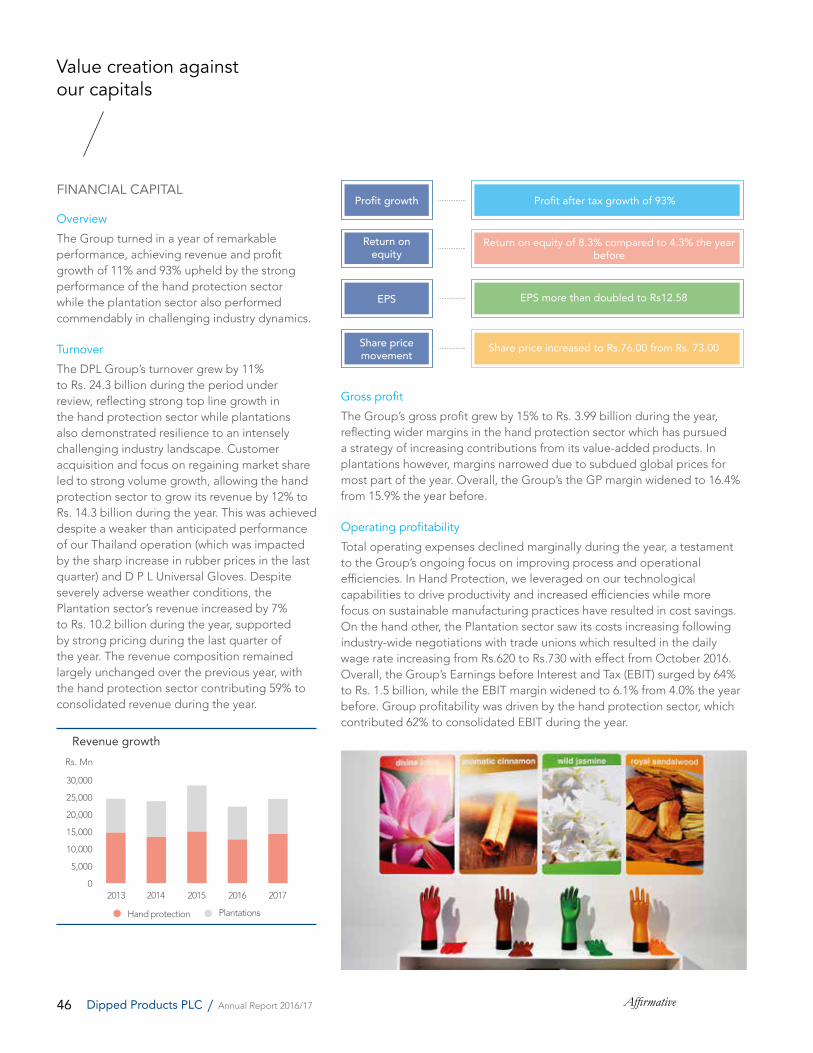
46 AffirmativeDipped Products PLC / Annual Report 2016/17
Overview
The Group turned in a year of remarkable performance, achieving revenue and profit growth of 11% and 93% upheld by the strong performance of the hand protection sector while the plantation sector also performed commendably in challenging industry dynamics.
Turnover
The DPL Group’s turnover grew by 11% to Rs. 24.3 billion during the period under review, reflecting strong top line growth in the hand protection sector while plantations also demonstrated resilience to an intensely challenging industry landscape. Customer acquisition and focus on regaining market share led to strong volume growth, allowing the hand protection sector to grow its revenue by 12% to Rs. 14.3 billion during the year. This was achieved despite a weaker than anticipated performance of our Thailand operation (which was impacted by the sharp increase in rubber prices in the last quarter) and D P L Universal Gloves. Despite severely adverse weather conditions, the Plantation sector’s revenue increased by 7% to Rs. 10.2 billion during the year, supported by strong pricing during the last quarter of the year. The revenue composition remained largely unchanged over the previous year, with the hand protection sector contributing 59% to consolidated revenue during the year.
0
5,000
10,000
15,000
20,000
25,000
30,000
Revenue growth
2013 2014 2015 2016 2017
Rs. Mn
Hand protection Plantations
Value creation against our capitals
Gross profit
The Group’s gross profit grew by 15% to Rs. 3.99 billion during the year, reflecting wider margins in the hand protection sector which has pursued a strategy of increasing contributions from its value-added products. In plantations however, margins narrowed due to subdued global prices for most part of the year. Overall, the Group’s the GP margin widened to 16.4% from 15.9% the year before.
Operating profitability
Total operating expenses declined marginally during the year, a testament to the Group’s ongoing focus on improving process and operational efficiencies. In Hand Protection, we leveraged on our technological capabilities to drive productivity and increased efficiencies while more focus on sustainable manufacturing practices have resulted in cost savings. On the hand other, the Plantation sector saw its costs increasing following industry-wide negotiations with trade unions which resulted in the daily wage rate increasing from Rs.620 to Rs.730 with effect from October 2016. Overall, the Group’s Earnings before Interest and Tax (EBIT) surged by 64% to Rs. 1.5 billion, while the EBIT margin widened to 6.1% from 4.0% the year before. Group profitability was driven by the hand protection sector, which contributed 62% to consolidated EBIT during the year.
Profit growth
Return on equity
EPS
Share price movement
Profit after tax growth of 93%
Return on equity of 8.3% compared to 4.3% the year before
EPS more than doubled to Rs12.58
Share price increased to Rs.76.00 from Rs. 73.00
FINANCIAL CAPITAL
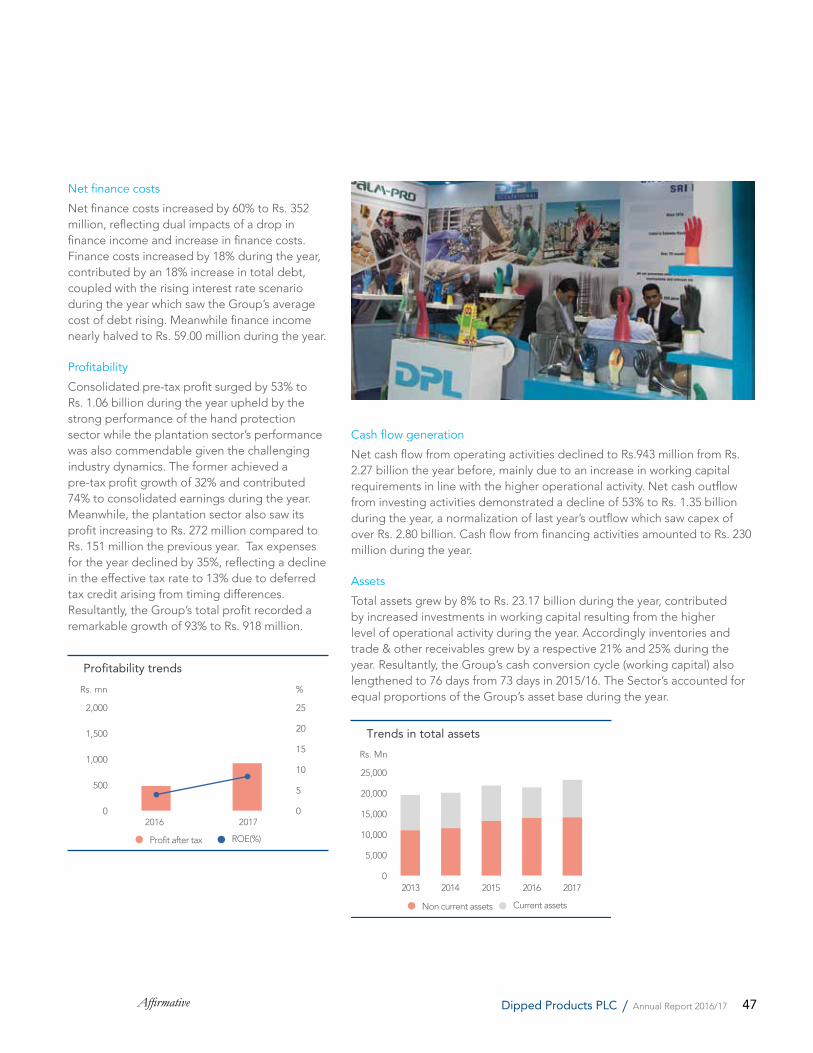
47Affirmative Dipped Products PLC / Annual Report 2016/17
Net finance costs
Net finance costs increased by 60% to Rs. 352 million, reflecting dual impacts of a drop in finance income and increase in finance costs. Finance costs increased by 18% during the year, contributed by an 18% increase in total debt, coupled with the rising interest rate scenario during the year which saw the Group’s average cost of debt rising. Meanwhile finance income nearly halved to Rs. 59.00 million during the year.
Profitability
Consolidated pre-tax profit surged by 53% to Rs. 1.06 billion during the year upheld by the strong performance of the hand protection sector while the plantation sector’s performance was also commendable given the challenging industry dynamics. The former achieved a pre-tax profit growth of 32% and contributed 74% to consolidated earnings during the year. Meanwhile, the plantation sector also saw its profit increasing to Rs. 272 million compared to Rs. 151 million the previous year. Tax expenses for the year declined by 35%, reflecting a decline in the effective tax rate to 13% due to deferred tax credit arising from timing differences. Resultantly, the Group’s total profit recorded a remarkable growth of 93% to Rs. 918 million.
0
500
1,000
1,500
2,000
Profitability trends
2016 2017
Rs. mn %
Profit after tax ROE(%)
0
5
10
15
20
25
Cash flow generation
Net cash flow from operating activities declined to Rs.943 million from Rs. 2.27 billion the year before, mainly due to an increase in working capital requirements in line with the higher operational activity. Net cash outflow from investing activities demonstrated a decline of 53% to Rs. 1.35 billion during the year, a normalization of last year’s outflow which saw capex of over Rs. 2.80 billion. Cash flow from financing activities amounted to Rs. 230 million during the year.
Assets
Total assets grew by 8% to Rs. 23.17 billion during the year, contributed by increased investments in working capital resulting from the higher level of operational activity during the year. Accordingly inventories and trade & other receivables grew by a respective 21% and 25% during the year. Resultantly, the Group’s cash conversion cycle (working capital) also lengthened to 76 days from 73 days in 2015/16. The Sector’s accounted for equal proportions of the Group’s asset base during the year.
0
5,000
10,000
15,000
20,000
25,000
Trends in total assets
2013 2014 2015 2016 2017
Rs. Mn
Non current assets Current assets
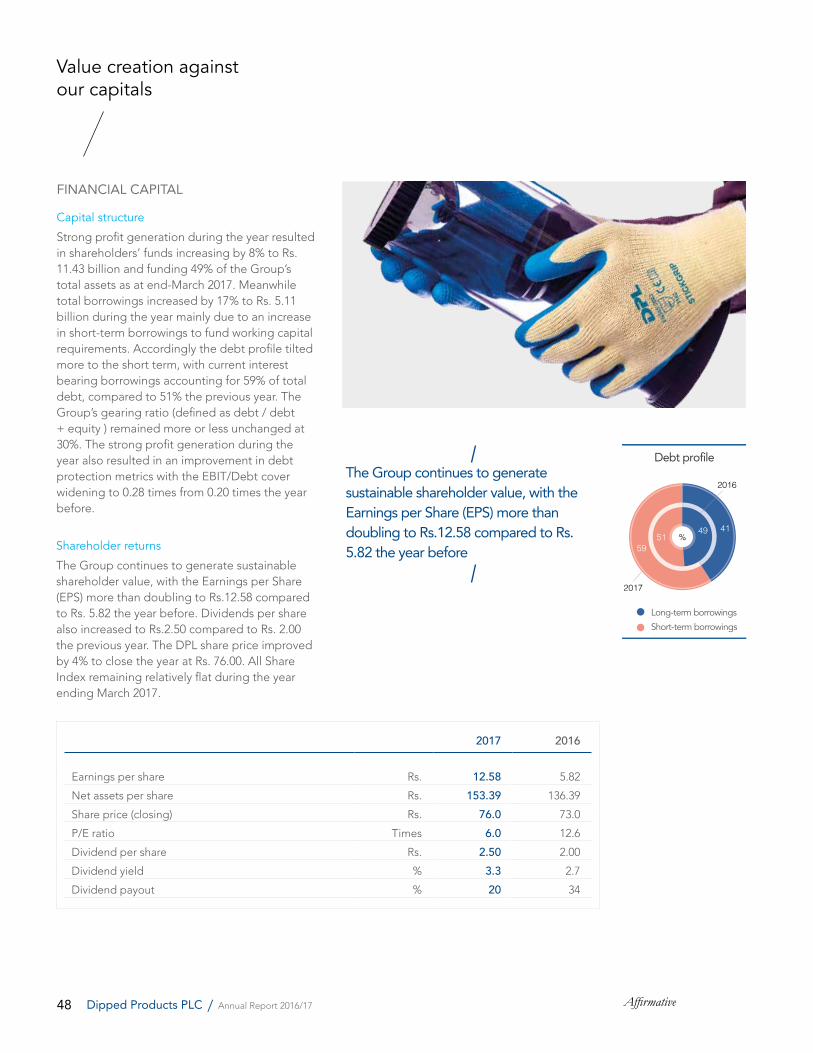
48 AffirmativeDipped Products PLC / Annual Report 2016/17
Value creation against our capitals
Debt profile
59
2017
41
Long-term borrowings
Short-term borrowings
4951 %
2016
Capital structure
Strong profit generation during the year resulted in shareholders’ funds increasing by 8% to Rs. 11.43 billion and funding 49% of the Group’s total assets as at end-March 2017. Meanwhile total borrowings increased by 17% to Rs. 5.11 billion during the year mainly due to an increase in short-term borrowings to fund working capital requirements. Accordingly the debt profile tilted more to the short term, with current interest bearing borrowings accounting for 59% of total debt, compared to 51% the previous year. The Group’s gearing ratio (defined as debt / debt + equity ) remained more or less unchanged at 30%. The strong profit generation during the year also resulted in an improvement in debt protection metrics with the EBIT/Debt cover widening to 0.28 times from 0.20 times the year before.
The Group continues to generate sustainable shareholder value, with the Earnings per Share (EPS) more than doubling to Rs.12.58 compared to Rs. 5.82 the year beforeShareholder returns
The Group continues to generate sustainable shareholder value, with the Earnings per Share (EPS) more than doubling to Rs.12.58 compared to Rs. 5.82 the year before. Dividends per share also increased to Rs.2.50 compared to Rs. 2.00 the previous year. The DPL share price improved by 4% to close the year at Rs. 76.00. All Share Index remaining relatively flat during the year ending March 2017.
2017 2016
Earnings per share Rs. 12.58 5.82
Net assets per share Rs. 153.39 136.39
Share price (closing) Rs. 76.0 73.0
P/E ratio Times 6.0 12.6
Dividend per share Rs. 2.50 2.00
Dividend yield % 3.3 2.7
Dividend payout % 20 34
FINANCIAL CAPITAL
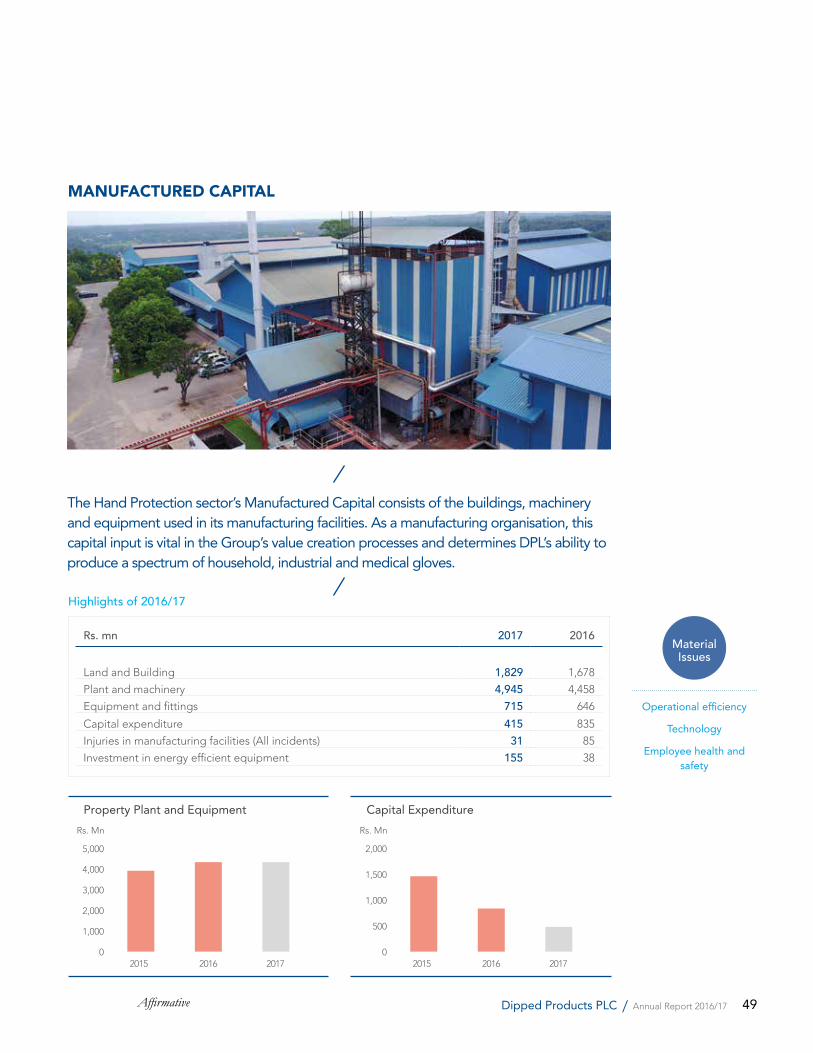
49Affirmative Dipped Products PLC / Annual Report 2016/17
The Hand Protection sector’s Manufactured Capital consists of the buildings, machinery and equipment used in its manufacturing facilities. As a manufacturing organisation, this capital input is vital in the Group’s value creation processes and determines DPL’s ability to produce a spectrum of household, industrial and medical gloves.
MANUFACTURED CAPITAL
Rs. mn 2017 2016
Land and Building 1,829 1,678
Plant and machinery 4,945 4,458
Equipment and fittings 715 646
Capital expenditure 415 835
Injuries in manufacturing facilities (All incidents) 31 85
Investment in energy efficient equipment 155 38
Highlights of 2016/17
0
1,000
2,000
3,000
4,000
5,000
Property Plant and Equipment
2015 2016 2017
Rs. Mn
0
500
1,000
1,500
2,000
Capital Expenditure
2015 2016 2017
Rs. Mn
Operational efficiency
Technology
Employee health and safety
MaterialIssues

50 AffirmativeDipped Products PLC / Annual Report 2016/17
The sector’s manufacturing facilities are listed below;
Factory Location Product range (gloves)
Dipped Products PLC Kottawa Household & Industrial
Grossart (Pvt) Limited Kottawa Fabric supported, household & industrial
Neoprex (Pvt) Limited Kottawa Household & Industrial
Hanwella Rubber Products Limited Hanwella Household & Industrial
D P L Premier Gloves Limited EPZ-block B, Biyagama Household & Industrial
D P L Universal Gloves Limited EPZ-block A, Biyagama Fabric supported & Industrial
Dipped Products (Thailand) Limited Khun Nieng, Songkhla (Thailand) Medical Examination
Capital expenditure
During the year, we invested Rs. 415 million as capital expenditure in hand protection, primarily directed towards reducing bottlenecks, enhancing efficiency and ensuring sustainable methods of manufacturing. Accordingly, key capex for the year included the installation of two bio mass heaters in the Biyagama and Kottawa factories. The Company also implemented 3 in-house packaging belts in the Kottawa and Hanwella areas as well as new chlorinators and dryers to reduce bottlenecks in production.
Driving operational efficiency
Efficiency and productivity of our manufacturing infrastructure is measured regularly through a range of indicators including Overall Equipment Efficiency (OEE), product ratio, capacity utilisation as well product yields and cost variances. As discussed on page 43 of this Report, multiple initiatives to drive efficiency including the adoption of robotic technology and strengthening production and procurement planning enabled the sector to record significant improvement in several efficiency indicators.
2017 2016
Plant availability 97.5% 96%
Sustainable manufacturing practices
Driving sustainable manufacturing through the adoption of energy efficient machinery and technology was a key priority during the year and we invested nearly Rs. 155 million in such initiatives in 2016/17. These include 500 CFM variable speed air compressor, energy efficient motors and 2 thermic oil heaters among others. These initiatives are expected to result in energy savings of approximately 210,000 electrical equivalent units.
Value creation against our capitals
MANUFACTURED CAPITAL
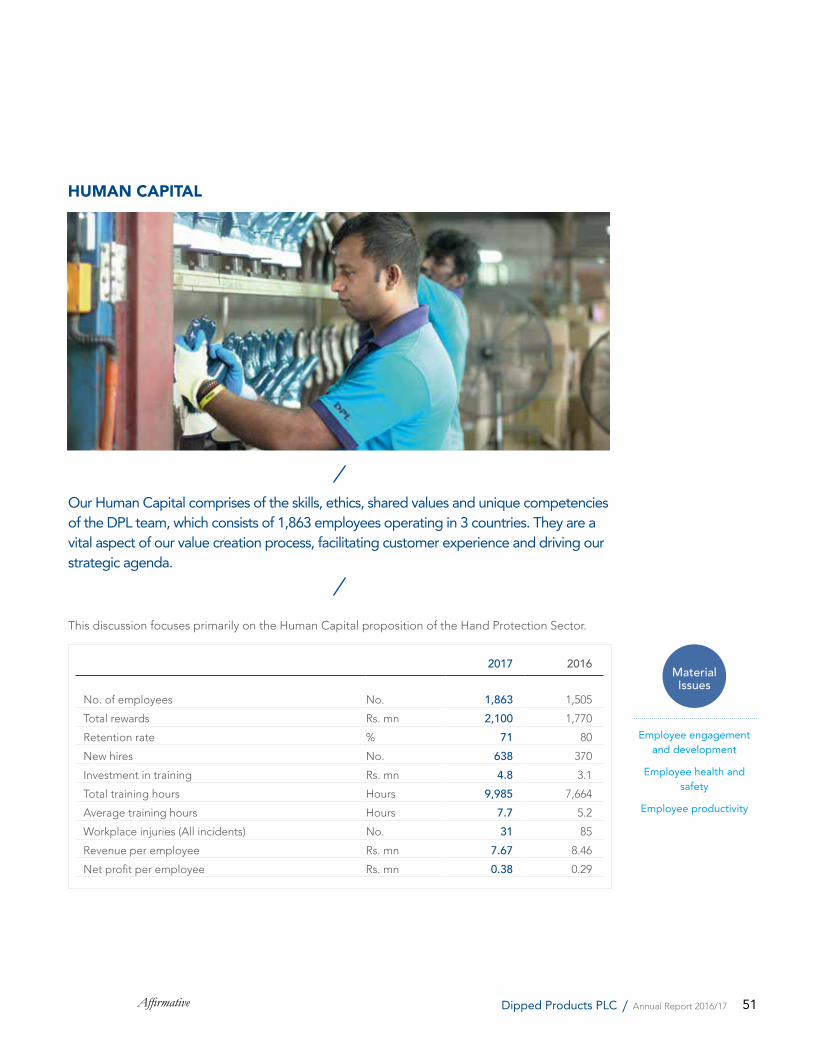
51Affirmative Dipped Products PLC / Annual Report 2016/17
Our Human Capital comprises of the skills, ethics, shared values and unique competencies of the DPL team, which consists of 1,863 employees operating in 3 countries. They are a vital aspect of our value creation process, facilitating customer experience and driving our strategic agenda.
HUMAN CAPITAL
This discussion focuses primarily on the Human Capital proposition of the Hand Protection Sector.
2017 2016
No. of employees No. 1,863 1,505
Total rewards Rs. mn 2,100 1,770
Retention rate % 71 80
New hires No. 638 370
Investment in training Rs. mn 4.8 3.1
Total training hours Hours 9,985 7,664
Average training hours Hours 7.7 5.2
Workplace injuries (All incidents) No. 31 85
Revenue per employee Rs. mn 7.67 8.46
Net profit per employee Rs. mn 0.38 0.29
Employee engagement and development
Employee health and safety
Employee productivity
MaterialIssues
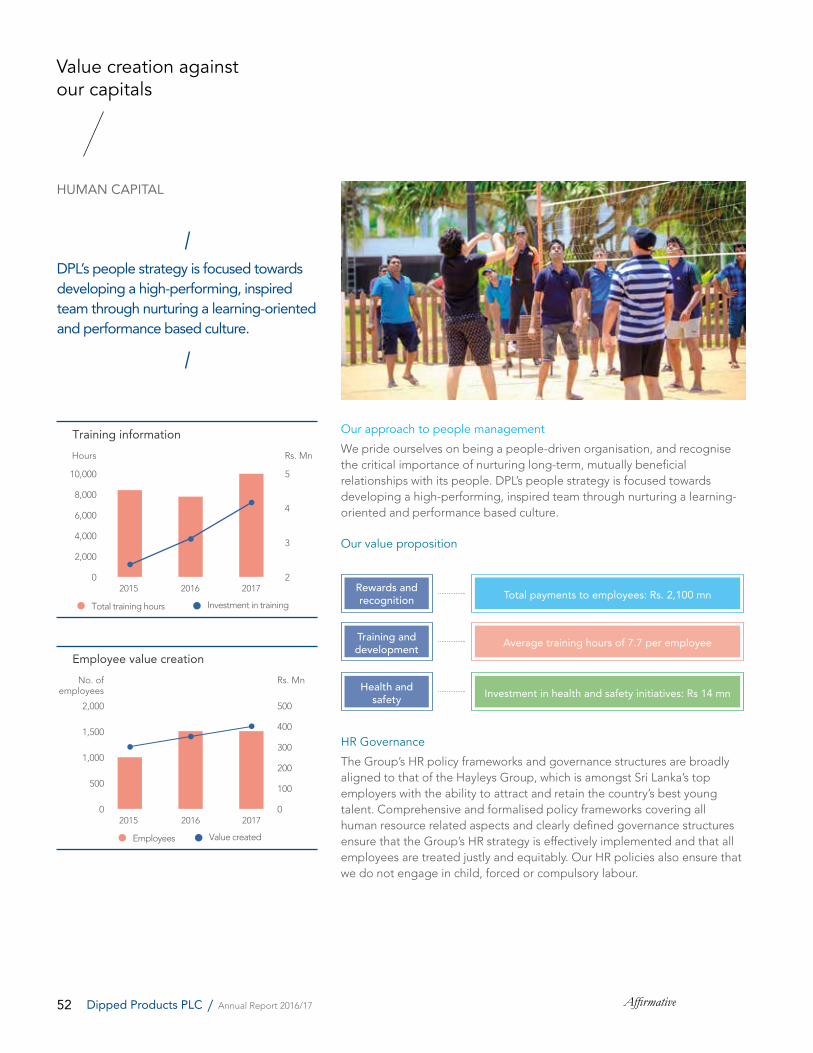
52 AffirmativeDipped Products PLC / Annual Report 2016/17
0
500
1,000
1,500
2,000
Employee value creation
2015 2016 2017
No. ofemployees
Rs. Mn
Employees Value created
0
100
200
300
400
500
0
2,000
4,000
6,000
8,000
10,000
Training information
2015 2016 2017
Hours Rs. Mn
Total training hours Investment in training
2
3
4
5
Our approach to people management
We pride ourselves on being a people-driven organisation, and recognise the critical importance of nurturing long-term, mutually beneficial relationships with its people. DPL’s people strategy is focused towards developing a high-performing, inspired team through nurturing a learning-oriented and performance based culture.
Our value proposition
HR Governance
The Group’s HR policy frameworks and governance structures are broadly aligned to that of the Hayleys Group, which is amongst Sri Lanka’s top employers with the ability to attract and retain the country’s best young talent. Comprehensive and formalised policy frameworks covering all human resource related aspects and clearly defined governance structures ensure that the Group’s HR strategy is effectively implemented and that all employees are treated justly and equitably. Our HR policies also ensure that we do not engage in child, forced or compulsory labour.
Rewards and recognition
Training and development
Health and safety
Total payments to employees: Rs. 2,100 mn
Average training hours of 7.7 per employee
Investment in health and safety initiatives: Rs 14 mn
DPL’s people strategy is focused towards developing a high-performing, inspired team through nurturing a learning-oriented and performance based culture.
Value creation against our capitals
HUMAN CAPITAL
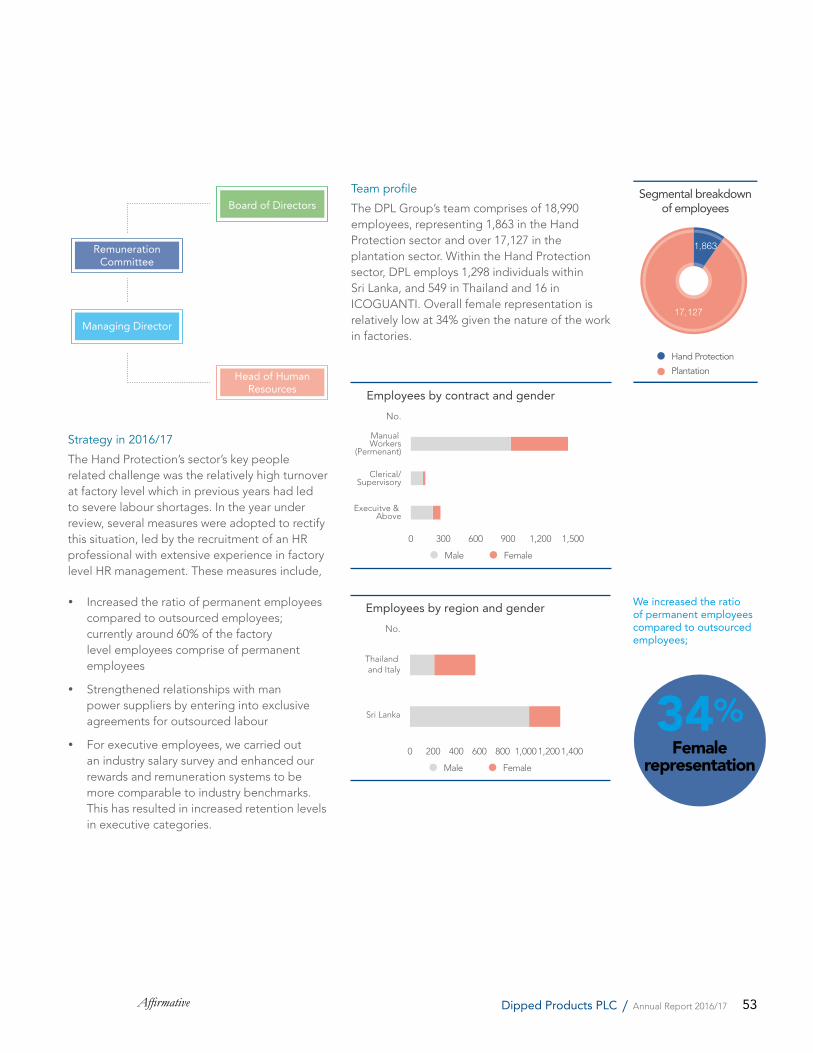
53Affirmative Dipped Products PLC / Annual Report 2016/17
We increased the ratio of permanent employees compared to outsourced employees;
Strategy in 2016/17
The Hand Protection’s sector’s key people related challenge was the relatively high turnover at factory level which in previous years had led to severe labour shortages. In the year under review, several measures were adopted to rectify this situation, led by the recruitment of an HR professional with extensive experience in factory level HR management. These measures include,
Increased the ratio of permanent employees compared to outsourced employees; currently around 60% of the factory level employees comprise of permanent employees
Strengthened relationships with man power suppliers by entering into exclusive agreements for outsourced labour
For executive employees, we carried out an industry salary survey and enhanced our rewards and remuneration systems to be more comparable to industry benchmarks. This has resulted in increased retention levels in executive categories.
Team profile
The DPL Group’s team comprises of 18,990 employees, representing 1,863 in the Hand Protection sector and over 17,127 in the plantation sector. Within the Hand Protection sector, DPL employs 1,298 individuals within Sri Lanka, and 549 in Thailand and 16 in ICOGUANTI. Overall female representation is relatively low at 34% given the nature of the work in factories.
Segmental breakdownof employees
1,863
17,127
Hand Protection
Plantation
0 300 600 900 1,200 1,500
Employees by contract and gender
Manual Workers
(Permenant)
Execuitve & Above
Clerical/Supervisory
No.
Male Female
0 200 400 600 800 1,000 1,200 1,400
Employees by region and gender
Sri Lanka
Thailand and Italy
No.
Male Female
Board of Directors
Head of Human Resources
Remuneration Committee
Managing Director
34%Female
representation
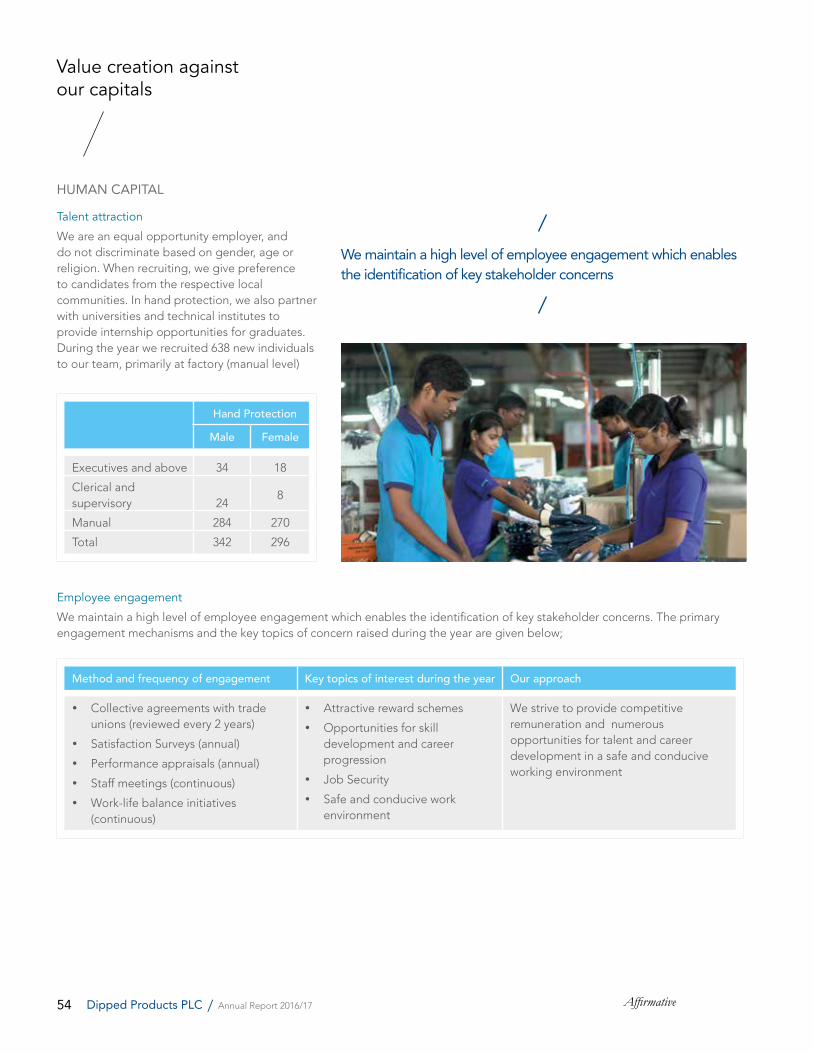
54 AffirmativeDipped Products PLC / Annual Report 2016/17
Talent attraction
We are an equal opportunity employer, and do not discriminate based on gender, age or religion. When recruiting, we give preference to candidates from the respective local communities. In hand protection, we also partner with universities and technical institutes to provide internship opportunities for graduates. During the year we recruited 638 new individuals to our team, primarily at factory (manual level)
Hand Protection
Male Female
Executives and above 34 18
Clerical and supervisory 24
8
Manual 284 270
Total 342 296
Method and frequency of engagement Key topics of interest during the year Our approach
Collective agreements with trade unions (reviewed every 2 years)
Satisfaction Surveys (annual)
Performance appraisals (annual)
Staff meetings (continuous)
Work-life balance initiatives (continuous)
Attractive reward schemes
Opportunities for skill development and career progression
Job Security
Safe and conducive work environment
We strive to provide competitive remuneration and numerous opportunities for talent and career development in a safe and conducive working environment
Employee engagement
We maintain a high level of employee engagement which enables the identification of key stakeholder concerns. The primary engagement mechanisms and the key topics of concern raised during the year are given below;
We maintain a high level of employee engagement which enables the identification of key stakeholder concerns
Value creation against our capitals
HUMAN CAPITAL
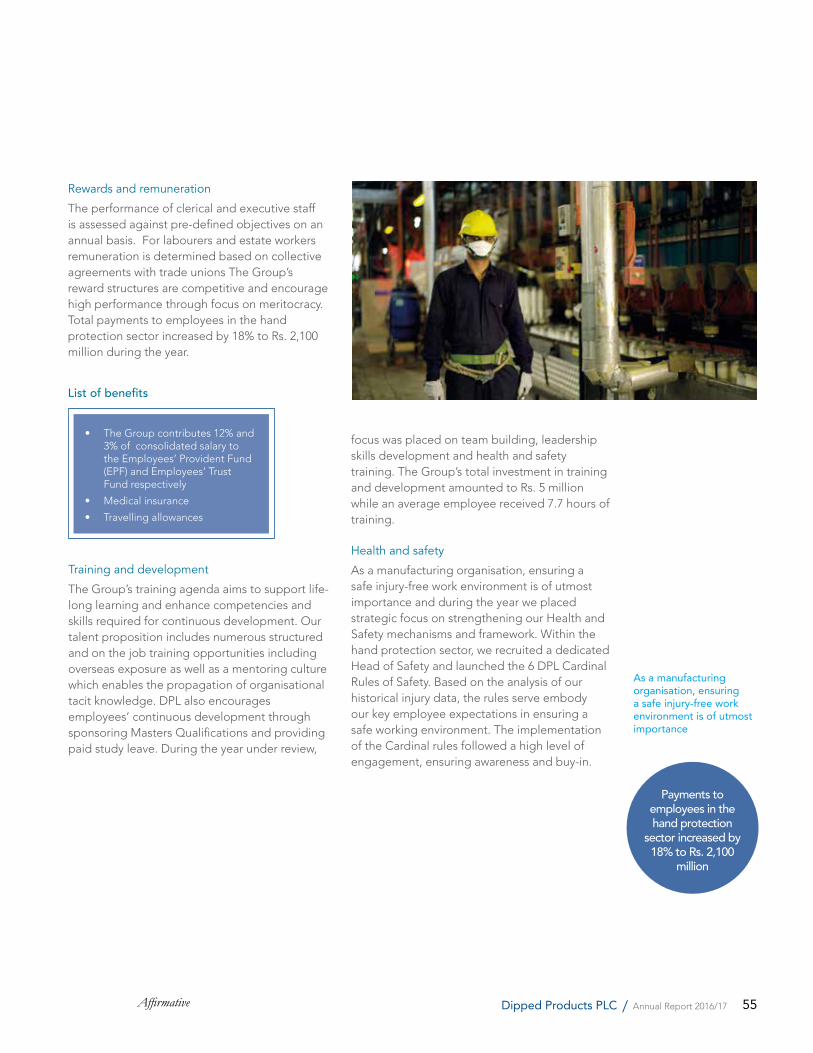
55Affirmative Dipped Products PLC / Annual Report 2016/17
Rewards and remuneration
The performance of clerical and executive staff is assessed against pre-defined objectives on an annual basis. For labourers and estate workers remuneration is determined based on collective agreements with trade unions The Group’s reward structures are competitive and encourage high performance through focus on meritocracy. Total payments to employees in the hand protection sector increased by 18% to Rs. 2,100 million during the year.
Training and development
The Group’s training agenda aims to support life-long learning and enhance competencies and skills required for continuous development. Our talent proposition includes numerous structured and on the job training opportunities including overseas exposure as well as a mentoring culture which enables the propagation of organisational tacit knowledge. DPL also encourages employees’ continuous development through sponsoring Masters Qualifications and providing paid study leave. During the year under review,
• The Group contributes 12% and 3% of consolidated salary to the Employees’ Provident Fund (EPF) and Employees’ Trust Fund respectively
• Medical insurance
• Travelling allowances
List of benefits
As a manufacturing organisation, ensuring a safe injury-free work environment is of utmost importance
focus was placed on team building, leadership skills development and health and safety training. The Group’s total investment in training and development amounted to Rs. 5 million while an average employee received 7.7 hours of training.
Health and safety
As a manufacturing organisation, ensuring a safe injury-free work environment is of utmost importance and during the year we placed strategic focus on strengthening our Health and Safety mechanisms and framework. Within the hand protection sector, we recruited a dedicated Head of Safety and launched the 6 DPL Cardinal Rules of Safety. Based on the analysis of our historical injury data, the rules serve embody our key employee expectations in ensuring a safe working environment. The implementation of the Cardinal rules followed a high level of engagement, ensuring awareness and buy-in.
Payments to employees in the hand protection
sector increased by 18% to Rs. 2,100
million
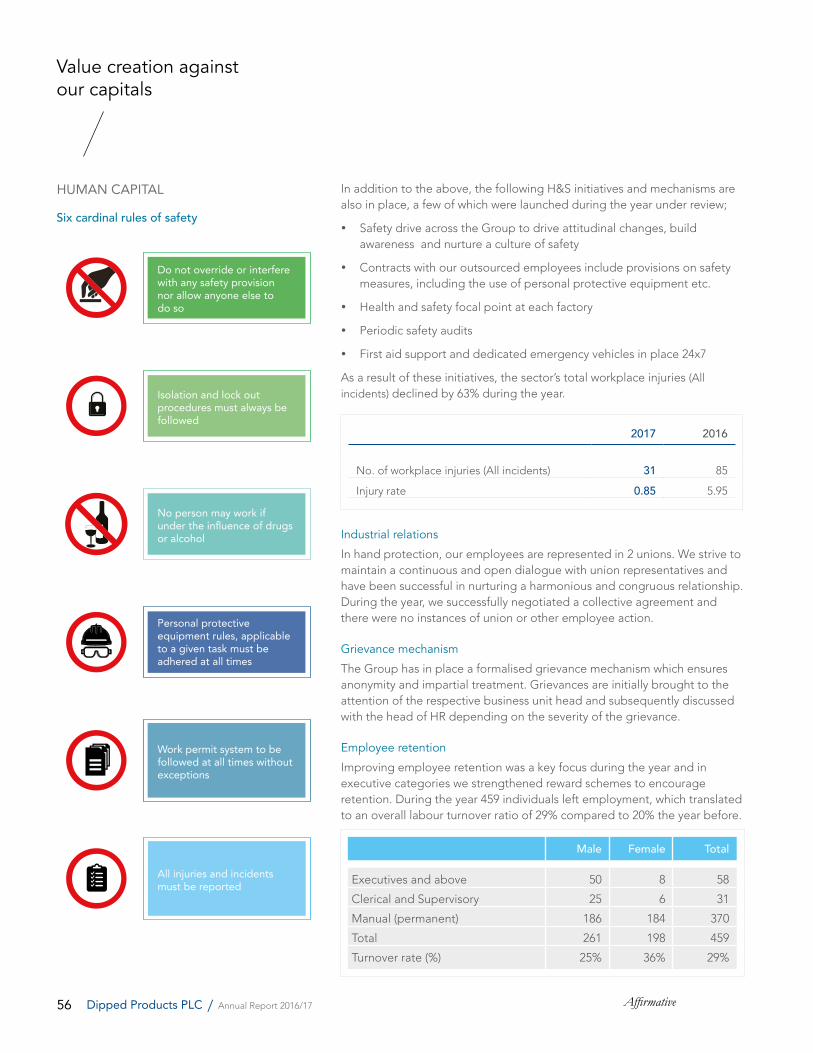
56 AffirmativeDipped Products PLC / Annual Report 2016/17
Six cardinal rules of safety
In addition to the above, the following H&S initiatives and mechanisms are also in place, a few of which were launched during the year under review;
Safety drive across the Group to drive attitudinal changes, build awareness and nurture a culture of safety
Contracts with our outsourced employees include provisions on safety measures, including the use of personal protective equipment etc.
Health and safety focal point at each factory
Periodic safety audits
First aid support and dedicated emergency vehicles in place 24x7
As a result of these initiatives, the sector’s total workplace injuries (All incidents) declined by 63% during the year.
Male Female Total
Executives and above 50 8 58
Clerical and Supervisory 25 6 31
Manual (permanent) 186 184 370
Total 261 198 459
Turnover rate (%) 25% 36% 29%
Industrial relations
In hand protection, our employees are represented in 2 unions. We strive to maintain a continuous and open dialogue with union representatives and have been successful in nurturing a harmonious and congruous relationship. During the year, we successfully negotiated a collective agreement and there were no instances of union or other employee action.
Grievance mechanism
The Group has in place a formalised grievance mechanism which ensures anonymity and impartial treatment. Grievances are initially brought to the attention of the respective business unit head and subsequently discussed with the head of HR depending on the severity of the grievance.
Employee retention
Improving employee retention was a key focus during the year and in executive categories we strengthened reward schemes to encourage retention. During the year 459 individuals left employment, which translated to an overall labour turnover ratio of 29% compared to 20% the year before.
No person may work if under the influence of drugs or alcohol
Do not override or interfere with any safety provision nor allow anyone else to do so
Isolation and lock out procedures must always be followed
Personal protective equipment rules, applicable to a given task must be adhered at all times
Work permit system to be followed at all times without exceptions
All injuries and incidents must be reported
Value creation against our capitals
2017 2016
No. of workplace injuries (All incidents) 31 85
Injury rate 0.85 5.95
HUMAN CAPITAL
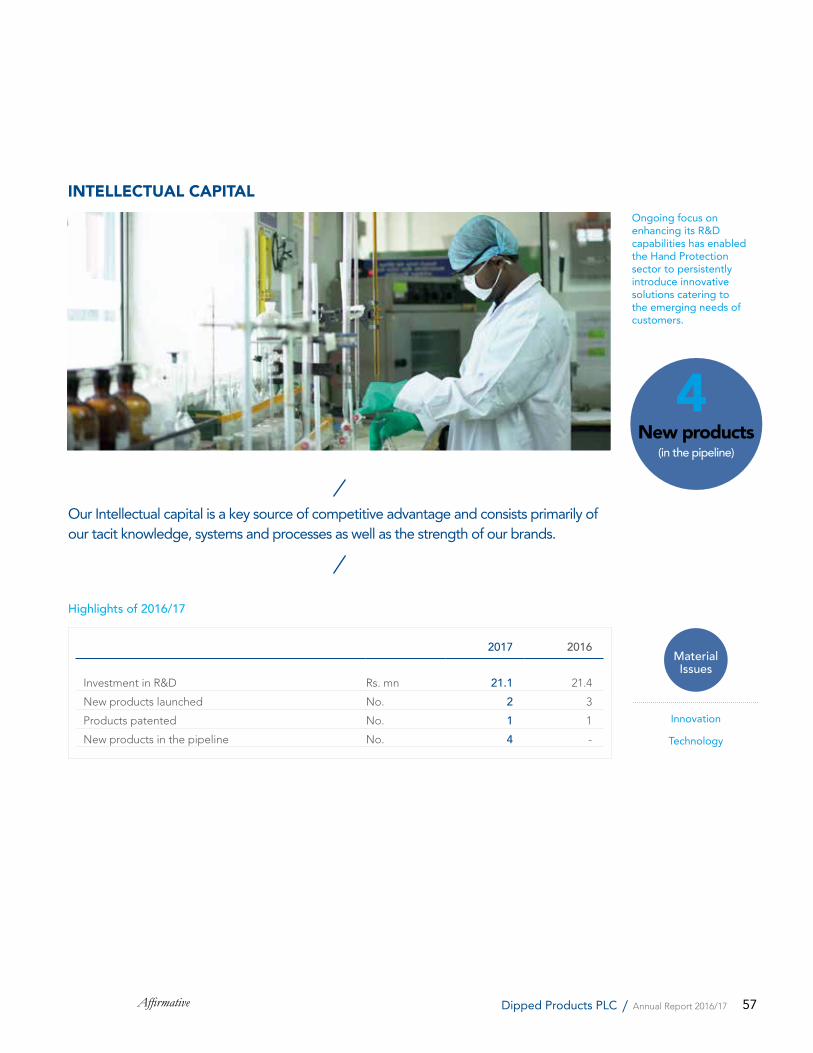
57Affirmative Dipped Products PLC / Annual Report 2016/17
Our Intellectual capital is a key source of competitive advantage and consists primarily of our tacit knowledge, systems and processes as well as the strength of our brands.
INTELLECTUAL CAPITAL
2017 2016
Investment in R&D Rs. mn 21.1 21.4
New products launched No. 2 3
Products patented No. 1 1
New products in the pipeline No. 4 -
Highlights of 2016/17
Ongoing focus on enhancing its R&D capabilities has enabled the Hand Protection sector to persistently introduce innovative solutions catering to the emerging needs of customers.
4New products
(in the pipeline)
Innovation
Technology
MaterialIssues
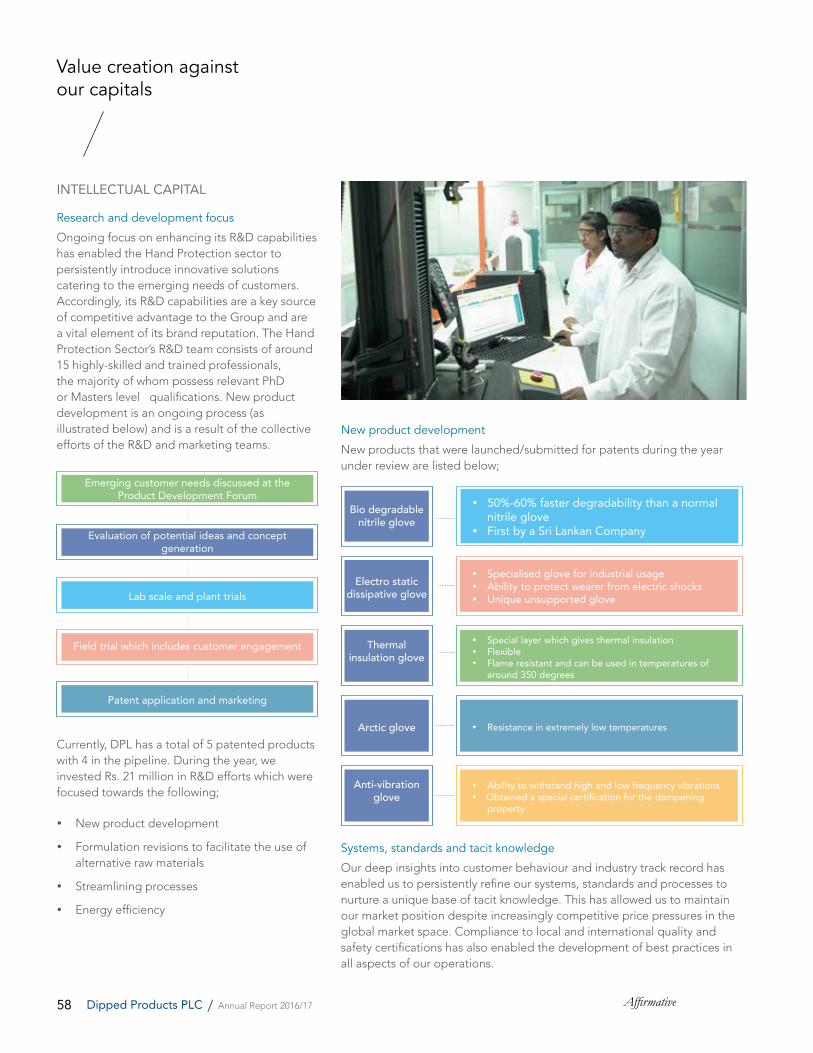
58 AffirmativeDipped Products PLC / Annual Report 2016/17
Research and development focus
Ongoing focus on enhancing its R&D capabilities has enabled the Hand Protection sector to persistently introduce innovative solutions catering to the emerging needs of customers. Accordingly, its R&D capabilities are a key source of competitive advantage to the Group and are a vital element of its brand reputation. The Hand Protection Sector’s R&D team consists of around 15 highly-skilled and trained professionals, the majority of whom possess relevant PhD or Masters level qualifications. New product development is an ongoing process (as illustrated below) and is a result of the collective efforts of the R&D and marketing teams.
Currently, DPL has a total of 5 patented products with 4 in the pipeline. During the year, we invested Rs. 21 million in R&D efforts which were focused towards the following;
New product development
Formulation revisions to facilitate the use of alternative raw materials
Streamlining processes
Energy efficiency
New product development
New products that were launched/submitted for patents during the year under review are listed below;
Systems, standards and tacit knowledge
Our deep insights into customer behaviour and industry track record has enabled us to persistently refine our systems, standards and processes to nurture a unique base of tacit knowledge. This has allowed us to maintain our market position despite increasingly competitive price pressures in the global market space. Compliance to local and international quality and safety certifications has also enabled the development of best practices in all aspects of our operations.
Bio degradable nitrile glove
50%-60% faster degradability than a normal nitrile glove
First by a Sri Lankan Company
Electro static dissipative glove
Specialised glove for industrial usage Ability to protect wearer from electric shocks Unique unsupported glove
Thermal insulation glove
Special layer which gives thermal insulation Flexible Flame resistant and can be used in temperatures of
around 350 degrees
Arctic glove Resistance in extremely low temperatures
Anti-vibration glove
Ability to withstand high and low frequency vibrationsObtained a special certification for the dampening
property
Emerging customer needs discussed at the Product Development Forum
Evaluation of potential ideas and concept generation
Lab scale and plant trials
Field trial which includes customer engagement
Patent application and marketing
Value creation against our capitals
INTELLECTUAL CAPITAL
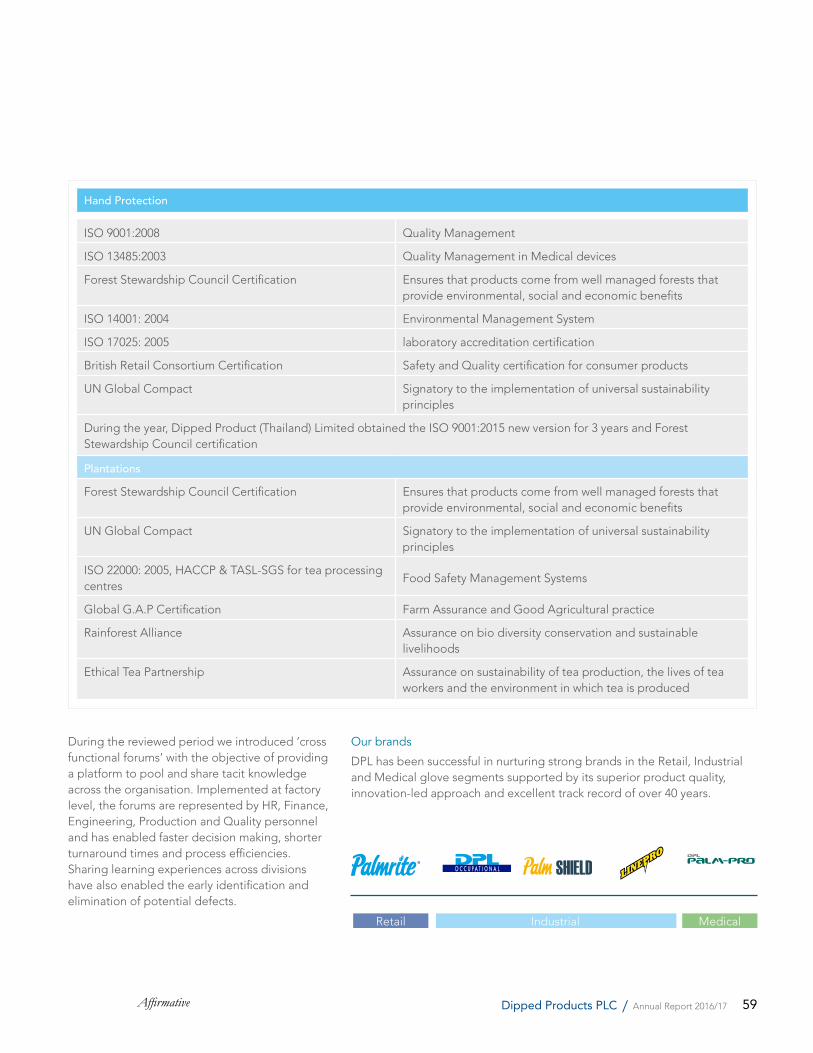
59Affirmative Dipped Products PLC / Annual Report 2016/17
Hand Protection
ISO 9001:2008 Quality Management
ISO 13485:2003 Quality Management in Medical devices
Forest Stewardship Council Certification Ensures that products come from well managed forests that provide environmental, social and economic benefits
ISO 14001: 2004 Environmental Management System
ISO 17025: 2005 laboratory accreditation certification
British Retail Consortium Certification Safety and Quality certification for consumer products
UN Global Compact Signatory to the implementation of universal sustainability principles
During the year, Dipped Product (Thailand) Limited obtained the ISO 9001:2015 new version for 3 years and Forest Stewardship Council certification
Plantations
Forest Stewardship Council Certification Ensures that products come from well managed forests that provide environmental, social and economic benefits
UN Global Compact Signatory to the implementation of universal sustainability principles
ISO 22000: 2005, HACCP & TASL-SGS for tea processing centres
Food Safety Management Systems
Global G.A.P Certification Farm Assurance and Good Agricultural practice
Rainforest Alliance Assurance on bio diversity conservation and sustainable livelihoods
Ethical Tea Partnership Assurance on sustainability of tea production, the lives of tea workers and the environment in which tea is produced
During the reviewed period we introduced ‘cross functional forums’ with the objective of providing a platform to pool and share tacit knowledge across the organisation. Implemented at factory level, the forums are represented by HR, Finance, Engineering, Production and Quality personnel and has enabled faster decision making, shorter turnaround times and process efficiencies. Sharing learning experiences across divisions have also enabled the early identification and elimination of potential defects.
Our brands
DPL has been successful in nurturing strong brands in the Retail, Industrial and Medical glove segments supported by its superior product quality, innovation-led approach and excellent track record of over 40 years.
Retail MedicalIndustrial
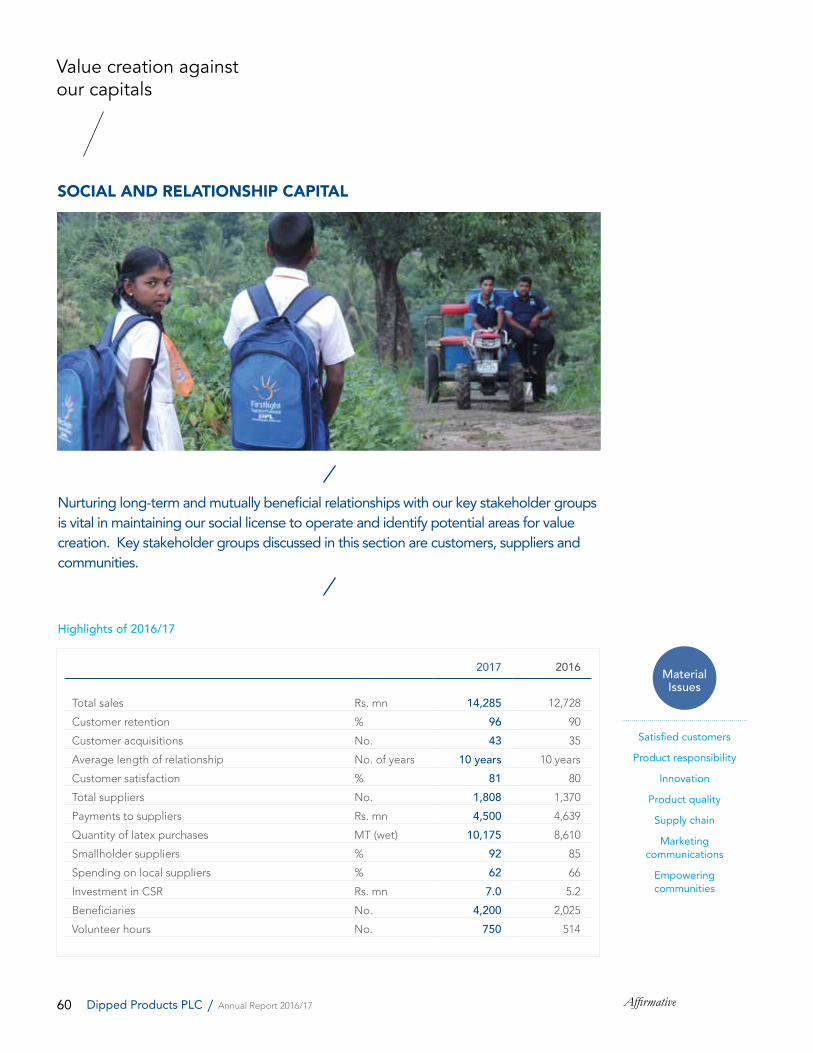
60 AffirmativeDipped Products PLC / Annual Report 2016/17
Nurturing long-term and mutually beneficial relationships with our key stakeholder groups is vital in maintaining our social license to operate and identify potential areas for value creation. Key stakeholder groups discussed in this section are customers, suppliers and communities.
SOCIAL AND RELATIONSHIP CAPITAL
2017 2016
Total sales Rs. mn 14,285 12,728
Customer retention % 96 90
Customer acquisitions No. 43 35
Average length of relationship No. of years 10 years 10 years
Customer satisfaction % 81 80
Total suppliers No. 1,808 1,370
Payments to suppliers Rs. mn 4,500 4,639
Quantity of latex purchases MT (wet) 10,175 8,610
Smallholder suppliers % 92 85
Spending on local suppliers % 62 66
Investment in CSR Rs. mn 7.0 5.2
Beneficiaries No. 4,200 2,025
Volunteer hours No. 750 514
Highlights of 2016/17
Value creation against our capitals
Satisfied customers
Product responsibility
Innovation
Product quality
Supply chain
Marketing communications
Empowering communities
MaterialIssues
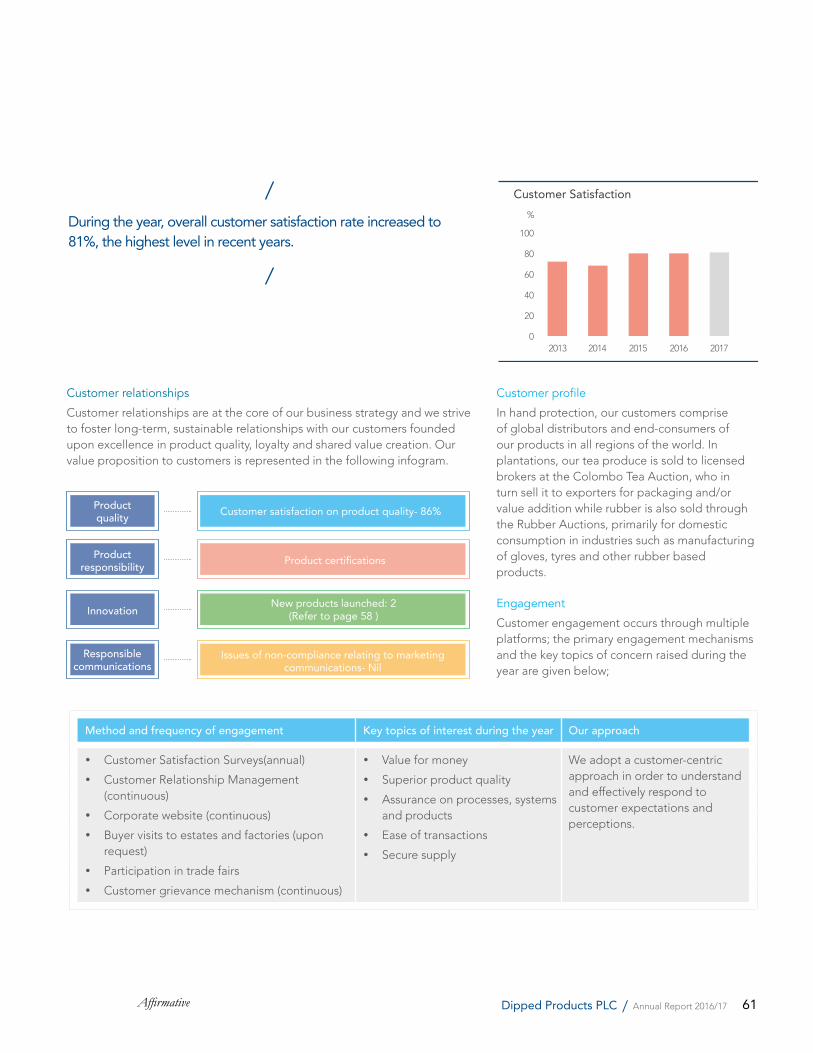
61Affirmative Dipped Products PLC / Annual Report 2016/17
0
20
40
60
80
100
Customer Satisfaction
2013 2014 2015 2016 2017
%
Customer relationships
Customer relationships are at the core of our business strategy and we strive to foster long-term, sustainable relationships with our customers founded upon excellence in product quality, loyalty and shared value creation. Our value proposition to customers is represented in the following infogram.
Product quality
Product responsibility
Innovation
Responsible communications
Customer satisfaction on product quality- 86%
Product certifications
New products launched: 2(Refer to page 58 )
Issues of non-compliance relating to marketing communications- Nil
Customer profile
In hand protection, our customers comprise of global distributors and end-consumers of our products in all regions of the world. In plantations, our tea produce is sold to licensed brokers at the Colombo Tea Auction, who in turn sell it to exporters for packaging and/or value addition while rubber is also sold through the Rubber Auctions, primarily for domestic consumption in industries such as manufacturing of gloves, tyres and other rubber based products.
Engagement
Customer engagement occurs through multiple platforms; the primary engagement mechanisms and the key topics of concern raised during the year are given below;
Method and frequency of engagement Key topics of interest during the year Our approach
Customer Satisfaction Surveys(annual)
Customer Relationship Management (continuous)
Corporate website (continuous)
Buyer visits to estates and factories (upon request)
Participation in trade fairs
Customer grievance mechanism (continuous)
Value for money
Superior product quality
Assurance on processes, systems and products
Ease of transactions
Secure supply
We adopt a customer-centric approach in order to understand and effectively respond to customer expectations and perceptions.
During the year, overall customer satisfaction rate increased to 81%, the highest level in recent years.
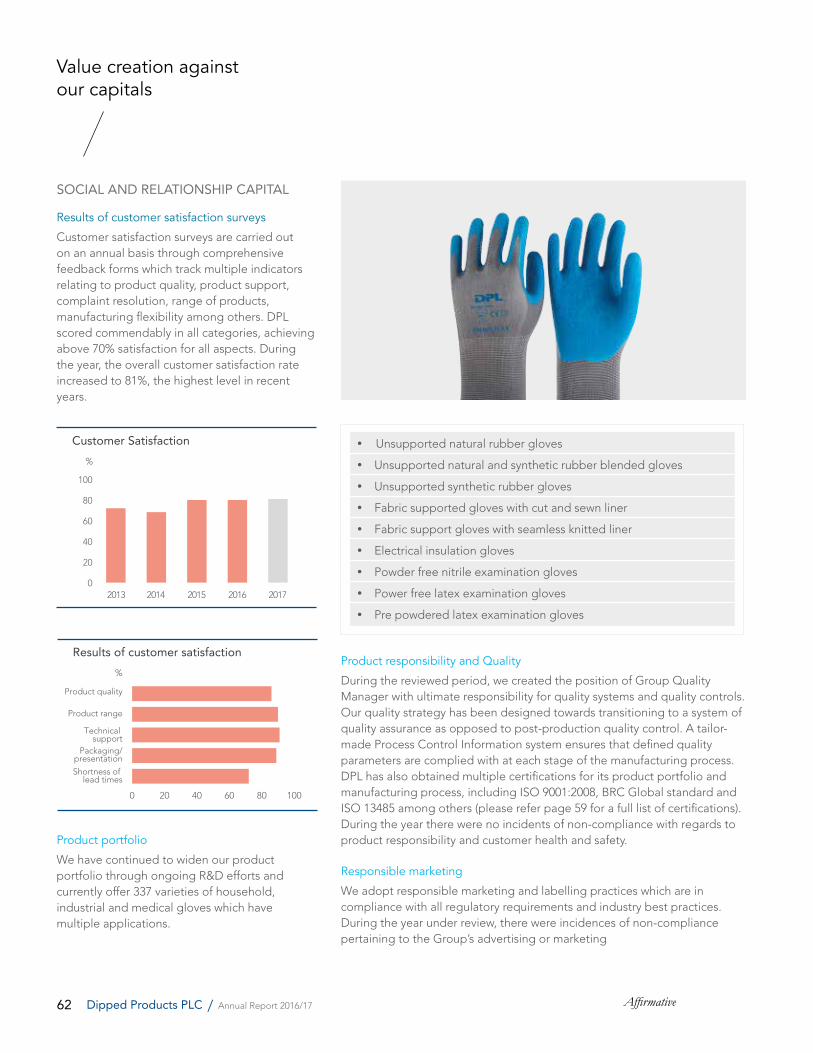
62 AffirmativeDipped Products PLC / Annual Report 2016/17
Results of customer satisfaction surveys
Customer satisfaction surveys are carried out on an annual basis through comprehensive feedback forms which track multiple indicators relating to product quality, product support, complaint resolution, range of products, manufacturing flexibility among others. DPL scored commendably in all categories, achieving above 70% satisfaction for all aspects. During the year, the overall customer satisfaction rate increased to 81%, the highest level in recent years.
0
20
40
60
80
100
Customer Satisfaction
2013 2014 2015 2016 2017
%
0 20 40 60 80 100
Results of customer satisfaction
Product quality
Product range
Technical support
Packaging/presentation
Shortness of lead times
%
Product portfolio
We have continued to widen our product portfolio through ongoing R&D efforts and currently offer 337 varieties of household, industrial and medical gloves which have multiple applications.
Unsupported natural rubber gloves
Unsupported natural and synthetic rubber blended gloves
Unsupported synthetic rubber gloves
Fabric supported gloves with cut and sewn liner
Fabric support gloves with seamless knitted liner
Electrical insulation gloves
Powder free nitrile examination gloves
Power free latex examination gloves
Pre powdered latex examination gloves
Product responsibility and Quality
During the reviewed period, we created the position of Group Quality Manager with ultimate responsibility for quality systems and quality controls. Our quality strategy has been designed towards transitioning to a system of quality assurance as opposed to post-production quality control. A tailor-made Process Control Information system ensures that defined quality parameters are complied with at each stage of the manufacturing process. DPL has also obtained multiple certifications for its product portfolio and manufacturing process, including ISO 9001:2008, BRC Global standard and ISO 13485 among others (please refer page 59 for a full list of certifications). During the year there were no incidents of non-compliance with regards to product responsibility and customer health and safety.
Responsible marketing
We adopt responsible marketing and labelling practices which are in compliance with all regulatory requirements and industry best practices. During the year under review, there were incidences of non-compliance pertaining to the Group’s advertising or marketing
Value creation against our capitals
SOCIAL AND RELATIONSHIP CAPITAL
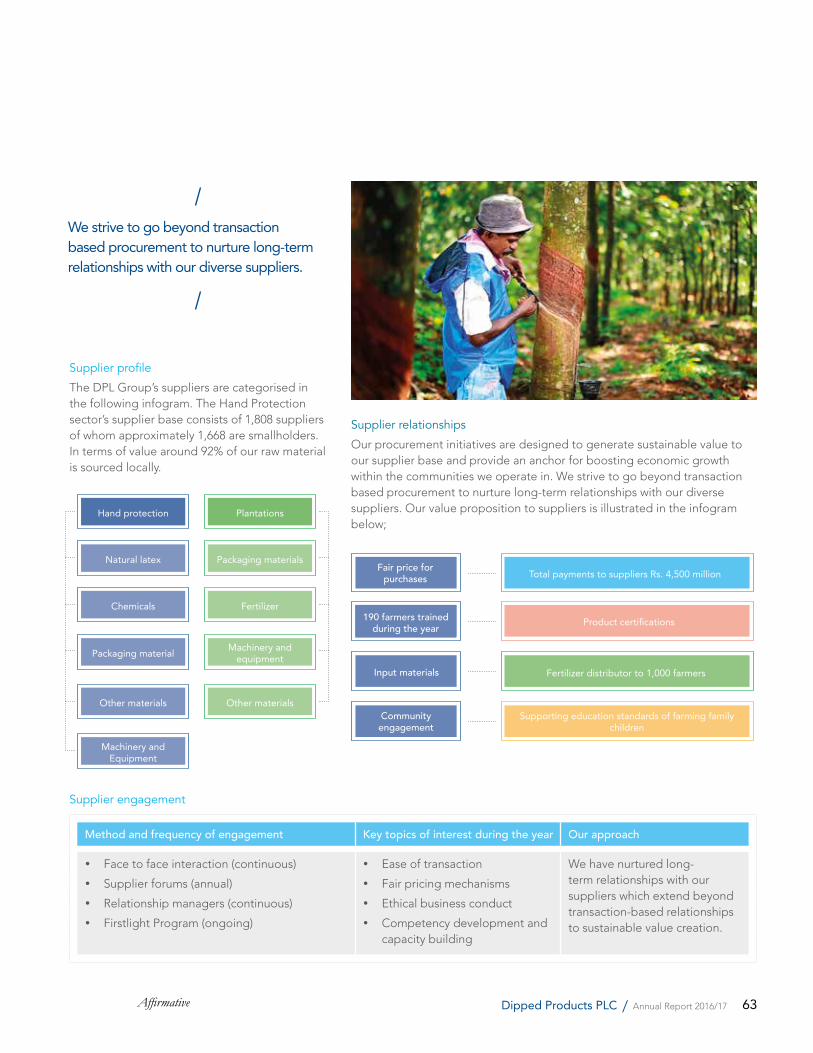
63Affirmative Dipped Products PLC / Annual Report 2016/17
Supplier relationships
Our procurement initiatives are designed to generate sustainable value to our supplier base and provide an anchor for boosting economic growth within the communities we operate in. We strive to go beyond transaction based procurement to nurture long-term relationships with our diverse suppliers. Our value proposition to suppliers is illustrated in the infogram below;
Fair price for purchases
190 farmers trained during the year
Input materials
Community engagement
Total payments to suppliers Rs. 4,500 million
Product certifications
Fertilizer distributor to 1,000 farmers
Supporting education standards of farming family children
Supplier profile
The DPL Group’s suppliers are categorised in the following infogram. The Hand Protection sector’s supplier base consists of 1,808 suppliers of whom approximately 1,668 are smallholders. In terms of value around 92% of our raw material is sourced locally.
We strive to go beyond transaction based procurement to nurture long-term relationships with our diverse suppliers.
Method and frequency of engagement Key topics of interest during the year Our approach
Face to face interaction (continuous)
Supplier forums (annual)
Relationship managers (continuous)
Firstlight Program (ongoing)
Ease of transaction
Fair pricing mechanisms
Ethical business conduct
Competency development and capacity building
We have nurtured long-term relationships with our suppliers which extend beyond transaction-based relationships to sustainable value creation.
Supplier engagement
Hand protection
Natural latex
Chemicals
Packaging material
Machinery and Equipment
Other materials
Plantations
Packaging materials
Fertilizer
Machinery and equipment
Other materials
64 AffirmativeDipped Products PLC / Annual Report 2016/17
Supplier development through Firstlight
We adopt a systematic and holistic approach towards empowering and strengthening our suppliers, through our flagship development initiative ‘DPL Firstlight.’ The program aims to empower farmers and contribute towards their socio economic progress through multi-faceted programmes which include fair trade in rubber latex, farmer education and community projects. Currently in its 9th year of operation, Firstlight has expanded its scope and coverage to now support 2,180 farmers across 9 districts.
FIRSTLIGHT AWARD• Gold Award at the JASTECA CSR/
Sustainability Awards
District No. of farmers supported through
Firstlight
Monaragala 1,450
Kaluthara 200
Colombo 250
Rathnapura 50
Galle 30
Bibile 200
Coverage of Firstlight
A fair price for field latex
For Firstlight farmers, the price paid for the supply of field latex is indexed to the published auction prices of RSS1, the highest grade of the most commonly consumed form of raw rubber. Firstlight farmers are thus able to benefit from better prices, as several cost components such as middlemen’s margins, brokerage, transporting and warehousing costs are eliminated. Payment is made twice a month on fixed dates through a secure payment system in place through the rural banking network. The mechanism has also
Farmer training and capacity development
Farmer education and training programmes are carried out on an ongoing basis to ensure good quality crops, sustainable production methods and a secure supply chain. During the year, 2 such programmes were carried out with a total participant base of 180 farmers. A quarterly newsletter is also circulated among participating farmers which covers topics such as,
Soil preparation Importance of high quality plant material Planting methods Tapping techniques Harvest improvement Field upkeep Diseases affecting rubber and prevention
Provision of input materials
In supporting the sustainability of the overall rubber industry, we encourage the adoption of best practices on rubber farms. Through Firstlight we provide special collection cups, high quality tapping knives
We adopt a systematic and holistic approach towards empowering and strengthening our suppliers, through our flagship development initiative ‘DPL Firstlight.’
A fair price for field latex
Educate and empower smallholders
Provide inputs for crop protection and increase yields
Community capacity building
Value creation against our capitals
SOCIAL AND RELATIONSHIP CAPITAL
benefited DPL through providing increased predictability of raw material prices and enabled the Company to successfully manufacture the world’s first ethical rubber glove.
Key principles of the initiative are,
65Affirmative Dipped Products PLC / Annual Report 2016/17
rain guards, aprons, fertilizer and flashlights as well as input materials required for setting up of rubber plant nurseries. Special collection cups improve the hygiene of the field latex by preventing putrefaction thereby leading to higher quality latex. During the year we distributed Rs. 2.9 million worth of input materials, supporting nearly 1,000 farmers island-wide.
Community engagement through Firstlight
In addition to directly empowering rubber smallholders and farmers, Firstlight also encompasses community engagement initiatives targeted at contributing towards the socio-economic progress of farming families. This includes health screening, distribution of medical supplies and sponsoring cultural events among others. During the year under review, we carried 2 health camps, followed by the distribution of spectacles to 90 farmers.
Education
Supporting the educational needs of rural students is a key pillar of DPL’s CSR agenda. During the year we invested close to Rs. 1.1 million in multiple initiatives driven towards enhancing access and quality of education in rural schools as listed below;
DPL's Community engagement
Firstlight Sath Diyawara
Educational support
Access to clean drinking water
Community Support
Youth empowerment
Monaragela district in the Uva Province
Parangiyawadiya Village in the North Central Province
Initiative District No. of student
beneficiaries
Motivational programmes
Monaragala 600
Distribution of musical items
Monaragala 6
Donation of shoes
Bibile 55
Scholarship programmes to high-performing students
Monaragala 850
Providing clean drinking water
The Chronic Kidney Disease is estimated to have affected around 400,000 individuals and claimed more than 20,000 lives so far, spreading rapidly in the North Western, Eastern and Uva Provinces. Affecting predominantly male farmers in agricultural communities, the disease has caused a myriad of socio economic challenges for residents, emerging as a major health problem in rural Sri Lanka.
DPL sponsored and commissioned an RO plant in the village of Parangiyawadiya in Horowpathana with a total beneficiary base of over 1,250 individuals. This project is part of the corporate efforts by Hayleys Group “Puritas Sath Diyawara” community initiatives. In addition to water purification, the project encompasses broader community development programmes as follows;
Awareness sessions / campaigns on safe handling of pesticides, best agricultural, health and sanitation practices
Health camps and screening of villagers to identify the affected people and the level
Entrepreneurship development activities to increase the income level of the villagers.
Initial and continuous monitoring activities to measure the effectiveness of the project
Community engagement
We are cognisant of the importance of nurturing sustainable and mutually beneficial relationships in the communities we operate in. We strive to promote opportunities which enable us to play a productive role in meeting community expectations. During the year, the Hand Protection Sector implemented the required governance structures and frameworks to adopt a more strategic and focused approach towards our Corporate Social Responsibility objectives. Accordingly, CSR Committees represented by 2 GMC members, factory managers and location heads have been established in each of our operating locations to proactively identify community needs and suggest initiatives to fulfill these needs. DPL’s approach towards CSR can be illustrated as follows;

66 AffirmativeDipped Products PLC / Annual Report 2016/17
Our value creation process inevitably impacts the natural environment through the use of renewable and non-renewable resources as well as emissions, effluents and waste. As a responsible corporate citizen, we recognise this trade off and are strongly committed towards minimising the adverse environmental impacts of our operations.
NATURAL CAPITAL
2017 2016
Raw materials - Latex MT (Wet) 10,175 8,610
Energy consumption GJ mn 1.4 1.2
Water consumption M3 mn 1.6 1.4
GHG Emissions (MtCO2e) 16,401 17,294
Emission intensity (MtCO2e/per pair of gloves) 0.12 0.16
Highlights of 2016/17
Value creation against our capitals
Preserving the environment
Climate change
Water availability
MaterialIssues
67Affirmative Dipped Products PLC / Annual Report 2016/17
GJ 2017 2016
Non-renewable sourcesFurnace oil 98,967 62,122
Diesel 8,604 5,654
LPG 12,689 8,911
Renewable sourcesFirewood 1,171,084 1,047,701
Electricity from CEB 94,347 81,838
Total Consumption GJ 1,385,690 1,206,225
Management approach
A formalised environmental management framework is in place to ensure that all relevant environmental indicators are measured and monitored on an ongoing basis. In the hand protection segment, all Sri Lankan operations comply with the requirements of ISO 14001: 2004 Environmental Management Systems while the plantation segment has obtained multiple accreditations which provide assurance on its environmental management frameworks (refer page 59 for full list). The Group’s environmental management framework is underpinned on the following;
Natural inputs
Natural outputs
Products and services
Compliance
Efficient use of raw materials, energy and water
Minimising the impacts of waste, effluents and emissions
Environmentally-friendly product solutions (refer to page 68)
Compliance to all relevant environmental guidelinesInternational certifications
Materials
The Hand protection sector’s key raw materials are As one of the world’s largest glove manufacturers, DPL consumes approximately 6% of Sri Lanka’s total rubber production. We engage consistently with our latex suppliers to ensure that sustainable agricultural practices are adopted in the tapping of natural rubber. In plantations we proactively engage with our bought leaf suppliers to provide technical support and guidance in order to ensure the quality of the materials and the long-term sustainability of the crops.
Energy
We have continued to drive the use of renewable energy with the objective of reducing dependence on fossil fuels and carbon emissions. Over the past few years emphasis has been placed on installing bio-mass heaters, energy efficient lighting solutions and the use of energy efficient equipment wherever possible. Currently, the hand protection sector’s key energy sources are electricity, furnace oil,
Our value creation process inevitably impacts the natural environment through the use of renewable and non-renewable resources as well as emissions, effluents and waste
diesel and bio-mass. Following the installation of two bio-mass heaters, the Kottawa and Biyagama facilities are now powered entirely through renewable energy sources.
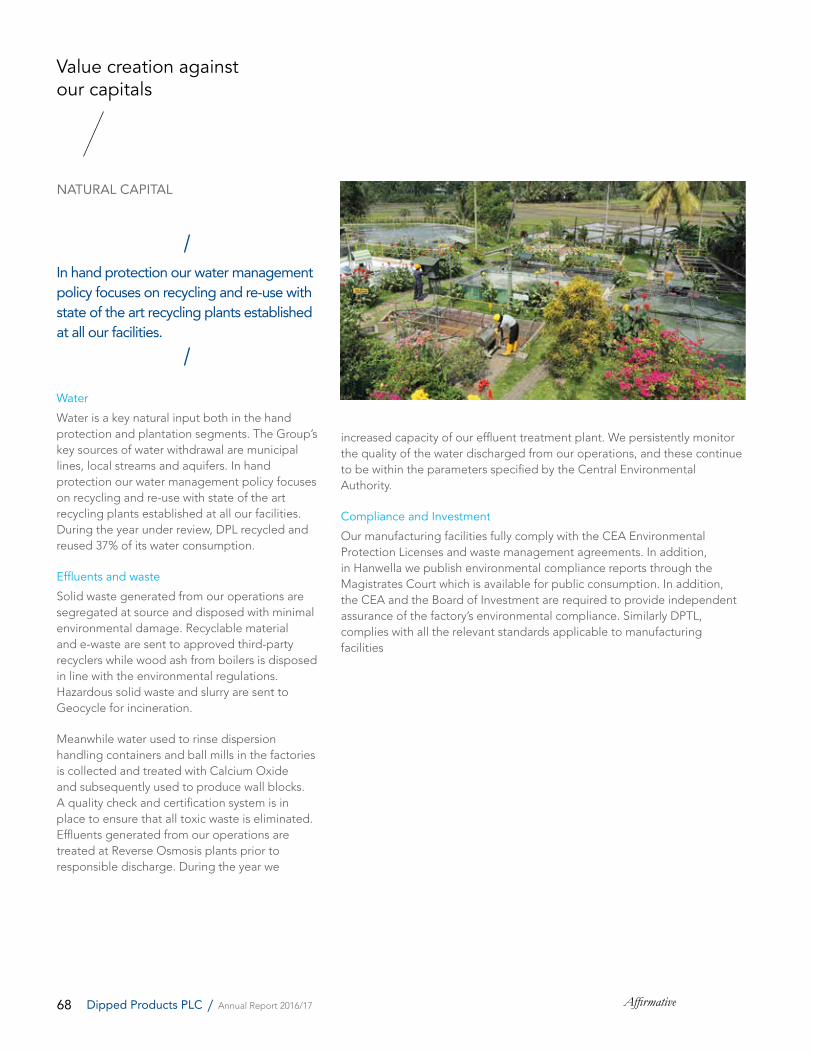
68 AffirmativeDipped Products PLC / Annual Report 2016/17
Water
Water is a key natural input both in the hand protection and plantation segments. The Group’s key sources of water withdrawal are municipal lines, local streams and aquifers. In hand protection our water management policy focuses on recycling and re-use with state of the art recycling plants established at all our facilities. During the year under review, DPL recycled and reused 37% of its water consumption.
Effluents and waste
Solid waste generated from our operations are segregated at source and disposed with minimal environmental damage. Recyclable material and e-waste are sent to approved third-party recyclers while wood ash from boilers is disposed in line with the environmental regulations. Hazardous solid waste and slurry are sent to Geocycle for incineration.
Meanwhile water used to rinse dispersion handling containers and ball mills in the factories is collected and treated with Calcium Oxide and subsequently used to produce wall blocks. A quality check and certification system is in place to ensure that all toxic waste is eliminated. Effluents generated from our operations are treated at Reverse Osmosis plants prior to responsible discharge. During the year we
In hand protection our water management policy focuses on recycling and re-use with state of the art recycling plants established at all our facilities.
increased capacity of our effluent treatment plant. We persistently monitor the quality of the water discharged from our operations, and these continue to be within the parameters specified by the Central Environmental Authority.
Compliance and Investment
Our manufacturing facilities fully comply with the CEA Environmental Protection Licenses and waste management agreements. In addition, in Hanwella we publish environmental compliance reports through the Magistrates Court which is available for public consumption. In addition, the CEA and the Board of Investment are required to provide independent assurance of the factory’s environmental compliance. Similarly DPTL, complies with all the relevant standards applicable to manufacturing facilities
Value creation against our capitals
NATURAL CAPITAL
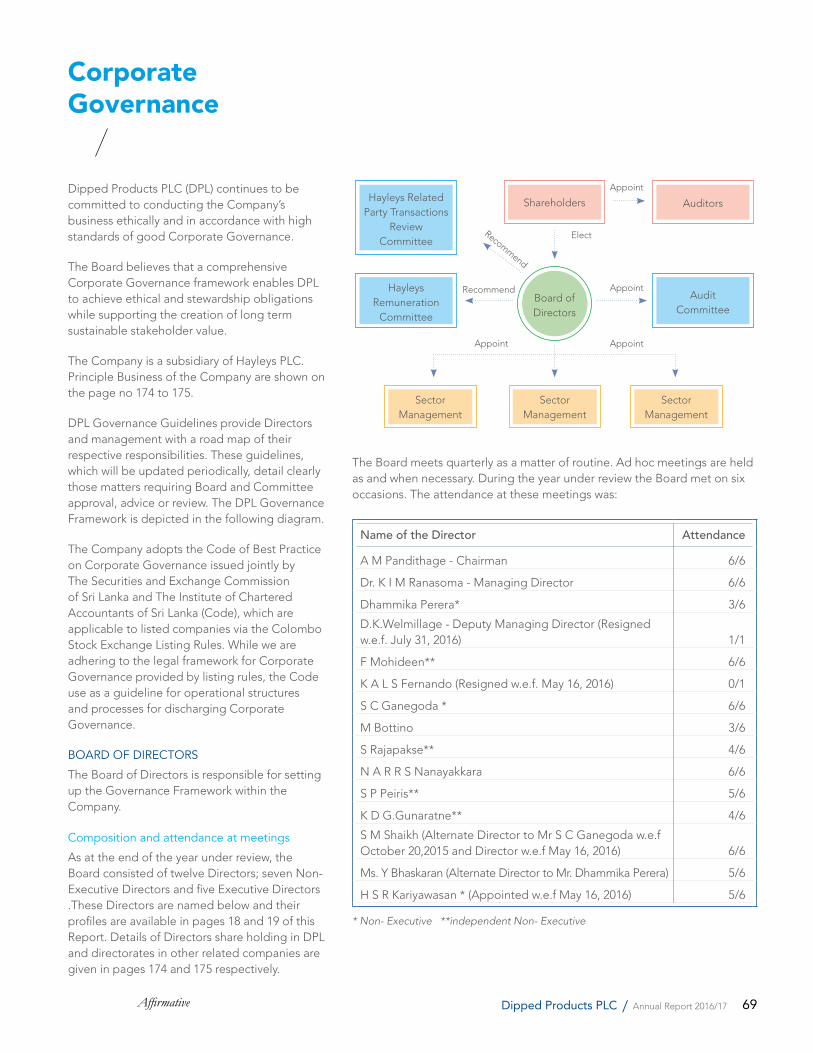
69Affirmative Dipped Products PLC / Annual Report 2016/17
Corporate Governance
Dipped Products PLC (DPL) continues to be committed to conducting the Company’s business ethically and in accordance with high standards of good Corporate Governance.
The Board believes that a comprehensive Corporate Governance framework enables DPL to achieve ethical and stewardship obligations while supporting the creation of long term sustainable stakeholder value.
The Company is a subsidiary of Hayleys PLC. Principle Business of the Company are shown on the page no 174 to 175.
DPL Governance Guidelines provide Directors and management with a road map of their respective responsibilities. These guidelines, which will be updated periodically, detail clearly those matters requiring Board and Committee approval, advice or review. The DPL Governance Framework is depicted in the following diagram.
The Company adopts the Code of Best Practice on Corporate Governance issued jointly by The Securities and Exchange Commission of Sri Lanka and The Institute of Chartered Accountants of Sri Lanka (Code), which are applicable to listed companies via the Colombo Stock Exchange Listing Rules. While we are adhering to the legal framework for Corporate Governance provided by listing rules, the Code use as a guideline for operational structures and processes for discharging Corporate Governance.
BOARD OF DIRECTORS
The Board of Directors is responsible for setting up the Governance Framework within the Company.
Composition and attendance at meetings
As at the end of the year under review, the Board consisted of twelve Directors; seven Non-Executive Directors and five Executive Directors .These Directors are named below and their profiles are available in pages 18 and 19 of this Report. Details of Directors share holding in DPL and directorates in other related companies are given in pages 174 and 175 respectively.
The Board meets quarterly as a matter of routine. Ad hoc meetings are held as and when necessary. During the year under review the Board met on six occasions. The attendance at these meetings was:
Name of the Director Attendance
A M Pandithage - Chairman 6/6
Dr. K I M Ranasoma - Managing Director 6/6
Dhammika Perera* 3/6
D.K.Welmillage - Deputy Managing Director (Resigned w.e.f. July 31, 2016) 1/1
F Mohideen** 6/6
K A L S Fernando (Resigned w.e.f. May 16, 2016) 0/1
S C Ganegoda * 6/6
M Bottino 3/6
S Rajapakse** 4/6
N A R R S Nanayakkara 6/6
S P Peiris** 5/6
K D G.Gunaratne** 4/6
S M Shaikh (Alternate Director to Mr S C Ganegoda w.e.f October 20,2015 and Director w.e.f May 16, 2016) 6/6
Ms. Y Bhaskaran (Alternate Director to Mr. Dhammika Perera) 5/6
H S R Kariyawasan * (Appointed w.e.f May 16, 2016) 5/6
* Non- Executive **independent Non- Executive
Appoint
Appoint
Elect
AppointAppoint
Recommend
Recommend
Board ofDirectors
HayleysRemuneration
Committee
ShareholdersHayleys Related Party Transactions
Review Committee
Sector Management
Sector Management
Sector Management
Auditors
AuditCommittee
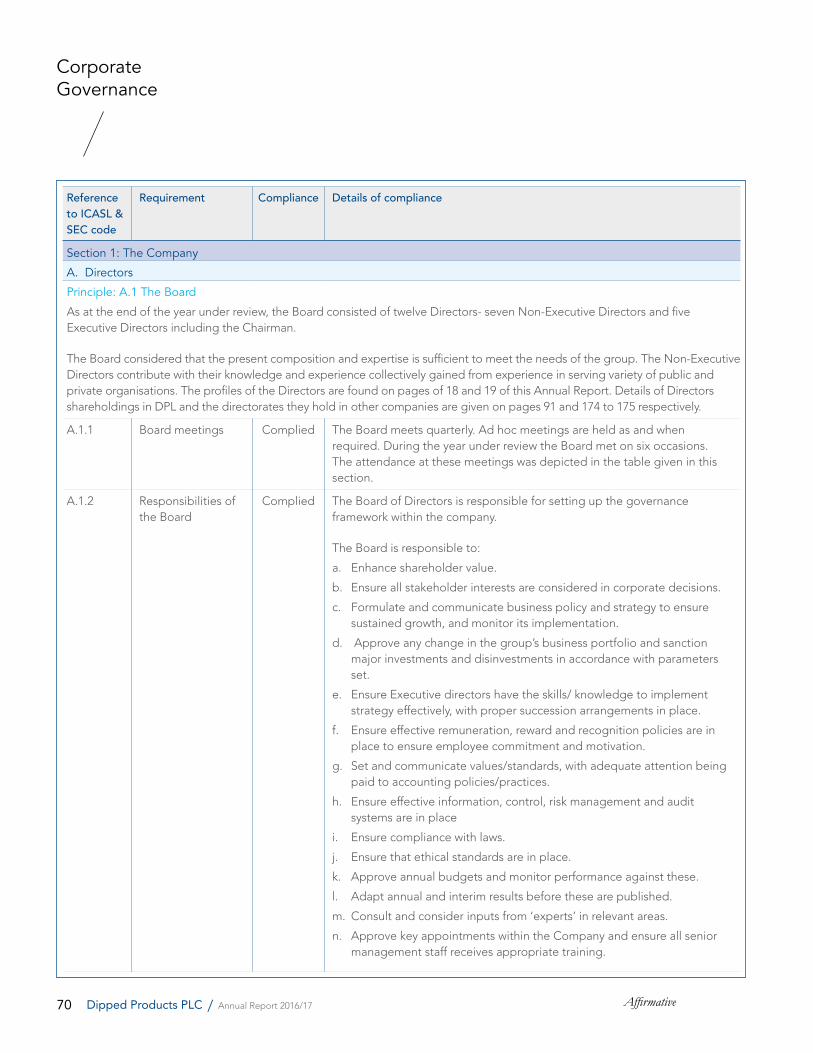
70 AffirmativeDipped Products PLC / Annual Report 2016/17
Corporate Governance
Reference to ICASL & SEC code
Requirement Compliance Details of compliance
Section 1: The Company
A. Directors
Principle: A.1 The Board
As at the end of the year under review, the Board consisted of twelve Directors- seven Non-Executive Directors and five Executive Directors including the Chairman.
The Board considered that the present composition and expertise is sufficient to meet the needs of the group. The Non-Executive Directors contribute with their knowledge and experience collectively gained from experience in serving variety of public and private organisations. The profiles of the Directors are found on pages of 18 and 19 of this Annual Report. Details of Directors shareholdings in DPL and the directorates they hold in other companies are given on pages 91 and 174 to 175 respectively.
A.1.1 Board meetings Complied The Board meets quarterly. Ad hoc meetings are held as and when required. During the year under review the Board met on six occasions. The attendance at these meetings was depicted in the table given in this section.
A.1.2 Responsibilities of the Board
Complied The Board of Directors is responsible for setting up the governance framework within the company.
The Board is responsible to:
a. Enhance shareholder value.
b. Ensure all stakeholder interests are considered in corporate decisions.
c. Formulate and communicate business policy and strategy to ensure sustained growth, and monitor its implementation.
d. Approve any change in the group’s business portfolio and sanction major investments and disinvestments in accordance with parameters set.
e. Ensure Executive directors have the skills/ knowledge to implement strategy effectively, with proper succession arrangements in place.
f. Ensure effective remuneration, reward and recognition policies are in place to ensure employee commitment and motivation.
g. Set and communicate values/standards, with adequate attention being paid to accounting policies/practices.
h. Ensure effective information, control, risk management and audit systems are in place
i. Ensure compliance with laws.
j. Ensure that ethical standards are in place.
k. Approve annual budgets and monitor performance against these.
l. Adapt annual and interim results before these are published.
m. Consult and consider inputs from ‘experts’ in relevant areas.
n. Approve key appointments within the Company and ensure all senior management staff receives appropriate training.
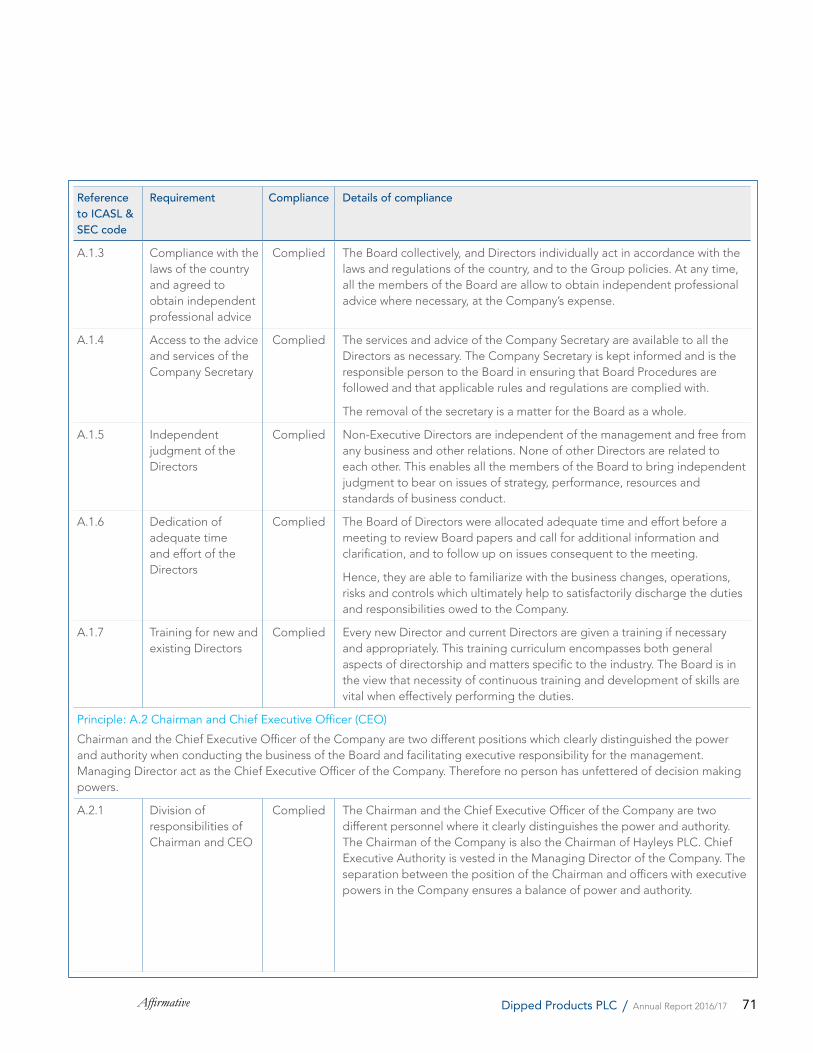
71Affirmative Dipped Products PLC / Annual Report 2016/17
Reference to ICASL & SEC code
Requirement Compliance Details of compliance
A.1.3 Compliance with the laws of the country and agreed to obtain independent professional advice
Complied The Board collectively, and Directors individually act in accordance with the laws and regulations of the country, and to the Group policies. At any time, all the members of the Board are allow to obtain independent professional advice where necessary, at the Company’s expense.
A.1.4 Access to the advice and services of the Company Secretary
Complied The services and advice of the Company Secretary are available to all the Directors as necessary. The Company Secretary is kept informed and is the responsible person to the Board in ensuring that Board Procedures are followed and that applicable rules and regulations are complied with.
The removal of the secretary is a matter for the Board as a whole.
A.1.5 Independent judgment of the Directors
Complied Non-Executive Directors are independent of the management and free from any business and other relations. None of other Directors are related to each other. This enables all the members of the Board to bring independent judgment to bear on issues of strategy, performance, resources and standards of business conduct.
A.1.6 Dedication of adequate time and effort of the Directors
Complied The Board of Directors were allocated adequate time and effort before a meeting to review Board papers and call for additional information and clarification, and to follow up on issues consequent to the meeting.
Hence, they are able to familiarize with the business changes, operations, risks and controls which ultimately help to satisfactorily discharge the duties and responsibilities owed to the Company.
A.1.7 Training for new and existing Directors
Complied Every new Director and current Directors are given a training if necessary and appropriately. This training curriculum encompasses both general aspects of directorship and matters specific to the industry. The Board is in the view that necessity of continuous training and development of skills are vital when effectively performing the duties.
Principle: A.2 Chairman and Chief Executive Officer (CEO)
Chairman and the Chief Executive Officer of the Company are two different positions which clearly distinguished the power and authority when conducting the business of the Board and facilitating executive responsibility for the management. Managing Director act as the Chief Executive Officer of the Company. Therefore no person has unfettered of decision making powers.
A.2.1 Division of responsibilities of Chairman and CEO
Complied The Chairman and the Chief Executive Officer of the Company are two different personnel where it clearly distinguishes the power and authority. The Chairman of the Company is also the Chairman of Hayleys PLC. Chief Executive Authority is vested in the Managing Director of the Company. The separation between the position of the Chairman and officers with executive powers in the Company ensures a balance of power and authority.
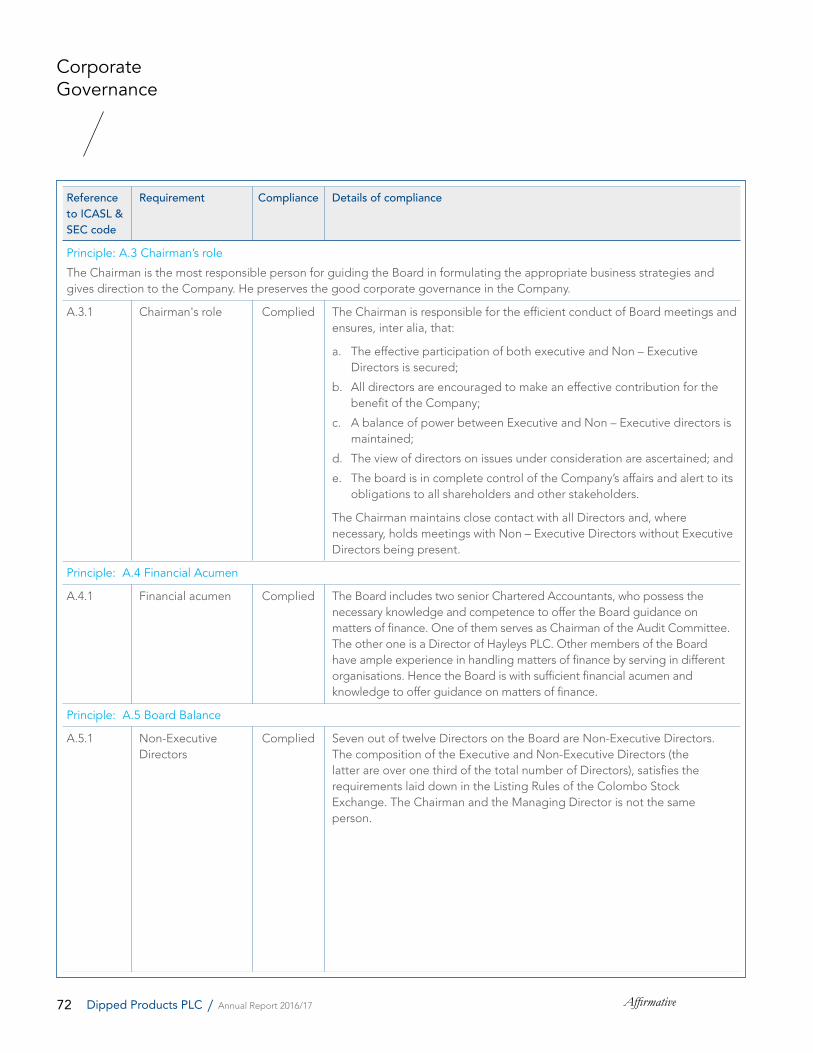
72 AffirmativeDipped Products PLC / Annual Report 2016/17
Reference to ICASL & SEC code
Requirement Compliance Details of compliance
Principle: A.3 Chairman’s role
The Chairman is the most responsible person for guiding the Board in formulating the appropriate business strategies and gives direction to the Company. He preserves the good corporate governance in the Company.
A.3.1 Chairman's role Complied The Chairman is responsible for the efficient conduct of Board meetings and ensures, inter alia, that:
a. The effective participation of both executive and Non – Executive Directors is secured;
b. All directors are encouraged to make an effective contribution for the benefit of the Company;
c. A balance of power between Executive and Non – Executive directors is maintained;
d. The view of directors on issues under consideration are ascertained; and
e. The board is in complete control of the Company’s affairs and alert to its obligations to all shareholders and other stakeholders.
The Chairman maintains close contact with all Directors and, where necessary, holds meetings with Non – Executive Directors without Executive Directors being present.
Principle: A.4 Financial Acumen
A.4.1 Financial acumen Complied The Board includes two senior Chartered Accountants, who possess the necessary knowledge and competence to offer the Board guidance on matters of finance. One of them serves as Chairman of the Audit Committee. The other one is a Director of Hayleys PLC. Other members of the Board have ample experience in handling matters of finance by serving in different organisations. Hence the Board is with sufficient financial acumen and knowledge to offer guidance on matters of finance.
Principle: A.5 Board Balance
A.5.1 Non-Executive Directors
Complied Seven out of twelve Directors on the Board are Non-Executive Directors. The composition of the Executive and Non-Executive Directors (the latter are over one third of the total number of Directors), satisfies the requirements laid down in the Listing Rules of the Colombo Stock Exchange. The Chairman and the Managing Director is not the same person.
Corporate Governance
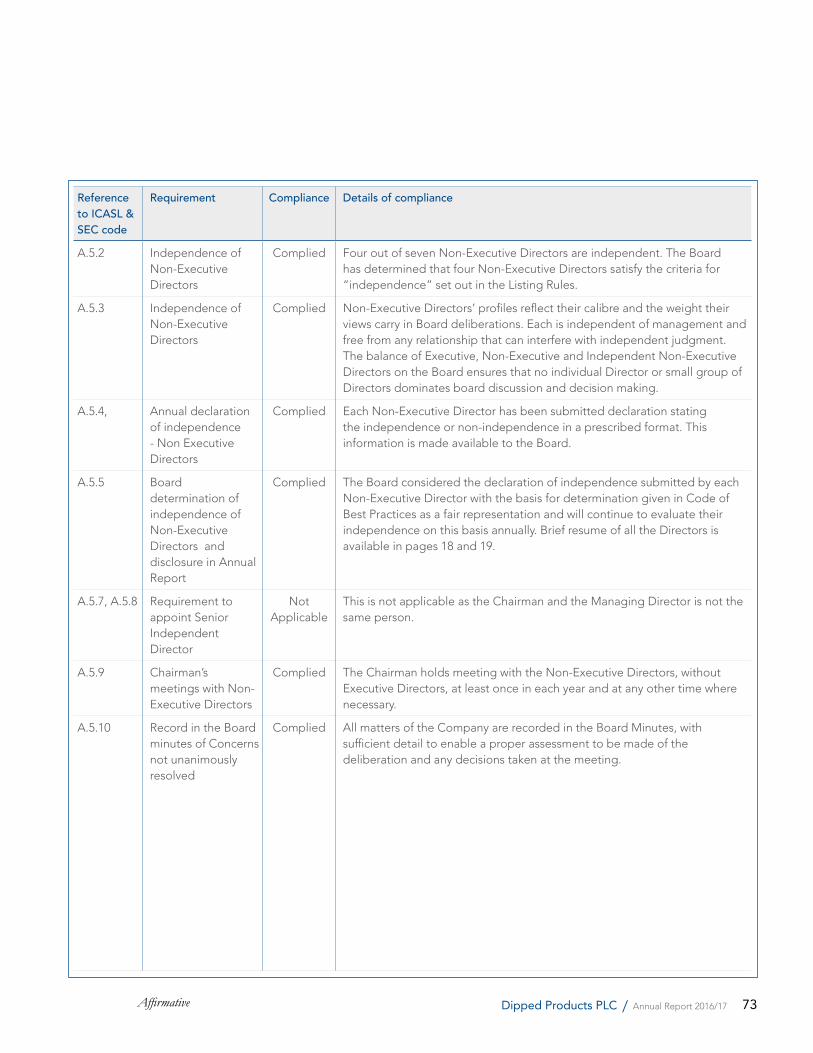
73Affirmative Dipped Products PLC / Annual Report 2016/17
Reference to ICASL & SEC code
Requirement Compliance Details of compliance
A.5.2 Independence of Non-Executive Directors
Complied Four out of seven Non-Executive Directors are independent. The Board has determined that four Non-Executive Directors satisfy the criteria for “independence” set out in the Listing Rules.
A.5.3 Independence of Non-Executive Directors
Complied Non-Executive Directors’ profiles reflect their calibre and the weight their views carry in Board deliberations. Each is independent of management and free from any relationship that can interfere with independent judgment. The balance of Executive, Non-Executive and Independent Non-Executive Directors on the Board ensures that no individual Director or small group of Directors dominates board discussion and decision making.
A.5.4, Annual declaration of independence - Non Executive Directors
Complied Each Non-Executive Director has been submitted declaration stating the independence or non-independence in a prescribed format. This information is made available to the Board.
A.5.5 Board determination of independence of Non-Executive Directors and disclosure in Annual Report
Complied The Board considered the declaration of independence submitted by each Non-Executive Director with the basis for determination given in Code of Best Practices as a fair representation and will continue to evaluate their independence on this basis annually. Brief resume of all the Directors is available in pages 18 and 19.
A.5.7, A.5.8 Requirement to appoint Senior Independent Director
Not Applicable
This is not applicable as the Chairman and the Managing Director is not the same person.
A.5.9 Chairman’s meetings with Non-Executive Directors
Complied The Chairman holds meeting with the Non-Executive Directors, without Executive Directors, at least once in each year and at any other time where necessary.
A.5.10 Record in the Board minutes of Concerns not unanimously resolved
Complied All matters of the Company are recorded in the Board Minutes, with sufficient detail to enable a proper assessment to be made of the deliberation and any decisions taken at the meeting.

74 AffirmativeDipped Products PLC / Annual Report 2016/17
Reference to ICASL & SEC code
Requirement Compliance Details of compliance
Principle: A.6 Supply of information
A.6.1 Timely information to the Board
Complied Directors are provided with quarterly reports on performance and such other reports and documents as are necessary. The Chairman ensures all Directors are adequately briefed on issues arising at meetings.
A.6.2 Information provided in advance to the Board meetings
Complied The Board meetings are arranged in advance and all Directors are informed. The Directors are provided with minutes, the agenda and the Board papers in advance to prepare and clearly comprehend with the matters discussed or consent.
Principle: A.7 Appointments to the Board
A.7.1, A.7.2 Appointment to the Board
Complied Hayleys PLC, the parent company’s Nominations Committee functions as the Nominations Committee of the company and makes recommendations to the Board on all new Board appointments.
The nomination committee comprises of following members.
A M Pandithage * - Chairman
Dhammika Perera **
Dr. H Cabral, PC ***
W D N H Perera*** (resigned w.e.f March 08, 2017)
*Executive Director**Non-Executive Director***Independent Non-Executive Director
The Board annually assesses the Board composition to ascertain whether the combined knowledge and experience of the Board matches the strategic demands facing the Company.
A.7.3 Disclosure of new appointments
Complied A brief resume of the Director, nature of his experience and names of the companies he holds the directorship and the independency is informed to the Colombo Stock Exchange and disclose in the Annual Report.
Corporate Governance
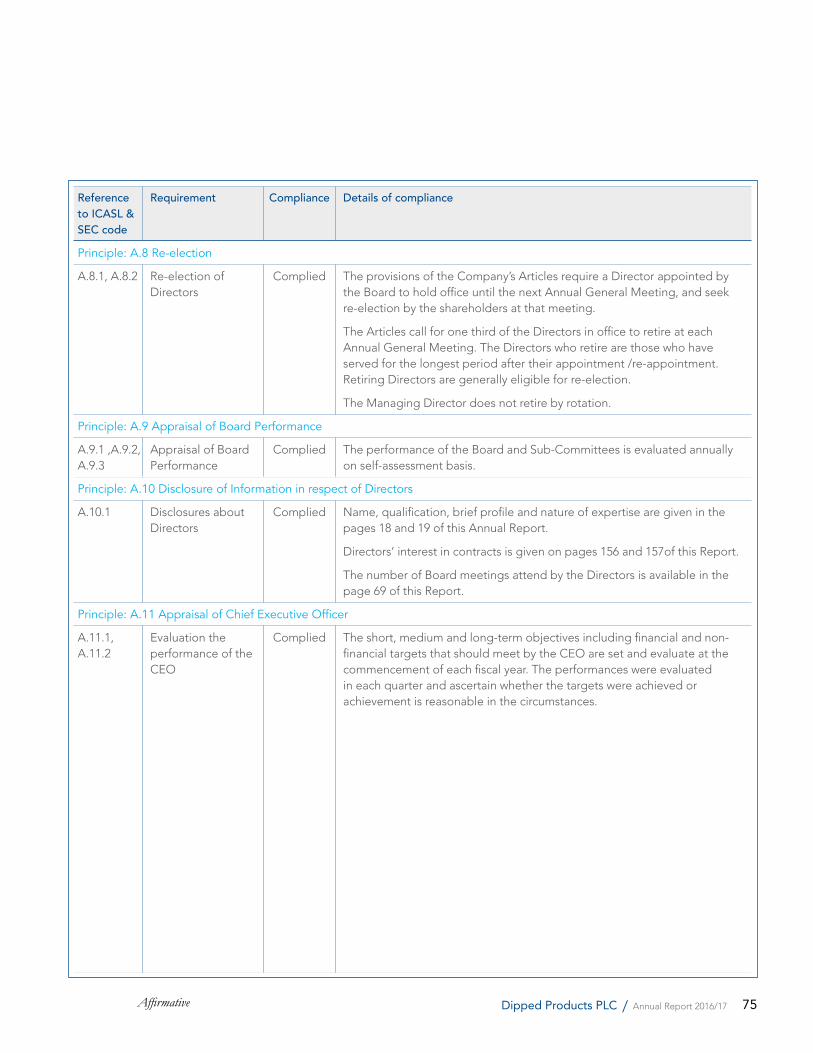
75Affirmative Dipped Products PLC / Annual Report 2016/17
Reference to ICASL & SEC code
Requirement Compliance Details of compliance
Principle: A.8 Re-election
A.8.1, A.8.2 Re-election of Directors
Complied The provisions of the Company’s Articles require a Director appointed by the Board to hold office until the next Annual General Meeting, and seek re-election by the shareholders at that meeting.
The Articles call for one third of the Directors in office to retire at each Annual General Meeting. The Directors who retire are those who have served for the longest period after their appointment /re-appointment. Retiring Directors are generally eligible for re-election.
The Managing Director does not retire by rotation.
Principle: A.9 Appraisal of Board Performance
A.9.1 ,A.9.2, A.9.3
Appraisal of Board Performance
Complied The performance of the Board and Sub-Committees is evaluated annually on self-assessment basis.
Principle: A.10 Disclosure of Information in respect of Directors
A.10.1 Disclosures about Directors
Complied Name, qualification, brief profile and nature of expertise are given in the pages 18 and 19 of this Annual Report.
Directors’ interest in contracts is given on pages 156 and 157of this Report.
The number of Board meetings attend by the Directors is available in the page 69 of this Report.
Principle: A.11 Appraisal of Chief Executive Officer
A.11.1, A.11.2
Evaluation the performance of the CEO
Complied The short, medium and long-term objectives including financial and non-financial targets that should meet by the CEO are set and evaluate at the commencement of each fiscal year. The performances were evaluated in each quarter and ascertain whether the targets were achieved or achievement is reasonable in the circumstances.
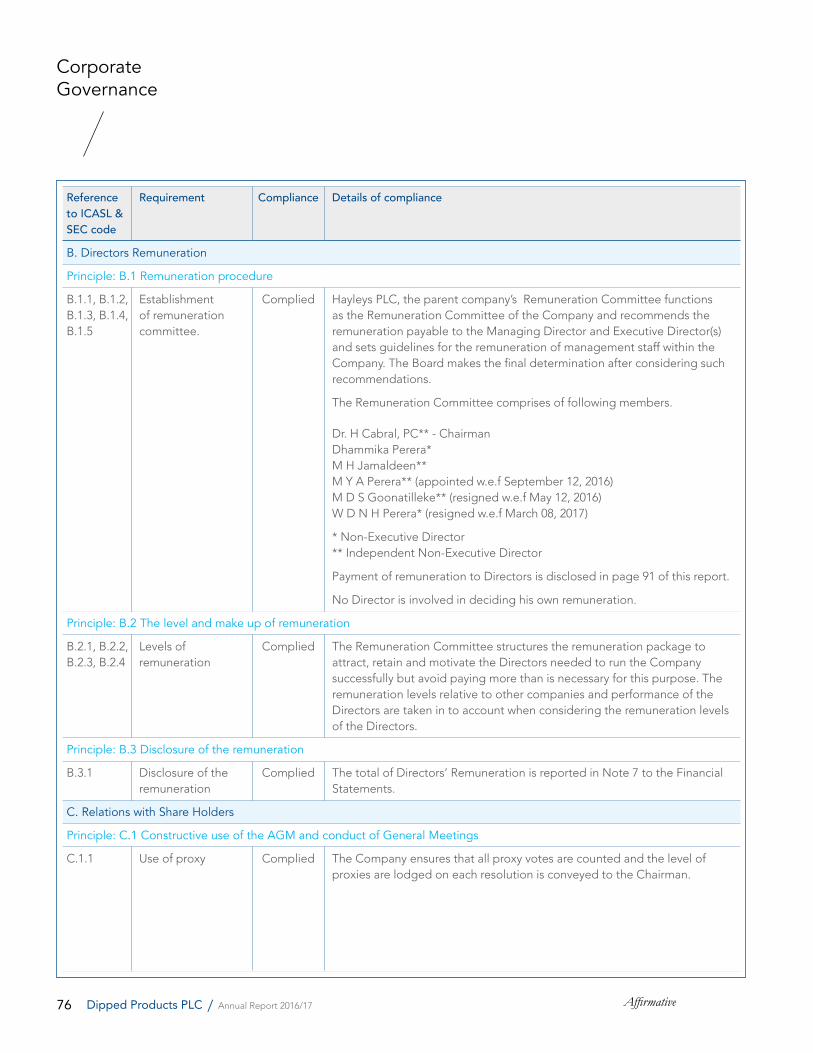
76 AffirmativeDipped Products PLC / Annual Report 2016/17
Reference to ICASL & SEC code
Requirement Compliance Details of compliance
B. Directors Remuneration
Principle: B.1 Remuneration procedure
B.1.1, B.1.2, B.1.3, B.1.4, B.1.5
Establishment of remuneration committee.
Complied Hayleys PLC, the parent company’s Remuneration Committee functions as the Remuneration Committee of the Company and recommends the remuneration payable to the Managing Director and Executive Director(s) and sets guidelines for the remuneration of management staff within the Company. The Board makes the final determination after considering such recommendations.
The Remuneration Committee comprises of following members.
Dr. H Cabral, PC** - ChairmanDhammika Perera*M H Jamaldeen**M Y A Perera** (appointed w.e.f September 12, 2016)M D S Goonatilleke** (resigned w.e.f May 12, 2016)W D N H Perera* (resigned w.e.f March 08, 2017)
* Non-Executive Director** Independent Non-Executive Director
Payment of remuneration to Directors is disclosed in page 91 of this report.
No Director is involved in deciding his own remuneration.
Principle: B.2 The level and make up of remuneration
B.2.1, B.2.2, B.2.3, B.2.4
Levels of remuneration
Complied The Remuneration Committee structures the remuneration package to attract, retain and motivate the Directors needed to run the Company successfully but avoid paying more than is necessary for this purpose. The remuneration levels relative to other companies and performance of the Directors are taken in to account when considering the remuneration levels of the Directors.
Principle: B.3 Disclosure of the remuneration
B.3.1 Disclosure of the remuneration
Complied The total of Directors’ Remuneration is reported in Note 7 to the Financial Statements.
C. Relations with Share Holders
Principle: C.1 Constructive use of the AGM and conduct of General Meetings
C.1.1 Use of proxy Complied The Company ensures that all proxy votes are counted and the level of proxies are lodged on each resolution is conveyed to the Chairman.
Corporate Governance
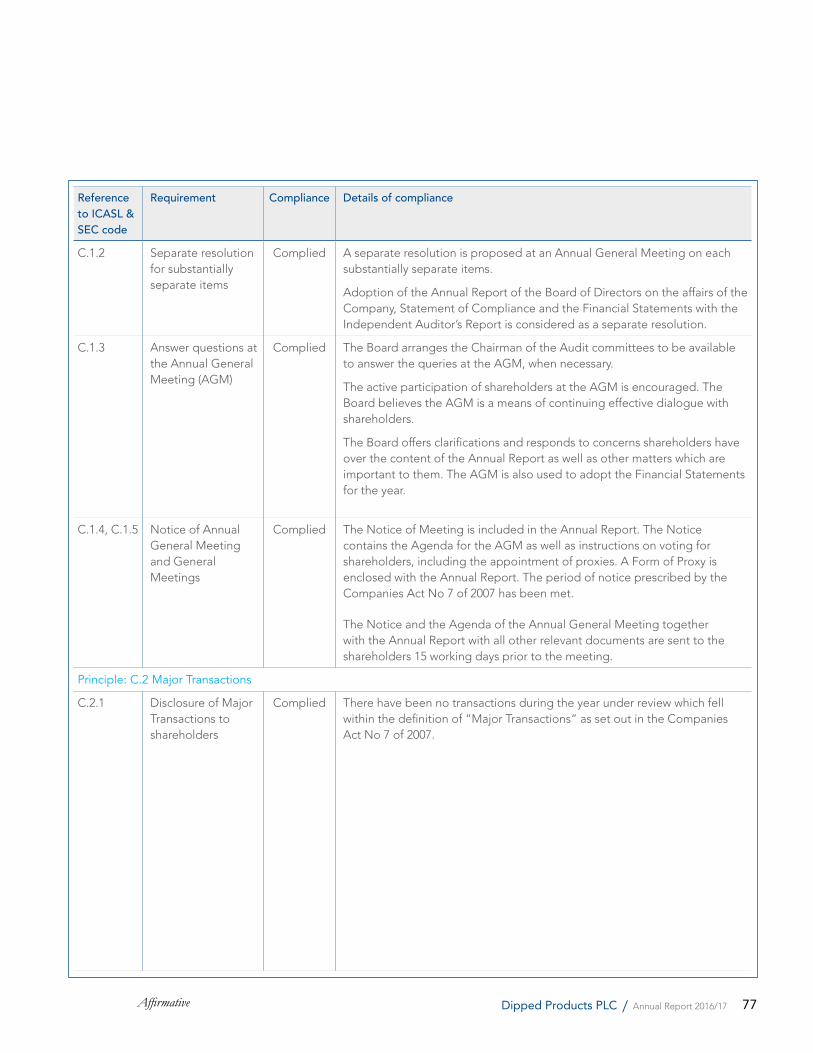
77Affirmative Dipped Products PLC / Annual Report 2016/17
Reference to ICASL & SEC code
Requirement Compliance Details of compliance
C.1.2 Separate resolution for substantially separate items
Complied A separate resolution is proposed at an Annual General Meeting on each substantially separate items.
Adoption of the Annual Report of the Board of Directors on the affairs of the Company, Statement of Compliance and the Financial Statements with the Independent Auditor’s Report is considered as a separate resolution.
C.1.3 Answer questions at the Annual General Meeting (AGM)
Complied The Board arranges the Chairman of the Audit committees to be available to answer the queries at the AGM, when necessary.
The active participation of shareholders at the AGM is encouraged. The Board believes the AGM is a means of continuing effective dialogue with shareholders.
The Board offers clarifications and responds to concerns shareholders have over the content of the Annual Report as well as other matters which are important to them. The AGM is also used to adopt the Financial Statements for the year.
C.1.4, C.1.5 Notice of Annual General Meeting and General Meetings
Complied The Notice of Meeting is included in the Annual Report. The Notice contains the Agenda for the AGM as well as instructions on voting for shareholders, including the appointment of proxies. A Form of Proxy is enclosed with the Annual Report. The period of notice prescribed by the Companies Act No 7 of 2007 has been met.
The Notice and the Agenda of the Annual General Meeting together with the Annual Report with all other relevant documents are sent to the shareholders 15 working days prior to the meeting.
Principle: C.2 Major Transactions
C.2.1 Disclosure of Major Transactions to shareholders
Complied There have been no transactions during the year under review which fell within the definition of “Major Transactions” as set out in the Companies Act No 7 of 2007.
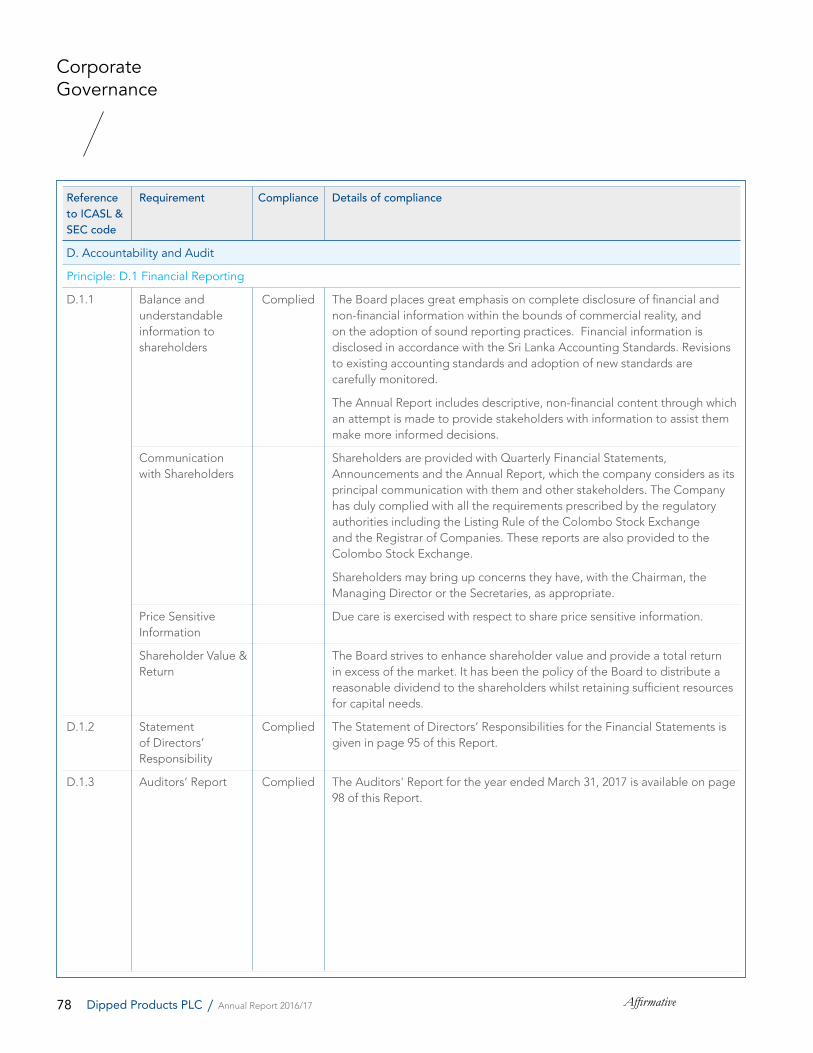
78 AffirmativeDipped Products PLC / Annual Report 2016/17
Reference to ICASL & SEC code
Requirement Compliance Details of compliance
D. Accountability and Audit
Principle: D.1 Financial Reporting
D.1.1 Balance and understandable information to shareholders
Complied The Board places great emphasis on complete disclosure of financial and non-financial information within the bounds of commercial reality, and on the adoption of sound reporting practices. Financial information is disclosed in accordance with the Sri Lanka Accounting Standards. Revisions to existing accounting standards and adoption of new standards are carefully monitored.
The Annual Report includes descriptive, non-financial content through which an attempt is made to provide stakeholders with information to assist them make more informed decisions.
Communication with Shareholders
Shareholders are provided with Quarterly Financial Statements, Announcements and the Annual Report, which the company considers as its principal communication with them and other stakeholders. The Company has duly complied with all the requirements prescribed by the regulatory authorities including the Listing Rule of the Colombo Stock Exchange and the Registrar of Companies. These reports are also provided to the Colombo Stock Exchange.
Shareholders may bring up concerns they have, with the Chairman, the Managing Director or the Secretaries, as appropriate.
Price Sensitive Information
Due care is exercised with respect to share price sensitive information.
Shareholder Value & Return
The Board strives to enhance shareholder value and provide a total return in excess of the market. It has been the policy of the Board to distribute a reasonable dividend to the shareholders whilst retaining sufficient resources for capital needs.
D.1.2 Statement of Directors’ Responsibility
Complied The Statement of Directors’ Responsibilities for the Financial Statements is given in page 95 of this Report.
D.1.3 Auditors’ Report Complied The Auditors' Report for the year ended March 31, 2017 is available on page 98 of this Report.
Corporate Governance
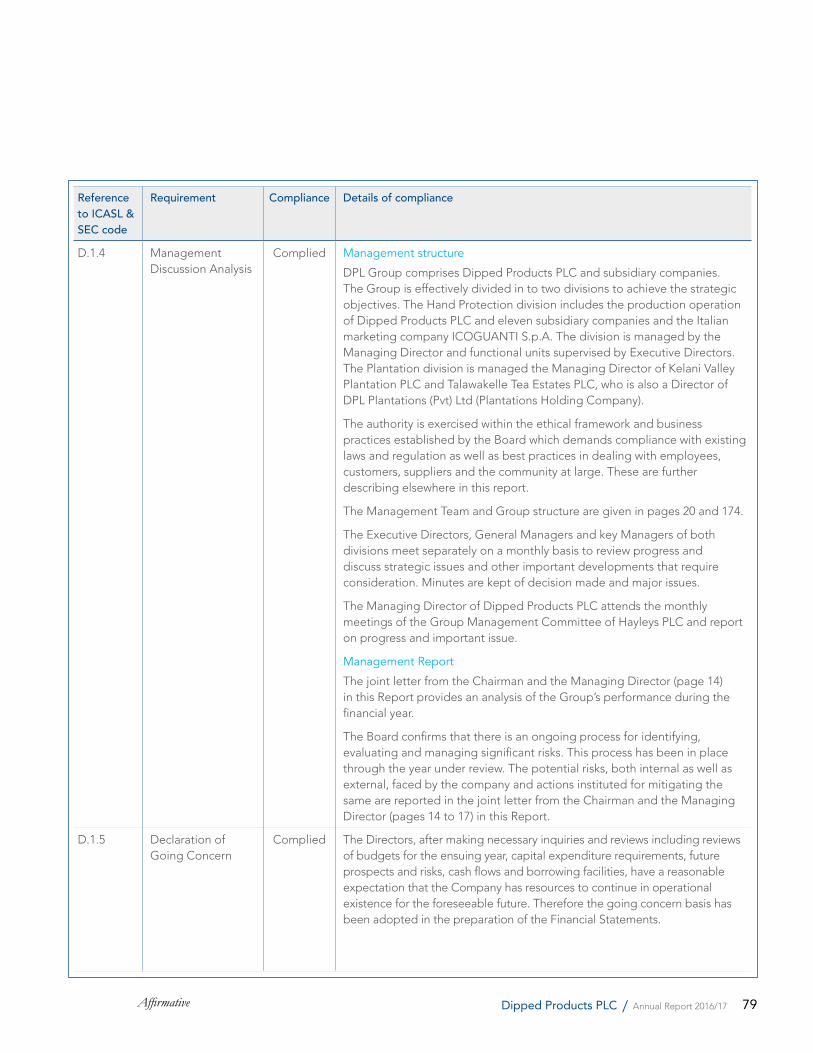
79Affirmative Dipped Products PLC / Annual Report 2016/17
Reference to ICASL & SEC code
Requirement Compliance Details of compliance
D.1.4 Management Discussion Analysis
Complied Management structure
DPL Group comprises Dipped Products PLC and subsidiary companies. The Group is effectively divided in to two divisions to achieve the strategic objectives. The Hand Protection division includes the production operation of Dipped Products PLC and eleven subsidiary companies and the Italian marketing company ICOGUANTI S.p.A. The division is managed by the Managing Director and functional units supervised by Executive Directors. The Plantation division is managed the Managing Director of Kelani Valley Plantation PLC and Talawakelle Tea Estates PLC, who is also a Director of DPL Plantations (Pvt) Ltd (Plantations Holding Company).
The authority is exercised within the ethical framework and business practices established by the Board which demands compliance with existing laws and regulation as well as best practices in dealing with employees, customers, suppliers and the community at large. These are further describing elsewhere in this report.
The Management Team and Group structure are given in pages 20 and 174.
The Executive Directors, General Managers and key Managers of both divisions meet separately on a monthly basis to review progress and discuss strategic issues and other important developments that require consideration. Minutes are kept of decision made and major issues.
The Managing Director of Dipped Products PLC attends the monthly meetings of the Group Management Committee of Hayleys PLC and report on progress and important issue.
Management Report
The joint letter from the Chairman and the Managing Director (page 14) in this Report provides an analysis of the Group’s performance during the financial year.
The Board confirms that there is an ongoing process for identifying, evaluating and managing significant risks. This process has been in place through the year under review. The potential risks, both internal as well as external, faced by the company and actions instituted for mitigating the same are reported in the joint letter from the Chairman and the Managing Director (pages 14 to 17) in this Report.
D.1.5 Declaration of Going Concern
Complied The Directors, after making necessary inquiries and reviews including reviews of budgets for the ensuing year, capital expenditure requirements, future prospects and risks, cash flows and borrowing facilities, have a reasonable expectation that the Company has resources to continue in operational existence for the foreseeable future. Therefore the going concern basis has been adopted in the preparation of the Financial Statements.
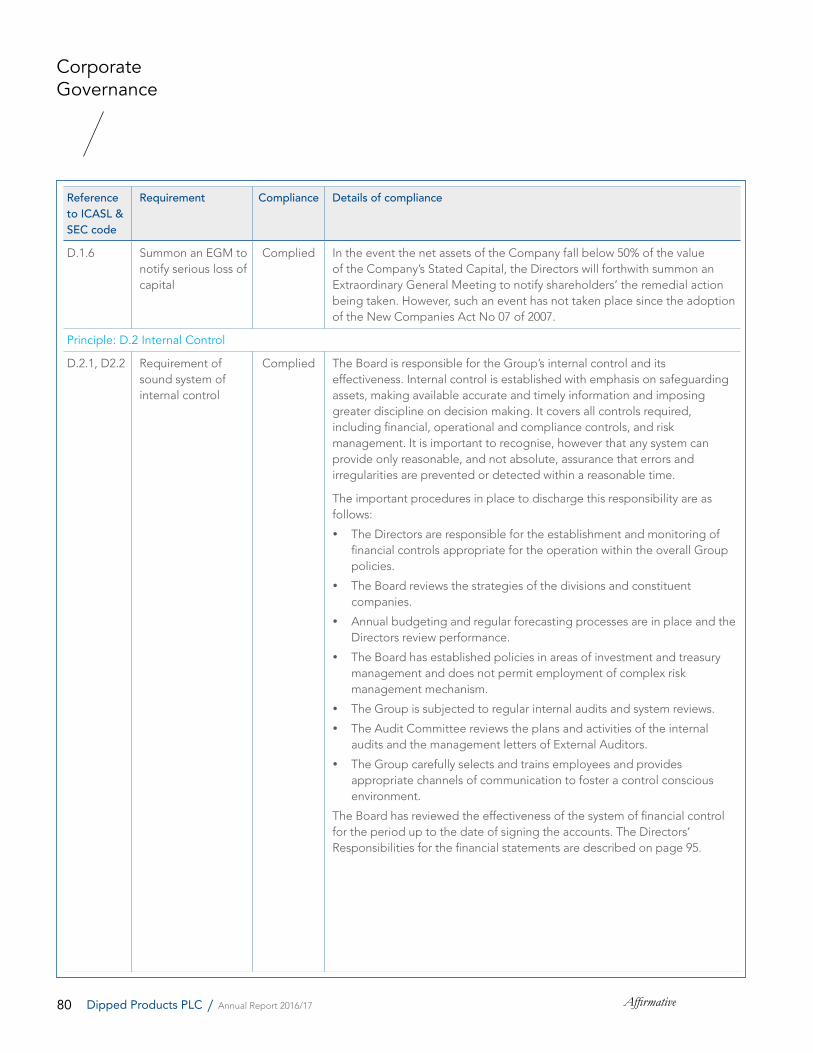
80 AffirmativeDipped Products PLC / Annual Report 2016/17
Reference to ICASL & SEC code
Requirement Compliance Details of compliance
D.1.6 Summon an EGM to notify serious loss of capital
Complied In the event the net assets of the Company fall below 50% of the value of the Company’s Stated Capital, the Directors will forthwith summon an Extraordinary General Meeting to notify shareholders’ the remedial action being taken. However, such an event has not taken place since the adoption of the New Companies Act No 07 of 2007.
Principle: D.2 Internal Control
D.2.1, D2.2 Requirement of sound system of internal control
Complied The Board is responsible for the Group’s internal control and its effectiveness. Internal control is established with emphasis on safeguarding assets, making available accurate and timely information and imposing greater discipline on decision making. It covers all controls required, including financial, operational and compliance controls, and risk management. It is important to recognise, however that any system can provide only reasonable, and not absolute, assurance that errors and irregularities are prevented or detected within a reasonable time.
The important procedures in place to discharge this responsibility are as follows:
The Directors are responsible for the establishment and monitoring of financial controls appropriate for the operation within the overall Group policies.
The Board reviews the strategies of the divisions and constituent companies.
Annual budgeting and regular forecasting processes are in place and the Directors review performance.
The Board has established policies in areas of investment and treasury management and does not permit employment of complex risk management mechanism.
The Group is subjected to regular internal audits and system reviews.
The Audit Committee reviews the plans and activities of the internal audits and the management letters of External Auditors.
The Group carefully selects and trains employees and provides appropriate channels of communication to foster a control conscious environment.
The Board has reviewed the effectiveness of the system of financial control for the period up to the date of signing the accounts. The Directors’ Responsibilities for the financial statements are described on page 95.
Corporate Governance
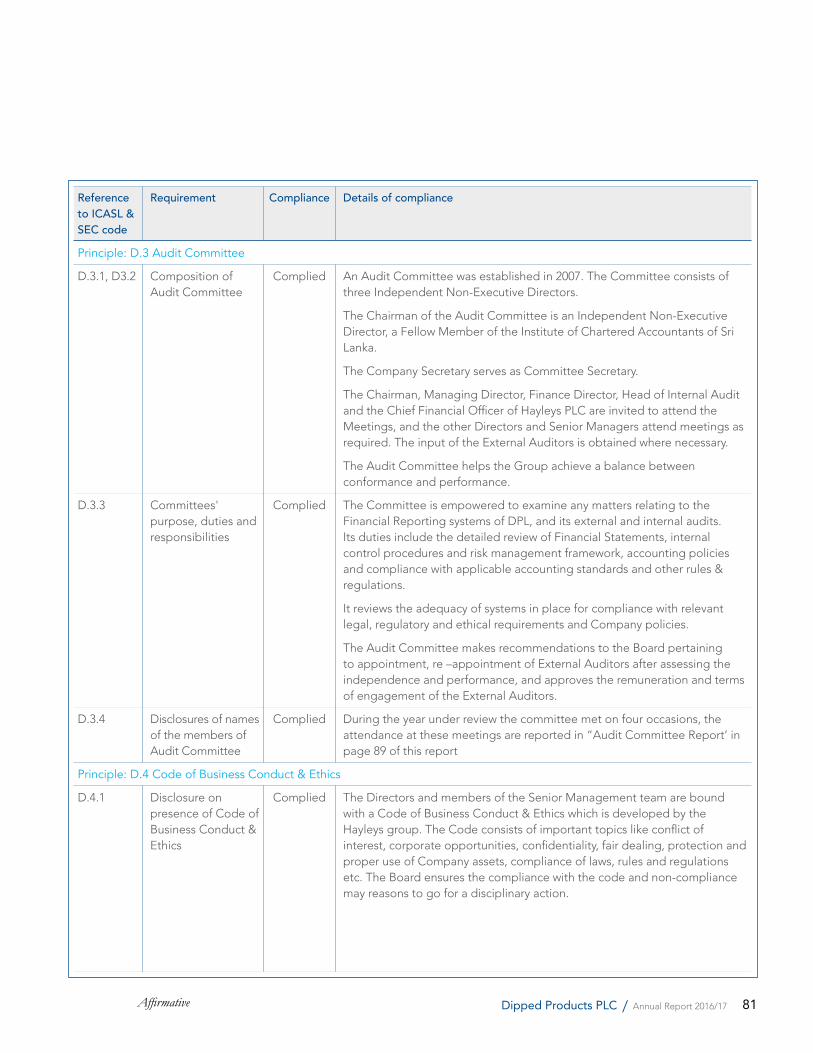
81Affirmative Dipped Products PLC / Annual Report 2016/17
Reference to ICASL & SEC code
Requirement Compliance Details of compliance
Principle: D.3 Audit Committee
D.3.1, D3.2 Composition of Audit Committee
Complied An Audit Committee was established in 2007. The Committee consists of three Independent Non-Executive Directors.
The Chairman of the Audit Committee is an Independent Non-Executive Director, a Fellow Member of the Institute of Chartered Accountants of Sri Lanka.
The Company Secretary serves as Committee Secretary.
The Chairman, Managing Director, Finance Director, Head of Internal Audit and the Chief Financial Officer of Hayleys PLC are invited to attend the Meetings, and the other Directors and Senior Managers attend meetings as required. The input of the External Auditors is obtained where necessary.
The Audit Committee helps the Group achieve a balance between conformance and performance.
D.3.3 Committees' purpose, duties and responsibilities
Complied The Committee is empowered to examine any matters relating to the Financial Reporting systems of DPL, and its external and internal audits. Its duties include the detailed review of Financial Statements, internal control procedures and risk management framework, accounting policies and compliance with applicable accounting standards and other rules & regulations.
It reviews the adequacy of systems in place for compliance with relevant legal, regulatory and ethical requirements and Company policies.
The Audit Committee makes recommendations to the Board pertaining to appointment, re –appointment of External Auditors after assessing the independence and performance, and approves the remuneration and terms of engagement of the External Auditors.
D.3.4 Disclosures of names of the members of Audit Committee
Complied During the year under review the committee met on four occasions, the attendance at these meetings are reported in “Audit Committee Report’ in page 89 of this report
Principle: D.4 Code of Business Conduct & Ethics
D.4.1 Disclosure on presence of Code of Business Conduct & Ethics
Complied The Directors and members of the Senior Management team are bound with a Code of Business Conduct & Ethics which is developed by the Hayleys group. The Code consists of important topics like conflict of interest, corporate opportunities, confidentiality, fair dealing, protection and proper use of Company assets, compliance of laws, rules and regulations etc. The Board ensures the compliance with the code and non-compliance may reasons to go for a disciplinary action.
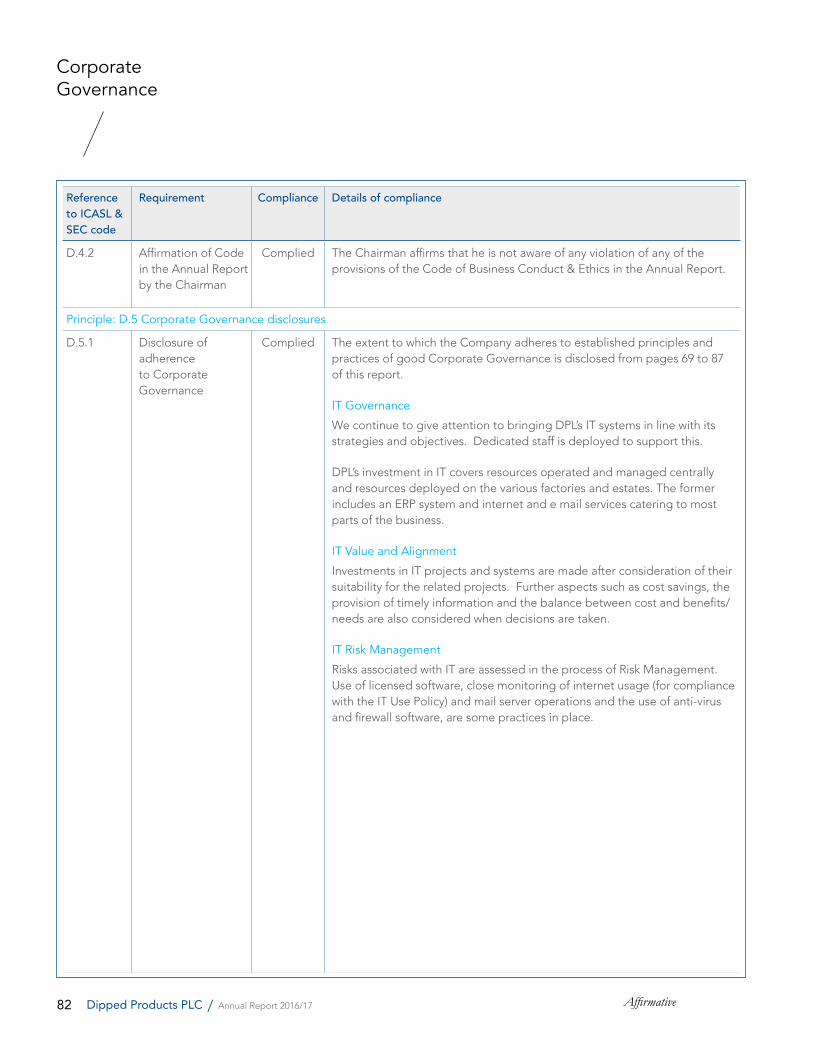
82 AffirmativeDipped Products PLC / Annual Report 2016/17
Reference to ICASL & SEC code
Requirement Compliance Details of compliance
D.4.2 Affirmation of Code in the Annual Report by the Chairman
Complied The Chairman affirms that he is not aware of any violation of any of the provisions of the Code of Business Conduct & Ethics in the Annual Report.
Principle: D.5 Corporate Governance disclosures
D.5.1 Disclosure of adherence to Corporate Governance
Complied The extent to which the Company adheres to established principles and practices of good Corporate Governance is disclosed from pages 69 to 87 of this report.
IT Governance
We continue to give attention to bringing DPL’s IT systems in line with its strategies and objectives. Dedicated staff is deployed to support this.
DPL’s investment in IT covers resources operated and managed centrally and resources deployed on the various factories and estates. The former includes an ERP system and internet and e mail services catering to most parts of the business.
IT Value and Alignment
Investments in IT projects and systems are made after consideration of their suitability for the related projects. Further aspects such as cost savings, the provision of timely information and the balance between cost and benefits/ needs are also considered when decisions are taken.
IT Risk Management
Risks associated with IT are assessed in the process of Risk Management. Use of licensed software, close monitoring of internet usage (for compliance with the IT Use Policy) and mail server operations and the use of anti-virus and firewall software, are some practices in place.
Corporate Governance
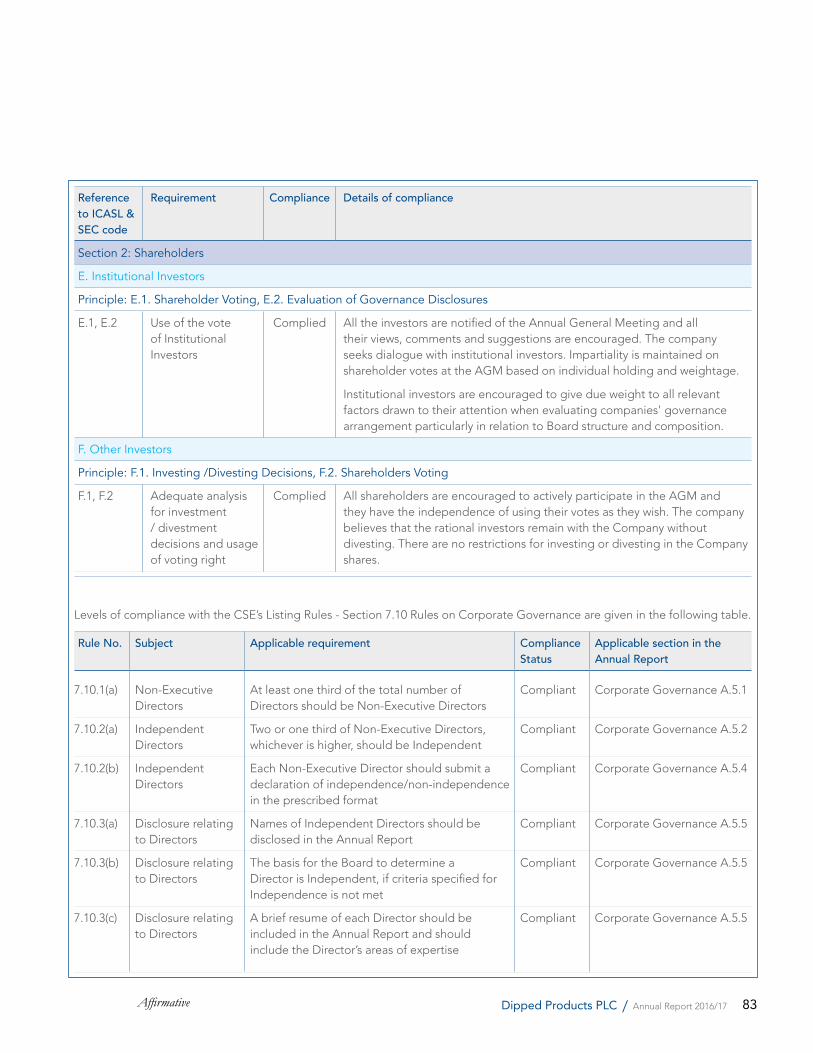
83Affirmative Dipped Products PLC / Annual Report 2016/17
Reference to ICASL & SEC code
Requirement Compliance Details of compliance
Section 2: Shareholders
E. Institutional Investors
Principle: E.1. Shareholder Voting, E.2. Evaluation of Governance Disclosures
E.1, E.2 Use of the vote of Institutional Investors
Complied All the investors are notified of the Annual General Meeting and all their views, comments and suggestions are encouraged. The company seeks dialogue with institutional investors. Impartiality is maintained on shareholder votes at the AGM based on individual holding and weightage.
Institutional investors are encouraged to give due weight to all relevant factors drawn to their attention when evaluating companies' governance arrangement particularly in relation to Board structure and composition.
F. Other Investors
Principle: F.1. Investing /Divesting Decisions, F.2. Shareholders Voting
F.1, F.2 Adequate analysis for investment / divestment decisions and usage of voting right
Complied All shareholders are encouraged to actively participate in the AGM and they have the independence of using their votes as they wish. The company believes that the rational investors remain with the Company without divesting. There are no restrictions for investing or divesting in the Company shares.
Levels of compliance with the CSE’s Listing Rules - Section 7.10 Rules on Corporate Governance are given in the following table.
Rule No. Subject Applicable requirement Compliance Status
Applicable section in the Annual Report
7.10.1(a) Non-Executive Directors
At least one third of the total number of Directors should be Non-Executive Directors
Compliant Corporate Governance A.5.1
7.10.2(a) Independent Directors
Two or one third of Non-Executive Directors, whichever is higher, should be Independent
Compliant Corporate Governance A.5.2
7.10.2(b) Independent Directors
Each Non-Executive Director should submit a declaration of independence/non-independence in the prescribed format
Compliant Corporate Governance A.5.4
7.10.3(a) Disclosure relating to Directors
Names of Independent Directors should be disclosed in the Annual Report
Compliant Corporate Governance A.5.5
7.10.3(b) Disclosure relating to Directors
The basis for the Board to determine a Director is Independent, if criteria specified for Independence is not met
Compliant Corporate Governance A.5.5
7.10.3(c) Disclosure relating to Directors
A brief resume of each Director should be included in the Annual Report and should include the Director’s areas of expertise
Compliant Corporate Governance A.5.5
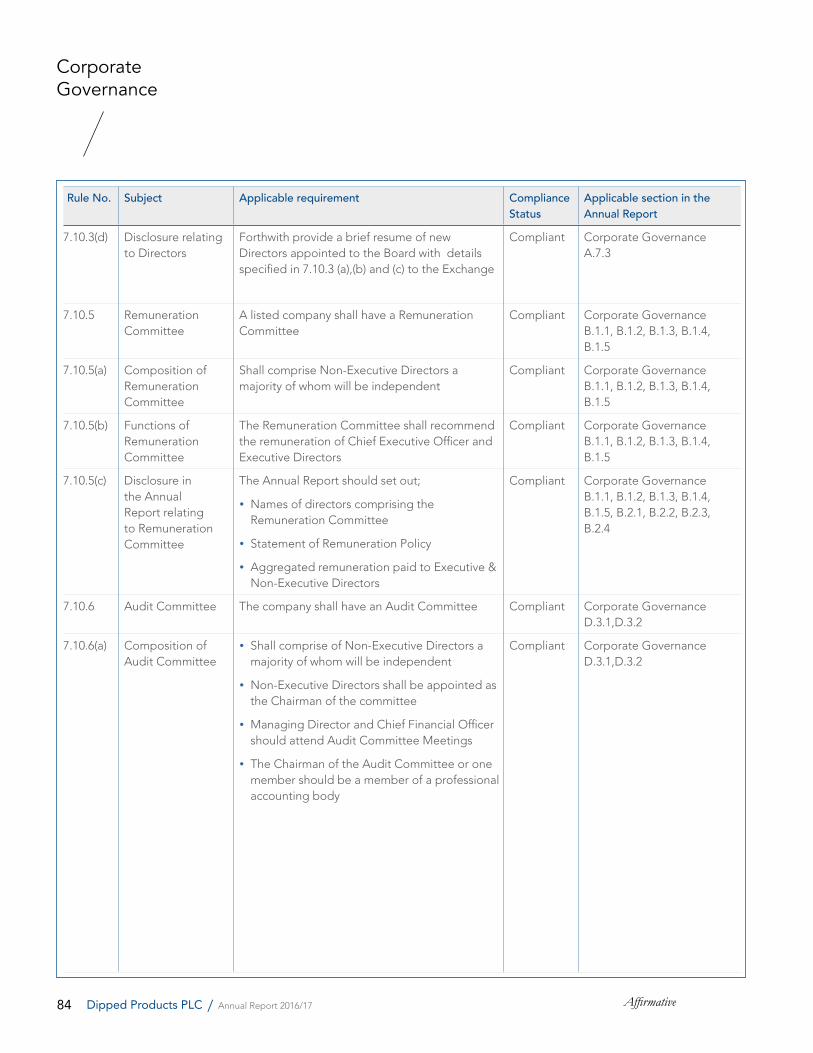
84 AffirmativeDipped Products PLC / Annual Report 2016/17
Rule No. Subject Applicable requirement Compliance Status
Applicable section in the Annual Report
7.10.3(d) Disclosure relating to Directors
Forthwith provide a brief resume of new Directors appointed to the Board with details specified in 7.10.3 (a),(b) and (c) to the Exchange
Compliant Corporate Governance A.7.3
7.10.5 Remuneration Committee
A listed company shall have a Remuneration Committee
Compliant Corporate Governance B.1.1, B.1.2, B.1.3, B.1.4, B.1.5
7.10.5(a) Composition of Remuneration Committee
Shall comprise Non-Executive Directors a majority of whom will be independent
Compliant Corporate Governance B.1.1, B.1.2, B.1.3, B.1.4, B.1.5
7.10.5(b) Functions of Remuneration Committee
The Remuneration Committee shall recommend the remuneration of Chief Executive Officer and Executive Directors
Compliant Corporate Governance B.1.1, B.1.2, B.1.3, B.1.4, B.1.5
7.10.5(c) Disclosure in the Annual Report relating to Remuneration Committee
The Annual Report should set out;
Names of directors comprising the Remuneration Committee
Statement of Remuneration Policy
Aggregated remuneration paid to Executive & Non-Executive Directors
Compliant Corporate Governance B.1.1, B.1.2, B.1.3, B.1.4, B.1.5, B.2.1, B.2.2, B.2.3, B.2.4
7.10.6 Audit Committee The company shall have an Audit Committee Compliant Corporate Governance D.3.1,D.3.2
7.10.6(a) Composition of Audit Committee
Shall comprise of Non-Executive Directors a majority of whom will be independent
Non-Executive Directors shall be appointed as the Chairman of the committee
Managing Director and Chief Financial Officer should attend Audit Committee Meetings
The Chairman of the Audit Committee or one member should be a member of a professional accounting body
Compliant Corporate Governance D.3.1,D.3.2
Corporate Governance

85Affirmative Dipped Products PLC / Annual Report 2016/17
Rule No. Subject Applicable requirement Compliance Status
Applicable section in the Annual Report
7.10.6(b) Audit Committee Functions
Functions shall include:
Overseeing of the preparation, presentation and adequacy of disclosures in the financial statements in accordance with Sri Lanka Accounting Standards
Overseeing of the compliance with financial reporting requirements, information requirements of the Companies Act and other relevant financial reporting related regulations and requirements.
Overseeing the processes to ensure that the internal controls and risk management are adequate to meet the requirements of the Sri Lanka Auditing Standards
Assessment of the independence and performance of the external auditors
Make recommendations to the Board pertaining to appointment, re –appointment and removal of external auditors, and approve the remuneration and terms of engagement of the external auditors.
Compliant Corporate Governance D.3.3
Audit Committee Report
7.10.6 (c) Disclosure in the Annual Report relating to Audit Committee
a. Names of Directors comprising the Audit Committee
b. The Audit Committee shall make a determination of the independence of the Auditors and disclose the basis for such determination
c. The Annual Report shall contain a Report of the Audit Committee setting out of the manner of compliance with their functions
Compliant Corporate Governance D.3.4
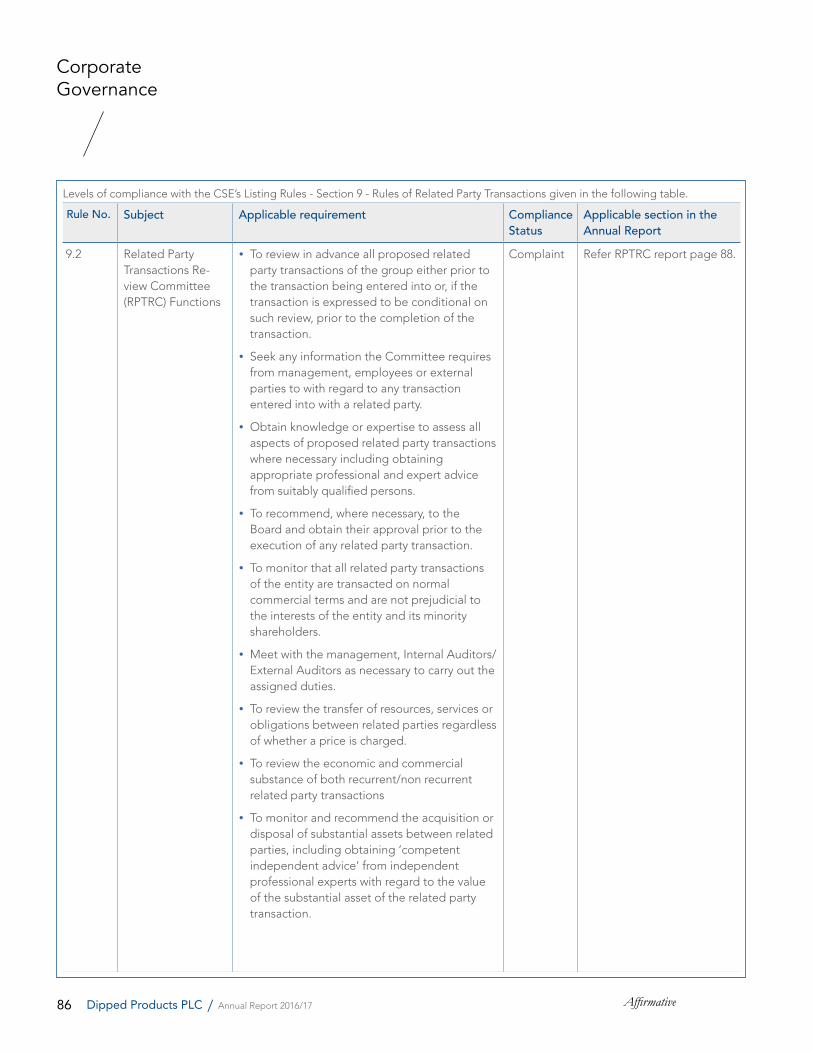
86 AffirmativeDipped Products PLC / Annual Report 2016/17
Levels of compliance with the CSE’s Listing Rules - Section 9 - Rules of Related Party Transactions given in the following table.
Rule No. Subject Applicable requirement Compliance Status
Applicable section in the Annual Report
9.2 Related Party Transactions Re-view Committee (RPTRC) Functions
To review in advance all proposed related party transactions of the group either prior to the transaction being entered into or, if the transaction is expressed to be conditional on such review, prior to the completion of the transaction.
Seek any information the Committee requires from management, employees or external parties to with regard to any transaction entered into with a related party.
Obtain knowledge or expertise to assess all aspects of proposed related party transactions where necessary including obtaining appropriate professional and expert advice from suitably qualified persons.
To recommend, where necessary, to the Board and obtain their approval prior to the execution of any related party transaction.
To monitor that all related party transactions of the entity are transacted on normal commercial terms and are not prejudicial to the interests of the entity and its minority shareholders.
Meet with the management, Internal Auditors/External Auditors as necessary to carry out the assigned duties.
To review the transfer of resources, services or obligations between related parties regardless of whether a price is charged.
To review the economic and commercial substance of both recurrent/non recurrent related party transactions
To monitor and recommend the acquisition or disposal of substantial assets between related parties, including obtaining ‘competent independent advice’ from independent professional experts with regard to the value of the substantial asset of the related party transaction.
Complaint Refer RPTRC report page 88.
Corporate Governance
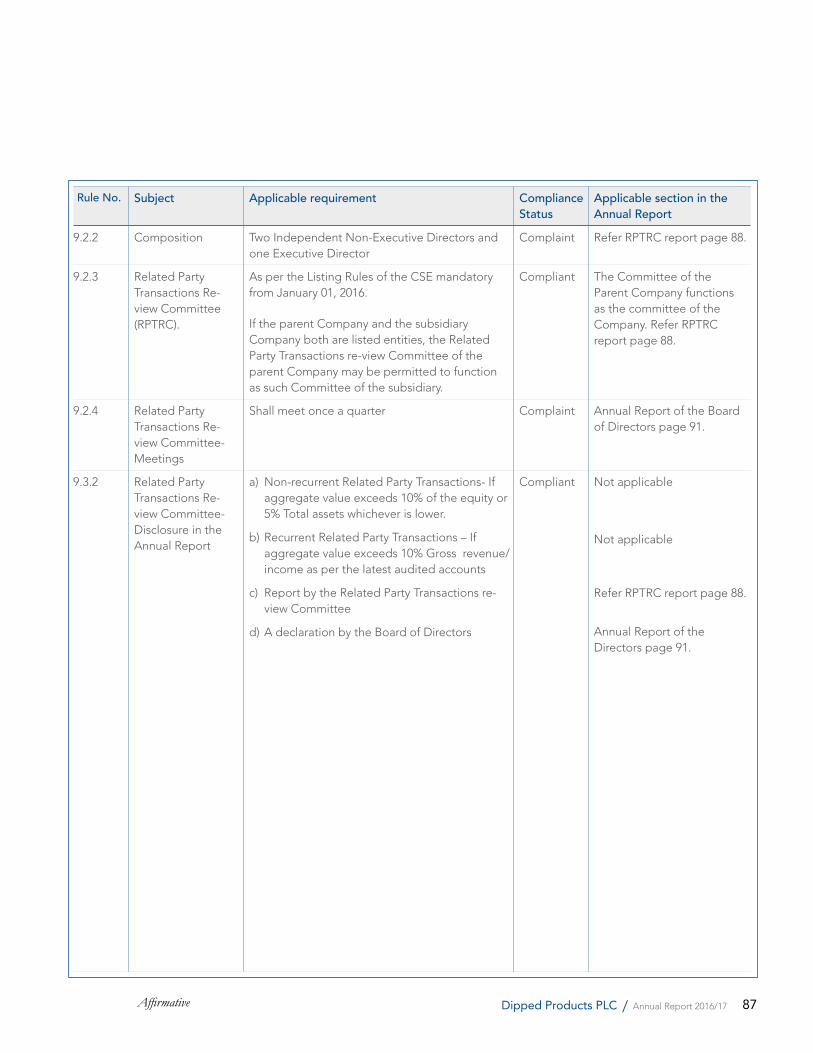
87Affirmative Dipped Products PLC / Annual Report 2016/17
Rule No. Subject Applicable requirement Compliance Status
Applicable section in the Annual Report
9.2.2 Composition Two Independent Non-Executive Directors and one Executive Director
Complaint Refer RPTRC report page 88.
9.2.3 Related Party Transactions Re-view Committee (RPTRC).
As per the Listing Rules of the CSE mandatory from January 01, 2016.
If the parent Company and the subsidiary Company both are listed entities, the Related Party Transactions re-view Committee of the parent Company may be permitted to function as such Committee of the subsidiary.
Compliant The Committee of the Parent Company functions as the committee of the Company. Refer RPTRC report page 88.
9.2.4 Related Party Transactions Re-view Committee-Meetings
Shall meet once a quarter Complaint Annual Report of the Board of Directors page 91.
9.3.2 Related Party Transactions Re-view Committee-Disclosure in the Annual Report
a) Non-recurrent Related Party Transactions- If aggregate value exceeds 10% of the equity or 5% Total assets whichever is lower.
b) Recurrent Related Party Transactions – If aggregate value exceeds 10% Gross revenue/income as per the latest audited accounts
c) Report by the Related Party Transactions re-view Committee
d) A declaration by the Board of Directors
Compliant Not applicable
Not applicable
Refer RPTRC report page 88.
Annual Report of the Directors page 91.
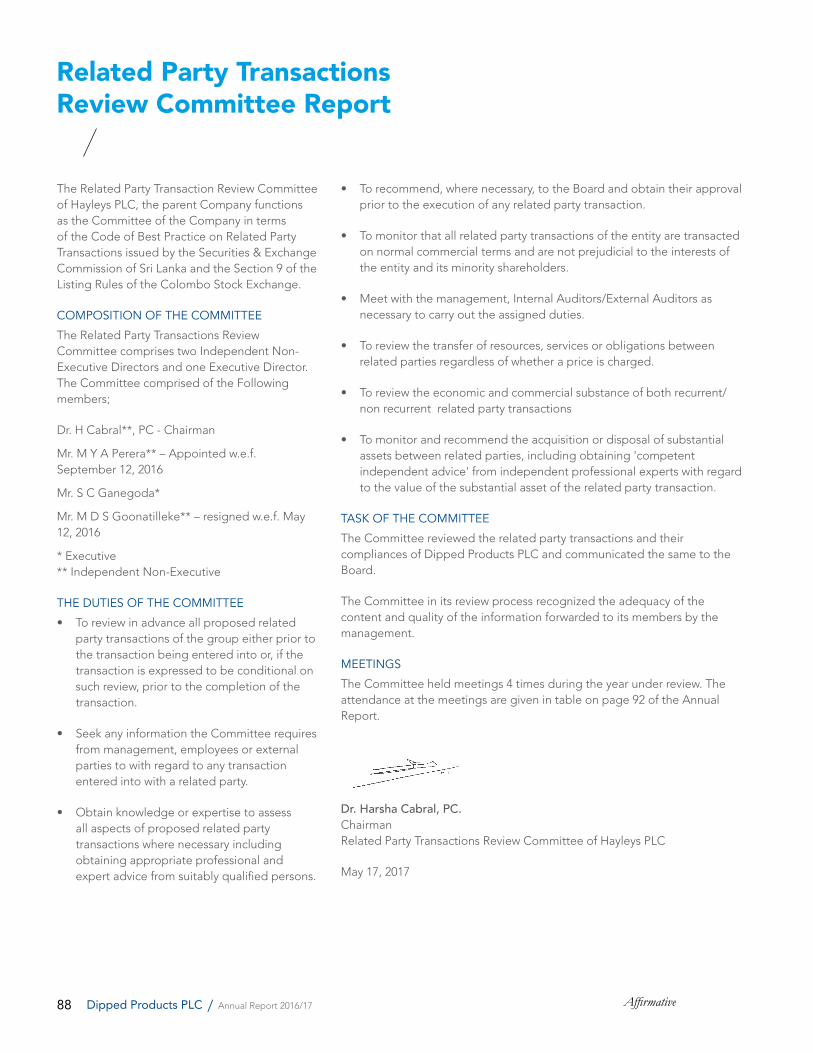
88 AffirmativeDipped Products PLC / Annual Report 2016/17
The Related Party Transaction Review Committee of Hayleys PLC, the parent Company functions as the Committee of the Company in terms of the Code of Best Practice on Related Party Transactions issued by the Securities & Exchange Commission of Sri Lanka and the Section 9 of the Listing Rules of the Colombo Stock Exchange.
COMPOSITION OF THE COMMITTEE
The Related Party Transactions Review Committee comprises two Independent Non-Executive Directors and one Executive Director. The Committee comprised of the Following members;
Dr. H Cabral**, PC - Chairman
Mr. M Y A Perera** – Appointed w.e.f. September 12, 2016
Mr. S C Ganegoda*
Mr. M D S Goonatilleke** – resigned w.e.f. May 12, 2016
* Executive** Independent Non-Executive
THE DUTIES OF THE COMMITTEE
• To review in advance all proposed related party transactions of the group either prior to the transaction being entered into or, if the transaction is expressed to be conditional on such review, prior to the completion of the transaction.
• Seek any information the Committee requires from management, employees or external parties to with regard to any transaction entered into with a related party.
• Obtain knowledge or expertise to assess all aspects of proposed related party transactions where necessary including obtaining appropriate professional and expert advice from suitably qualified persons.
Related Party Transactions Review Committee Report
• To recommend, where necessary, to the Board and obtain their approval prior to the execution of any related party transaction.
• To monitor that all related party transactions of the entity are transacted on normal commercial terms and are not prejudicial to the interests of the entity and its minority shareholders.
• Meet with the management, Internal Auditors/External Auditors as necessary to carry out the assigned duties.
• To review the transfer of resources, services or obligations between related parties regardless of whether a price is charged.
• To review the economic and commercial substance of both recurrent/non recurrent related party transactions
• To monitor and recommend the acquisition or disposal of substantial assets between related parties, including obtaining 'competent independent advice' from independent professional experts with regard to the value of the substantial asset of the related party transaction.
TASK OF THE COMMITTEE
The Committee reviewed the related party transactions and their compliances of Dipped Products PLC and communicated the same to the Board.
The Committee in its review process recognized the adequacy of the content and quality of the information forwarded to its members by the management.
MEETINGS
The Committee held meetings 4 times during the year under review. The attendance at the meetings are given in table on page 92 of the Annual Report.
Dr. Harsha Cabral, PC.ChairmanRelated Party Transactions Review Committee of Hayleys PLC
May 17, 2017
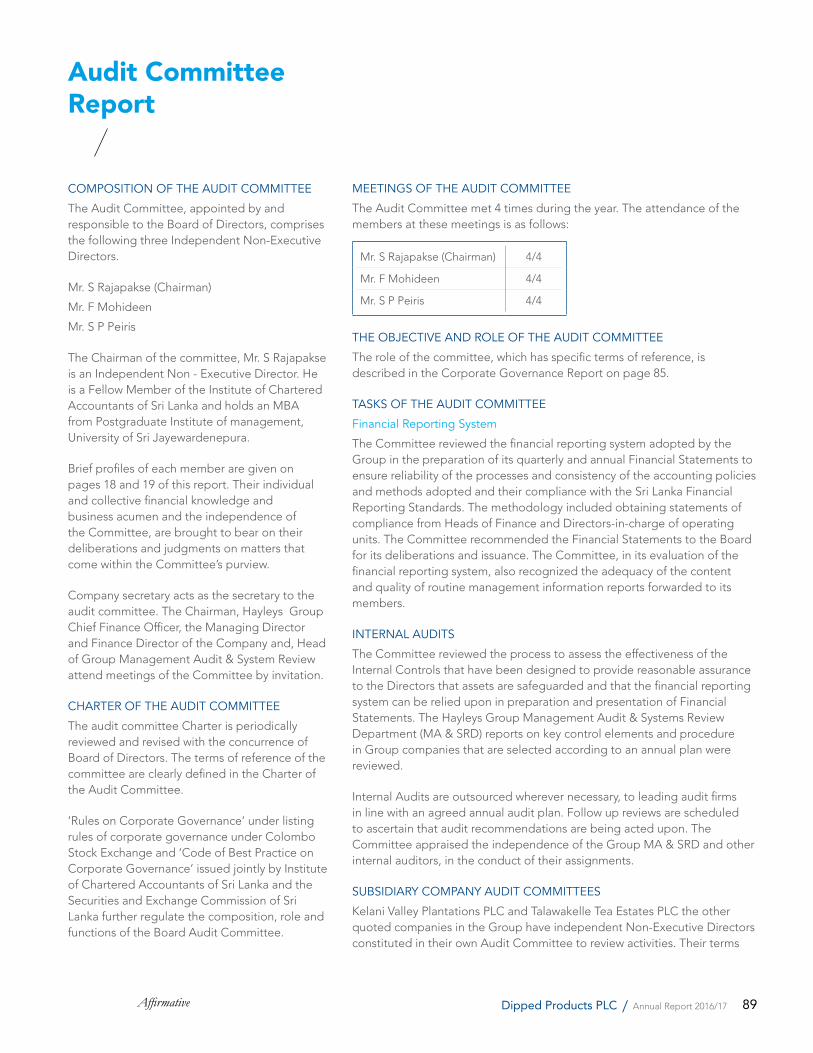
89Affirmative Dipped Products PLC / Annual Report 2016/17
Audit Committee Report
COMPOSITION OF THE AUDIT COMMITTEE
The Audit Committee, appointed by and responsible to the Board of Directors, comprises the following three Independent Non-Executive Directors.
Mr. S Rajapakse (Chairman)
Mr. F Mohideen
Mr. S P Peiris
The Chairman of the committee, Mr. S Rajapakse is an Independent Non - Executive Director. He is a Fellow Member of the Institute of Chartered Accountants of Sri Lanka and holds an MBA from Postgraduate Institute of management, University of Sri Jayewardenepura.
Brief profiles of each member are given on pages 18 and 19 of this report. Their individual and collective financial knowledge and business acumen and the independence of the Committee, are brought to bear on their deliberations and judgments on matters that come within the Committee’s purview.
Company secretary acts as the secretary to the audit committee. The Chairman, Hayleys Group Chief Finance Officer, the Managing Director and Finance Director of the Company and, Head of Group Management Audit & System Review attend meetings of the Committee by invitation.
CHARTER OF THE AUDIT COMMITTEE
The audit committee Charter is periodically reviewed and revised with the concurrence of Board of Directors. The terms of reference of the committee are clearly defined in the Charter of the Audit Committee.
‘Rules on Corporate Governance’ under listing rules of corporate governance under Colombo Stock Exchange and ‘Code of Best Practice on Corporate Governance’ issued jointly by Institute of Chartered Accountants of Sri Lanka and the Securities and Exchange Commission of Sri Lanka further regulate the composition, role and functions of the Board Audit Committee.
MEETINGS OF THE AUDIT COMMITTEE
The Audit Committee met 4 times during the year. The attendance of the members at these meetings is as follows:
Mr. S Rajapakse (Chairman) 4/4
Mr. F Mohideen 4/4
Mr. S P Peiris 4/4
THE OBJECTIVE AND ROLE OF THE AUDIT COMMITTEE
The role of the committee, which has specific terms of reference, is described in the Corporate Governance Report on page 85.
TASKS OF THE AUDIT COMMITTEE
Financial Reporting System
The Committee reviewed the financial reporting system adopted by the Group in the preparation of its quarterly and annual Financial Statements to ensure reliability of the processes and consistency of the accounting policies and methods adopted and their compliance with the Sri Lanka Financial Reporting Standards. The methodology included obtaining statements of compliance from Heads of Finance and Directors-in-charge of operating units. The Committee recommended the Financial Statements to the Board for its deliberations and issuance. The Committee, in its evaluation of the financial reporting system, also recognized the adequacy of the content and quality of routine management information reports forwarded to its members.
INTERNAL AUDITS
The Committee reviewed the process to assess the effectiveness of the Internal Controls that have been designed to provide reasonable assurance to the Directors that assets are safeguarded and that the financial reporting system can be relied upon in preparation and presentation of Financial Statements. The Hayleys Group Management Audit & Systems Review Department (MA & SRD) reports on key control elements and procedure in Group companies that are selected according to an annual plan were reviewed.
Internal Audits are outsourced wherever necessary, to leading audit firms in line with an agreed annual audit plan. Follow up reviews are scheduled to ascertain that audit recommendations are being acted upon. The Committee appraised the independence of the Group MA & SRD and other internal auditors, in the conduct of their assignments.
SUBSIDIARY COMPANY AUDIT COMMITTEES
Kelani Valley Plantations PLC and Talawakelle Tea Estates PLC the other quoted companies in the Group have independent Non-Executive Directors constituted in their own Audit Committee to review activities. Their terms
90 AffirmativeDipped Products PLC / Annual Report 2016/17
of reference are similar to the terms of the DPL Group Audit Committee and reports from these committees will be forwarded to the DPL Group Audit Committee.
EXTERNAL AUDITS
The Committee held meetings with the External Auditors to review the nature, approach, scope of the audit and the Audit Management Letters of Group Companies. Actions taken by the management in response to the issues raised, as well as the effectiveness of the internal controls in place, were discussed with the heads of business units. Remedial action was recommended wherever necessary.
The Audit Committee has reviewed the other services provided by the External Auditors to the group to ensure that their independence as External Auditors has not been impaired.
APPOINTMENT OF EXTERNAL AUDITORS
The Audit Committee has recommended to the Board of Directors that Messers Ernst & Young; continued as External Auditors for the financial year ending March 31, 2018.
SUPPORT TO THE COMMITTEE
The Committee received information and support from management during the year to enable it to carry out its duties and responsibilities effectively.
ETHICS AND GOOD GOVERNANCE
The committee continuously emphasized on upholding ethical values of the staff members. In this regard, Code of Ethics and Whistle-Blowers Policies were put in place and followed educating and encouraging all members of the staff. All appropriate procedures are in place to conduct independent investigations into incidents reported through Whistle-Blowing or identified through other means. The Whistle-Blower Policy guarantees strict confidentiality of the identity of the Whistle-Blowers.
SRI LANKA ACCOUNTING STANDARDS
Committee reviewed the revised policy decisions relating to adoption of new and revised Sri Lanka Accounting Standards (SLFRS/LKAS) applicable to the Group companies and made recommendation to the Board of Directors.
The Committee would continue to monitor the compliance with relevant Accounting Standards and keep the Board of Directors informed at regular intervals.
The committee has pursued the assistance of Messers Ernst and Young to assess and review the existing SLFRS policies and procedures adopted by the Group.
S RajapakseChairmanAudit Committee.
May 08, 2017
Audit Committee Report
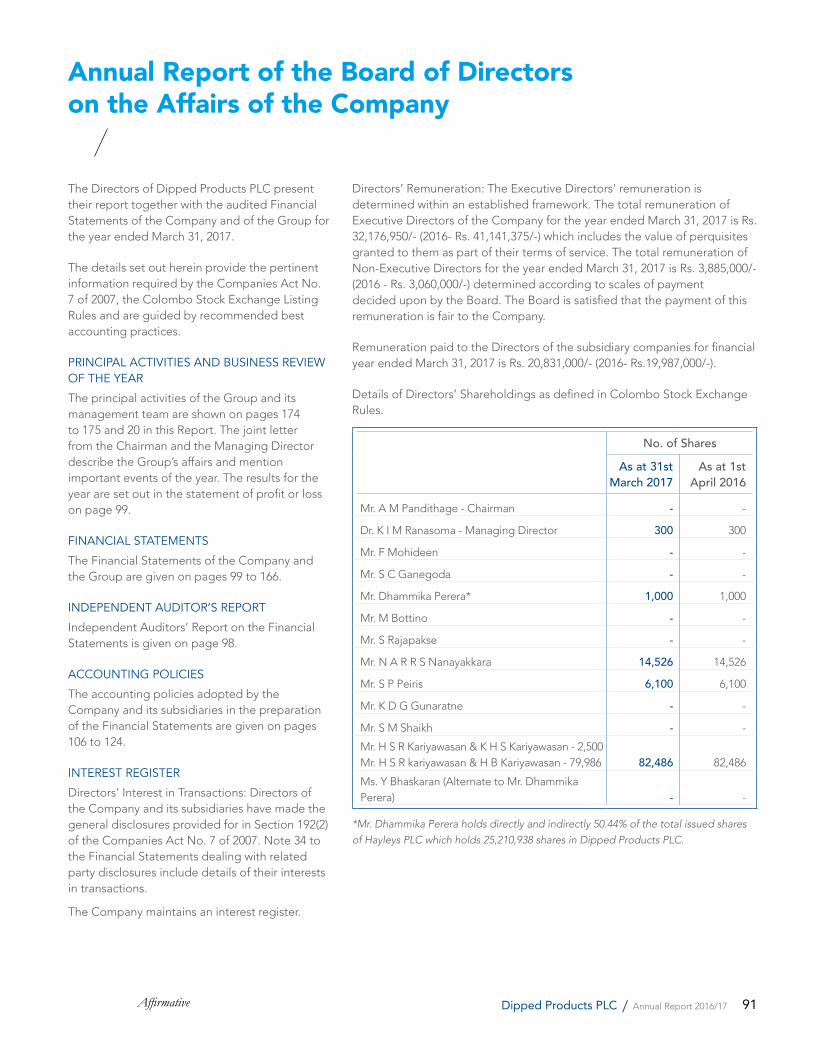
91Affirmative Dipped Products PLC / Annual Report 2016/17
Annual Report of the Board of Directors on the Affairs of the Company
The Directors of Dipped Products PLC present their report together with the audited Financial Statements of the Company and of the Group for the year ended March 31, 2017.
The details set out herein provide the pertinent information required by the Companies Act No. 7 of 2007, the Colombo Stock Exchange Listing Rules and are guided by recommended best accounting practices.
PRINCIPAL ACTIVITIES AND BUSINESS REVIEW OF THE YEAR
The principal activities of the Group and its management team are shown on pages 174 to 175 and 20 in this Report. The joint letter from the Chairman and the Managing Director describe the Group’s affairs and mention important events of the year. The results for the year are set out in the statement of profit or loss on page 99.
FINANCIAL STATEMENTS
The Financial Statements of the Company and the Group are given on pages 99 to 166.
INDEPENDENT AUDITOR’S REPORT
Independent Auditors’ Report on the Financial Statements is given on page 98.
ACCOUNTING POLICIES
The accounting policies adopted by the Company and its subsidiaries in the preparation of the Financial Statements are given on pages 106 to 124.
INTEREST REGISTER
Directors’ Interest in Transactions: Directors of the Company and its subsidiaries have made the general disclosures provided for in Section 192(2) of the Companies Act No. 7 of 2007. Note 34 to the Financial Statements dealing with related party disclosures include details of their interests in transactions.
The Company maintains an interest register.
Directors’ Remuneration: The Executive Directors’ remuneration is determined within an established framework. The total remuneration of Executive Directors of the Company for the year ended March 31, 2017 is Rs. 32,176,950/- (2016- Rs. 41,141,375/-) which includes the value of perquisites granted to them as part of their terms of service. The total remuneration of Non-Executive Directors for the year ended March 31, 2017 is Rs. 3,885,000/- (2016 - Rs. 3,060,000/-) determined according to scales of payment decided upon by the Board. The Board is satisfied that the payment of this remuneration is fair to the Company.
Remuneration paid to the Directors of the subsidiary companies for financial year ended March 31, 2017 is Rs. 20,831,000/- (2016- Rs.19,987,000/-).
Details of Directors’ Shareholdings as defined in Colombo Stock Exchange Rules.
No. of SharesAs at 31st
March 2017As at 1st
April 2016
Mr. A M Pandithage - Chairman - -
Dr. K I M Ranasoma - Managing Director 300 300
Mr. F Mohideen - -
Mr. S C Ganegoda - -
Mr. Dhammika Perera* 1,000 1,000
Mr. M Bottino - -
Mr. S Rajapakse - -
Mr. N A R R S Nanayakkara 14,526 14,526
Mr. S P Peiris 6,100 6,100
Mr. K D G Gunaratne - -
Mr. S M Shaikh - -
Mr. H S R Kariyawasan & K H S Kariyawasan - 2,500Mr. H S R kariyawasan & H B Kariyawasan - 79,986 82,486 82,486
Ms. Y Bhaskaran (Alternate to Mr. Dhammika Perera) - -
*Mr. Dhammika Perera holds directly and indirectly 50.44% of the total issued shares
of Hayleys PLC which holds 25,210,938 shares in Dipped Products PLC.
92 AffirmativeDipped Products PLC / Annual Report 2016/17
Annual Report of the Board of Directors on the Affairs of the Company
RELATED PARTY TRANSACTIONS
The Board of Directors has given the following statement in respect of the related party transactions.
The related party transactions of the Company during the financial year have been reviewed by the Related Party Transaction Review Committee of Hayleys PLC, the parent Company of Dipped Products PLC and are in compliance with section 09 of the CSE Listing Rules.
The Committee met four (04) times during the financial year 2016/17.
Attendance
Meetings held on May 18, 2016, August 5, 2016, November 4, 2016 and February 9, 2017.
Dr. H Cabral** 4/4
Mr. S C Ganegoda* 3/4
Mr. M Y A Perera**(appointed w.e.f. September 12, 2016) 2/2
*Executive **Independent Non-
Executive Director
DONATIONS
The donations made by the Group are disclosed in Note 7 on Page 127.
No donations were made by the company in 2017. (2016 - Rs. 28,000/-). The amount approved by the shareholders at the last Annual General Meeting was Rs. 300,000/-.
No donations were made for political purposes.
DIRECTORATE
The names of the Directors who served during the year are given on pages 18 and 19 in this report.
Mr. K.A.L.S. Fernando who served as a Director resigned with effect from May 16, 2016.
Mr. D. K. Welmillage who served as a Director resigned with effect from July 31, 2016.
Mr. H.S.R. Kariyawasan and Mr. S.M. Shaikh were appointed to the Board on May 16, 2016.
In terms of Article No.29(1) of the Articles of Association of the Company, Messrs. S. C. Ganegoda, Dhammika Perera and N. A. R. R. S. Nanayakkara retire by rotation and being eligible offer themselves for re-election.
Notice has been given pursuant to section 211 of the Companies Act No.07 of 2007 of the intention to propose as an ordinary resolution the reappointment of Mr. F. Mohideen notwithstanding the age limit of seventy years stipulated by section 210 of the Companies Act.
The Directors of the subsidiaries are given on pages 174 and 175.
INSURANCE & INDEMNITY
The ultimate Parent of the Company, Hayleys PLC has obtained a Directors & Officers liability insurance from Orient Insurance Ltd., providing worldwide cover to indemnify all past, present and future Directors & Officers (D & O) of the Group. The limit on liability of the cover is USD 5 million per annum at a premium of Rs. 5.3 million.
AUDITORS
The Auditors, Messrs Ernst & Young, Chartered Accountants, will be paid Rs. 1,265,000/- (2016 - Rs. 1,182,500/-) and Rs. 12,174,960/- (2016 - Rs. 12,653,200/-) as audit fees by the Company and its Subsidiaries respectively. Messrs Ernst & Young, Chartered Accountants will be paid Rs. 1,377,264/- (2016 - Rs. 1,154,020/-) and Rs. 3,359,684/- (2016 - Rs. 3,566,504/-) by the Company and the Group, for non-audit related work, which consisted mainly of tax consultancy services.
In addition to the above, Rs. 4,960,068/- (2016 - Rs. 5,291,231/-), and Rs. 774,793/- (2016 - Rs. 653,004/-) were paid as audit fees by ICOGUANTI S.p.A. and Dipped Products (Thailand) Ltd., respectively.
As far as the Directors are aware, the Auditors of the Company and of the subsidiaries do not have any relationships (other than that of an Auditor) with the Company or any of its subsidiaries other than those disclosed above. The Auditors also do not have any interests in the Company or any of its Group Companies.
Messrs Ernst & Young, Chartered Accountants, are deemed re-appointed, in terms of Section 158 of the Companies Act No. 7 of 2007, as Auditors of the Company.
A resolution proposing the Directors be authorised to determine their remuneration will be submitted at the Annual General Meeting.
93Affirmative Dipped Products PLC / Annual Report 2016/17
TURNOVER
The gross turnover of the Group during the year was Rs. 24,334,422,528/- (2016 - Rs. 21,931,302,593/-). The Group turnover from international trade in Hand Protection Sector amounted to Rs. 14,285,240,132/- (2016 - Rs. 12,728,465,840/-). Further information on Group turnover is detailed in Note 3 to the Financial Statements.
PROFITS
2017 2016
Rs.'000 Rs.'000(Restated)
After making provisions for all known liabilities and depreciation on property, plant & equipment the profit earned by the Group before taxation was 1,057,260 690,608
And taxation on Group profits amounting to were deducted (139,526) (214,653)
The Group was left with a profit of 917,734 475,955
And the amount attributable to non-controlling interest of (164,533) (127,826)
And other comprehensive income attributable to parent was 320,653 (44,803)
And the balance of the previous year net of final dividend and appropriations were adjusted 5,724,609 5,423,171
The profit before appropriation was 6,798,463 5,726,497
AppropriationsYour Directors have made appropriations as follows:
Interim dividend authorised of Rs. 2.50 per share (2016 - Rs. Nil per share) 149,654 Nil
Proposed final dividend of Rs. Nil per share (2016 - Rs. 2.00 per share) Nil 119,723
Total appropriations 149,654 119,723
RESERVES
The total Group reserves as at March 31, 2017 amount to Rs. 8,523,389,754/- (2016 - Rs. 7,565,661,143 /-) comprising capital reserves of Rs. 478,771,083/- (2016 - Rs. 450,164,274 /-), available-for-sale reserve of Rs. 16,831/- (2016 - Rs. 13,812/-) and revenue reserves of Rs. 8,044,601,000/- (2016 - Rs. 7,115,483,057/-)
DIVIDEND
The Board of Directors has authorised the payment of an interim dividend of Rs. 2.50 per share payable on June 5, 2017 to the shareholders of the issued ordinary shares of the Company as at close of business on May 25, 2017.
The Directors have confirmed that the company satisfied the solvency test requirement under Section 56 of the Companies Act No. 7 of 2007 for the said dividend. A solvency certificate by the auditors has sought in respect of the interim dividend authorised.
STATUTORY PAYMENTS
The Directors are satisfied that all statutory payments in relation to Employees and the Government have been made up to date.
TAXATION
The Company has entered into an agreement with the Board of Investment of Sri Lanka and has been granted a 10-year tax holiday as ‘Thrust Industries’ up to March 31, 2009 and after completion of tax exemption period Company is liable to income tax at concessionary rate for a further period of ten years on its business activity. Concessionary rate applied for this year is 12% and other income of the Company is liable to taxation at corporate tax rate.
CAPITAL EXPENDITURE
Group expenditure on Property, Plant and Equipment during the year amounted to Rs. 1,036,657,341/- (2016 - Rs. 2,751,585,689/-). The movement in Property, Plant and Equipment during the year is set out in Note 11 to the Financial Statements
MARKET VALUE OF PROPERTIES
The value of land owned by the Group is stated at cost or valuation. Information on valuation of land is explained in Note 11 to the Financial Statements.
94 AffirmativeDipped Products PLC / Annual Report 2016/17
EVENTS AFTER THE REPORTING PERIOD
No circumstances have arisen since the reporting period end which would require adjustment to or disclosure in, other than those disclosed in Note 39 to the Financial Statements.
GOING CONCERN
The Directors’ after making necessary inquiries and reviews including review of the Group’s budget for the ensuing year, capital expenditure requirements, future prospects and risks, cash flows and borrowing facilities have a reasonable expectation that the Company and the Group have adequate resources to continue in operational existence for the foreseeable future. Therefore, the going concern basis has been adopted in the preparation of the Financial Statements.
STOCK MARKET INFORMATION
Information relating to earnings, dividend, net assets per share and share trading are given on pages 167 to 173.
Annual Report of the Board of Directors on the Affairs of the Company
MAJOR SHAREHOLDINGS
The twenty major shareholders as at March 31, 2017 are given on page 171 in this Report.
ANNUAL GENERAL MEETING
The Annual General Meeting will be held at the Registered Office, No 400, Deans Road, Colombo 10, Sri Lanka on June 27, 2017 at 3.00 p.m. The Notice of the Annual General Meeting appears on page 181.
For and on behalf of the Board,
A M Pandithage Dr. K I M RanasomaChairman Managing Director
Hayleys Group Services (Pvt) LimitedSecretaries400, Deans Road,Colombo 10
May 17, 2017
95Affirmative Dipped Products PLC / Annual Report 2016/17
Statement of Directors’ Responsibilities
The Directors are responsible under sections 150 (1), 151, 152 (1) & 153 of the Companies Act No. 7 of 2007, to ensure compliance with the requirements set out therein to prepare financial statements for each financial year giving a true and fair view of the state of affairs of the Company and the Group as at the end of the financial year and of the profit & loss of the Company and the Group for the financial year.
The Directors are also responsible, under section 148, for ensuring that proper accounting records are kept to enable, determination of financial position with reasonable accuracy, preparation of financial statements and audit of such statements to be carried out readily and properly.
The Board accepts responsibility for the integrity and objectivity of the financial statements presented. The Directors confirm that in preparing the financial statements, appropriate accounting policies have been selected and applied consistently while reasonable and prudent judgments have been made so that the form and substance of transactions are properly reflected.
They also confirm that the financial statements have been prepared and presented in accordance with the Sri Lanka Accounting standards, Companies Act No 07 of 2007 and the listing rules of the Colombo Stock Exchange. Further, the financial statements provide the information required by the Companies Act and the listing rules of the Colombo Stock Exchange.
The Directors are of the opinion, based on their knowledge of the company, key operations and specific inquiries that adequate resources exist to support the Company on a going concern basis over the next year. These financial statements have been prepared on that basis.
The Directors have taken reasonable measures to safeguard the assets of the Group and, in that context, have instituted appropriate systems of internal control with a view to preventing and detecting fraud and other irregularities.
As required by Section 56(2) of the Companies Act No.07 of 2007, the Board of Directors has authorized the distribution of an interim dividend for the year 2016/17 payable on June 5, 2017. The Board is satisfied based on information available to it, that the Company would satisfy the Solvency Test after such distribution, in accordance with section 57 of the Companies Act No.07 of 2007 and have sought in respect of the dividend authorised, a Certificate of Solvency from its Auditors.
The external Auditors, Messrs Ernst & Young deemed re- appointed in terms of Section 158 of the Companies Act were provided with every opportunity to undertake the inspections they considered appropriate to enable them to form their opinion on the Financial Statements. The report of the Auditors, shown on page 98 sets out their responsibilities in relation to the Financial Statements.
COMPLIANCE REPORT
The Directors confirm that to the best of their knowledge, all statutory payments relating to employees and the Government that were due in respect of the Company and its Subsidiaries as at the Statement of Financial Position date have been paid or where relevant, provided for.
By order of the Board
HAYLEYS GROUP SERVICES (PVT) LTDSecretaries
May 17, 2017

96 AffirmativeDipped Products PLC / Annual Report 2016/17
Financial Calendar
INTERIM REPORTSQuarter ended June 30, 2016 August 8, 2016Quarter ended September 30, 2016 October 31, 2016Quarter ended December 31, 2016 January 31, 2017Quarter ended March 31, 2017 May 17, 2017
Interim dividend authorised May 17, 2017Annual Report - 2016/17 May 29, 2017Interim dividend payable June 05, 2017Forty First Annual General Meeting June 27, 2017
97Affirmative Dipped Products PLC / Annual Report 2016/17
A strong balance sheet reflects the excellent operational and financial results we have once
again achieved.
Financial Statements98 Independent Auditors Report
99 Statements of Profit or Loss
100 Statements of Comprehensive Income
101 Statements of Financial Position
102 Statements of Changes in Equity
104 Statements of Cash Flows
106 Notes to the Financial Statements
168 Decade at a Glance
170 The Share
174 Group Structure
176 Glossary
177 GRI Content Index Tool
181 Notice of Meeting
182 Notes
183 Form of Proxy
IBC Corporate Information
Conclusive

98 AffirmativeDipped Products PLC / Annual Report 2016/17
Independent Auditors Report
TO THE SHAREHOLDERS OF DIPPED PRODUCTS PLCReport on the Financial StatementsWe have audited the accompanying financial statements of Dipped Products PLC (the “Company”), and the consolidated financial statements of the Company and its subsidiaries (the “Group”), which comprise the statement of financial position as at 31 March 2017, and the statement of profit or loss, statement of comprehensive income, statement of changes in equity and, statement of cash flows for the year then ended, and a summary of significant accounting policies and other explanatory Information.
Board’s Responsibility for the Financial StatementsThe Board of Directors (the “Board”) is responsible for the preparation of these financial statements that give a true and fair view in accordance with Sri Lanka Accounting Standards, and for such internal controls as Board determines is necessary to enable the preparation of financial statements that are free from material misstatement, whether due to fraud or error.
Auditor’s ResponsibilityOur responsibility is to express an opinion on these financial statements based on our audit. We conducted our audit in accordance with Sri Lanka Auditing Standards. Those standards require that we comply with ethical requirements and plan and perform the audit to obtain reasonable assurance about whether the financial statements are free from material misstatement.
An audit involves performing procedures to obtain audit evidence about the amounts and disclosures in the financial statements. The
procedures selected depend on the auditor’s judgment, including the assessment of the risks of material misstatement of the financial statements, whether due to fraud or error. In making those risk assessments, the auditor considers internal controls relevant to the entity’s preparation of the financial statements that give a true and fair view in order to design audit procedures that are appropriate in the circumstances, but not for the purpose of expressing an opinion on the effectiveness of the entity’s internal controls. An audit also includes evaluating the appropriateness of accounting policies used and the reasonableness of accounting estimates made by the Board, as well as evaluating the overall presentation of the financial statements.
We believe that the audit evidence we have obtained is sufficient and appropriate to provide a basis for our audit opinion.
OpinionIn our opinion, the consolidated financial statements give a true and fair view of the financial position of the Group as at 31 March 2017, and of its financial performance and cash flows for the year then ended in accordance with Sri Lanka Accounting Standards.
Report on Other Legal and Regulatory RequirementsAs required by section 163(2) of the Companies Act No. 07 of 2007, we state the following:
a) The basis of opinion, scope and limitations of the audit are as stated above.
b) In our opinion:
- we have obtained all the information and explanations that were required for the audit and, as far as appears from our examination, proper accounting records have been kept by the Company,
- the financial statements of the company give a true and fair view of the financial position as at 31 March 2017, and of its financial performance and cash flows for the year then ended in accordance with Sri Lanka Accounting Standards, and
- the financial statements of the Company and the Group comply with the requirements of section 151 and 153 of the Companies Act No. 07 of 2007.
May 17, 2017Colombo

99Affirmative Dipped Products PLC / Annual Report 2016/17
Statements of Profit or Loss
Year ended March 31, Group Company2017 2016 2017 2016
Notes Rs.’000 Rs.’000(Restated)
Rs.’000 Rs.’000(Restated)
Revenue 3 24,334,423 21,931,303 1,792,509 1,685,401
Cost of sales (20,345,895) (18,452,976) (1,381,449) (1,242,316)
Gross profit 3,988,528 3,478,327 411,060 443,085
Other income and gains 4 246,860 238,256 420,163 191,942
Distribution costs (517,532) (577,651) (19,505) (25,598)
Administrative expenses (2,279,432) (2,262,203) (404,625) (424,171)
Other expenses 5 - (2,975) - -
Impairment reversal / (loss) on investment and other amounts due - - (196) 15,290
Finance costs 6.1 (410,965) (346,711) (104,961) (66,880)
Finance income 6.2 58,989 126,935 8,313 5,001
Change in fair value of investment properties 14 51,300 36,630 25,500 32,630
Share of loss of equity accounted investee (net of tax) 17.2 (80,488) - - -
Profit before tax 7 1,057,260 690,608 335,749 171,299
Tax (expense) / reversal 8 (139,526) (214,653) 21,182 5,760
Profit for the year 917,734 475,955 356,931 177,059
Attributable to: Equity holders of the parent 753,201 348,129 356,931 177,059
Non-controlling interest 164,533 127,826 - -
917,734 475,955 356,931 177,059
Basic earnings per share (Rs.) 9 12.58 5.82 5.96 2.96
Diluted earnings per share (Rs.) 9 12.58 5.82 5.96 2.96
Dividends per share (Rs.) 10 2.50 2.00 2.50 2.00
Figures in brackets indicate deductions.
The Notes on pages 106 to 166 form an integral part of the Financial Statements.
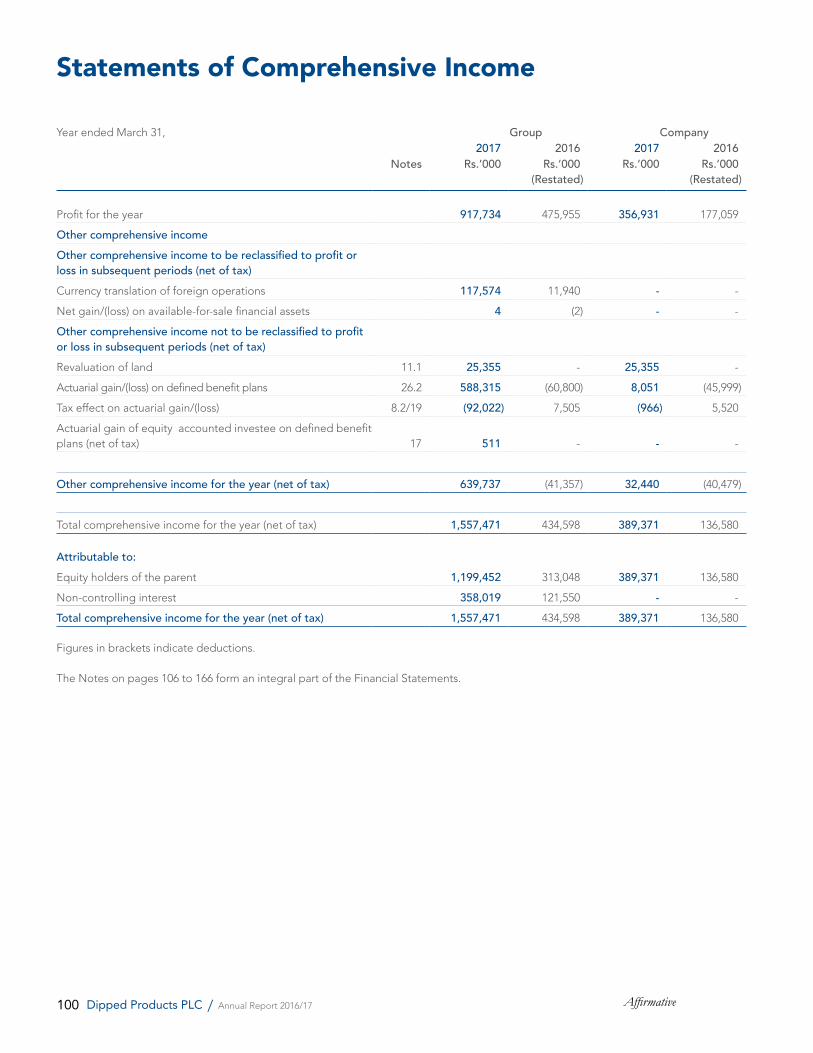
100 AffirmativeDipped Products PLC / Annual Report 2016/17
Statements of Comprehensive Income
Year ended March 31, Group Company2017 2016 2017 2016
Notes Rs.’000 Rs.’000(Restated)
Rs.’000 Rs.’000(Restated)
Profit for the year 917,734 475,955 356,931 177,059
Other comprehensive incomeOther comprehensive income to be reclassified to profit or loss in subsequent periods (net of tax)Currency translation of foreign operations 117,574 11,940 - -
Net gain/(loss) on available-for-sale financial assets 4 (2) - -
Other comprehensive income not to be reclassified to profit or loss in subsequent periods (net of tax)Revaluation of land 11.1 25,355 - 25,355 -
Actuarial gain/(loss) on defined benefit plans 26.2 588,315 (60,800) 8,051 (45,999)
Tax effect on actuarial gain/(loss) 8.2/19 (92,022) 7,505 (966) 5,520
Actuarial gain of equity accounted investee on defined benefit plans (net of tax) 17 511 - - -
Other comprehensive income for the year (net of tax) 639,737 (41,357) 32,440 (40,479)
Total comprehensive income for the year (net of tax) 1,557,471 434,598 389,371 136,580
Attributable to:Equity holders of the parent 1,199,452 313,048 389,371 136,580
Non-controlling interest 358,019 121,550 - -
Total comprehensive income for the year (net of tax) 1,557,471 434,598 389,371 136,580
Figures in brackets indicate deductions.
The Notes on pages 106 to 166 form an integral part of the Financial Statements.
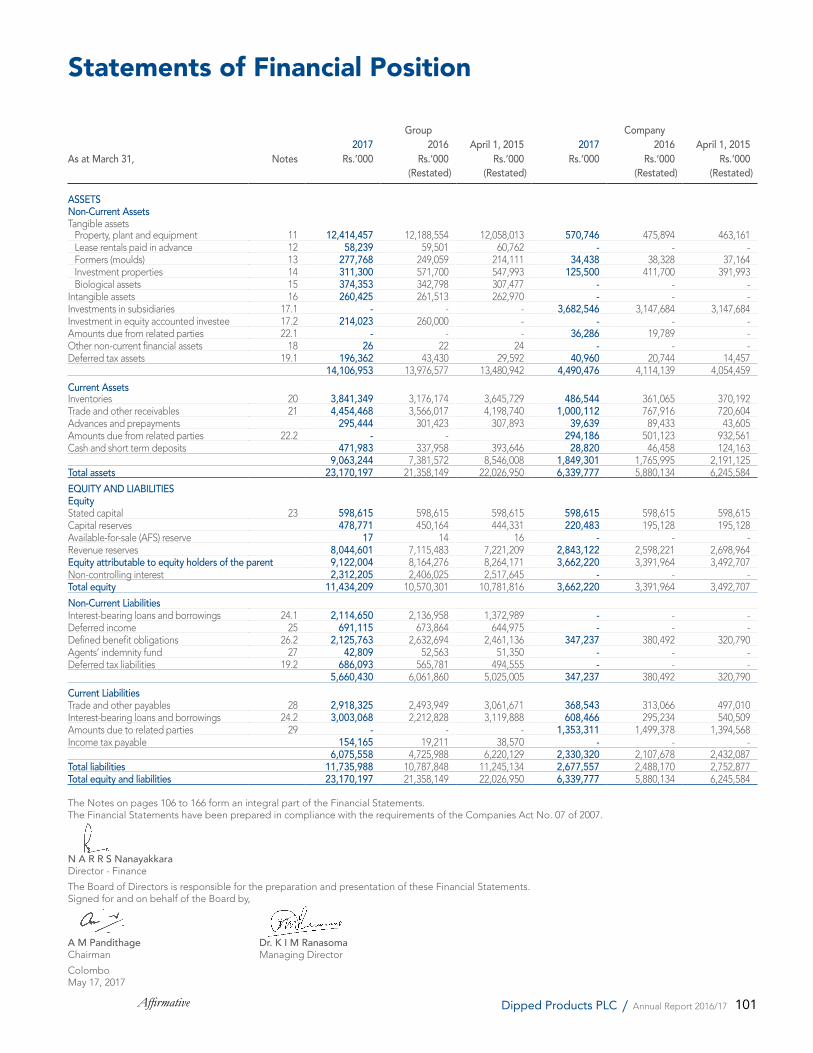
101Affirmative Dipped Products PLC / Annual Report 2016/17
Group Company2017 2016 April 1, 2015 2017 2016 April 1, 2015
As at March 31, Notes Rs.’000 Rs.’000(Restated)
Rs.’000(Restated)
Rs.’000 Rs.’000(Restated)
Rs.’000(Restated)
ASSETSNon-Current AssetsTangible assets Property, plant and equipment 11 12,414,457 12,188,554 12,058,013 570,746 475,894 463,161 Lease rentals paid in advance 12 58,239 59,501 60,762 - - - Formers (moulds) 13 277,768 249,059 214,111 34,438 38,328 37,164 Investment properties 14 311,300 571,700 547,993 125,500 411,700 391,993 Biological assets 15 374,353 342,798 307,477 - - - Intangible assets 16 260,425 261,513 262,970 - - - Investments in subsidiaries 17.1 - - - 3,682,546 3,147,684 3,147,684 Investment in equity accounted investee 17.2 214,023 260,000 - - - - Amounts due from related parties 22.1 - - - 36,286 19,789 - Other non-current financial assets 18 26 22 24 - - - Deferred tax assets 19.1 196,362 43,430 29,592 40,960 20,744 14,457
14,106,953 13,976,577 13,480,942 4,490,476 4,114,139 4,054,459
Current AssetsInventories 20 3,841,349 3,176,174 3,645,729 486,544 361,065 370,192 Trade and other receivables 21 4,454,468 3,566,017 4,198,740 1,000,112 767,916 720,604 Advances and prepayments 295,444 301,423 307,893 39,639 89,433 43,605 Amounts due from related parties 22.2 - - 294,186 501,123 932,561 Cash and short term deposits 471,983 337,958 393,646 28,820 46,458 124,163
9,063,244 7,381,572 8,546,008 1,849,301 1,765,995 2,191,125 Total assets 23,170,197 21,358,149 22,026,950 6,339,777 5,880,134 6,245,584
EQUITY AND LIABILITIESEquityStated capital 23 598,615 598,615 598,615 598,615 598,615 598,615 Capital reserves 478,771 450,164 444,331 220,483 195,128 195,128 Available-for-sale (AFS) reserve 17 14 16 - - -Revenue reserves 8,044,601 7,115,483 7,221,209 2,843,122 2,598,221 2,698,964 Equity attributable to equity holders of the parent 9,122,004 8,164,276 8,264,171 3,662,220 3,391,964 3,492,707 Non-controlling interest 2,312,205 2,406,025 2,517,645 - - -Total equity 11,434,209 10,570,301 10,781,816 3,662,220 3,391,964 3,492,707
Non-Current Liabilities Interest-bearing loans and borrowings 24.1 2,114,650 2,136,958 1,372,989 - - - Deferred income 25 691,115 673,864 644,975 - - - Defined benefit obligations 26.2 2,125,763 2,632,694 2,461,136 347,237 380,492 320,790 Agents’ indemnity fund 27 42,809 52,563 51,350 - - - Deferred tax liabilities 19.2 686,093 565,781 494,555 - - -
5,660,430 6,061,860 5,025,005 347,237 380,492 320,790
Current Liabilities Trade and other payables 28 2,918,325 2,493,949 3,061,671 368,543 313,066 497,010 Interest-bearing loans and borrowings 24.2 3,003,068 2,212,828 3,119,888 608,466 295,234 540,509 Amounts due to related parties 29 - - - 1,353,311 1,499,378 1,394,568 Income tax payable 154,165 19,211 38,570 - - -
6,075,558 4,725,988 6,220,129 2,330,320 2,107,678 2,432,087 Total liabilities 11,735,988 10,787,848 11,245,134 2,677,557 2,488,170 2,752,877 Total equity and liabilities 23,170,197 21,358,149 22,026,950 6,339,777 5,880,134 6,245,584
The Notes on pages 106 to 166 form an integral part of the Financial Statements. The Financial Statements have been prepared in compliance with the requirements of the Companies Act No. 07 of 2007.
N A R R S Nanayakkara Director - Finance
The Board of Directors is responsible for the preparation and presentation of these Financial Statements. Signed for and on behalf of the Board by,
A M Pandithage Dr. K I M Ranasoma Chairman Managing Director
Colombo May 17, 2017
Statements of Financial Position
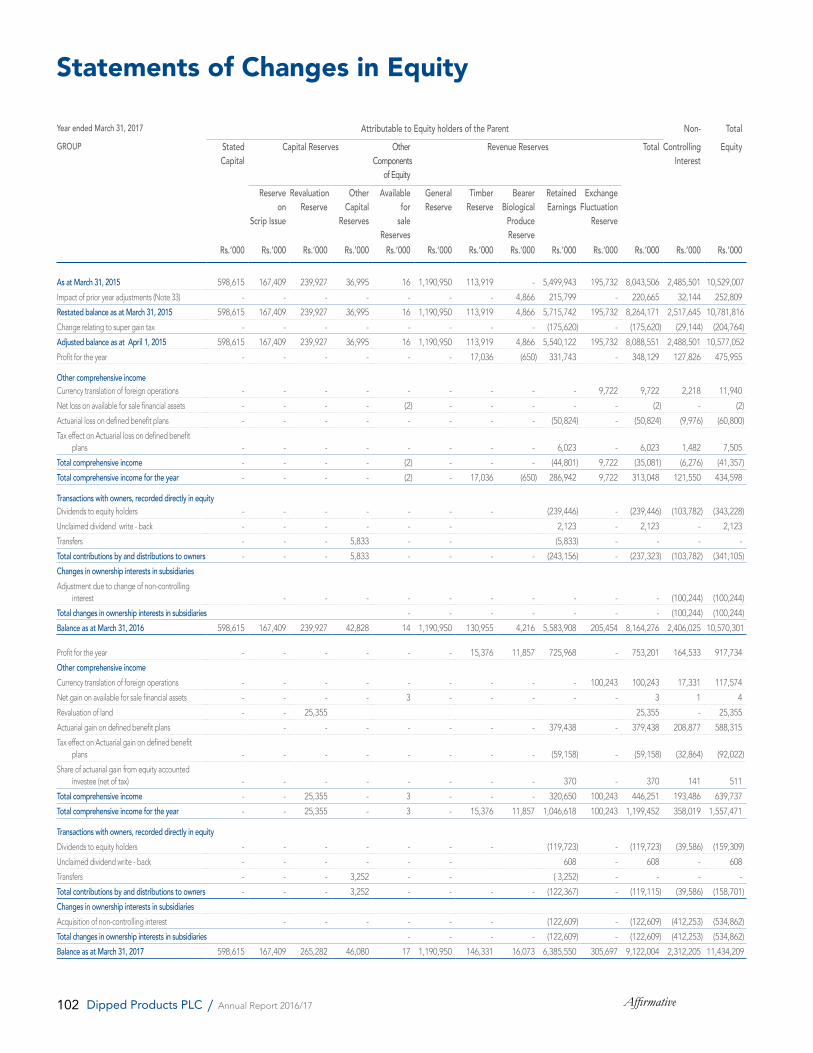
102 AffirmativeDipped Products PLC / Annual Report 2016/17
Year ended March 31, 2017 Attributable to Equity holders of the Parent Non- TotalGROUP Stated
CapitalCapital Reserves Other
Components of Equity
Revenue Reserves Total ControllingInterest
Equity
Reserve on
Scrip Issue
Revaluation Reserve
Other Capital
Reserves
Available for
sale Reserves
GeneralReserve
TimberReserve
Bearer Biological
Produce Reserve
RetainedEarnings
Exchange Fluctuation
Reserve
Rs.’000 Rs.’000 Rs.’000 Rs.’000 Rs.’000 Rs.’000 Rs.’000 Rs.’000 Rs.’000 Rs.’000 Rs.’000 Rs.’000 Rs.’000
As at March 31, 2015 598,615 167,409 239,927 36,995 16 1,190,950 113,919 - 5,499,943 195,732 8,043,506 2,485,501 10,529,007
Impact of prior year adjustments (Note 33) - - - - - - - 4,866 215,799 - 220,665 32,144 252,809
Restated balance as at March 31, 2015 598,615 167,409 239,927 36,995 16 1,190,950 113,919 4,866 5,715,742 195,732 8,264,171 2,517,645 10,781,816
Change relating to super gain tax - - - - - - - - (175,620) - (175,620) (29,144) (204,764)
Adjusted balance as at April 1, 2015 598,615 167,409 239,927 36,995 16 1,190,950 113,919 4,866 5,540,122 195,732 8,088,551 2,488,501 10,577,052
Profit for the year - - - - - - 17,036 (650) 331,743 - 348,129 127,826 475,955
Other comprehensive income Currency translation of foreign operations - - - - - - - - - 9,722 9,722 2,218 11,940
Net loss on available for sale financial assets - - - - (2) - - - - - (2) - (2)
Actuarial loss on defined benefit plans - - - - - - - - (50,824) - (50,824) (9,976) (60,800)
Tax effect on Actuarial loss on defined benefit plans - - - - - - - - 6,023 - 6,023 1,482 7,505
Total comprehensive income - - - - (2) - - - (44,801) 9,722 (35,081) (6,276) (41,357)
Total comprehensive income for the year - - - - (2) - 17,036 (650) 286,942 9,722 313,048 121,550 434,598
Transactions with owners, recorded directly in equityDividends to equity holders - - - - - - - (239,446) - (239,446) (103,782) (343,228)
Unclaimed dividend write - back - - - - - - 2,123 - 2,123 - 2,123
Transfers - - - 5,833 - - (5,833) - - - -
Total contributions by and distributions to owners - - - 5,833 - - - - (243,156) - (237,323) (103,782) (341,105)
Changes in ownership interests in subsidiariesAdjustment due to change of non-controlling
interest - - - - - - - - - - (100,244) (100,244)
Total changes in ownership interests in subsidiaries - - - - - - - (100,244) (100,244)
Balance as at March 31, 2016 598,615 167,409 239,927 42,828 14 1,190,950 130,955 4,216 5,583,908 205,454 8,164,276 2,406,025 10,570,301
Profit for the year - - - - - - 15,376 11,857 725,968 - 753,201 164,533 917,734
Other comprehensive income Currency translation of foreign operations - - - - - - - - - 100,243 100,243 17,331 117,574
Net gain on available for sale financial assets - - - - 3 - - - - - 3 1 4
Revaluation of land - - 25,355 25,355 - 25,355
Actuarial gain on defined benefit plans - - - - - - - 379,438 - 379,438 208,877 588,315
Tax effect on Actuarial gain on defined benefit plans - - - - - - - - (59,158) - (59,158) (32,864) (92,022)
Share of actuarial gain from equity accounted investee (net of tax) - - - - - - - - 370 - 370 141 511
Total comprehensive income - - 25,355 - 3 - - - 320,650 100,243 446,251 193,486 639,737
Total comprehensive income for the year - - 25,355 - 3 - 15,376 11,857 1,046,618 100,243 1,199,452 358,019 1,557,471
Transactions with owners, recorded directly in equityDividends to equity holders - - - - - - - (119,723) - (119,723) (39,586) (159,309)
Unclaimed dividend write - back - - - - - - 608 - 608 - 608
Transfers - - - 3,252 - - ( 3,252) - - - -
Total contributions by and distributions to owners - - - 3,252 - - - - (122,367) - (119,115) (39,586) (158,701)
Changes in ownership interests in subsidiariesAcquisition of non-controlling interest - - - - - - (122,609) - (122,609) (412,253) (534,862)
Total changes in ownership interests in subsidiaries - - - - (122,609) - (122,609) (412,253) (534,862)
Balance as at March 31, 2017 598,615 167,409 265,282 46,080 17 1,190,950 146,331 16,073 6,385,550 305,697 9,122,004 2,312,205 11,434,209
Statements of Changes in Equity
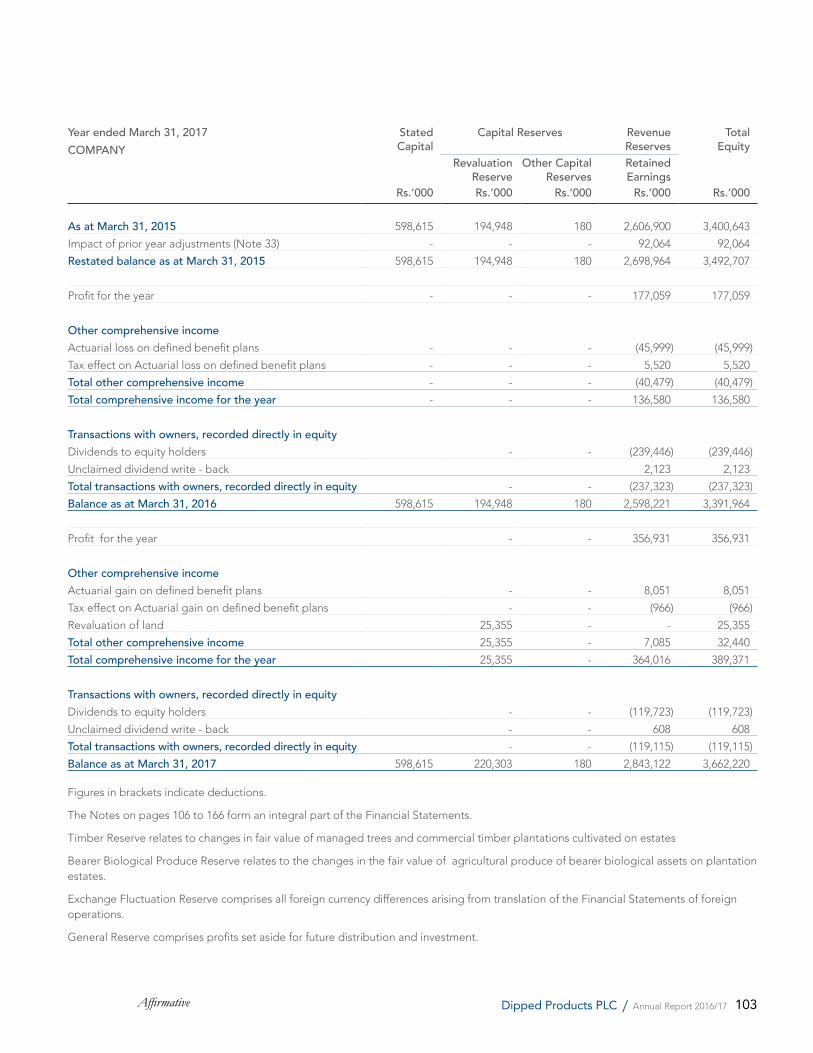
103Affirmative Dipped Products PLC / Annual Report 2016/17
Year ended March 31, 2017COMPANY
Stated Capital
Capital Reserves Revenue Reserves
Total Equity
RevaluationReserve
Other CapitalReserves
RetainedEarnings
Rs.’000 Rs.’000 Rs.’000 Rs.’000 Rs.’000
As at March 31, 2015 598,615 194,948 180 2,606,900 3,400,643
Impact of prior year adjustments (Note 33) - - - 92,064 92,064
Restated balance as at March 31, 2015 598,615 194,948 180 2,698,964 3,492,707
Profit for the year - - - 177,059 177,059
Other comprehensive incomeActuarial loss on defined benefit plans - - - (45,999) (45,999)
Tax effect on Actuarial loss on defined benefit plans - - - 5,520 5,520
Total other comprehensive income - - - (40,479) (40,479)
Total comprehensive income for the year - - - 136,580 136,580
Transactions with owners, recorded directly in equityDividends to equity holders - - (239,446) (239,446)
Unclaimed dividend write - back 2,123 2,123
Total transactions with owners, recorded directly in equity - - (237,323) (237,323)
Balance as at March 31, 2016 598,615 194,948 180 2,598,221 3,391,964
Profit for the year - - 356,931 356,931
Other comprehensive income
Actuarial gain on defined benefit plans - - 8,051 8,051
Tax effect on Actuarial gain on defined benefit plans - - (966) (966)
Revaluation of land 25,355 - - 25,355
Total other comprehensive income 25,355 - 7,085 32,440
Total comprehensive income for the year 25,355 - 364,016 389,371
Transactions with owners, recorded directly in equityDividends to equity holders - - (119,723) (119,723)
Unclaimed dividend write - back - - 608 608
Total transactions with owners, recorded directly in equity - - (119,115) (119,115)
Balance as at March 31, 2017 598,615 220,303 180 2,843,122 3,662,220
Figures in brackets indicate deductions.
The Notes on pages 106 to 166 form an integral part of the Financial Statements.
Timber Reserve relates to changes in fair value of managed trees and commercial timber plantations cultivated on estates
Bearer Biological Produce Reserve relates to the changes in the fair value of agricultural produce of bearer biological assets on plantation estates.
Exchange Fluctuation Reserve comprises all foreign currency differences arising from translation of the Financial Statements of foreign operations.
General Reserve comprises profits set aside for future distribution and investment.
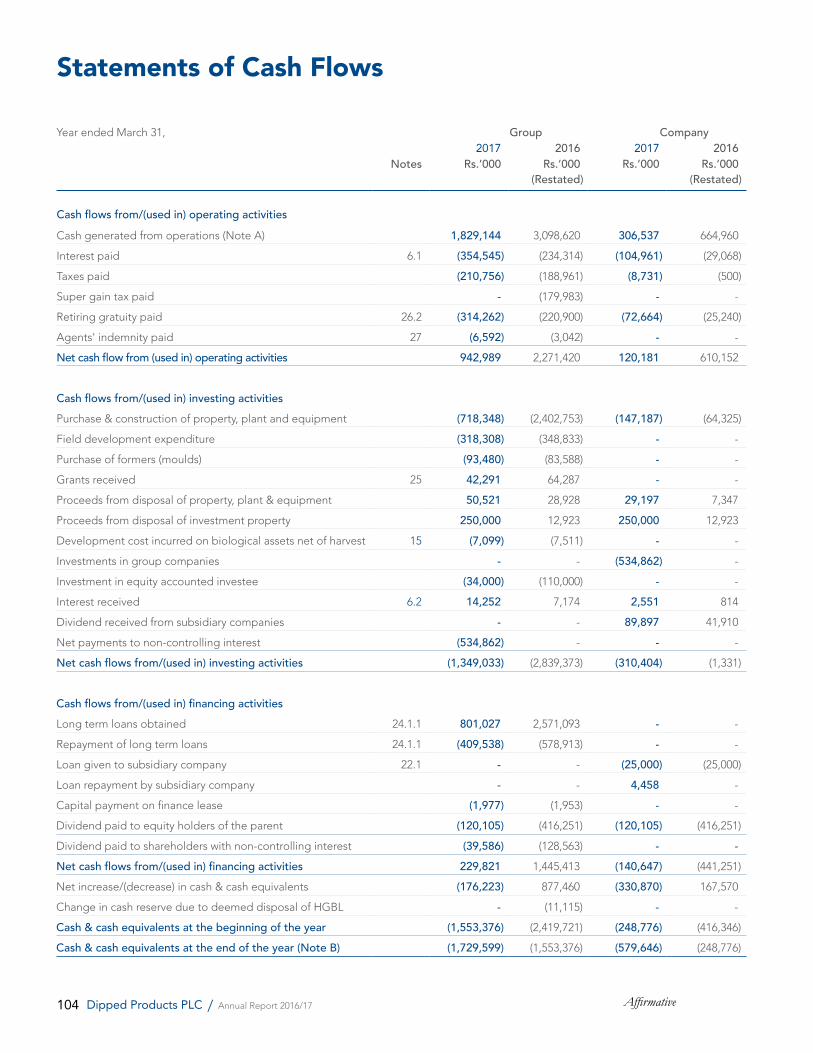
104 AffirmativeDipped Products PLC / Annual Report 2016/17
Statements of Cash Flows
Year ended March 31, Group Company2017 2016 2017 2016
Notes Rs.’000 Rs.’000(Restated)
Rs.’000 Rs.’000(Restated)
Cash flows from/(used in) operating activitiesCash generated from operations (Note A) 1,829,144 3,098,620 306,537 664,960
Interest paid 6.1 (354,545) (234,314) (104,961) (29,068)
Taxes paid (210,756) (188,961) (8,731) (500)
Super gain tax paid - (179,983) - -
Retiring gratuity paid 26.2 (314,262) (220,900) (72,664) (25,240)
Agents' indemnity paid 27 (6,592) (3,042) - -
Net cash flow from (used in) operating activities 942,989 2,271,420 120,181 610,152
Cash flows from/(used in) investing activitiesPurchase & construction of property, plant and equipment (718,348) (2,402,753) (147,187) (64,325)
Field development expenditure (318,308) (348,833) - -
Purchase of formers (moulds) (93,480) (83,588) - -
Grants received 25 42,291 64,287 - -
Proceeds from disposal of property, plant & equipment 50,521 28,928 29,197 7,347
Proceeds from disposal of investment property 250,000 12,923 250,000 12,923
Development cost incurred on biological assets net of harvest 15 (7,099) (7,511) - -
Investments in group companies - - (534,862) -
Investment in equity accounted investee (34,000) (110,000) - -
Interest received 6.2 14,252 7,174 2,551 814
Dividend received from subsidiary companies - - 89,897 41,910
Net payments to non-controlling interest (534,862) - - -
Net cash flows from/(used in) investing activities (1,349,033) (2,839,373) (310,404) (1,331)
Cash flows from/(used in) financing activitiesLong term loans obtained 24.1.1 801,027 2,571,093 - -
Repayment of long term loans 24.1.1 (409,538) (578,913) - -
Loan given to subsidiary company 22.1 - - (25,000) (25,000)
Loan repayment by subsidiary company - - 4,458 -
Capital payment on finance lease (1,977) (1,953) - -
Dividend paid to equity holders of the parent (120,105) (416,251) (120,105) (416,251)
Dividend paid to shareholders with non-controlling interest (39,586) (128,563) - -Net cash flows from/(used in) financing activities 229,821 1,445,413 (140,647) (441,251)
Net increase/(decrease) in cash & cash equivalents (176,223) 877,460 (330,870) 167,570
Change in cash reserve due to deemed disposal of HGBL - (11,115) - -
Cash & cash equivalents at the beginning of the year (1,553,376) (2,419,721) (248,776) (416,346)
Cash & cash equivalents at the end of the year (Note B) (1,729,599) (1,553,376) (579,646) (248,776)
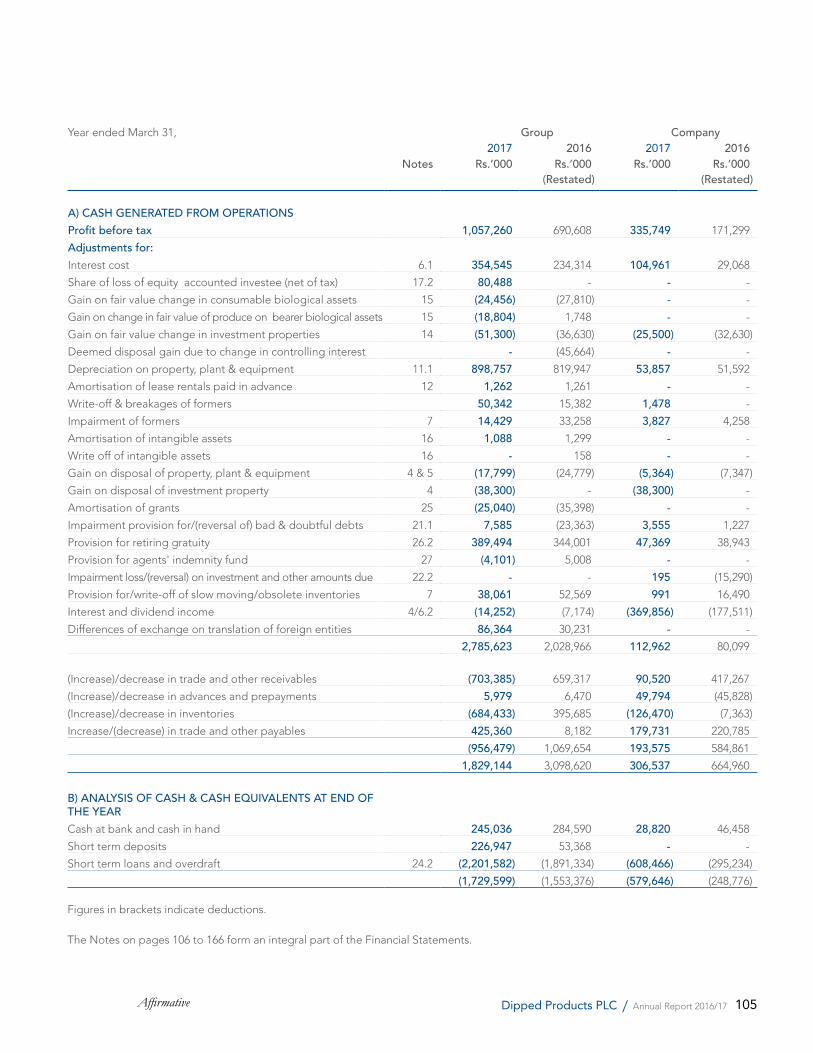
105Affirmative Dipped Products PLC / Annual Report 2016/17
Year ended March 31, Group Company2017 2016 2017 2016
Notes Rs.’000 Rs.’000(Restated)
Rs.’000 Rs.’000(Restated)
A) CASH GENERATED FROM OPERATIONSProfit before tax 1,057,260 690,608 335,749 171,299
Adjustments for:Interest cost 6.1 354,545 234,314 104,961 29,068
Share of loss of equity accounted investee (net of tax) 17.2 80,488 - - -
Gain on fair value change in consumable biological assets 15 (24,456) (27,810) - -
Gain on change in fair value of produce on bearer biological assets 15 (18,804) 1,748 - -
Gain on fair value change in investment properties 14 (51,300) (36,630) (25,500) (32,630)
Deemed disposal gain due to change in controlling interest - (45,664) - -
Depreciation on property, plant & equipment 11.1 898,757 819,947 53,857 51,592
Amortisation of lease rentals paid in advance 12 1,262 1,261 - -
Write-off & breakages of formers 50,342 15,382 1,478 -
Impairment of formers 7 14,429 33,258 3,827 4,258
Amortisation of intangible assets 16 1,088 1,299 - -
Write off of intangible assets 16 - 158 - -
Gain on disposal of property, plant & equipment 4 & 5 (17,799) (24,779) (5,364) (7,347)
Gain on disposal of investment property 4 (38,300) - (38,300) -
Amortisation of grants 25 (25,040) (35,398) - -
Impairment provision for/(reversal of) bad & doubtful debts 21.1 7,585 (23,363) 3,555 1,227
Provision for retiring gratuity 26.2 389,494 344,001 47,369 38,943
Provision for agents' indemnity fund 27 (4,101) 5,008 - -
Impairment loss/(reversal) on investment and other amounts due 22.2 - - 195 (15,290)
Provision for/write-off of slow moving/obsolete inventories 7 38,061 52,569 991 16,490
Interest and dividend income 4/6.2 (14,252) (7,174) (369,856) (177,511)
Differences of exchange on translation of foreign entities 86,364 30,231 - -
2,785,623 2,028,966 112,962 80,099
(Increase)/decrease in trade and other receivables (703,385) 659,317 90,520 417,267
(Increase)/decrease in advances and prepayments 5,979 6,470 49,794 (45,828)
(Increase)/decrease in inventories (684,433) 395,685 (126,470) (7,363)
Increase/(decrease) in trade and other payables 425,360 8,182 179,731 220,785
(956,479) 1,069,654 193,575 584,861
1,829,144 3,098,620 306,537 664,960
B) ANALYSIS OF CASH & CASH EQUIVALENTS AT END OF THE YEARCash at bank and cash in hand 245,036 284,590 28,820 46,458
Short term deposits 226,947 53,368 - -
Short term loans and overdraft 24.2 (2,201,582) (1,891,334) (608,466) (295,234)
(1,729,599) (1,553,376) (579,646) (248,776)
Figures in brackets indicate deductions.
The Notes on pages 106 to 166 form an integral part of the Financial Statements.
106 AffirmativeDipped Products PLC / Annual Report 2016/17
Notes to the Financial Statements
1. REPORTING ENTITY1.1 GeneralDipped Products PLC, is a Company incorporated and domiciled in Sri Lanka. The ordinary shares of the Company are listed on the Colombo Stock Exchange of Sri Lanka. The address of the Company’s registered office is given on the back inner cover in this report.
The Consolidated Financial Statements of Dipped Products PLC, as at and for the year ended March 31, 2017 encompass the Company and its Subsidiaries (together referred to as the ‘Group’) and the Group’s interest in Equity Accounted Investee. All subsidiaries in the Group are limited liability companies incorporated and domiciled in Sri Lanka other than Dipped Products (Thailand) Ltd. and ICOGUANTI S.p.A which are incorporated and domiciled in Thailand and Italy respectively.
Descriptions of the nature of the operations and principal activities of the Company ,its Subsidiaries and Equity Accounted Investee are given on the pages 174 to 175 There were no significant changes in the nature of the principle activities of the Company and the Group during the financial year under review.
The Company’s ultimate Parent undertaking and controlling entity is Hayleys PLC which is incorporated in Sri Lanka.
The Financial Statements of all companies in the Group other than those mentioned in Note 2.2.5 to the Financial Statements are prepared for a common financial year which ends on March 31.
The Consolidated Financial Statements of the Group for the year ended March 31, 2017 were authorised for issue by the Directors on May 17, 2017.
1.2 Responsibility for Financial statementsThe responsibility of the Directors in relation to the Financial Statements is set out in the Statement of Directors’ Responsibility Report.
1.3 Basis of Preparation1.3.1 Statement of ComplianceThe Consolidated Financial Statements have been prepared in accordance with the Sri Lanka Accounting and Auditing Standards Act No. 15 of 1995, which requires compliance with Sri Lanka Accounting Standards promulgated by the Institute of Chartered Accountants of Sri Lanka (CA Sri Lanka), and with the requirements of the Companies Act No. 7 of 2007.
1.3.2 Basis of MeasurementThe Consolidated Financial Statements have been prepared on a historical cost basis, except for the following items in the Statement of Financial Position:
Land which is recognized as property plant and equipment is measured at cost at the time of the acquisition and subsequently carried at fair value.
Land and buildings which are recognized as investment property which are measured at cost at the time of the acquisition and subsequently carried at fair value
Financial instruments- fair value through profit or loss are measured at fair value.
Financial instruments- available-for-sale financial assets are measured at fair value.
Consumable biological assets are measured at fair value.
Agricultural produce from biological assets are reflected at fair value.
Where appropriate, the specific policies are explained in the succeeding notes.
No adjustments have been made for inflationary factors in the Consolidated Financial Statements.
1.3.3 Functional and Presentation CurrencyThe Financial Statements are presented in Sri Lankan Rupee which is the Group’s functional currency except for certain subsidiaries whose functional currencies are different as they operate in different
economic environments. All financial information presented in Sri Lankan Rupees have been given to the nearest thousand (Rs. ‘000), unless stated otherwise.
1.3.4 Materiality and AggregationEach material class of similar items is presented separately in the Consolidated Financial Statements.
Items of a dissimilar nature or function are presented separately unless they are immaterial.
1.3.5 Changes in Accounting PoliciesThe accounting policies adopted by the Group are consistent with those used in the previous financial year except as reflected in Note 2.23.
1.3.6 Comparative informationThe presentation and classification of the financial statements of the previous years have been amended, where relevant including the following for better presentation and to be comparable with those of the current year.
2. SIGNIFICANT ACCOUNTING POLICIES2.1 Significant Accounting Judgments, Estimates and AssumptionsThe preparation of Financial Statements in conformity with SLFRS/LKAS’s requires management to make judgments, estimates and assumptions that affect the application of accounting policies and the reported amounts of assets, liabilities, income and expenses. Judgments and estimates are based on historical experience and other factors including expectations that are believed to be reasonable under the circumstances. Hence actual experience and results may differ from these judgments and estimates.
Estimates and underlying assumptions are reviewed on an ongoing basis. Revisions to accounting estimates are recognised in the period in which the estimates are revised if the revision affects only that period and any future periods.

107Affirmative Dipped Products PLC / Annual Report 2016/17
Information about significant areas of estimation uncertainty and critical judgments in applying accounting policies that have the most significant effect on the amounts recognised in the financial statements is included in the following notes.
2.1.1 Going Concern The Directors have made an assessment of the Group’s ability to continue as a going concern and is satisfied that it has the resources to continue in business for the foreseeable future. Furthermore, management is not aware of any material uncertainties that may cast significant doubt upon the Group’s ability to continue as a going concern. Therefore, the Financial Statements continue to be prepared on the going concern basis.
2.1.2 TaxationUncertainties exist with respect to the interpretation of complex tax regulation, changes in tax laws, and the amount and timing of future taxable income. Given the wide range of international business relationships and the long-term nature and the complexity of existing contractual agreements, differences arising between the actual results and the assumptions made, or future changes to such assumptions, could necessitate future adjustments to tax income and expense already recorded. The Group establish provisions, based on reasonable estimates, for possible consequences of audits by the tax authorities of the respective countries in which it operates. The amount of such provisions is based on various factors, such as experience of previous tax audits and differing interpretations of tax regulations by the taxable entity and the responsible tax authority. Such differences of interpretation may arise on a wide variety of issues depending on the conditions prevailing in the respective domicile of the Group companies.
Deferred tax assets are recognized for unused tax losses to the extent that it is probable that taxable profit will be available against which the losses can be utilised. Significant management
judgement is required to determine the amount of deferred tax assets that can be recognised, based on upon the likely timing and the level of future taxable profits together as with future tax planning strategies.
2.1.3 Employee Benefit Liability - GratuityThe present value of the employee benefit obligations depends on a number of factors that are determined on an actuarial basis using a number of assumptions. Key assumptions used in determining the defined retirement benefit obligations are given in Note 26 to the Financial Statements. Any changes in these assumptions will impact the carrying amount of employee benefit obligations.
2.1.4 Measurement of the Recoverable Amount of Cash-Generating Units Containing GoodwillThe impairment analysis is principally based upon discounted estimated cash flows from the use and eventual disposal of the assets. Factors such as a lower than anticipated sale resulting in a decrease of net cash flows and changes in the discount rates could be reflective of an impairment that should be recognised by the group. Further details are disclosed in Note 16 to the Financial Statements.
2.1.5 Revaluation of LandThe Group measures land at revalued amount with changes in value being recognised in Other Comprehensive Income. The valuer has applied an open market approach in determining the valuation of the property. Further details on revaluation lands are disclosed in Note 11 of the Financial Statements.
2.1.6 Fair Valuation of Biological Assets The group measures consumable Biological Assets at fair value and changes in value being recognised in the statement of profit or loss. Fair valuation involves assumptions which are provided in Note 15. Such estimations are subject to significant uncertainties.
2.1.7 Impairment of property, plant and equipment and intangible assets other than goodwillThe impairment analysis is principally based upon discounted estimated cash flows from the use and eventual disposal of the assets. Factors such as a lower than anticipated sale resulting in a decreased of net cash flows and changes in discount rate could be reflective of an impairment that should be recognised by the group.
2.2 Basis of ConsolidationThe Consolidated Financial Statements (referred to as the ‘Group’) comprise the Financial Statements of the Company and its Subsidiaries. List of subsidiaries are disclosed in Note 17 to the Financial Statements.
2.2.1 SubsidiariesSubsidiaries are those entities controlled by the Group. Control is achieved when the Group is exposed, or has rights to variable returns from its involvement with the investee and when it has the ability to affect those returns through its power over the investee. Specifically, the Group controls an investee if, and only if, the Group has:
Power over the investee (i.e., existing rights that give it the current ability to direct the relevant activities of the investee)
Exposure, or rights, to variable returns from its involvement with the investee
The ability to use its power over the investee to affect its returns
Generally, there is a presumption that a majority of voting rights results in control. To support this presumption and when the Group has less than a majority of the voting or similar rights of an investee, the Group considers all relevant facts and circumstances in assessing whether it has the power over an investee.
The contractual arrangement(s) with the other vote holders of the investee.
Rights arising from other contractual arrangements

108 AffirmativeDipped Products PLC / Annual Report 2016/17
Notes to the Financial Statements
The Group’s voting rights and potential voting right.
The Group re-assesses whether or not it controls an investee if facts and circumstances indicate that there are changes to one or more of the three elements of control. Consolidation of a subsidiary begins when the Group obtains control over the subsidiary and ceases when the Group loses control of the subsidiary. Assets, liabilities, income and expenses of a subsidiary acquired or disposed of during the year are included in the Consolidated Financial Statements from the date the Group gains control until the date the Group ceases to control the subsidiary.
A change in the ownership interest of a subsidiary, without a loss of control, is accounted for as an equity transaction. If the Group loses control over a subsidiary, it derecognises the related assets (including goodwill), liabilities, non-controlling interest and other components of equity while any resultant gain or loss is recognised in statement of profit or loss. Any investment retained is recognised at its fair value.
When necessary, adjustments are made to the financial statements of subsidiaries to bring their accounting policies include with the Group’s accounting policies. A change in the ownership interest of a subsidiary, without a loss of control, is accounted for as an equity transaction.
If the Group losses control over a subsidiary, it derecognises the related assets (Including goodwill), liabilities, non-controlling interest and other components of equity while any resultant gain or loss is recognized in the Statements of Profit or Loss. Any investment retained is recognized at fair value.
2.2.2 Business combination and goodwillBusiness combinations are accounted for using the acquisition method of accounting. The cost of an acquisition is measured as the aggregate of the consideration transferred, measured at acquisition date fair value and the amount
of any non-controlling interest in the acquiree. For each business combination, the Group elects whether to measures the non-controlling interest in the acquire either at fair value or at the proportionate share of the acquiree’s identifiable net assets.
Transaction costs, other than those associated with the issue of debt or equity securities that the Group incurs in connection with a business combinations are expensed as incurred.
When the Group acquires a business, it assesses the financial assets and liabilities assumed for appropriate classification and designation in accordance with the contractual terms, economic circumstances and pertinent conditions as at the acquisition date. This includes the separation of embedded derivatives In host contracts by the acuquiree.
If the business combination is achieved in stages, any previously held equity interest is re-measured at its acquisition date fair value and any resulting gain or loss recognised in statement of profit or loss.
Any contingent consideration to be transferred by the acquirer will be recognised at fair value at the acquisition date. Subsequent changes in the fair value of the contingent consideration which is deemed to be an asset or liability will be recognised in accordance with LKAS 39 either in the statement of profit or loss or to Other Comprehensive Income. If the contingent consideration is classified as equity, it will not be remeasured. Subsequent settlement is accounted for within equity. In instances where the contingent consideration does not fall within the scope of LKAS 39, it is measured in accordance with the appropriate SLFRS/LKAS.
Goodwill is initially measured at cost (being the excess of the aggregate of the consideration transferred and the amount recognised for non-controlling interests and any previous interest held over the net identifiable assets acquired and liabilities assumed). If the fair value of
the net assets acquired is in excess of the aggregate consideration transferred, the Group re-assesses whether it has correctly identified all of the assets acquired and all of the liabilities assumed and reviews the procedures used to measure the amounts to be recognised at the acquisition date. If the reassessment still results in an excess of the fair value of net assets acquired over the aggregate consideration transferred, then the gain on bargain purchase is recognized in statement of profit or loss.
After initial recognition, goodwill is measured at cost less any accumulated impairment losses. For the purpose of impairment testing, goodwill acquired in a business combination is, from the acquisition date, allocated to each of the Group’s cash-generating units that are expected to benefit from the combination, irrespective of whether other assets or liabilities of the acquiree are assigned to those units.
Where goodwill has been allocated to a cash-generating unit (CGU) and part of the operation within that unit is disposed of, the goodwill associated with the disposed operation is included in the carrying amount of the operation when determining the gain or loss on disposal. Goodwill disposed of in this circumstance is measured based on the relative values of the disposed operation and the portion the cash- generating unit retained.
2.2.3 Transactions with Non-Controlling InterestsProfit or loss and each component of Other Comprehensive Income are attributed to equity holders of the parent of the Group and to the non-controlling interests, even if this results in the non-controlling interests having a deficit balance.
2.2.4 Transactions Eliminated on ConsolidationAll intra-group balances, transactions, unrealised gains and losses resulting from intra-group transactions and intra-group dividends are eliminated in full in preparing the Consolidated Financial
109Affirmative Dipped Products PLC / Annual Report 2016/17
Statements. Unrealised gains arising from transactions with equity accounted investees are eliminated against the investment to the extent of the Group’s interest in the investee. Unrealised losses are eliminated in the same way as unrealised gains but only to the extent that there is no evidence of impairment.
2.2.5 Companies with Different Accounting YearsThe Financial Statements of all subsidiaries in the Group other than those mentioned below are prepared on a common financial year, which ends on March 31.
The subsidiaries with December 31, financial year ends prepare additional financial information as of the same date as the Financial Statements of the Parent for consolidation purpose except for ICOGUANTI S.p.A as explained below.
ICOGUANTI S.p.A’s financial year ends on December 31. However for consolidation purposes, financial statements for the 12 months period from March 1, 2016 to February 28, 2017 have been used in the current year and a 14 month period from January 1, 2015 to February 29, 2016 was used for the previous financial year.
Dipped Products (Thailand) Ltd.’s financial year ends on December 31. Financial statements for the 12 months period from April 1, 2016 to March 31, 2017 has been consolidated in the current financial year.
2.2.6 Equity accounted investees (Investment in associates and joint ventures)An associate is an entity over which the Group has significant influence. Significant influence is the power to participate in the financial and operating policy decisions of the investee, but is not control or joint control over those policies.
A joint venture is a type of joint arrangement whereby the parties that have joint control of the arrangement have rights to the net assets of the joint venture. Joint control is the contractually agreed
sharing of control of an arrangement, which exists only when decisions about the relevant activities require unanimous consent of the parties sharing control.
The considerations made in determining significant influence or joint control is similar to those necessary to determine control over subsidiaries.
The group presently does not have arrangements reflective of being a joint venture.
The Group’s investments in its associates are accounted for using the equity method.
Under the equity method, the investment in an associate is initially recognised at cost. The carrying amount of the investment is adjusted to recognise changes in the Group’s share of net assets of the associate since the acquisition date. Goodwill relating to the associate is included in the carrying amount of the investment and is not tested for impairment separately.
The Statement of Profit or Loss reflects the Group’s share of the results of operations of the associate. Any change in Other Comprehensive Income of those investees is presented as part of the Group’s Other Comprehensive Income. In addition, when there has been a change recognised directly in the equity of the associate, the Group recognises its share of any changes, when applicable, in the Statement of Changes in Equity. Unrealised gains and losses resulting from transactions between the Group and the associate is eliminated to the extent of the interest in the associate.
The aggregate of the Group’s share of profit or loss of an associate is shown on the face of the Statement of Profit or Loss outside operating profit and represents profit or loss after tax and non-controlling interests in the subsidiaries of the associate or joint venture.
The Financial Statements of the associate
are prepared for the same reporting period as the Group. When necessary, adjustments are made to bring the accounting policies in line with those of the Group.
After application of the equity method, the Group determines whether it is necessary to recognise an impairment loss on its investment in its associate. At each reporting date, the Group determines whether there is objective evidence that the investment in the associate is impaired. If there is such evidence, the Group calculates the amount of impairment as the difference between the recoverable amount of the associate and its carrying value, and then recognises the loss as ‘Share of profit/(loss) of an associate in the Statement of Profit or Loss.
Upon loss of significant influence over the associate the Group measures and recognises any retained investment at its fair value. Any difference between the carrying amount of the associate upon loss of significant influence and the fair value of the retained investment and proceeds from disposal is recognised in the Statement of Profit or Loss.
2.3. Foreign Currency Translation The Group’s Consolidated Financial Statements are presented in Sri Lanka Rupees, which is also the Parent Company’s functional currency. Each entity in the Group determines its own functional currency and items included in the Financial Statements of each entity are measured using that functional currency.
2.3.1 Transactions and BalancesTransactions in foreign currencies are initially recorded by the Group entities at their respective functional currency spot rates at the date the transaction first qualifies for recognition.
Monetary assets and liabilities denominated in foreign currencies are retranslated at the functional currency spot rate of exchange at the reporting date. All differences arising on settlement or
110 AffirmativeDipped Products PLC / Annual Report 2016/17
translation of monetary items are taken to the statement of profit or loss.
Non-monetary items that are measured in terms of historical cost in a foreign currency are translated using the exchange rates as at the dates of the initial transactions.
Non-monetary items measured at fair value in a foreign currency are translated using the exchange rates at the date when the fair value is determined. The gain or loss arising on retranslation of non-monetary items is treated in line with the recognition of gain or loss on change in fair value of the item (i.e., translation differences on items whose fair value gain or loss is recognised in Other Comprehensive Income or statement of profit or loss.
2.3.2 Foreign OperationsThe results and financial position of all Group entities that have a functional currency other than the Sri Lanka Rupee are translated into Sri Lanka Rupees as follows:
assets and liabilities of foreign operations, including goodwill and fair value adjustments arising on the acquisition, are translated to Sri Lanka Rupees at the exchange rate at the reporting date;
income and expenses are translated at the average exchange rates for the period.
Foreign currency differences are recognised in exchange fluctuation reserve through Other Comprehensive Income.
When a foreign operation is disposed off, the relevant amount in the translation reserve is transferred to statement of profit or loss as part of the profit or loss on disposal. On the partial disposal of a subsidiary that includes a foreign operation, the relevant proportion of such cumulative amount is re-attributed to non-controlling interest. In any other partial disposal of a foreign operation, the relevant proportion is reclassified to
statement of profit or loss.
Foreign exchange gains or losses arising from a monetary item receivable from or payable to a foreign operation, the settlement of which is neither planned nor likely to occur in the foreseeable future and which in substance is considered to form part of the net investment in the foreign operation, are recognised in Other Comprehensive Income in the exchange fluctuation reserve.
Any goodwill arising on the acquisition of a foreign operation and any fair value adjustments to the carrying amounts of assets and liabilities arising on the acquisition are treated as assets and liabilities of the foreign operation and translated at the closing rate.
2.3.3 Current versus non-current classificationThe Group presents assets and liabilities in the Statement of Financial Position based on current/non-current classification. An asset is current when it is:
Expected to be realised or intended to sold or consumed in a normal operating cycle
Held primarily for the purpose of trading
Expected to be realised within twelve months after the reporting period, or
Cash or cash equivalent unless restricted from being exchanged or used to settle a liability for at least twelve months after the reporting period
All other assets are classified as non-current.
A liability is current when:
It is expected to be settled in a normal operating cycle
It is held primarily for the purpose of trading
It is due to be settled within twelve months after the reporting period, or
There is no unconditional right to defer the settlement of the liability for at least twelve months after the reporting period
The Group classifies all other liabilities as non-current.
Deferred tax assets and liabilities are classified as non-current assets and liabilities.
2.3.4 Fair value measurementThe Group measures financial instruments such as available for sale financial assets/ derivatives, and non-financial assets such as owner occupied land, investment property, consumable biological assets and agricultural produce from bearer plants, at fair value. Fair value related disclosures for financial instruments and non-financial assets that are measured at fair value or where fair values are disclosed are summarised in the following notes:
Disclosures for valuation methods, significant estimates and assumptions Note 35.
Quantitative disclosures of fair value measurement hierarchy Note 35.
Property (land) under revaluation model Note 11.
Investment Properties Note 14 and 35.
Financial instruments (including those carried at amortised cost) Note 35.
Biological assets Note 15 and 35.
Agricultural produce from bearer plants Note 20.1.
Fair value is the price that would be received to sell an asset or paid to transfer a liability in an orderly transaction between market participants at the measurement date. The fair value measurement is based on the presumption that the transaction to sell the asset or transfer the liability takes place either:
In the principal market for the asset or liability, or
In the absence of a principal market, in the most advantageous market for the asset or liability
Notes to the Financial Statements
111Affirmative Dipped Products PLC / Annual Report 2016/17
The principal or the most advantageous market must be accessible by the Group.
The fair value of an asset or a liability is measured using the assumptions that market participants would use when pricing the asset or liability, assuming that market participants act in their economic best interest.
A fair value measurement of a non-financial asset takes into account a market participant’s ability to generate economic benefits by using the asset in its highest and best use or by selling it to another market participant that would use the asset in its highest and best use.
The Group uses valuation techniques that are appropriate in the circumstances and for which sufficient data are available to measure fair value, maximising the use of relevant observable inputs and minimising the use of unobservable inputs.
All assets and liabilities for which fair value is measured or disclosed in the financial statements are categorised within the fair value hierarchy, described as follows, based on the lowest level input that is significant to the fair value measurement as a whole:
Level 1 - Quoted (unadjusted) market prices in active markets for identical assets or liabilities
Level 2 - Valuation techniques for which the lowest level input that is significant to the fair value measurement is directly or indirectly observable
Level 3 - Valuation techniques for which the lowest level input that is significant to the fair value measurement is unobservable
For assets and liabilities that are recognised in the Financial Statements at fair value on a recurring basis, the Group determines whether transfers have occurred between levels in the hierarchy by re-assessing categorisation (based on the lowest level input that is significant to the fair value measurement as a whole) at the end of each reporting period.
For the purpose of fair value disclosures, the Group has determined classes of assets and liabilities on the basis of the nature, characteristics and risks of the asset or liability and the level of the fair value hierarchy as explained above.
2.4 Property, Plant and Equipment 2.4.1 Property, plant & equipmentThe group applies the requirements of LKAS 16 on ‘Property Plant and Equipment’ in accounting for its owned assets which are held for and use in the provision of the services or for administration purpose and are expected to be used for more than one year.
2.4.2 Basis of recognitionProperty, plant and equipment is recognised if it is probable that future economic benefit associated with the assets will flow to the Group and cost of the asset can be reliably measured.
2.4.3 MeasurementItems of Property, Plant and Equipment are measured at cost less accumulated depreciation and accumulated impairment losses, if any, whilst land is measured at fair value.
Owned AssetsThe cost of Property, Plant and Equipment includes expenditure that are directly attributable to the acquisition of the asset. The cost of self-constructed assets includes the cost of materials and direct labour, any other costs directly attributable to bringing the asset to a working condition for its intended use, and the costs of dismantling and removing the items and restoring the site on which they are located, and borrowing costs if it is a qualifying asset.
Purchased software that is integral to functionality of the related equipment is capitalised as a part of that equipment.
When significant parts of plant and equipment are required to be replaced at intervals, the Group depreciates them separately based on their specific useful lives.
Revaluation of land is done with sufficient frequency to ensure that the fair value of the land does not differ materially from its carrying amount, and is undertaken by professionally qualified valuers.
Any revaluation surplus is recorded in Other Comprehensive Income and credited to the revaluation reserve in equity, except to the extent that it reverses a revaluation decrease of the same asset previously recognised in profit or loss, in which case, the increase is recognised in profit or loss. A revaluation deficit is recognised in the statements of profit or loss, except to the extent that it offsets an existing surplus on the same asset recognised in the revaluation reserve. Upon disposal, any revaluation reserve relating to the particular asset being sold is transferred to retained earnings.
2.4.4 Subsequent CostsThe cost of replacing a component of an item of Property, Plant and Equipment is recognised in the carrying amount of the item if it is probable that the future economic benefits embodied within the part will flow to the Group and its cost can be measured reliably. The carrying amount of the replaced part is derecognised in accordance with the derecognition policy given below.
The costs of the day-to-day servicing of Property, Plant and Equipment are recognised in statement of profit or loss as incurred.
2.4.5 DerecognitionThe carrying amount of an item of Property, Plant and Equipment is derecognised on disposal; or when no future economic benefits are expected from its use. Gains and losses on derecognition are recognised (calculated as the difference between the net disposal proceeds and the carrying amount of the asset) in statement of profit or loss and gains are not classified as revenue. When revalued assets are sold, any related amount included in the revaluation reserve is transferred to retained earnings.
112 AffirmativeDipped Products PLC / Annual Report 2016/17
2.4.6 Depreciation Depreciation is recognised in the statement of Profit or Loss on a straight-line basis over the estimated useful lives of each part of an item of Property, Plant and Equipment, since this most closely reflects the expected pattern of consumption of the future economic benefits embodied in the asset.
The Group reviews its residual values, useful lives and method of depreciation at each reporting date. Judgement by management is exercised in the estimation of these values, rates and methods and hence they are subject to uncertainty.
The estimated useful lives for the current and comparative periods are as follows:
Buildings 20 years
Plant and Machinery 10 years
Furniture & Fittings 6-8 years
Office & Other Equipment 5-8 years
Motor Vehicles 4-5 years
Stores Equipment 5 years
Laboratory Equipment 5 years
Depreciation of an asset begins when it is available for use and ceases at the earlier of the dates on which the asset is classified as held for sale or is derecognised.
Leased AssetsThe determination of whether an arrangement is, or contains, a lease is based on the substance of the arrangement at inception date, whether fulfillment of the arrangement is dependent on the use of a specific asset or assets or the arrangement conveys a right to use the asset, even if that right is not explicitly specified in an arrangement.
Group as a LesseeA lease is classified at the inception as a finance lease or an operating lease. A lease that transfers substantially all the risks and rewards incidental to ownership to the Group is classified as a Finance Lease. Finance lease items are capitalised on the commencement of the lease at the fair value of the leased property or, if
lower, at the present value of the minimum lease payments. Lease payments are apportioned between finance charges and reduction of the lease liability so as to achieve a constant rate of interest on the remaining balance of the liability. Finance charges are recognised in finance costs in the statement of profit or loss.
A leased asset is depreciated over the useful life of the asset. However, if there is no reasonable certainty that the Group will obtain ownership by the end of the lease term, the asset is depreciated over the shorter of the estimated useful life of the asset and the lease term.
Operating lease payments are recognised as an operating expense in the statement of profit or loss on a straight-line basis over the lease term.
Group as a LessorLeases in which the Group does not transfer substantially all the risks and benefits of ownership of an asset are classified as operating leases. Initial direct costs incurred in negotiating an operating lease are added to the carrying amount of the leased asset and recognised over the lease term on the same basis as rental income. Contingent rents are recognised as revenue in the period in which they are earned.
2.5 Formers (Moulds)In respect of formers, a 10% provision on the written down value is recognised as an impairment in the statement of profit or loss.
2.6 Intangible AssetsBasis of recognitionAn Intangible asset is recognised if it is probable that the future economic benefits associated with the assets will flow to the Group and cost of the assets can be reliably measured.
Intangible assets acquired separately are measured on initial recognition at cost. The cost of intangible assets acquired in a business combination is their fair value as at the date of acquisition. Following initial recognition, intangible assets are carried
at cost less accumulated amortisation and accumulated impairment losses, if any. Internally generated intangible assets, excluding capitalised development costs, are not capitalised and expenditure is reflected in the statement of profit or loss in the year in which the expenditure is incurred.
Intangible assets with finite lives are amortised over the useful economic life and assessed for impairment whenever there is an indication that the intangible asset may be impaired.
Intangible assets with indefinite useful lives are not amortised, but are tested for impairment annually, either individually or at the cash-generating unit level.
The amortisation period and method are reviewed annually.
2.6.1 Research and DevelopmentResearch costs are expensed as incurred. Development expenditures on an individual project are recognised as an intangible asset when the Group can demonstrate:
The technical feasibility of completing the intangible asset so that it will be available for use or sale
Its intention to complete and its ability to use or sell the asset
How the asset will generate future economic benefits
The availability of resources to complete the asset
The ability to measure reliably the expenditure during development
Following initial recognition of the development expenditure as an asset, the asset is carried at cost less any accumulated amortisation and accumulated impairment losses. Amortisation of the asset begins when development is complete and the asset is available for use. It is amortised over the period of expected future benefit. Amortisation is recorded in statement of profit or loss. During the period of development, the asset is tested for impairment annually.
Notes to the Financial Statements
113Affirmative Dipped Products PLC / Annual Report 2016/17
2.6.2 Subsequent ExpenditureSubsequent expenditure is capitalised only when it increases the future economic benefits embodied in the specific asset to which it relates. All other expenditure including expenditure on internally generated goodwill is recognised in the statement of profit or loss as incurred.
2.6.3 AmortisationAmortisation is recognised in statement of profit or loss on a straight-line basis over the estimated useful lives of intangible assets, other than goodwill and brand name, from the date on which they are available for use. The estimated useful lives for the current and comparative periods are as follows:
Development Cost - 15 years
Computer Software - 5 years
Right to generate Hydro Power - 15 years
ERP systems - 5 to 8 years
2.6.4 De-recognition of intangible assetsIntangible assets are de-recognised on disposal or when no future economic benefits are expected from its use. Gains or losses arising from de-recognition of an intangible asset are measured as the difference between the net disposal proceeds and the carrying amount of the asset and are recognised in the statement of profit or loss when the asset is derecognised.
2.7 Investment PropertyInvestment property is property held either to earn rental income or for capital appreciation or both, but not for sale in the ordinary course of business, use in the production or supply of goods or services or for administrative purposes.
Investment properties are measured initially at cost, including transaction costs. The carrying value of an investment property includes the cost of replacing part of an existing investment property, at the time that cost is incurred if the recognition criteria are met, and excludes the costs of day to- day servicing of the investment property. Subsequent to initial
recognition, the investment properties are stated at fair values, which reflect market conditions at the reporting date.
Gains or losses arising from changes in fair value are included in the statement of profit or loss in the year in which they arise. Fair values are evaluated with sufficient frequency by an accredited external, independent valuer. Investment properties are derecognised when disposed, or permanently withdrawn from use because no future economic benefits are expected. Any gains or losses on retirement or disposal are recognised in the income statement in the year of retirement or disposal.
Transfers are made to or from investment property only when there is a change in use for a transfer from investment property to owner occupied property or inventory (WIP), the deemed cost for subsequent accounting is the fair value at the date of change in use. If owner occupied property becomes an investment property or inventory (WIP), the Group accounts for such property in accordance with the policy stated under property, plant and equipment up to the date of change in use. Where Group companies occupy a significant portion of the investment property of a subsidiary, such investment properties are treated as property, plant and equipment in the consolidated financial statements, and accounted using Group accounting policy for property, plant and equipment.
2.8 Financial InstrumentsA financial instrument is any contract that gives rise to a financial asset of one entity and financial liability or equity instrument of another entity.
2.8.1 Financial Assets - Initial Recognition and Subsequent MeasurementFinancial assets within the scope of LKAS 39 are classified as financial assets at fair value through profit or loss, loans and receivables, held to maturity investment, available for sale financial assets or as derivatives designated as hedging
instruments in an effective hedge, as appropriate. The group determines the classification of its financial assets at initial recognition.
All financial assets are recognised initially at fair value plus, in the case of financial assets not recorded at fair value through profit or loss, transaction costs that are attributable to the acquisition of the financial asset.
Purchases or sales of financial assets that require delivery of assets within a time frame established by regulation or convention in the market place (regular way trades) are recognised on the trade date, i.e., the date that the Group commits to purchase or sell the asset.
The Group’s financial assets include Financial assets in loans and receivable and available for sale categories. This include cash and short-term deposits, trade and other receivables, loans and other receivables, amounts due from subsidiaries, amounts due from equity accounted investees, quoted and unquoted financial instruments.
Subsequent MeasurementThe subsequent measurement of financial assets depends on their classification as described below:
Loans and ReceivablesLoans and receivables are non-derivative financial assets with fixed or determinable payments that are not quoted in an active market. After initial measurement, such financial assets are subsequently measured at amortised cost using the Effective Interest Rate (EIR) method, less impairment. Amortised cost is calculated by taking into account any discount or premium on acquisition and fees or costs that are an integral part of the EIR. The EIR amortisation is included under finance income in the statement of profit or loss. The losses arising from impairment are recognised in the statement of profit or loss in finance cost for loans and in other expenses for receivables.
114 AffirmativeDipped Products PLC / Annual Report 2016/17
Available-For-Sale Financial InstrumentsAvailable-for-sale financial instruments include equity investments and debt securities.
Equity investments classified as available-for-sale are those that are neither classified as held-for- trading nor designated at fair value through profit or loss. Debt securities in this category are those that are intended to be held for an indefinite period of the time and that may be sold in response to needs for liquidity or in response to changes in market conditions.
After initial measurement, available-for-sale financial investments are subsequently measured at fair value with unrealised gains or losses recognised as other comprehensive income in the available-for-sale reserve until the investment is derecognised, at which time the cumulative gain or loss is recognised in other operating income, or the investment is determined to be impaired, when the cumulative loss is reclassified from the available-for sale reserve to the statement of profit or loss. Interest earned whilst holding available-for-sale financial instruments is reported as interest income using the effective interest rate method.
The Group evaluates whether the ability and intention to sell its available-for-sale financial assets in the near term is still appropriate. When, in rare circumstances, the Group is unable to trade these financial assets due to inactive markets and management’s intention to do so significantly changes in the foreseeable future, the Group may elect to reclassify these financial assets, if the management has the ability and intention to hold these assets for the foreseeable future or until maturity.
For a financial asset reclassified from the available-for-sale category, the fair value at the date of reclassification becomes its new amortised cost and any previous gain or loss on the asset that has been recognised in equity is amortised to the statement of profit or loss over the remaining life of the investment using
the EIR. Any difference between the new amortised cost and the maturity amount is also amortised over the remaining life of the asset using the effective interest rate. If the asset is subsequently determined to be impaired, then the amount recorded in equity is reclassified to the statement of profit or loss.
DerecognitionFinancial AssetsA financial asset (or, where applicable a part of a financial asset or part of a group of similar financial assets) is derecognised when:
The rights to receive cash flows from the asset have expired or;
The Group has transferred its rights to receive cash flows from the asset or has assumed an obligation to pay the received cash flows in full without material delay to a third party under a ‘pass-through’ arrangement; and either (a) the Group has transferred substantially all the risks and rewards of the asset, or (b) the Group has neither transferred nor retained substantially all the risks and rewards of the asset, but has transferred control of the asset.
When the Group has transferred its rights to receive cash flows from an asset or has entered into a pass-through arrangement, it evaluates if and to what extent it has retained the risks and rewards of ownership. When it has neither transferred nor retained substantially all of the risks and rewards of the asset, nor transferred control of the asset, the asset is recognised to the extent of the Group’s continuing involvement in the asset. In that case, the Group also recognises an associated liability. The transferred asset and the associated liability are measured on a basis that reflects the rights and obligations that the Group has retained.
Continuing involvement that takes the form of a guarantee over the transferred asset is measured at the lower of the original carrying amount of the asset and the maximum amount of consideration that the Group could be required to repay.
Impairment of Financial AssetsThe Group assesses, at each reporting date, whether there is any objective evidence that a financial asset or a group of financial assets is impaired. Financial asset or a group of financial assets is deemed to be impaired if, and only if, there is objective evidence of impairment as a result of one or more events that has occurred after the initial recognition of the asset (an incurred ‘loss event’) and that loss event has an impact on the estimated future cash flows of the financial asset that can be reliably estimated. Evidence of impairment may include indications that the debtors or a group of debtors is experiencing significant financial difficulty, default or delinquency payments, the probability that they will enter bankruptcy or other financial reorganisation and when observable data indicate that there is a measurable decrease in the estimated future cash flows, such as changes in arrears or economic conditions that correlate with defaults.
Financial Assets Carried at Amortised CostFor financial assets carried at amortised cost, the Group first assesses whether objective evidence of impairment exists individually for financial assets that are individually significant, or collectively for financial assets that are not individually significant. If the Group determines that no objective evidence of impairment exists for an individually assessed financial asset, whether significant or not, it includes the asset in a group of financial assets with similar credit risk characteristics and collectively assesses them for impairment. Assets that are individually assessed for impairment and for which an impairment loss is, or continues to be, recognised are not included in a collective assessment of impairment.
The amount of any impairment loss identified is measured as the difference between the asset’s carrying amount and the present value of estimated future cash flows (excluding future expected credit losses that have not yet been incurred). The present value of the estimated future cash flows is discounted at the financial asset’s original effective interest rate.
Notes to the Financial Statements
115Affirmative Dipped Products PLC / Annual Report 2016/17
The carrying amount of the asset is reduced through the use of an allowance account and the amount of the loss is recognised in the statement of profit or loss. Interest income continues to be accrued on the reduced carrying amount and is accrued using the rate of interest used to discount the future cash flows for the purpose of measuring the impairment loss. The interest income is recorded as part of finance income in the statement of profit or loss. Loans together with the associated allowance are written off when there is no realistic prospect of future recovery and all collateral has been realised or has been transferred to the Group. If, in a subsequent year, the amount of the estimated impairment loss increases or decreases because of an event occurring after the impairment was recognised, the previously recognised impairment loss is increased or reduced by adjusting the allowance account. If a future write-off is later recovered, the recovery is credited to finance costs in the statement of profit or loss.
Available-For-Sale Financial InvestmentsThe Group assesses at each reporting date whether there is objective evidence that an investment or a group of investments is impaired.
In the case of equity investments classified as available-for-sale, objective evidence would include a significant or prolonged decline in the fair value of the investment below its cost. ‘Significant’ is evaluated against the original cost of the investment and ‘prolonged’ against the period in which the fair value has been below its original cost. When there is evidence of impairment, the cumulative loss measured as the difference between the acquisition cost and the current fair value, less any impairment loss on that investment previously recognised in the statement of profit or loss is removed from other comprehensive income and recognised in the statement of profit or loss. Impairment losses on equity investments are not reversed through the statement of profit or loss; increases in their fair value after impairment are recognised directly in Other Comprehensive Income.
The determination of what is ‘significant’ or ‘prolonged’ requires judgment. In making this judgment, the Group evaluates among other factors, the duration or extent to which the fair value of the investment is less than its cost.
2.8.2 Financial LiabilitiesInitial Recognition and MeasurementFinancial liabilities within the scope of LKAS 39 are classified as financial liabilities at fair value through profit or loss or loans and borrowings as appropriate. The Group determines the classification of its financial liabilities at initial recognition.
All financial liabilities are recognised initially at fair value plus in the case of loans and borrowings directly attributable transaction costs.
The Group’s financial liabilities include trade and other payables, bank overdrafts, loans, borrowing and financial guarantee contracts.
Subsequent MeasurementThe measurement of financial liabilities depends on their classification as described below:
Financial liabilities at fair value through profit or lossFinancial liabilities at fair value through profit or loss include financial liabilities held for trading and financial liabilities designated upon initial recognition as at fair value through profit or loss. Financial liabilities are classified as held for trading if they are incurred for the purpose of repurchasing in the near term. This category includes derivative financial instruments entered into by the Group that are not designated as hedging instruments in hedge relationships as defined by LKAS 39. Separated embedded derivatives are also classified as held for trading unless they are designated as effective hedging instruments. Gains or losses on liabilities held for trading are recognised in the statement of profit or loss.
Financial liabilities designated upon initial recognition at fair value through profit and loss so designated at the initial date of recognition, and only if criteria of LKAS 39 are satisfied. The group has not designated any financial liability at fair value through profit or loss.
Loans and borrowingsAfter initial recognition, interest bearing loans and borrowings are subsequently measured at amortised cost using the EIR method. Gains and losses are recognised in the statement of profit or loss when the liabilities are derecognised as well as through the EIR amortisation process.
Amortised cost is calculated by taking into account any discount or premium on acquisition and fees or costs that are an integral part of the EIR. The EIR amortisation is included in finance costs in the statement of profit or loss.
Financial Guarantee ContractsDipped Products PLC provides corporate guarantees to banks in respect of banking facilities obtained by its subsidiaries. Fair value of such guarantees are measured on a periodic basis and the same is recognised as finance income through inter-company current accounts.
DerecognitionA financial liability is derecognised when the obligation under the liability is discharged or cancelled or expires. When an existing financial liability is replaced by another from the same lender on substantially different terms or the terms of an existing liability are substantially modified, such an exchange or modification is treated as the derecognition of the original liability and the recognition of a new liability. The difference in the respective carrying amounts is recognised in the statement of profit or loss.
2.8.3 Offsetting of Financial InstrumentsFinancial assets and financial liabilities are offset and the net amount reported in the statement of financial position if, and only if;
116 AffirmativeDipped Products PLC / Annual Report 2016/17
There is a currently enforceable legal right to offset the recognised amounts and
There is an intention to settle on a net basis, or to realise the assets and settle the liabilities simultaneously.
2.8.4 Fair Value of Financial InstrumentsThe fair value of financial instruments that are traded in active markets at each reporting date is determined by reference to quoted market prices or dealer price quotations (bid price for long positions and ask price for short positions), without any deduction for transaction costs.
For financial instruments not traded in an active market, the fair value is determined using appropriate valuation techniques. Such techniques may include:
Using recent arm’s length market transactions.
Reference to the current fair value of another instrument that is substantially the same
A discounted cash flow analysis or other valuation models.
An analysis of fair values of financial instruments and further details as to how they are measured are provided in Note 35.
2.8.5 Derivative Financial InstrumentsInitial Recognition and Subsequent MeasurementThe Group uses derivative financial instruments such as forward currency contracts, to hedge its foreign currency risks. Such derivative financial instruments are initially recognised at fair value on the date on which a derivative contract is entered into and are subsequently remeasured at fair value. Derivatives are carried as financial assets when the fair value is positive and as financial liabilities when the fair value is negative.
Any gains or losses arising from changes in the fair value of derivatives are taken directly to the statement of profit or loss.
2.8.6 Non-current assets held for sale Non-current assets, or disposal groups comprising assets and liabilities, that are expected to be recovered primarily through sale rather than through continuing use, are classified as held for sale. Immediately before classification as held for sale, the assets, or components of a disposal group, are remeasured in accordance with the Group’s accounting policies. Thereafter generally the assets, or disposal group, are measured at the lower of their carrying amount and fair value less cost to sell. Any impairment loss on a disposal group first is allocated to goodwill, and then to remaining assets and liabilities on pro rata basis, except that no loss is allocated to inventories, financial assets, deferred tax assets, employee benefit assets, investment property and biological assets, which continue to be measured in accordance with the Group’s accounting policies. Impairment losses on initial classification as held for sale and subsequent gains or losses on remeasurement are recognised in statement of profit or loss. Gains are not recognised in excess of any cumulative impairment loss.
2.9 InventoriesInventories are measured at the lower of cost and net realisable value, after making due allowance for obsolete and slow moving items.
Costs incurred in bringing each product to its present location and condition are accounted for as follows:
All inventory items, except manufactured inventories and work-in-progress are measured at weighted average directly attributable cost
Manufactured inventories and work-in-progress are measured at weighted-average factory cost which includes all direct expenditure and appropriate shares of production overhead based on normal operating capacity but excluding borrowing costs.
Net realisable value is the estimated selling price in the ordinary course of business, less estimated costs of completion and the estimated costs necessary to make the sale.
2.10 Impairment of Non-Financial AssetsThe Group assesses, at each reporting date, whether there is an indication that an asset may be impaired. If any indication exists, or when annual impairment testing for an asset is required, the Group estimates the asset’s recoverable amount. An asset’s recoverable amount is the higher of an asset’s or CGU’s fair value less costs of disposal and its value in use. The recoverable amount is determined for an individual asset, unless the asset does not generate cash inflows that are largely independent of those from other assets or groups of assets. When the carrying amount of an asset or CGU exceeds its recoverable amount, the asset is considered impaired and is written down to its recoverable amount.
In assessing value in use, the estimated future cash flows are discounted to their present value using a pre-tax discount rate that reflects current market assessments of the time value of money and the risks specific to the asset. In determining fair value less costs of disposal, recent market transactions are taken into account. If no such transactions can be identified, an appropriate valuation model is used. These calculations are corroborated by valuation multiples, quoted share prices for publicly traded companies or other available fair value indicators.
The Group bases its impairment calculation on detailed budgets and forecast calculations, which are prepared separately for each of the Group’s CGUs to which the individual assets are allocated. These budgets and forecast calculations generally cover a period of five years. A long-term growth rate is calculated and applied to project future cash flows after the fifth year.
Notes to the Financial Statements
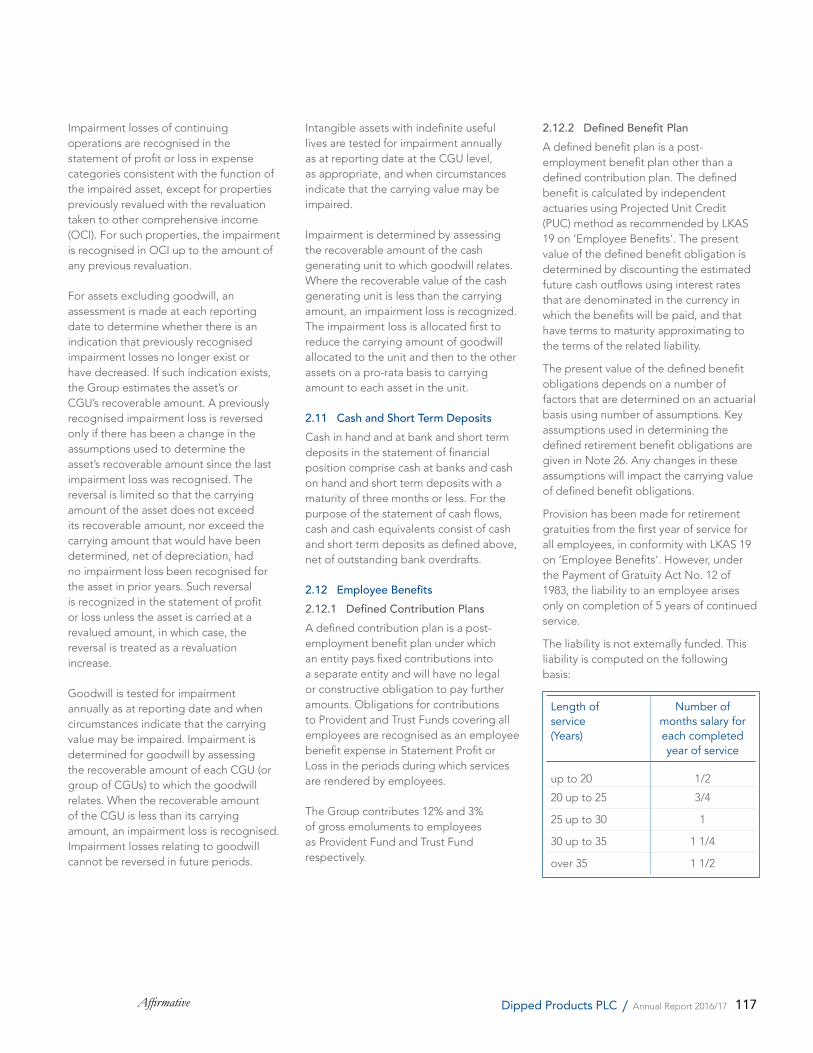
117Affirmative Dipped Products PLC / Annual Report 2016/17
Impairment losses of continuing operations are recognised in the statement of profit or loss in expense categories consistent with the function of the impaired asset, except for properties previously revalued with the revaluation taken to other comprehensive income (OCI). For such properties, the impairment is recognised in OCI up to the amount of any previous revaluation.
For assets excluding goodwill, an assessment is made at each reporting date to determine whether there is an indication that previously recognised impairment losses no longer exist or have decreased. If such indication exists, the Group estimates the asset’s or CGU’s recoverable amount. A previously recognised impairment loss is reversed only if there has been a change in the assumptions used to determine the asset’s recoverable amount since the last impairment loss was recognised. The reversal is limited so that the carrying amount of the asset does not exceed its recoverable amount, nor exceed the carrying amount that would have been determined, net of depreciation, had no impairment loss been recognised for the asset in prior years. Such reversal is recognized in the statement of profit or loss unless the asset is carried at a revalued amount, in which case, the reversal is treated as a revaluation increase.
Goodwill is tested for impairment annually as at reporting date and when circumstances indicate that the carrying value may be impaired. Impairment is determined for goodwill by assessing the recoverable amount of each CGU (or group of CGUs) to which the goodwill relates. When the recoverable amount of the CGU is less than its carrying amount, an impairment loss is recognised. Impairment losses relating to goodwill cannot be reversed in future periods.
Intangible assets with indefinite useful lives are tested for impairment annually as at reporting date at the CGU level, as appropriate, and when circumstances indicate that the carrying value may be impaired.
Impairment is determined by assessing the recoverable amount of the cash generating unit to which goodwill relates. Where the recoverable value of the cash generating unit is less than the carrying amount, an impairment loss is recognized. The impairment loss is allocated first to reduce the carrying amount of goodwill allocated to the unit and then to the other assets on a pro-rata basis to carrying amount to each asset in the unit.
2.11 Cash and Short Term DepositsCash in hand and at bank and short term deposits in the statement of financial position comprise cash at banks and cash on hand and short term deposits with a maturity of three months or less. For the purpose of the statement of cash flows, cash and cash equivalents consist of cash and short term deposits as defined above, net of outstanding bank overdrafts.
2.12 Employee Benefits2.12.1 Defined Contribution PlansA defined contribution plan is a post-employment benefit plan under which an entity pays fixed contributions into a separate entity and will have no legal or constructive obligation to pay further amounts. Obligations for contributions to Provident and Trust Funds covering all employees are recognised as an employee benefit expense in Statement Profit or Loss in the periods during which services are rendered by employees.
The Group contributes 12% and 3% of gross emoluments to employees as Provident Fund and Trust Fund respectively.
2.12.2 Defined Benefit PlanA defined benefit plan is a post-employment benefit plan other than a defined contribution plan. The defined benefit is calculated by independent actuaries using Projected Unit Credit (PUC) method as recommended by LKAS 19 on ‘Employee Benefits’. The present value of the defined benefit obligation is determined by discounting the estimated future cash outflows using interest rates that are denominated in the currency in which the benefits will be paid, and that have terms to maturity approximating to the terms of the related liability.
The present value of the defined benefit obligations depends on a number of factors that are determined on an actuarial basis using number of assumptions. Key assumptions used in determining the defined retirement benefit obligations are given in Note 26. Any changes in these assumptions will impact the carrying value of defined benefit obligations.
Provision has been made for retirement gratuities from the first year of service for all employees, in conformity with LKAS 19 on ‘Employee Benefits’. However, under the Payment of Gratuity Act No. 12 of 1983, the liability to an employee arises only on completion of 5 years of continued service.
The liability is not externally funded. This liability is computed on the following basis:
Length of service (Years)
Number of months salary for each completed year of service
up to 20 1/2
20 up to 25 3/4
25 up to 30 1
30 up to 35 1 1/4
over 35 1 1/2
118 AffirmativeDipped Products PLC / Annual Report 2016/17
2.12.3 Short Term BenefitsShort term employee benefit obligations are measured on an undiscounted basis and are expensed as and when the related service is provided.
2.12.4 Recognition of actuarial gains or lossesActuarial gains or losses are recognised in full In the other Comprehensive Income
2.13 ProvisionsProvisions are recognised when the Group has a present obligation (legal or constructive) as a result of a past event, it is probable that an outflow of resources embodying economic benefits will be required to settle the obligation and a reliable estimate can be made of the amount of the obligation. When the Group expects some or all of a provision to be reimbursed, for example, under an insurance contract, the reimbursement is recognised as a separate asset, but only when the reimbursement is virtually certain. The expense relating to any provision is presented in the statement of profit or loss net of any reimbursement.
If the effect of the time value of money is material, provisions are discounted using a current pre-tax rate that reflects, when appropriate, the risks specific to the liability. When discounting is used, the increase in the provision due to the passage of time is recognised as a finance cost.
2.14 TaxationTax expense comprises current and deferred tax. Current tax and deferred tax are recognised in the statement of profit or loss except to the extent that it relates to a business combination, or items recognised directly in Equity or in Other Comprehensive Income.
Current TaxCurrent income tax assets and liabilities for the current and prior periods are measured at the amount expected to be recovered from or paid to the taxation
authorities. The tax rates and tax laws used to compute the amount are those that are enacted or substantively enacted by the reporting date in the countries where the Group operates and generates taxable income.
Current tax relating to items recognised directly in Other Comprehensive Income is recognised in Other Comprehensive Income and not in the statement of profit or loss. Management periodically evaluates positions taken in the tax returns with respect to situations in which applicable tax regulations are subject to interpretation and establishes provisions where appropriate.
Tax withheld on dividend income from Subsidiaries recognised as an expense in the Consolidated statement of profit or loss at the same time as the liability to pay the related dividend is recognised.
Deferred TaxationDeferred tax is provided using the liability method on temporary differences between the tax bases of assets and liabilities and their carrying amounts for financial reporting purposes at the reporting date.
Deferred tax liabilities are recognised for all taxable temporary differences, except:
When the deferred tax liability arises from the initial recognition of goodwill or an asset or liability in a transaction that is not a business combination and, at the time of the transaction, affects neither the accounting profit nor taxable profit or loss
In respect of taxable temporary differences associated with investments in subsidiaries and equity accounted investees when the timing of the reversal of the temporary differences can be controlled and it is probable that the temporary differences will not reverse in the foreseeable future.
Deferred tax assets are recognised for all deductible temporary differences,
the carry forward of unused tax credits and any unused tax losses. Deferred tax assets are recognised to the extent that it is probable that taxable profit will be available against which the deductible temporary differences, and the carry forward of unused tax credits and unused tax losses can be utilised, except:
When the deferred tax asset relating to the deductible temporary difference arises from the initial recognition of an asset or liability in a transaction that is not a business combination and, at the time of the transaction, affects neither the accounting profit nor taxable profit or loss
In respect of deductible temporary differences associated with investments in subsidiaries, equity accounted investees deferred tax assets are recognised only to the extent that it is probable that the temporary differences will reverse in the foreseeable future and taxable profit will be available against which the temporary differences can be utilised.
The carrying amount of deferred tax assets is reviewed at each reporting date and reduced to the extent that it is no longer probable that sufficient taxable profit will be available to allow all or part of the deferred tax asset to be utilised. Unrecognised deferred tax assets are reassessed at each reporting date and are recognised to the extent that it has become probable that future taxable profits will allow the deferred tax asset to be recovered.
Deferred tax assets and liabilities are measured at the tax rates that are expected to apply in the year when the asset is realised or the liability is settled, based on tax rates that have been enacted or substantively enacted at the reporting date.
Deferred tax relating to items recognised outside the statement of profit or loss is recognised outside the statement of profit
Notes to the Financial Statements
119Affirmative Dipped Products PLC / Annual Report 2016/17
or loss. Deferred tax items are recognized in correlation to the underlying transaction either in other comprehensive income or directly in equity.
Deferred tax assets and deferred tax liabilities are offset, if a legally enforceable right exists to set off current tax assets against current tax liabilities and the deferred taxes relate to the same taxable entity and the same taxation authority.
Tax benefits acquired as part of a business combination, but not satisfying the criteria for separate recognition at that date, would be recognised subsequently if new information about facts and circumstances changed. The adjustment would either be treated as a reduction to goodwill (as long as it does not exceed goodwill) if it was incurred during the measurement period or in the statement of profit or loss.
Tax withheld on dividend income from subsidiaries is recognised as an expense in the consolidated statement of profit or loss at the same time as the liability to pay the related dividend is recognised.
Sales TaxRevenues, expenses and assets are recognised net of the amount of sales tax, except:
When the sales tax incurred on a purchase of assets or services is not recoverable from the taxation authority, in which case, the sales tax is recognised as part of the cost of acquisition of the asset or as part of the expense item, as applicable
Receivables and payables that are stated with the amount of sales tax. The net amount of sales tax recoverable from, or payable to, the taxation authority is included as part of receivables or payables in the Statement of Financial Position.
2.15 Capital Commitments and ContingenciesCapital commitments and contingent liabilities of the Group are disclosed in the respective Notes 31 & 32 to the Financial Statements.
2.16 Ordinary SharesOrdinary shares are classified as equity. Incremental costs directly attributable to the Issue of ordinary shares are recognised as a deduction from equity,net of any tax effects.
2.17 Statements of Profit or LossFor the purpose of presentation of the statement of profit or loss, the function of expenses method is adopted.
2.17.1 Revenue Revenue is recognised to the extent that it is probable that the economic benefits will flow to the Group and the revenue can be reliably measured, regardless of when the payment is received. Revenue is measured at the fair value of the consideration received or receivable, taking into account contractually defined terms of payment and excluding taxes or duties. The Group has concluded that it is the principal in all of its revenue arrangements since it is the primary obligation in all the revenue arrangements, has pricing latitude, and is also exposed to inventory and credit risks.
The specific recognition criteria described below must also be met before revenue is recognised.
Sale of goodsRevenue from sale of goods is measured at the fair value of the consideration received or receivable, net of returns and allowances, trade discounts and taxes. Revenue from the sale of goods is recognised when the significant risks and rewards of ownership of the goods have passed to the buyer, recovery of the consideration is probable, the associated costs and possible return of goods can be estimated reliably, there is no continuing management involvement with the goods, and the amount of revenue can be measured reliably.
Rendering of servicesRevenue from services rendered is recognised in profit and loss in proportion to the stage of completion of the transaction at the reporting date.
Rental incomeRental income is recognised in profit and loss as it accrues
Dividend incomeDividend income is recognised in profit and loss on the date the entity’s right to receive payment is established, which in the case of quoted securities is the ex-dividend date.
Gain and lossesGains on disposal of an item of Property, Plant and Equipment are determined by comparing the net sales proceeds with the carrying amounts of Property, Plant and Equipment and are recognised net within ‘other operating income’ in statement of profit or loss.
GrantsGrants are recognised initially as a deferred income when there is a reasonable assurance that they will be received and that the Group will comply with the conditions associated with the grant. Grants that compensate the Group for expenses incurred are recognised in statement of profit or loss on a systematic basis in the periods in which the expenses are recognised. Grants that compensate the Group for the cost of an asset are recognised in statement of profit or loss on a systematic basis over the useful life of the asset.
Other incomeOther income is recognised on an accrual basis.
2.17.2 ExpensesExpenses are recognized in the statement of profit or loss on the basis of a direct association between the cost incurred and the earnings of specific items of income. All expenditure incurred in the running of the business has been charged to income in arriving at the profit for the year.

120 AffirmativeDipped Products PLC / Annual Report 2016/17
Repairs and renewals are charged to statement of profit or loss in the year in which the expenditure is incurred.
Operating LeasesPayments made under operating leases are recognised in statement of profit or loss on a straight-line basis over the term of the lease.
Borrowing CostsBorrowing costs are recognised as an expense in the period in which they are incurred, except to the extent that they are directly attributable to the acquisition, construction or production of a qualifying asset, in which case they are capitalised as part of the cost of that asset.
Finance Income and Finance CostsFinance income comprises interest income on funds invested (including available-for-sale financial assets) and gains on the disposal of available-for-sale financial assets. Interest income is recognised as it accrues in Statements of Profit or Loss.
Finance costs comprise interest expense on borrowings, unwinding of the discount on provisions, changes in the fair value of financial assets at fair value through profit or loss, and losses on hedging instruments that are recognised in the statement of profit or loss.
The interest expense component of finance lease payments is allocated to each period during the lease term so as to produce a constant periodic rate of interest on the remaining balance of the liability.
Foreign currency gains and losses are reported on a net basis.
2.18 Cash Flow StatementThe Cash Flow Statement has been prepared using the ‘indirect method’.
Interest paid is classified as an operating cash flow. Grants received, which are related to purchase and construction of Property, Plant and Equipment are classified as investing cash flows. Dividend
and interest income are classified as cash flows from investing activities.
2.19 Segment ReportingAn operating segment is a component of the Group that engages in business activities from which it may earn revenues and incur expenses, including revenues and expenses that relate to transactions with any of the Group’s other components. All operating segments’ operating results are reviewed regularly by the Chairman to make decisions about resources to be allocated to the segment and assess its performance and for which discrete financial information is available.
Segment results that are reported to the Chairman include items directly attributable to a segment as well as those that can be allocated on a reasonable basis.
Segment capital expenditure is the total cost incurred during the period to acquire Property, Plant and Equipment and intangible assets other than goodwill.
2.20 Events After the Reporting PeriodAll material events after the reporting period have been considered and where appropriate adjustments or disclosures have been made in the respective Notes to the Financial Statements.
2.21 Earnings Per ShareThe Group presents basic and diluted Earnings Per Share (EPS) for its ordinary shares. Basic EPS is calculated by dividing the profit attributable to ordinary shareholders of the Company by the weighted-average number of ordinary shares outstanding during the period. Diluted EPS is determined by adjusting the profit or loss attributable to ordinary shareholders and the weighted average number of ordinary shares outstanding for the effects of all dilutive potential ordinary shares
2.22 PlantationsThe plantation companies in the Group adopt certain accounting policies, which differ from that of the Group, since
their nature of operations is significantly different from that of the rest of the Group.
Those accounting policies that significantly vary from the rest of the Group are given below.
2.22.1 Property, Plant and EquipmentLand Development CostsPermanent land development costs are those costs incurred in making major infrastructure development and building new access roads on leasehold land. The costs have been capitalised and amortised over the remaining lease periods.
Permanent impairments to land development costs are charged to the statement of profit or loss in full or reduced to the net carrying amounts of such assets in the year of occurrence after ascertaining the loss.
2.22.2 Biological Assets Biological assets are classified as either mature biological assets or immature biological assets. Mature biological assets are those that have attained harvestable specifications or are able to sustain regular harvests. Immature biological assets are those that have not yet attained harvestable specifications. Tea, rubber, other plantations and nurseries are classified as biological assets.
Biological assets are further classified as bearer biological assets and consumable biological assets. Bearer biological asset includes tea and rubber trees, those that are not intended to be sold or harvested, however used to grow for harvesting agricultural produce from such biological assets. Consumable biological assets includes managed timber trees those that are to be harvested as agricultural produce or sold as biological assets.
2.22.2.1 Bearer Biological Asset
The bearer biological assets are measured at cost less accumulated depreciation and accumulated impairment losses, if any, in terms of LKAS 16 – Property Plant & Equipment.
Notes to the Financial Statements

121Affirmative Dipped Products PLC / Annual Report 2016/17
The cost of land preparation, rehabilitation, new planting, replanting, crop diversification, inter planting and fertilising, etc., incurred between the time of planting and harvesting (when the planted area attains maturity), are classified as immature plantations. These immature plantations are shown at direct costs plus attributable overheads. The expenditure incurred on bearer biological assets (Tea, Rubber) which comes into bearing during the year, is transferred to mature plantations.
2.22.2.2 Infilling Cost on Bearer Biological Assets
The land development costs incurred in the form of infilling have been capitalised to the relevant mature field, only where the number of plants per hectare exceeded 3,000 plants and, also if it increases the expected future benefits from that field, beyond its pre-infilling performance assessment. Infilling costs so capitalised are depreciated over the newly assessed remaining useful economic life of the relevant mature plantation, or the unexpired lease period, whichever is lower.
Infilling costs that are not capitalised have been charged to the statement of profit or loss in the year in which they are incurred.
2.22.2.3 Consumable Biological Assets
Consumable biological assets includes managed timber trees those that are to be harvested as agricultural produce or sold as biological assets. Expenditure incurred on consumable biological assets (managed timber trees) is measured on initial recognition and at the end of each reporting period at its fair value less cost to sell in terms of LKAS 41. The cost is treated as approximation to fair value of young plants as the impact on biological transformation of such plants to price during this period is immaterial. The fair value of timber trees are measured using Discounted cash flow (DCF) method taking
into consideration the current market prices of timber, applied to expected timber content of a tree at the maturity by an independent professional valuer. All other assumptions and sensitivity analysis are given in Note 15.
The main variables in DCF model concerns;
Variable Comment
Timber content
Estimate based on physical verification of girth, height and considering the growth of the each spices in different geographical regions. Factor all the prevailing statutory regulations enforced against harvesting of timber coupled with forestry plan of the Company.
Economic useful life
Estimate based on the normal life span of each spices by factoring the forestry plan of the Company.
Selling price Estimated based on prevailing Sri Lankan market price. Factor all the conditions to be fulfil in bringing the trees in to saleable condition.
Planting cost Estimated costs for the further development of immature areas are deducted.
The gain or loss arising on initial recognition of biological assets at fair value less cost to sell and from a change in fair value less cost to sell of consumable biological assets are included in statement of profit or loss for the period in which it arises.
Permanent impairments to Biological Asset are charged to the statement of profit or loss in full and reduced to the net carrying amounts of such asset in the year of occurrence after ascertaining the loss.
2.22.2.4 Nursery Plants
Nursery cost includes the cost of direct materials, direct labour and an appropriate proportion of directly attributable overheads, less provision for overgrown plants.
2.22.3 DepreciationDepreciation is recognised in statement of profit or loss on a straight-line basis over the estimated useful economic lives of each part of an item of Property, Plant & Equipment, since this most closely reflects the expected pattern of consumption of the future economic benefits embodied in the asset.
The estimated useful lives for the current and comparative periods are as follows:
Description Years
Buildings 40
Roads 40
Plant & Machinery - Effluent Treatment Plant
10
Electronic Machinery 10
Hydropower Plant 30
Motor Vehicles - Utility 10
Motor Vehicles - Supervisory
5
Equipment 4
Furniture & Fittings 10
Mature Plantations (Replanting and New Planting)
Description Years
Mature Plantations - Tea 33 1/3
Mature Plantations - Rubber 20
No depreciation is provided for immature plantations.

122 AffirmativeDipped Products PLC / Annual Report 2016/17
2.22.4 Amortisation of leased AssetsThe leasehold rights of assets taken over from Janatha Estates Development Board/ Sri Lanka State Plantations Corporation (JEDB/SLSPC) are amortised in equal amounts over the shorter of the remaining lease periods and the useful lives as follows:
Description Years
Right to use Land 53
Improvements to Land 30
Mature Plantations (Tea and Rubber) 30
Buildings 25
Machinery 20
2.22.5 Borrowing CostsBorrowing costs that are directly attributable to acquisition, construction or production of a qualifying asset, which takes a substantial period of time to get ready for its intended use or sale are capitalised as a part of the asset. Borrowing costs that are not capitalised are recognised as expenses in the period in which they are incurred and charged to the Statement of Profit or Loss.
The amounts of the borrowing costs which are eligible for capitalisation are determined in accordance with the in LKAS 23 - Borrowing Costs’.Borrowing costs incurred in respect of specific loans that are utilised for field development activities have been capitalised as a part of the cost of the relevant immature plantation. The capitalisation will cease when the crops are ready for commercial harvest.
The amount so capitalised and the capitalisation rates are disclosed in Notes to the Financial Statements.
2.22.6 InventoriesFinished Good Manufactured from Agricultural Produce of Biological Assets
These are valued at the lower of cost and estimated net realisable. Net realisable value is the estimated selling price at which stocks can be sold in the ordinary course of business after allowing for cost of realisation and/or cost of conversion from their existing state to saleable condition.
Input Material, Spares and ConsumablesAt actual cost on weighted average basis.
Agricultural Produce Harvested from Biological AssetsAgricultural produce harvested from its biological assets are measured at their fair value less cost to sell at the point of harvest. The finished and semi-finished inventories from agriculture produce are valued by adding the cost of conversion to the fair value of the agricultural produce.
2.22.7 Grants and SubsidiesGrants and subsidies are recognised at their fair value where there is a reasonable assurance the grant / subsidy will be received and all attaching conditions, if any, will be complied with. When the grant or subsidy relates to an income item is recognised as income over the periods necessary to match them to the costs to which it is intended to compensate on a systematic basis.
Grants and subsidies related to assets, including non- monetary grants at fair value are deducted at arriving at the carrying value of the asset (or are deferred in the Statement Financial Position and credited to the Statement of Profit or Loss over the useful life of the asset).
Grants received for forestry are initially deferred and credited to statement of profit or loss once when the related blocks of trees are harvested.
2.23 Changes in accounting policies and disclosures2.23.1 Change in subsequent measurement policy for investment propertiesThe Group re-assessed its accounting for investment property with respect to measurement after initial recognition. The Group had previously measured all investment property using the cost model whereby, after initial recognition of the asset classified as investment property, the asset was carried at cost less accumulated depreciation and accumulated impairment losses.
On March 31, 2017 the Group decided to change the method of accounting for investment property, as the Group believes that the fair value model provides more relevant information to the users of its financial statements and is more aligned to practices adopted by its competitors. In addition, available valuation techniques provide reliable estimates of the investment property’s fair value. The Group applied the revaluation model retrospectively.
After initial recognition, investment property is measured at its fair value at the end of the reporting period and a gain or loss arising from changes in the fair value in the reporting period is recognized in profit or loss for that period and disclosed in Note 14 to the Financial Statements.
2.23.2 New and amended standards and interpretationsAgriculture: Bearer Plants (Amendments to LKAS 16 and LKAS 41) Produce on bearer biological assets
LKAS 41 requires the produce on bearer plant prior to harvest to be measured at fair value less costs to sell. The Group previously presumed any agricultural produce prior to harvest (produce on) as bearer biological asset and measured at cost less accumulated depreciation and accumulated impairment losses, if any.
Notes to the Financial Statements
123Affirmative Dipped Products PLC / Annual Report 2016/17
After initial recognition, changes in the fair value of such agricultural produce recognised in profit or loss at the end of each reporting period.
The Group applied this amendment retrospectively and disclosed in Note 20.1 to the Financial Statements.
2.24 Standards Issued But Not Yet EffectiveThe standards and interpretations that are issued, but not yet effective, up to the date of issuance of the Group’s financial statements are disclosed below. The Group intends to adopt these standards, if applicable, when they become effective.
SLFRS 9 Financial Instruments
SLFRS 9 brings together all three aspects of the accounting for financial instruments project: classification and measurement, impairment and hedge accounting. SLFRS 9 is effective for annual periods beginning on or after January 1, 2018, with early application permitted. Except for hedge accounting, retrospective application is required but providing comparative information is not compulsory.
The Group plans to adopt the new standard on the required effective date. During the year, the Group has performed a high-level impact assessment of all three aspects of SLFRS 9. This preliminary assessment is based on currently available information and may be subject to changes arising from further detailed analyses or additional reasonable and supportable information being made available to the Group in the future. Overall, the Group expects no significant impact on its statement of financial position and equity except for the effect of applying the impairment requirements of SLFRS 9. The Group expects a higher loss allowance resulting in a negative impact on equity and will perform a detailed assessment in the future to determine the extent.
(a) Classification and measurement The Group does not expect a
significant impact on its statement of financial position or equity on applying
the classification and measurement requirements of SLFRS 9. It expects to continue measuring at fair value all financial assets currently held at fair value. Quoted equity shares currently held as available-for-sale with gains and losses recorded in OCI will be measured at fair value through profit or loss instead. The group holds an insignificant amount of available for sale financial assets and accordingly, the gain/(loss) being recorded in the statement of profit or loss is unlikely to cause significant volatility of the results presented by the group. The AFS reserve currently presented as accumulated OCI will be reclassified to opening retained earnings.
Loans as well as trade receivables are held to collect contractual cash flows and are expected to give rise to cash flows representing solely payments of principal and interest. Thus, the Group expects that these will continue to be measured at amortised cost under SLFRS 9. However, the Group will analyse the contractual cash flow characteristics of those instruments in more detail before concluding whether all those instruments meet the criteria for amortised cost measurement under SLFRS 9.
(b) Impairment SLFRS 9 requires the Group to record
expected credit losses on all of its debt securities, loans and trade receivables, either on a 12-month or lifetime basis. The Group expects to apply the simplified approach and record lifetime expected losses on all trade receivables. The Group expects a detrimental impact on its equity due to unsecured nature of its loans and receivables, but will need to perform a more detailed analysis which considers all reasonable and supportable information, including forward-looking elements to determine the extent of the impact.
(c) Hedge accounting The Group does not have hedge
relationships that are currently designated as effective hedging relationships. Accordingly, the Group does not expect a significant impact as a result of applying SLFRS 9.
SLFRS 15 Revenue from Contracts with Customers
SLFRS 15 establishes a five-step model to account for revenue arising from contracts with customers. Under SLFRS 15, revenue is recognised at an amount that reflects the consideration to which an entity expects to be entitled in exchange for transferring goods or services to a customer. The new revenue standard will supersede all current revenue recognition requirements under SLFRS. Either a full retrospective application or a modified retrospective application is required for annual periods beginning on or after January 1, 2018. Early adoption is permitted. The Group plans to adopt the new standard on the required effective date using the full retrospective method. During the year, the Group performed a preliminary assessment of SLFRS 15, which is subject to changes arising from a more detailed ongoing analysis.
The Group primary businesses include;
Hand protection sector which manufactures and exports gloves
Plantation sector which is in the business of cultivation tea and rubber
Contracts with customers within the group where the sale of goods is generally expected to be the only performance obligation are not expected to have any impact on the Group’s profit or loss. The Group expects the revenue recognition to occur at a point in time when control of the asset is transferred to the customer, generally on delivery of the goods.
In preparing to SLFRS 15, the Group has reviewed its existing contracts for inclusions of variable considerations, loyalty points or warranty obligations and no such arrangements have been noted.

124 AffirmativeDipped Products PLC / Annual Report 2016/17
Presentation and disclosure requirementsSLFRS 15 provides presentation and disclosure requirements, which are more detailed than under current SLFRS. The presentation requirements represent a significant change from current practice and significantly increases the volume of disclosures required in Group’s financial statements. Many of the disclosure requirements in SLFRS 15 are completely new.
LKAS 7 Disclosure Initiative – Amendments to LKAS 7
The amendments to LKAS 7 Statement of Cash Flows require an entity to provide disclosures that enable users of financial statements to evaluate changes in liabilities arising from financing activities, including both changes arising from cash flows and non-cash changes. On initial application of the amendment, entities are not required to provide comparative information for preceding periods. These amendments are effective for annual periods beginning on or after January 1, 2017, with early application permitted. Application of amendments will result in additional disclosure provided by the Group.
LKAS 12 Recognition of Deferred Tax Assets for Unrealised Losses – Amendments to LKAS 12
The amendments clarify that an entity needs to consider whether tax law restricts the sources of taxable profits against which it may make deductions on the reversal of that deductible temporary difference. Furthermore, the amendments provide guidance on how an entity should determine future taxable profits and explain the circumstances in which taxable profit may include the recovery of some assets for more than their carrying amount.
Entities are required to apply the amendments retrospectively. However, on initial application of the amendments, the change in the opening equity of the earliest comparative period may be recognised in opening retained earnings
(or in another component of equity, as appropriate), without allocating the change between opening retained earnings and other components of equity. Entities applying this relief must disclose that fact.
If an entity applies the amendments for an earlier period, it must disclose that fact. These amendments are not expected to have any impact on the Group.
SLFRS 16 Leases
SLFRS 16 sets out the principles for the recognition, measurement, presentation and disclosure of leases and requires lessees to account for all leases under a single on-balance sheet model similar to the accounting for finance leases under LKAS 17. The standard includes two recognition exemptions for lessees – leases of ’low-value’ assets (e.g., personal computers) and short-term leases (i.e., leases with a lease term of 12 months or less). At the commencement date of a lease, a lessee will recognise a liability to make lease payments (i.e., the lease liability) and an asset representing the right to use the underlying asset during the lease term (i.e., the right-of-use asset). Lessees will be required to separately recognise the interest expense on the lease liability and the depreciation expense on the right-of-use asset.
Lessees will be also required to remeasure the lease liability upon the occurrence of certain events (e.g., a change in the lease term, a change in future lease payments resulting from a change in an index or rate used to determine those payments). The lessee will generally recognise the amount of the remeasurement of the lease liability as an adjustment to the right-of-use asset. Lessor accounting under SLFRS 16 is substantially unchanged from today’s accounting under LKAS 17. Lessors will continue to classify all leases using the same classification principle as in LKAS 17 and distinguish between two types of leases: operating and finance leases.
SLFRS 16 also requires lessees and lessors to make more extensive disclosures than under LKAS 17. SLFRS 16 is effective for annual periods beginning on or after January 1, 2019. Early application is permitted, but not before an entity applies SLFRS 15. A lessee can choose to apply the standard using either a full retrospective or a modified retrospective approach. The standard’s transition provisions permit certain reliefs.
Notes to the Financial Statements
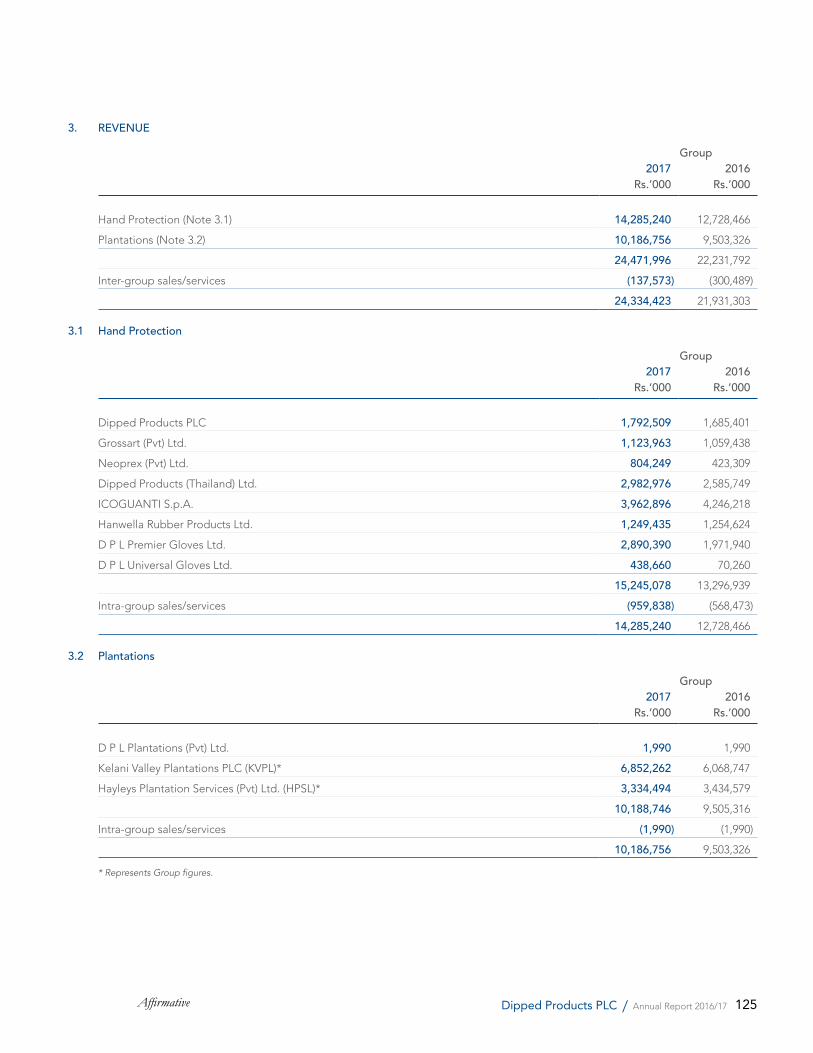
125Affirmative Dipped Products PLC / Annual Report 2016/17
3. REVENUE
Group2017 2016
Rs.’000 Rs.’000
Hand Protection (Note 3.1) 14,285,240 12,728,466
Plantations (Note 3.2) 10,186,756 9,503,326
24,471,996 22,231,792
Inter-group sales/services (137,573) (300,489)
24,334,423 21,931,303
3.1 Hand Protection
Group2017 2016
Rs.’000 Rs.’000
Dipped Products PLC 1,792,509 1,685,401
Grossart (Pvt) Ltd. 1,123,963 1,059,438
Neoprex (Pvt) Ltd. 804,249 423,309
Dipped Products (Thailand) Ltd. 2,982,976 2,585,749
ICOGUANTI S.p.A. 3,962,896 4,246,218
Hanwella Rubber Products Ltd. 1,249,435 1,254,624
D P L Premier Gloves Ltd. 2,890,390 1,971,940
D P L Universal Gloves Ltd. 438,660 70,260
15,245,078 13,296,939
Intra-group sales/services (959,838) (568,473)
14,285,240 12,728,466
3.2 Plantations
Group2017 2016
Rs.’000 Rs.’000
D P L Plantations (Pvt) Ltd. 1,990 1,990
Kelani Valley Plantations PLC (KVPL)* 6,852,262 6,068,747
Hayleys Plantation Services (Pvt) Ltd. (HPSL)* 3,334,494 3,434,579
10,188,746 9,505,316
Intra-group sales/services (1,990) (1,990)
10,186,756 9,503,326
* Represents Group figures.
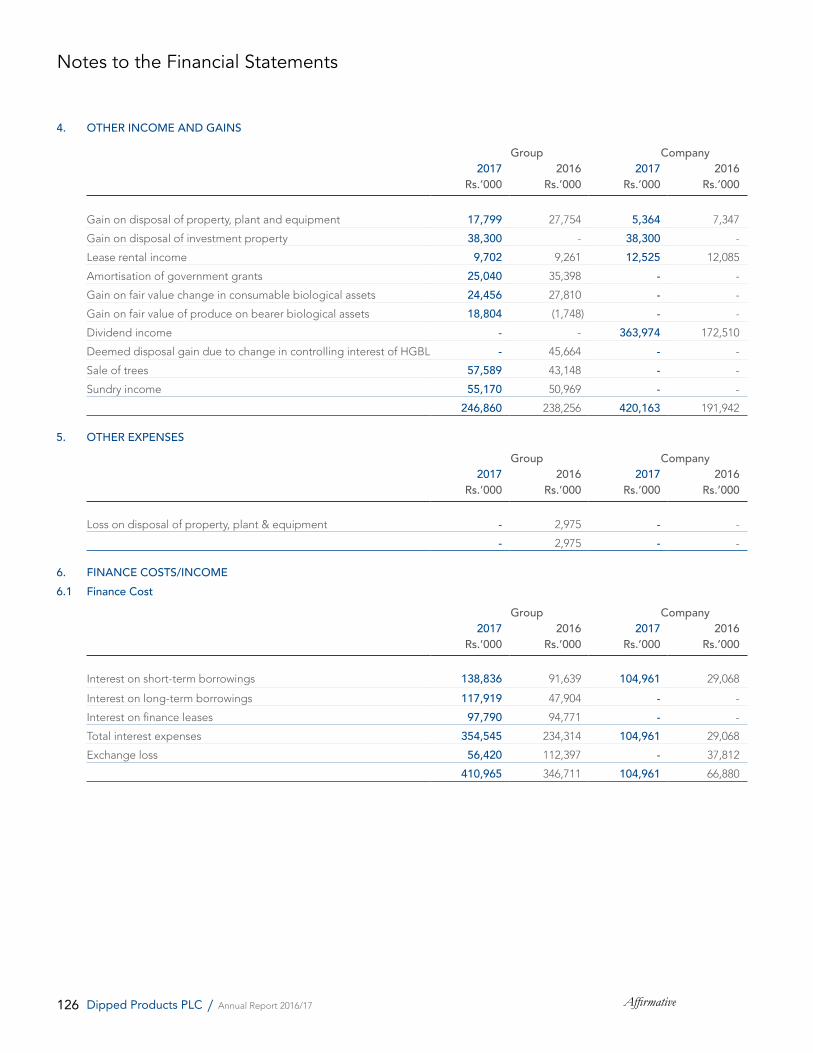
126 AffirmativeDipped Products PLC / Annual Report 2016/17
4. OTHER INCOME AND GAINS
Group Company2017 2016 2017 2016
Rs.’000 Rs.’000 Rs.’000 Rs.’000
Gain on disposal of property, plant and equipment 17,799 27,754 5,364 7,347
Gain on disposal of investment property 38,300 - 38,300 -
Lease rental income 9,702 9,261 12,525 12,085
Amortisation of government grants 25,040 35,398 - -
Gain on fair value change in consumable biological assets 24,456 27,810 - -
Gain on fair value of produce on bearer biological assets 18,804 (1,748) - -
Dividend income - - 363,974 172,510
Deemed disposal gain due to change in controlling interest of HGBL - 45,664 - -
Sale of trees 57,589 43,148 - -
Sundry income 55,170 50,969 - -
246,860 238,256 420,163 191,942
5. OTHER EXPENSES Group Company2017 2016 2017 2016
Rs.’000 Rs.’000 Rs.’000 Rs.’000
Loss on disposal of property, plant & equipment - 2,975 - -
- 2,975 - -
6. FINANCE COSTS/INCOME6.1 Finance Cost
Group Company2017 2016 2017 2016
Rs.’000 Rs.’000 Rs.’000 Rs.’000
Interest on short-term borrowings 138,836 91,639 104,961 29,068
Interest on long-term borrowings 117,919 47,904 - -
Interest on finance leases 97,790 94,771 - -
Total interest expenses 354,545 234,314 104,961 29,068
Exchange loss 56,420 112,397 - 37,812
410,965 346,711 104,961 66,880
Notes to the Financial Statements
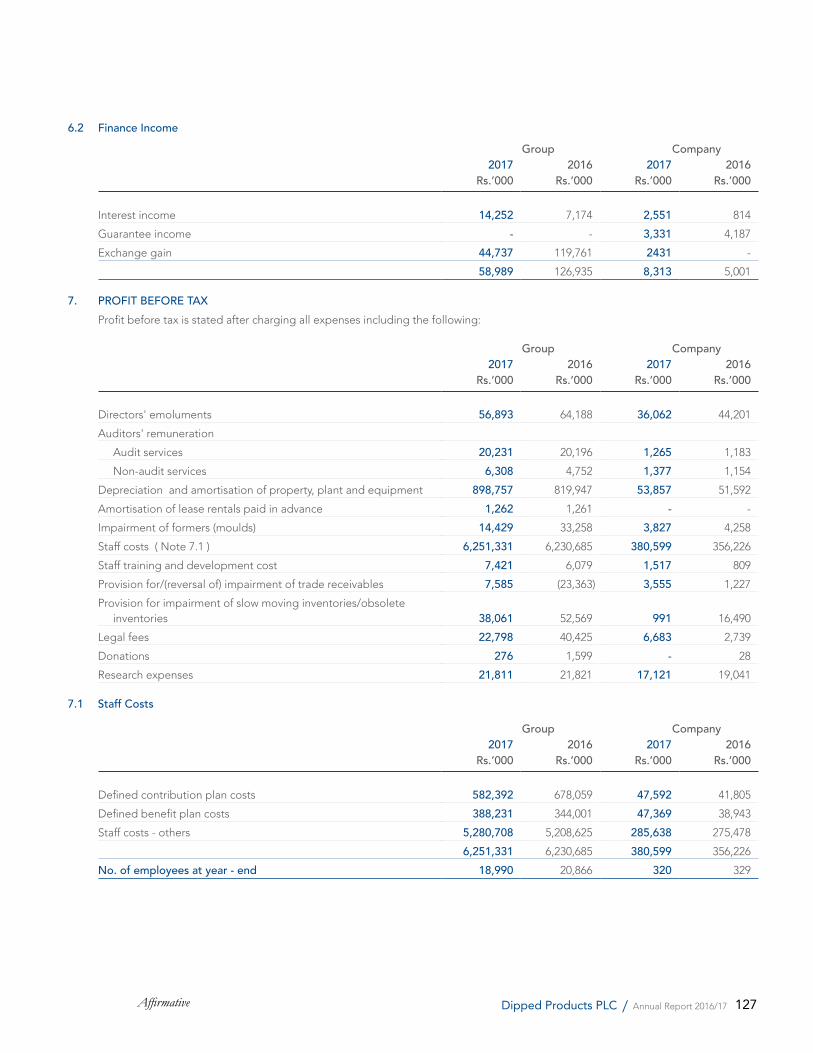
127Affirmative Dipped Products PLC / Annual Report 2016/17
6.2 Finance Income Group Company2017 2016 2017 2016
Rs.’000 Rs.’000 Rs.’000 Rs.’000
Interest income 14,252 7,174 2,551 814
Guarantee income - - 3,331 4,187
Exchange gain 44,737 119,761 2431 -
58,989 126,935 8,313 5,001
7. PROFIT BEFORE TAX Profit before tax is stated after charging all expenses including the following:
Group Company2017 2016 2017 2016
Rs.’000 Rs.’000 Rs.’000 Rs.’000
Directors' emoluments 56,893 64,188 36,062 44,201
Auditors' remuneration
Audit services 20,231 20,196 1,265 1,183
Non-audit services 6,308 4,752 1,377 1,154
Depreciation and amortisation of property, plant and equipment 898,757 819,947 53,857 51,592
Amortisation of lease rentals paid in advance 1,262 1,261 - -
Impairment of formers (moulds) 14,429 33,258 3,827 4,258
Staff costs ( Note 7.1 ) 6,251,331 6,230,685 380,599 356,226
Staff training and development cost 7,421 6,079 1,517 809
Provision for/(reversal of) impairment of trade receivables 7,585 (23,363) 3,555 1,227
Provision for impairment of slow moving inventories/obsolete inventories 38,061 52,569 991 16,490
Legal fees 22,798 40,425 6,683 2,739
Donations 276 1,599 - 28
Research expenses 21,811 21,821 17,121 19,041
7.1 Staff Costs
Group Company2017 2016 2017 2016
Rs.’000 Rs.’000 Rs.’000 Rs.’000
Defined contribution plan costs 582,392 678,059 47,592 41,805
Defined benefit plan costs 388,231 344,001 47,369 38,943
Staff costs - others 5,280,708 5,208,625 285,638 275,478
6,251,331 6,230,685 380,599 356,226
No. of employees at year - end 18,990 20,866 320 329
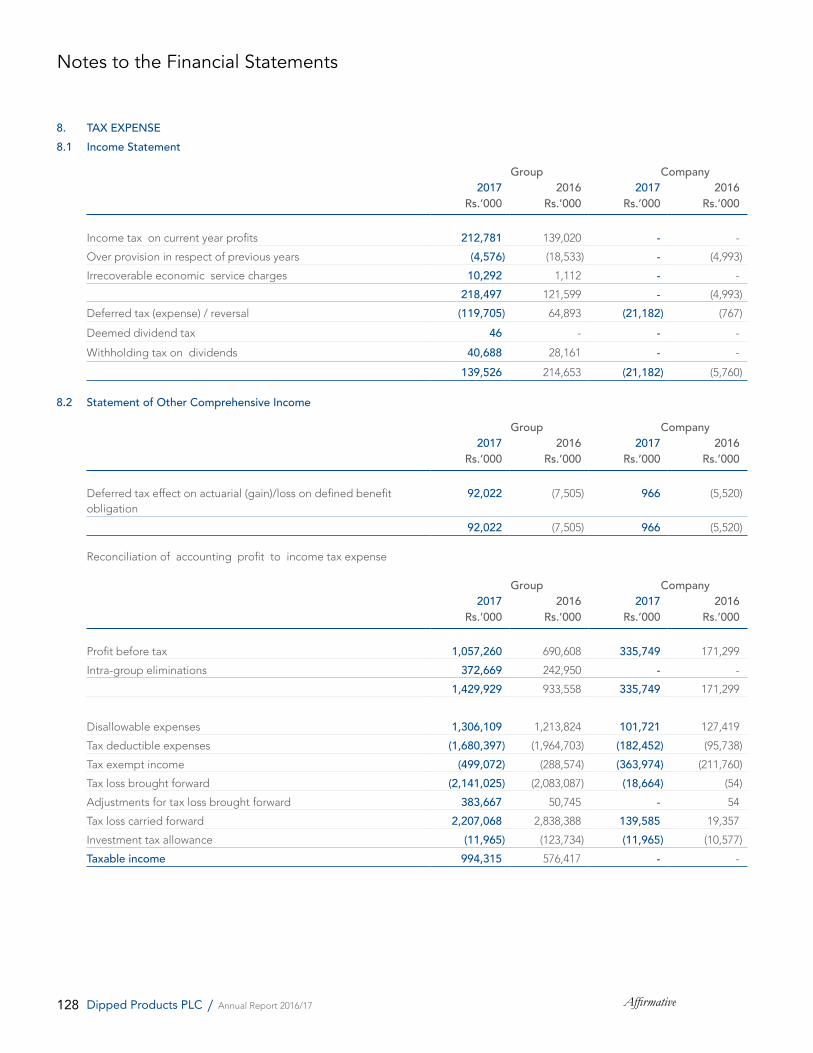
128 AffirmativeDipped Products PLC / Annual Report 2016/17
8. TAX EXPENSE8.1 Income Statement
Group Company2017 2016 2017 2016
Rs.’000 Rs.’000 Rs.’000 Rs.’000
Income tax on current year profits 212,781 139,020 - -
Over provision in respect of previous years (4,576) (18,533) - (4,993)
Irrecoverable economic service charges 10,292 1,112 - -
218,497 121,599 - (4,993)
Deferred tax (expense) / reversal (119,705) 64,893 (21,182) (767)
Deemed dividend tax 46 - - -
Withholding tax on dividends 40,688 28,161 - -
139,526 214,653 (21,182) (5,760)
8.2 Statement of Other Comprehensive Income
Group Company2017 2016 2017 2016
Rs.’000 Rs.’000 Rs.’000 Rs.’000
Deferred tax effect on actuarial (gain)/loss on defined benefit obligation
92,022 (7,505) 966 (5,520)
92,022 (7,505) 966 (5,520)
Reconciliation of accounting profit to income tax expense
Group Company2017 2016 2017 2016
Rs.’000 Rs.’000 Rs.’000 Rs.’000
Profit before tax 1,057,260 690,608 335,749 171,299
Intra-group eliminations 372,669 242,950 - -
1,429,929 933,558 335,749 171,299
Disallowable expenses 1,306,109 1,213,824 101,721 127,419
Tax deductible expenses (1,680,397) (1,964,703) (182,452) (95,738)
Tax exempt income (499,072) (288,574) (363,974) (211,760)
Tax loss brought forward (2,141,025) (2,083,087) (18,664) (54)
Adjustments for tax loss brought forward 383,667 50,745 - 54
Tax loss carried forward 2,207,068 2,838,388 139,585 19,357
Investment tax allowance (11,965) (123,734) (11,965) (10,577)
Taxable income 994,315 576,417 - -
Notes to the Financial Statements
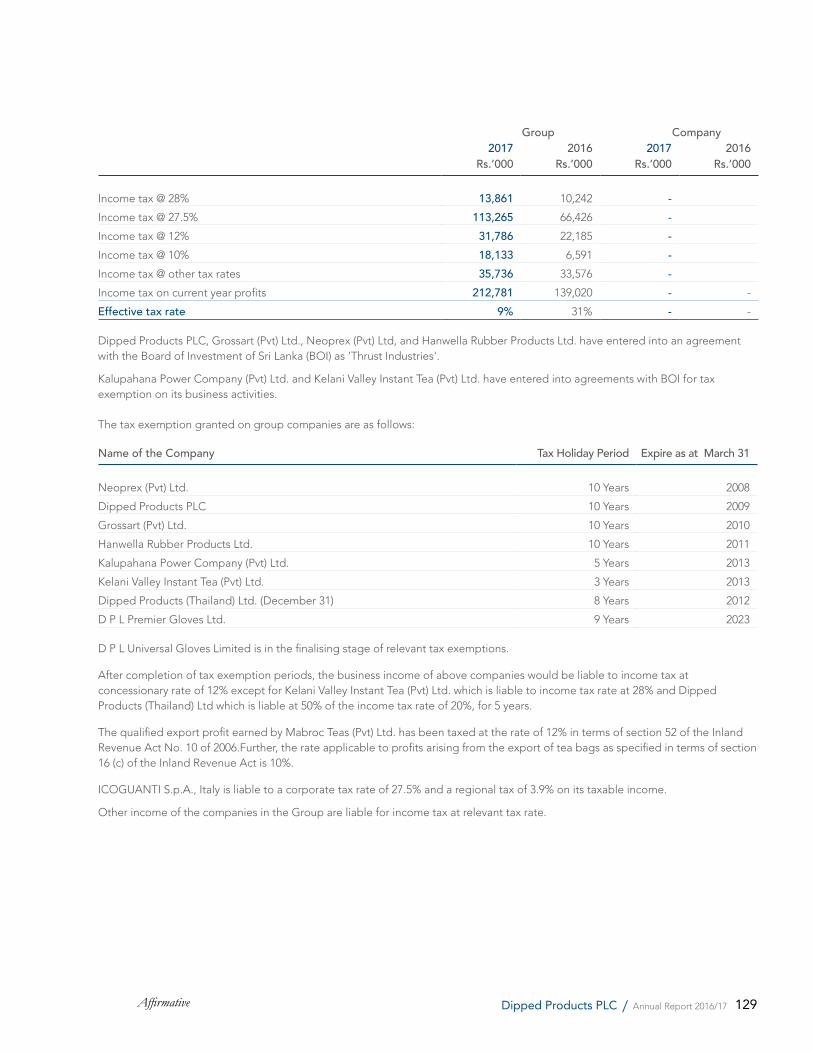
129Affirmative Dipped Products PLC / Annual Report 2016/17
Group Company2017 2016 2017 2016
Rs.’000 Rs.’000 Rs.’000 Rs.’000
Income tax @ 28% 13,861 10,242 - Income tax @ 27.5% 113,265 66,426 - Income tax @ 12% 31,786 22,185 - Income tax @ 10% 18,133 6,591 - Income tax @ other tax rates 35,736 33,576 - Income tax on current year profits 212,781 139,020 - -
Effective tax rate 9% 31% - -
Dipped Products PLC, Grossart (Pvt) Ltd., Neoprex (Pvt) Ltd, and Hanwella Rubber Products Ltd. have entered into an agreement with the Board of Investment of Sri Lanka (BOI) as ‘Thrust Industries'.
Kalupahana Power Company (Pvt) Ltd. and Kelani Valley Instant Tea (Pvt) Ltd. have entered into agreements with BOI for tax exemption on its business activities.
The tax exemption granted on group companies are as follows:
Name of the Company Tax Holiday Period Expire as at March 31
Neoprex (Pvt) Ltd. 10 Years 2008
Dipped Products PLC 10 Years 2009
Grossart (Pvt) Ltd. 10 Years 2010
Hanwella Rubber Products Ltd. 10 Years 2011
Kalupahana Power Company (Pvt) Ltd. 5 Years 2013
Kelani Valley Instant Tea (Pvt) Ltd. 3 Years 2013
Dipped Products (Thailand) Ltd. (December 31) 8 Years 2012
D P L Premier Gloves Ltd. 9 Years 2023
D P L Universal Gloves Limited is in the finalising stage of relevant tax exemptions.
After completion of tax exemption periods, the business income of above companies would be liable to income tax at concessionary rate of 12% except for Kelani Valley Instant Tea (Pvt) Ltd. which is liable to income tax rate at 28% and Dipped Products (Thailand) Ltd which is liable at 50% of the income tax rate of 20%, for 5 years.
The qualified export profit earned by Mabroc Teas (Pvt) Ltd. has been taxed at the rate of 12% in terms of section 52 of the Inland Revenue Act No. 10 of 2006.Further, the rate applicable to profits arising from the export of tea bags as specified in terms of section 16 (c) of the Inland Revenue Act is 10%.
ICOGUANTI S.p.A., Italy is liable to a corporate tax rate of 27.5% and a regional tax of 3.9% on its taxable income.
Other income of the companies in the Group are liable for income tax at relevant tax rate.
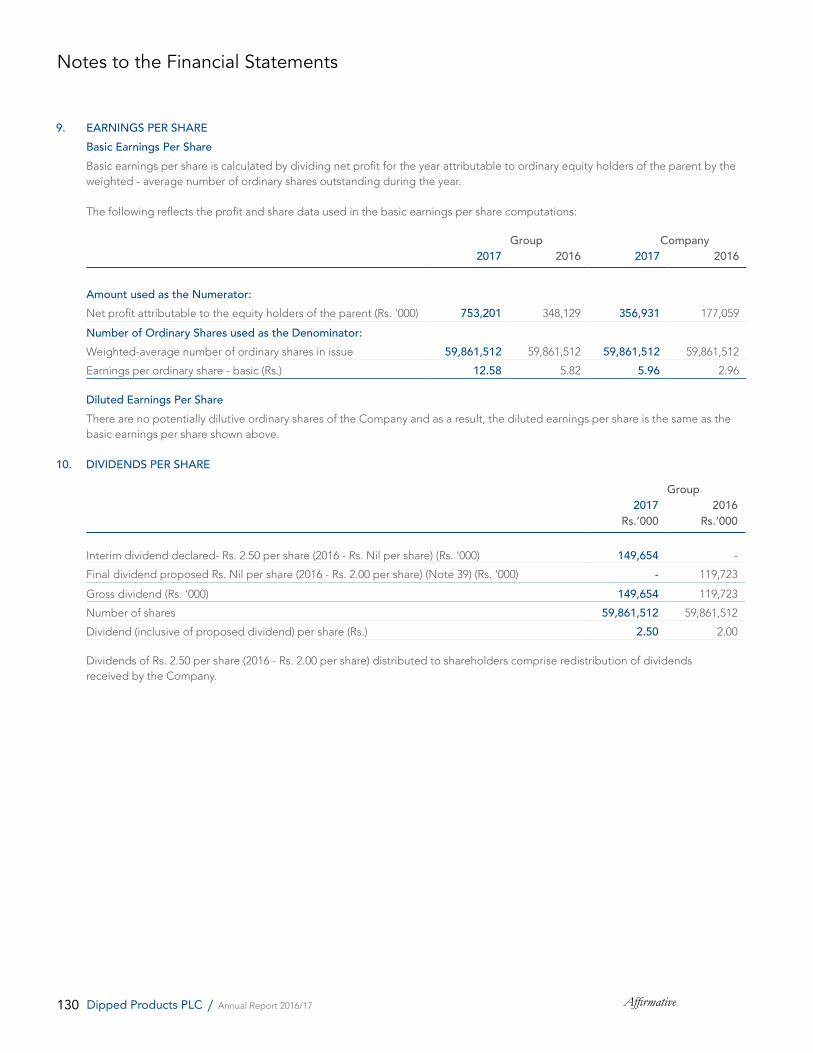
130 AffirmativeDipped Products PLC / Annual Report 2016/17
9. EARNINGS PER SHAREBasic Earnings Per Share
Basic earnings per share is calculated by dividing net profit for the year attributable to ordinary equity holders of the parent by the weighted - average number of ordinary shares outstanding during the year.
The following reflects the profit and share data used in the basic earnings per share computations:
Group Company2017 2016 2017 2016
Amount used as the Numerator:Net profit attributable to the equity holders of the parent (Rs. '000) 753,201 348,129 356,931 177,059
Number of Ordinary Shares used as the Denominator:Weighted-average number of ordinary shares in issue 59,861,512 59,861,512 59,861,512 59,861,512
Earnings per ordinary share - basic (Rs.) 12.58 5.82 5.96 2.96
Diluted Earnings Per Share There are no potentially dilutive ordinary shares of the Company and as a result, the diluted earnings per share is the same as the
basic earnings per share shown above.
10. DIVIDENDS PER SHARE
Group2017 2016
Rs.’000 Rs.’000
Interim dividend declared- Rs. 2.50 per share (2016 - Rs. Nil per share) (Rs. ‘000) 149,654 -
Final dividend proposed Rs. Nil per share (2016 - Rs. 2.00 per share) (Note 39) (Rs. ‘000) - 119,723
Gross dividend (Rs. ‘000) 149,654 119,723
Number of shares 59,861,512 59,861,512
Dividend (inclusive of proposed dividend) per share (Rs.) 2.50 2.00
Dividends of Rs. 2.50 per share (2016 - Rs. 2.00 per share) distributed to shareholders comprise redistribution of dividends received by the Company.
Notes to the Financial Statements
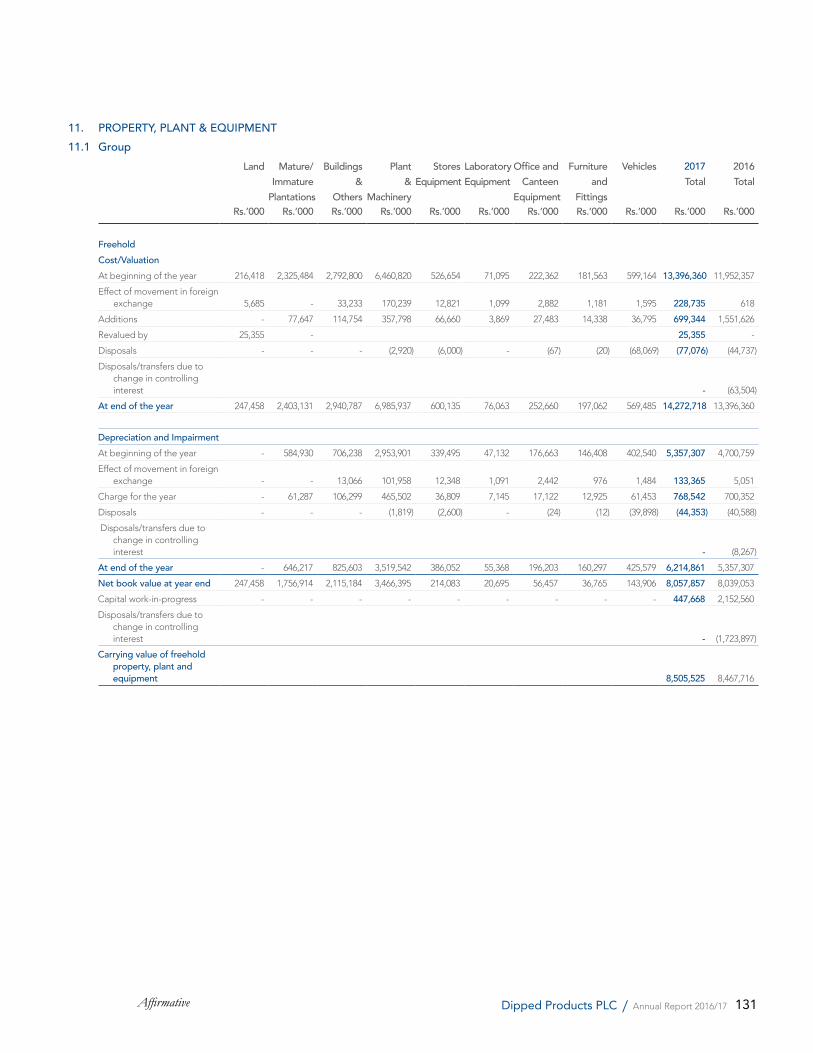
131Affirmative Dipped Products PLC / Annual Report 2016/17
11. PROPERTY, PLANT & EQUIPMENT11.1 Group
Land Mature/Immature
Plantations
Buildings &
Others
Plant &
Machinery
StoresEquipment
LaboratoryEquipment
Office andCanteen
Equipment
Furniture and
Fittings
Vehicles 2017Total
2016Total
Rs.’000 Rs.’000 Rs.’000 Rs.’000 Rs.’000 Rs.’000 Rs.’000 Rs.’000 Rs.’000 Rs.’000 Rs.’000
FreeholdCost/ValuationAt beginning of the year 216,418 2,325,484 2,792,800 6,460,820 526,654 71,095 222,362 181,563 599,164 13,396,360 11,952,357
Effect of movement in foreign exchange 5,685 - 33,233 170,239 12,821 1,099 2,882 1,181 1,595 228,735 618
Additions - 77,647 114,754 357,798 66,660 3,869 27,483 14,338 36,795 699,344 1,551,626
Revalued by 25,355 - 25,355 -
Disposals - - - (2,920) (6,000) - (67) (20) (68,069) (77,076) (44,737)
Disposals/transfers due to change in controlling interest - (63,504)
At end of the year 247,458 2,403,131 2,940,787 6,985,937 600,135 76,063 252,660 197,062 569,485 14,272,718 13,396,360
Depreciation and Impairment At beginning of the year - 584,930 706,238 2,953,901 339,495 47,132 176,663 146,408 402,540 5,357,307 4,700,759
Effect of movement in foreign exchange - - 13,066 101,958 12,348 1,091 2,442 976 1,484 133,365 5,051
Charge for the year - 61,287 106,299 465,502 36,809 7,145 17,122 12,925 61,453 768,542 700,352
Disposals - - - (1,819) (2,600) - (24) (12) (39,898) (44,353) (40,588)
Disposals/transfers due to change in controlling interest - (8,267)
At end of the year - 646,217 825,603 3,519,542 386,052 55,368 196,203 160,297 425,579 6,214,861 5,357,307
Net book value at year end 247,458 1,756,914 2,115,184 3,466,395 214,083 20,695 56,457 36,765 143,906 8,057,857 8,039,053
Capital work-in-progress - - - - - - - - - 447,668 2,152,560
Disposals/transfers due to change in controlling interest - (1,723,897)
Carrying value of freehold property, plant and equipment 8,505,525 8,467,716
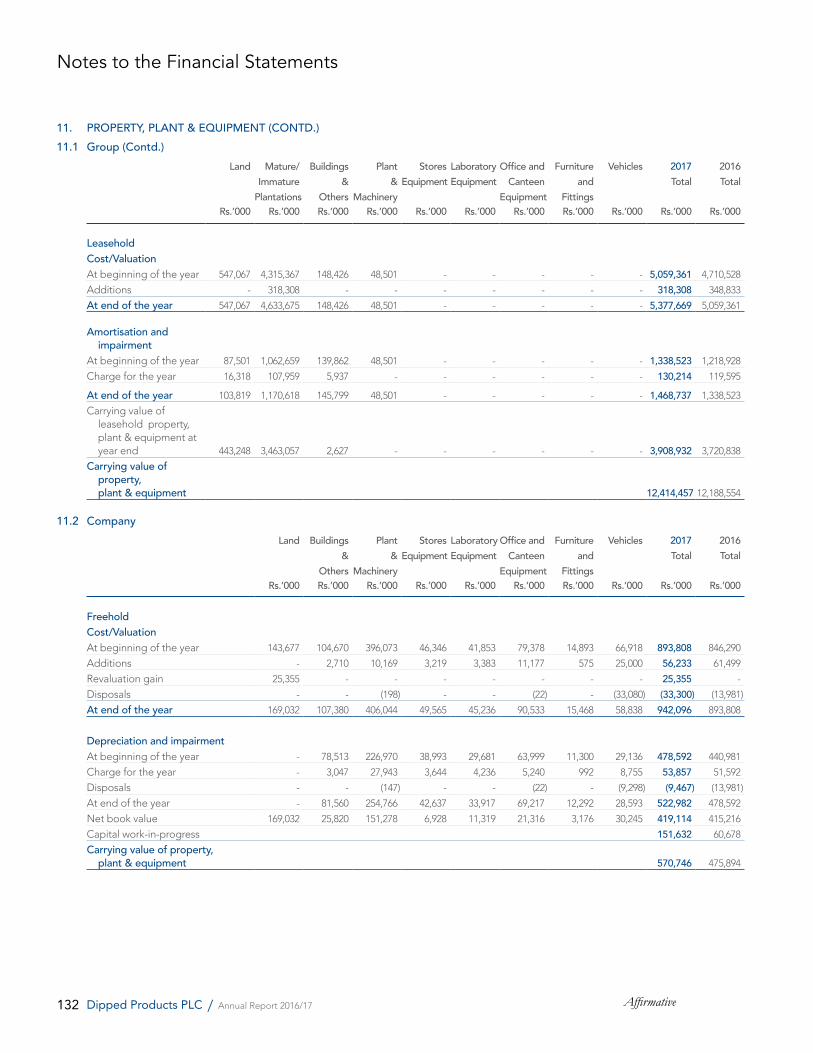
132 AffirmativeDipped Products PLC / Annual Report 2016/17
11. PROPERTY, PLANT & EQUIPMENT (CONTD.)11.1 Group (Contd.)
Land Mature/Immature
Plantations
Buildings &
Others
Plant &
Machinery
StoresEquipment
LaboratoryEquipment
Office andCanteen
Equipment
Furniture and
Fittings
Vehicles 2017Total
2016Total
Rs.’000 Rs.’000 Rs.’000 Rs.’000 Rs.’000 Rs.’000 Rs.’000 Rs.’000 Rs.’000 Rs.’000 Rs.’000
LeaseholdCost/ValuationAt beginning of the year 547,067 4,315,367 148,426 48,501 - - - - - 5,059,361 4,710,528
Additions - 318,308 - - - - - - - 318,308 348,833
At end of the year 547,067 4,633,675 148,426 48,501 - - - - - 5,377,669 5,059,361
Amortisation and impairment
At beginning of the year 87,501 1,062,659 139,862 48,501 - - - - - 1,338,523 1,218,928
Charge for the year 16,318 107,959 5,937 - - - - - - 130,214 119,595
At end of the year 103,819 1,170,618 145,799 48,501 - - - - - 1,468,737 1,338,523
Carrying value of leasehold property, plant & equipment at year end 443,248 3,463,057 2,627 - - - - - - 3,908,932 3,720,838
Carrying value of property, plant & equipment 12,414,457 12,188,554
11.2 CompanyLand Buildings
&Others
Plant &
Machinery
StoresEquipment
LaboratoryEquipment
Office andCanteen
Equipment
Furniture and
Fittings
Vehicles 2017Total
2016Total
Rs.’000 Rs.’000 Rs.’000 Rs.’000 Rs.’000 Rs.’000 Rs.’000 Rs.’000 Rs.’000 Rs.’000
FreeholdCost/ValuationAt beginning of the year 143,677 104,670 396,073 46,346 41,853 79,378 14,893 66,918 893,808 846,290
Additions - 2,710 10,169 3,219 3,383 11,177 575 25,000 56,233 61,499
Revaluation gain 25,355 - - - - - - - 25,355 -
Disposals - - (198) - - (22) - (33,080) (33,300) (13,981)
At end of the year 169,032 107,380 406,044 49,565 45,236 90,533 15,468 58,838 942,096 893,808
Depreciation and impairmentAt beginning of the year - 78,513 226,970 38,993 29,681 63,999 11,300 29,136 478,592 440,981
Charge for the year - 3,047 27,943 3,644 4,236 5,240 992 8,755 53,857 51,592
Disposals - - (147) - - (22) - (9,298) (9,467) (13,981)
At end of the year - 81,560 254,766 42,637 33,917 69,217 12,292 28,593 522,982 478,592
Net book value 169,032 25,820 151,278 6,928 11,319 21,316 3,176 30,245 419,114 415,216
Capital work-in-progress 151,632 60,678
Carrying value of property, plant & equipment 570,746 475,894
Notes to the Financial Statements
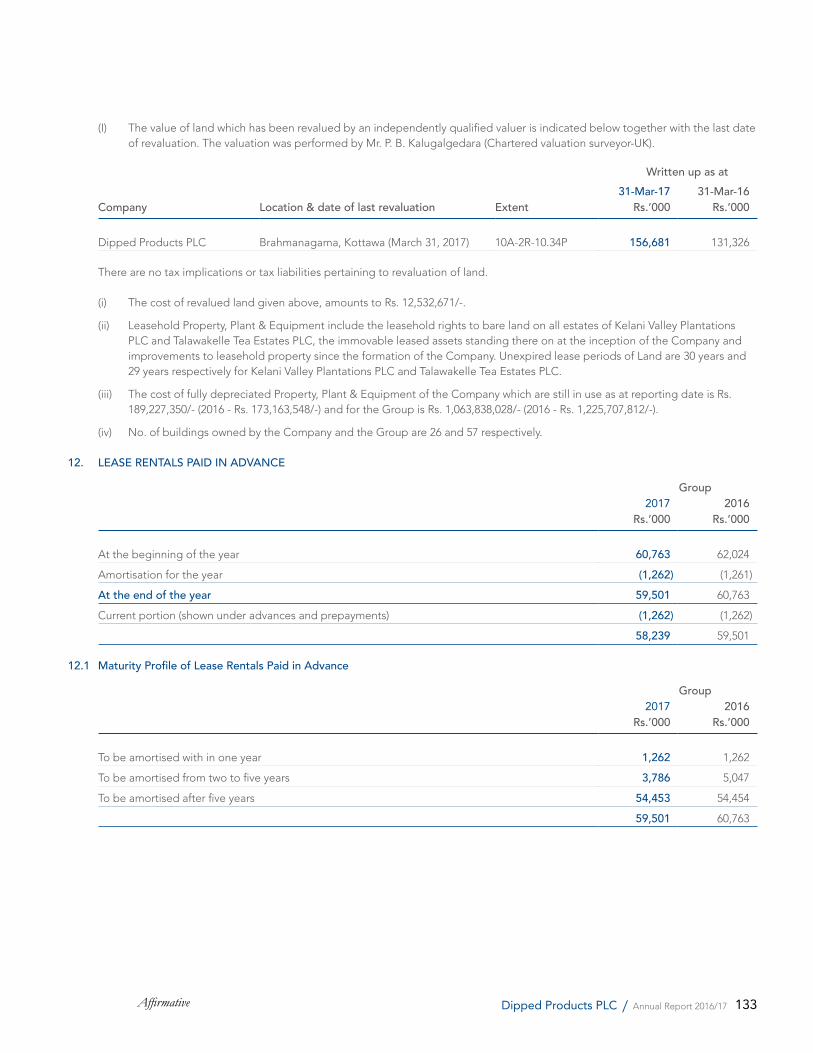
133Affirmative Dipped Products PLC / Annual Report 2016/17
(I) The value of land which has been revalued by an independently qualified valuer is indicated below together with the last date of revaluation. The valuation was performed by Mr. P. B. Kalugalgedara (Chartered valuation surveyor-UK).
Written up as at31-Mar-17 31-Mar-16
Company Location & date of last revaluation Extent Rs.’000 Rs.’000
Dipped Products PLC Brahmanagama, Kottawa (March 31, 2017) 10A-2R-10.34P 156,681 131,326
There are no tax implications or tax liabilities pertaining to revaluation of land.
(i) The cost of revalued land given above, amounts to Rs. 12,532,671/-.
(ii) Leasehold Property, Plant & Equipment include the leasehold rights to bare land on all estates of Kelani Valley Plantations PLC and Talawakelle Tea Estates PLC, the immovable leased assets standing there on at the inception of the Company and improvements to leasehold property since the formation of the Company. Unexpired lease periods of Land are 30 years and 29 years respectively for Kelani Valley Plantations PLC and Talawakelle Tea Estates PLC.
(iii) The cost of fully depreciated Property, Plant & Equipment of the Company which are still in use as at reporting date is Rs. 189,227,350/- (2016 - Rs. 173,163,548/-) and for the Group is Rs. 1,063,838,028/- (2016 - Rs. 1,225,707,812/-).
(iv) No. of buildings owned by the Company and the Group are 26 and 57 respectively.
12. LEASE RENTALS PAID IN ADVANCE
Group2017 2016
Rs.’000 Rs.’000
At the beginning of the year 60,763 62,024
Amortisation for the year (1,262) (1,261)
At the end of the year 59,501 60,763
Current portion (shown under advances and prepayments) (1,262) (1,262)
58,239 59,501
12.1 Maturity Profile of Lease Rentals Paid in Advance
Group2017 2016
Rs.’000 Rs.’000
To be amortised with in one year 1,262 1,262
To be amortised from two to five years 3,786 5,047
To be amortised after five years 54,453 54,454
59,501 60,763
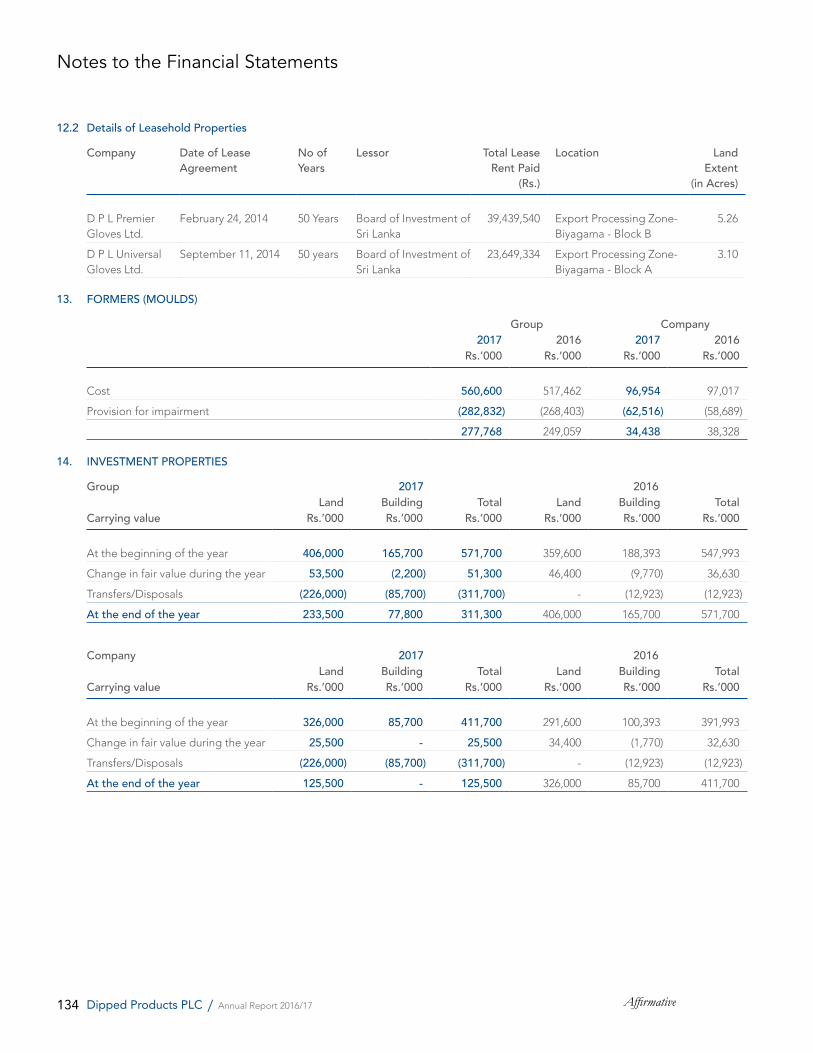
134 AffirmativeDipped Products PLC / Annual Report 2016/17
12.2 Details of Leasehold Properties
Company Date of Lease Agreement
No of Years
Lessor Total Lease Rent Paid
(Rs.)
Location Land Extent
(in Acres)
D P L Premier Gloves Ltd.
February 24, 2014 50 Years Board of Investment of Sri Lanka
39,439,540 Export Processing Zone-Biyagama - Block B
5.26
D P L Universal Gloves Ltd.
September 11, 2014 50 years Board of Investment of Sri Lanka
23,649,334 Export Processing Zone-Biyagama - Block A
3.10
13. FORMERS (MOULDS)
Group Company2017 2016 2017 2016
Rs.’000 Rs.’000 Rs.’000 Rs.’000
Cost 560,600 517,462 96,954 97,017
Provision for impairment (282,832) (268,403) (62,516) (58,689)
277,768 249,059 34,438 38,328
14. INVESTMENT PROPERTIES
Group 2017 2016Land Building Total Land Building Total
Carrying value Rs.’000 Rs.’000 Rs.’000 Rs.’000 Rs.’000 Rs.’000
At the beginning of the year 406,000 165,700 571,700 359,600 188,393 547,993
Change in fair value during the year 53,500 (2,200) 51,300 46,400 (9,770) 36,630
Transfers/Disposals (226,000) (85,700) (311,700) - (12,923) (12,923)
At the end of the year 233,500 77,800 311,300 406,000 165,700 571,700
Company 2017 2016Land Building Total Land Building Total
Carrying value Rs.’000 Rs.’000 Rs.’000 Rs.’000 Rs.’000 Rs.’000
At the beginning of the year 326,000 85,700 411,700 291,600 100,393 391,993
Change in fair value during the year 25,500 - 25,500 34,400 (1,770) 32,630
Transfers/Disposals (226,000) (85,700) (311,700) - (12,923) (12,923)
At the end of the year 125,500 - 125,500 326,000 85,700 411,700
Notes to the Financial Statements
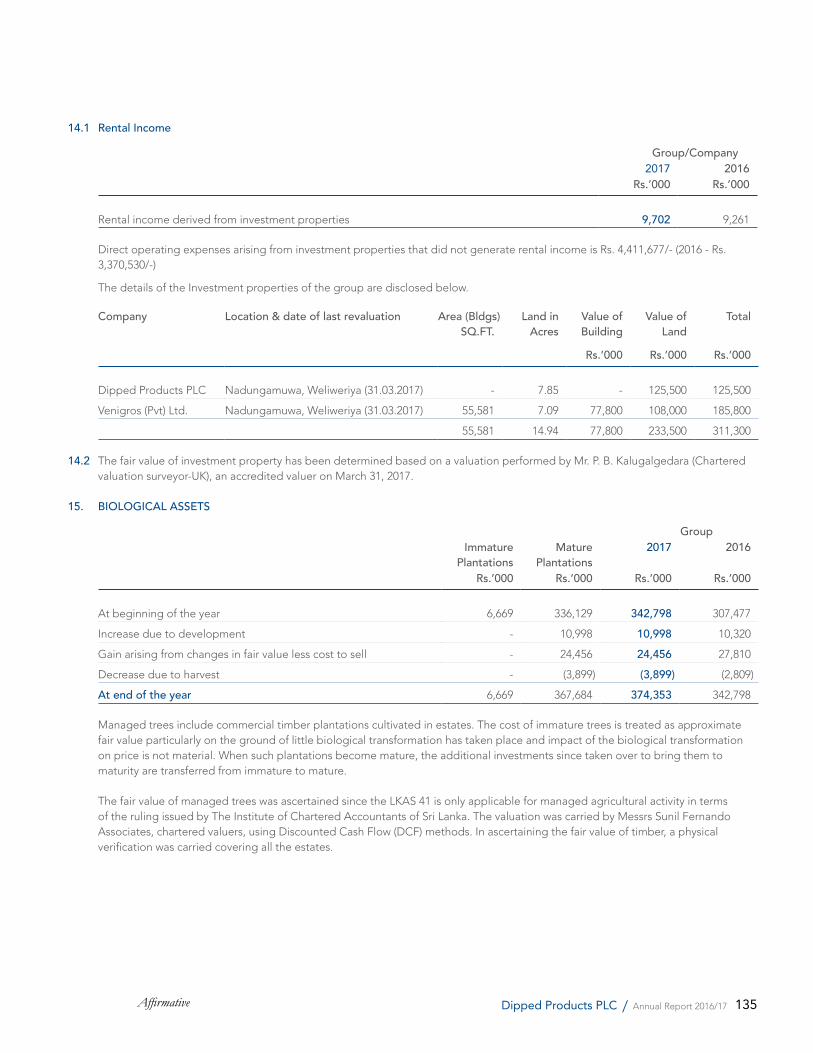
135Affirmative Dipped Products PLC / Annual Report 2016/17
14.1 Rental Income
Group/Company2017 2016
Rs.’000 Rs.’000
Rental income derived from investment properties 9,702 9,261
Direct operating expenses arising from investment properties that did not generate rental income is Rs. 4,411,677/- (2016 - Rs. 3,370,530/-)
The details of the Investment properties of the group are disclosed below.
Company Location & date of last revaluation Area (Bldgs) SQ.FT.
Land in Acres
Value ofBuilding
Value of Land
Total
Rs.’000 Rs.’000 Rs.’000
Dipped Products PLC Nadungamuwa, Weliweriya (31.03.2017) - 7.85 - 125,500 125,500
Venigros (Pvt) Ltd. Nadungamuwa, Weliweriya (31.03.2017) 55,581 7.09 77,800 108,000 185,800
55,581 14.94 77,800 233,500 311,300
14.2 The fair value of investment property has been determined based on a valuation performed by Mr. P. B. Kalugalgedara (Chartered valuation surveyor-UK), an accredited valuer on March 31, 2017.
15. BIOLOGICAL ASSETS
GroupImmature
PlantationsMature
Plantations2017 2016
Rs.’000 Rs.’000 Rs.’000 Rs.’000
At beginning of the year 6,669 336,129 342,798 307,477
Increase due to development - 10,998 10,998 10,320
Gain arising from changes in fair value less cost to sell - 24,456 24,456 27,810
Decrease due to harvest - (3,899) (3,899) (2,809)
At end of the year 6,669 367,684 374,353 342,798
Managed trees include commercial timber plantations cultivated in estates. The cost of immature trees is treated as approximate fair value particularly on the ground of little biological transformation has taken place and impact of the biological transformation on price is not material. When such plantations become mature, the additional investments since taken over to bring them to maturity are transferred from immature to mature.
The fair value of managed trees was ascertained since the LKAS 41 is only applicable for managed agricultural activity in terms of the ruling issued by The Institute of Chartered Accountants of Sri Lanka. The valuation was carried by Messrs Sunil Fernando Associates, chartered valuers, using Discounted Cash Flow (DCF) methods. In ascertaining the fair value of timber, a physical verification was carried covering all the estates.
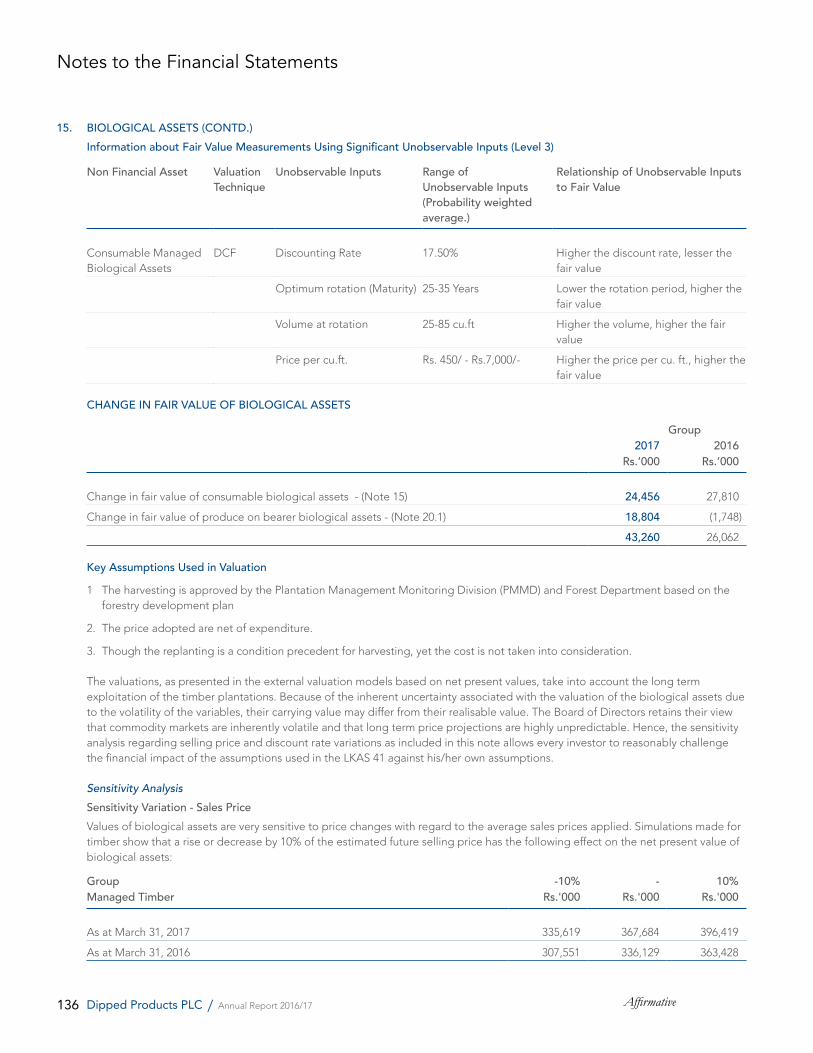
136 AffirmativeDipped Products PLC / Annual Report 2016/17
15. BIOLOGICAL ASSETS (CONTD.)Information about Fair Value Measurements Using Significant Unobservable Inputs (Level 3)
Non Financial Asset Valuation Technique
Unobservable Inputs Range of Unobservable Inputs (Probability weighted average.)
Relationship of Unobservable Inputs to Fair Value
Consumable Managed Biological Assets
DCF Discounting Rate 17.50% Higher the discount rate, lesser the fair value
Optimum rotation (Maturity) 25-35 Years Lower the rotation period, higher the fair value
Volume at rotation 25-85 cu.ft Higher the volume, higher the fair value
Price per cu.ft. Rs. 450/ - Rs.7,000/- Higher the price per cu. ft., higher the fair value
CHANGE IN FAIR VALUE OF BIOLOGICAL ASSETS
Group2017 2016
Rs.’000 Rs.’000
Change in fair value of consumable biological assets - (Note 15) 24,456 27,810
Change in fair value of produce on bearer biological assets - (Note 20.1) 18,804 (1,748)
43,260 26,062
Key Assumptions Used in Valuation1 The harvesting is approved by the Plantation Management Monitoring Division (PMMD) and Forest Department based on the
forestry development plan
2. The price adopted are net of expenditure.
3. Though the replanting is a condition precedent for harvesting, yet the cost is not taken into consideration.
The valuations, as presented in the external valuation models based on net present values, take into account the long term exploitation of the timber plantations. Because of the inherent uncertainty associated with the valuation of the biological assets due to the volatility of the variables, their carrying value may differ from their realisable value. The Board of Directors retains their view that commodity markets are inherently volatile and that long term price projections are highly unpredictable. Hence, the sensitivity analysis regarding selling price and discount rate variations as included in this note allows every investor to reasonably challenge the financial impact of the assumptions used in the LKAS 41 against his/her own assumptions.
Sensitivity Analysis
Sensitivity Variation - Sales Price Values of biological assets are very sensitive to price changes with regard to the average sales prices applied. Simulations made for
timber show that a rise or decrease by 10% of the estimated future selling price has the following effect on the net present value of biological assets:
Group -10% - 10%Managed Timber Rs.'000 Rs.'000 Rs.'000
As at March 31, 2017 335,619 367,684 396,419
As at March 31, 2016 307,551 336,129 363,428
Notes to the Financial Statements
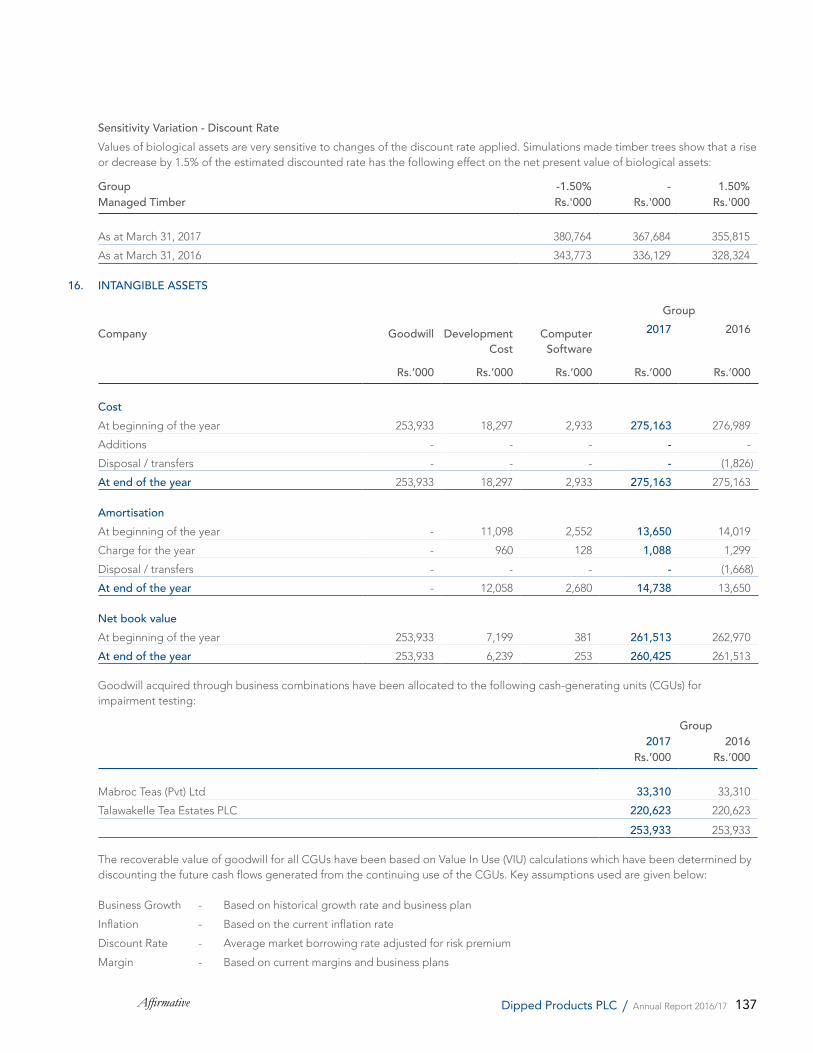
137Affirmative Dipped Products PLC / Annual Report 2016/17
Sensitivity Variation - Discount Rate Values of biological assets are very sensitive to changes of the discount rate applied. Simulations made timber trees show that a rise
or decrease by 1.5% of the estimated discounted rate has the following effect on the net present value of biological assets:
Group -1.50% - 1.50%Managed Timber Rs.'000 Rs.'000 Rs.'000
As at March 31, 2017 380,764 367,684 355,815
As at March 31, 2016 343,773 336,129 328,324
16. INTANGIBLE ASSETS
Group
Company Goodwill Development Cost
Computer Software
2017 2016
Rs.’000 Rs.’000 Rs.’000 Rs.’000 Rs.’000
CostAt beginning of the year 253,933 18,297 2,933 275,163 276,989
Additions - - - - -
Disposal / transfers - - - - (1,826)
At end of the year 253,933 18,297 2,933 275,163 275,163
AmortisationAt beginning of the year - 11,098 2,552 13,650 14,019
Charge for the year - 960 128 1,088 1,299
Disposal / transfers - - - - (1,668)
At end of the year - 12,058 2,680 14,738 13,650
Net book valueAt beginning of the year 253,933 7,199 381 261,513 262,970
At end of the year 253,933 6,239 253 260,425 261,513
Goodwill acquired through business combinations have been allocated to the following cash-generating units (CGUs) for impairment testing:
Group2017 2016
Rs.’000 Rs.’000
Mabroc Teas (Pvt) Ltd 33,310 33,310
Talawakelle Tea Estates PLC 220,623 220,623
253,933 253,933
The recoverable value of goodwill for all CGUs have been based on Value In Use (VIU) calculations which have been determined by discounting the future cash flows generated from the continuing use of the CGUs. Key assumptions used are given below:
Business Growth - Based on historical growth rate and business plan
Inflation - Based on the current inflation rate
Discount Rate - Average market borrowing rate adjusted for risk premium
Margin - Based on current margins and business plans
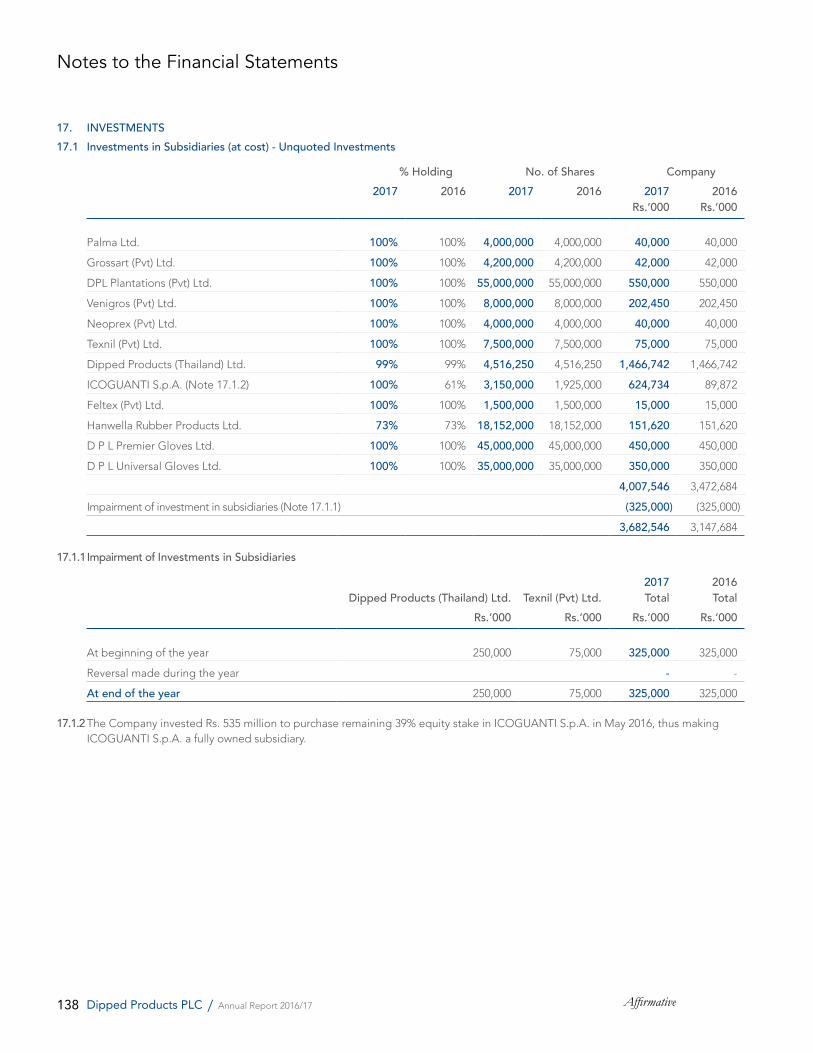
138 AffirmativeDipped Products PLC / Annual Report 2016/17
17. INVESTMENTS 17.1 Investments in Subsidiaries (at cost) - Unquoted Investments
% Holding No. of Shares Company2017 2016 2017 2016 2017 2016
Rs.’000 Rs.’000
Palma Ltd. 100% 100% 4,000,000 4,000,000 40,000 40,000
Grossart (Pvt) Ltd. 100% 100% 4,200,000 4,200,000 42,000 42,000
DPL Plantations (Pvt) Ltd. 100% 100% 55,000,000 55,000,000 550,000 550,000
Venigros (Pvt) Ltd. 100% 100% 8,000,000 8,000,000 202,450 202,450
Neoprex (Pvt) Ltd. 100% 100% 4,000,000 4,000,000 40,000 40,000
Texnil (Pvt) Ltd. 100% 100% 7,500,000 7,500,000 75,000 75,000
Dipped Products (Thailand) Ltd. 99% 99% 4,516,250 4,516,250 1,466,742 1,466,742
ICOGUANTI S.p.A. (Note 17.1.2) 100% 61% 3,150,000 1,925,000 624,734 89,872
Feltex (Pvt) Ltd. 100% 100% 1,500,000 1,500,000 15,000 15,000
Hanwella Rubber Products Ltd. 73% 73% 18,152,000 18,152,000 151,620 151,620
D P L Premier Gloves Ltd. 100% 100% 45,000,000 45,000,000 450,000 450,000
D P L Universal Gloves Ltd. 100% 100% 35,000,000 35,000,000 350,000 350,000
4,007,546 3,472,684
Impairment of investment in subsidiaries (Note 17.1.1) (325,000) (325,000)
3,682,546 3,147,684
17.1.1 Impairment of Investments in Subsidiaries
2017 2016Dipped Products (Thailand) Ltd. Texnil (Pvt) Ltd. Total Total
Rs.’000 Rs.’000 Rs.’000 Rs.’000
At beginning of the year 250,000 75,000 325,000 325,000
Reversal made during the year - -
At end of the year 250,000 75,000 325,000 325,000
17.1.2 The Company invested Rs. 535 million to purchase remaining 39% equity stake in ICOGUANTI S.p.A. in May 2016, thus making ICOGUANTI S.p.A. a fully owned subsidiary.
Notes to the Financial Statements
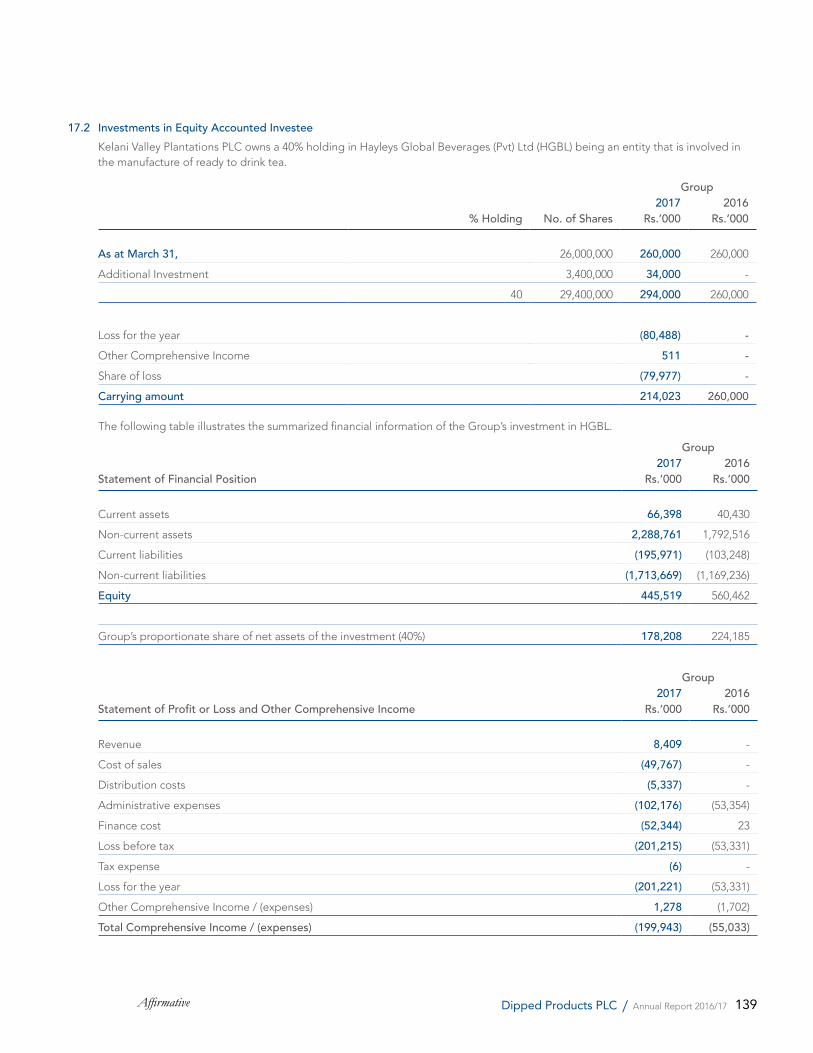
139Affirmative Dipped Products PLC / Annual Report 2016/17
17.2 Investments in Equity Accounted Investee Kelani Valley Plantations PLC owns a 40% holding in Hayleys Global Beverages (Pvt) Ltd (HGBL) being an entity that is involved in
the manufacture of ready to drink tea.
Group2017 2016
% Holding No. of Shares Rs.’000 Rs.’000
As at March 31, 26,000,000 260,000 260,000
Additional Investment 3,400,000 34,000 -
40 29,400,000 294,000 260,000
Loss for the year (80,488) -Other Comprehensive Income 511 -Share of loss (79,977) - Carrying amount 214,023 260,000
The following table illustrates the summarized financial information of the Group’s investment in HGBL.
Group2017 2016
Statement of Financial Position Rs.’000 Rs.’000
Current assets 66,398 40,430
Non-current assets 2,288,761 1,792,516
Current liabilities (195,971) (103,248)
Non-current liabilities (1,713,669) (1,169,236)
Equity 445,519 560,462
Group’s proportionate share of net assets of the investment (40%) 178,208 224,185
Group2017 2016
Statement of Profit or Loss and Other Comprehensive Income Rs.’000 Rs.’000
Revenue 8,409 -
Cost of sales (49,767) -
Distribution costs (5,337) -
Administrative expenses (102,176) (53,354)
Finance cost (52,344) 23
Loss before tax (201,215) (53,331)
Tax expense (6) -
Loss for the year (201,221) (53,331)
Other Comprehensive Income / (expenses) 1,278 (1,702)
Total Comprehensive Income / (expenses) (199,943) (55,033)
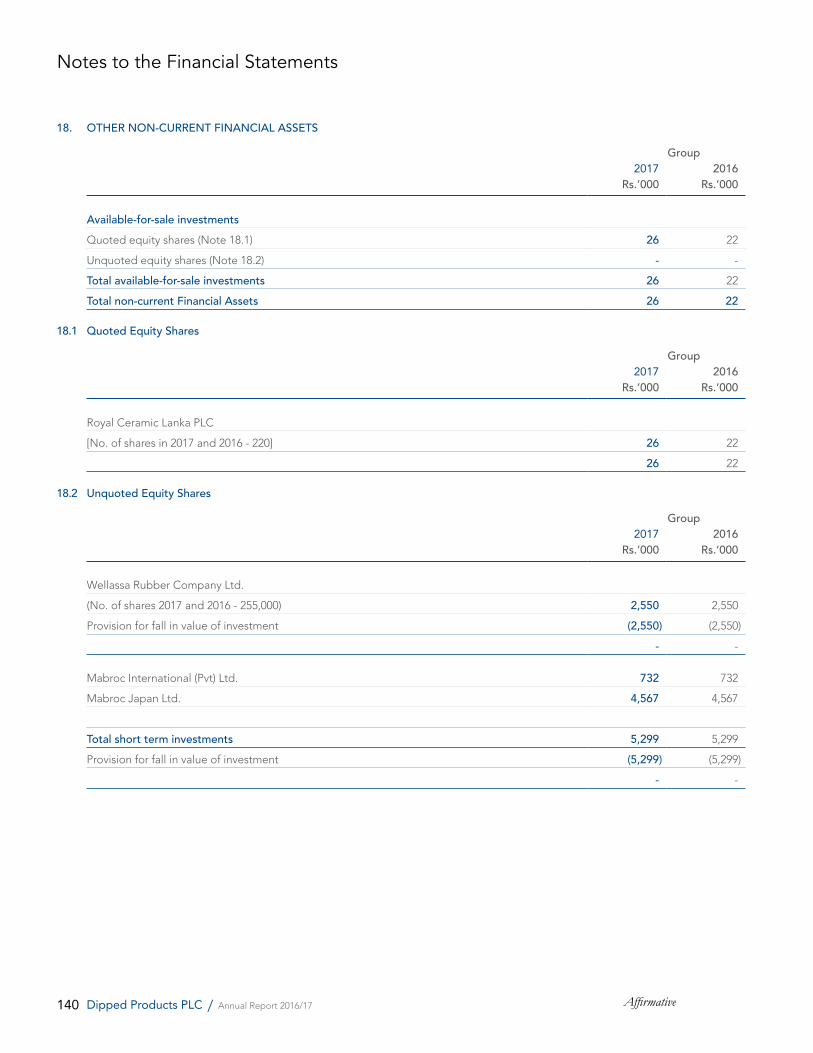
140 AffirmativeDipped Products PLC / Annual Report 2016/17
18. OTHER NON-CURRENT FINANCIAL ASSETS
Group2017 2016
Rs.’000 Rs.’000
Available-for-sale investmentsQuoted equity shares (Note 18.1) 26 22
Unquoted equity shares (Note 18.2) - -
Total available-for-sale investments 26 22
Total non-current Financial Assets 26 22
18.1 Quoted Equity Shares
Group2017 2016
Rs.’000 Rs.’000
Royal Ceramic Lanka PLC
[No. of shares in 2017 and 2016 - 220] 26 22
26 22
18.2 Unquoted Equity Shares
Group2017 2016
Rs.’000 Rs.’000
Wellassa Rubber Company Ltd.
(No. of shares 2017 and 2016 - 255,000) 2,550 2,550
Provision for fall in value of investment (2,550) (2,550)
- -
Mabroc International (Pvt) Ltd. 732 732
Mabroc Japan Ltd. 4,567 4,567
Total short term investments 5,299 5,299
Provision for fall in value of investment (5,299) (5,299)
- -
Notes to the Financial Statements
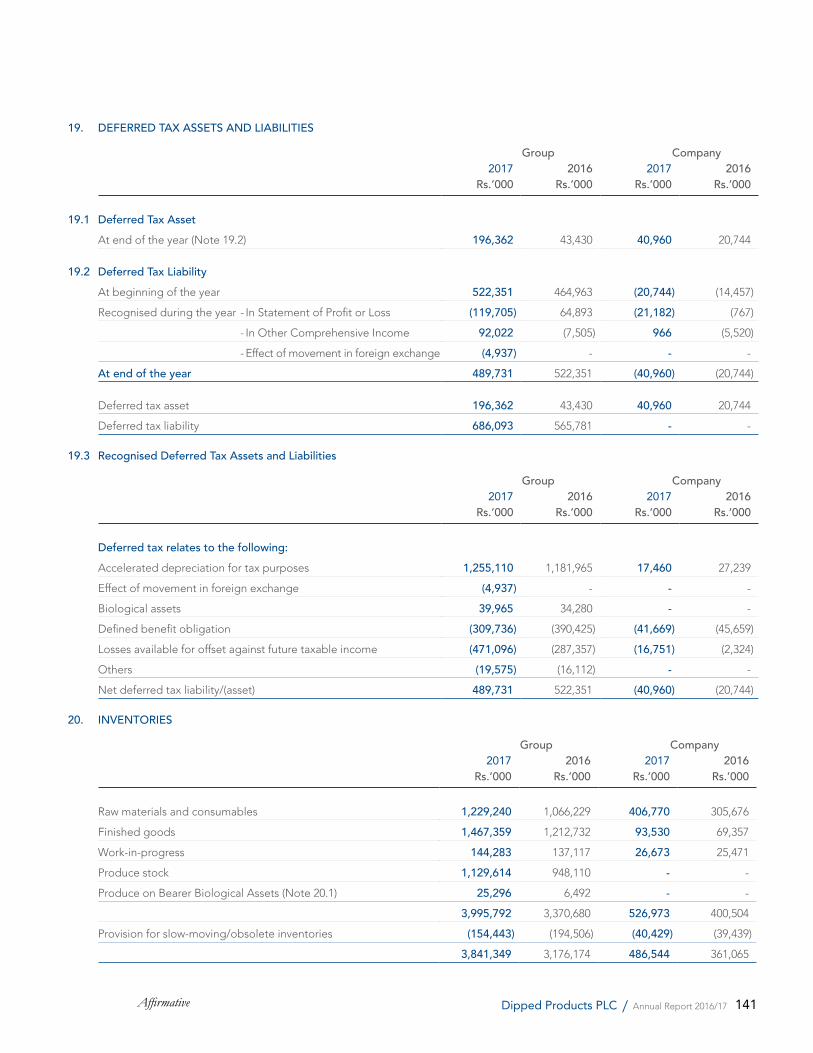
141Affirmative Dipped Products PLC / Annual Report 2016/17
19. DEFERRED TAX ASSETS AND LIABILITIES
Group Company2017 2016 2017 2016
Rs.’000 Rs.’000 Rs.’000 Rs.’000
19.1 Deferred Tax AssetAt end of the year (Note 19.2) 196,362 43,430 40,960 20,744
19.2 Deferred Tax LiabilityAt beginning of the year 522,351 464,963 (20,744) (14,457)
Recognised during the year - In Statement of Profit or Loss (119,705) 64,893 (21,182) (767)
- In Other Comprehensive Income 92,022 (7,505) 966 (5,520)
- Effect of movement in foreign exchange (4,937) - - -
At end of the year 489,731 522,351 (40,960) (20,744)
Deferred tax asset 196,362 43,430 40,960 20,744
Deferred tax liability 686,093 565,781 - -
19.3 Recognised Deferred Tax Assets and Liabilities
Group Company2017 2016 2017 2016
Rs.’000 Rs.’000 Rs.’000 Rs.’000
Deferred tax relates to the following:Accelerated depreciation for tax purposes 1,255,110 1,181,965 17,460 27,239
Effect of movement in foreign exchange (4,937) - - -
Biological assets 39,965 34,280 - -
Defined benefit obligation (309,736) (390,425) (41,669) (45,659)
Losses available for offset against future taxable income (471,096) (287,357) (16,751) (2,324)
Others (19,575) (16,112) - -
Net deferred tax liability/(asset) 489,731 522,351 (40,960) (20,744)
20. INVENTORIES
Group Company2017 2016 2017 2016
Rs.’000 Rs.’000 Rs.’000 Rs.’000
Raw materials and consumables 1,229,240 1,066,229 406,770 305,676
Finished goods 1,467,359 1,212,732 93,530 69,357
Work-in-progress 144,283 137,117 26,673 25,471
Produce stock 1,129,614 948,110 - -
Produce on Bearer Biological Assets (Note 20.1) 25,296 6,492 - -
3,995,792 3,370,680 526,973 400,504
Provision for slow-moving/obsolete inventories (154,443) (194,506) (40,429) (39,439)
3,841,349 3,176,174 486,544 361,065
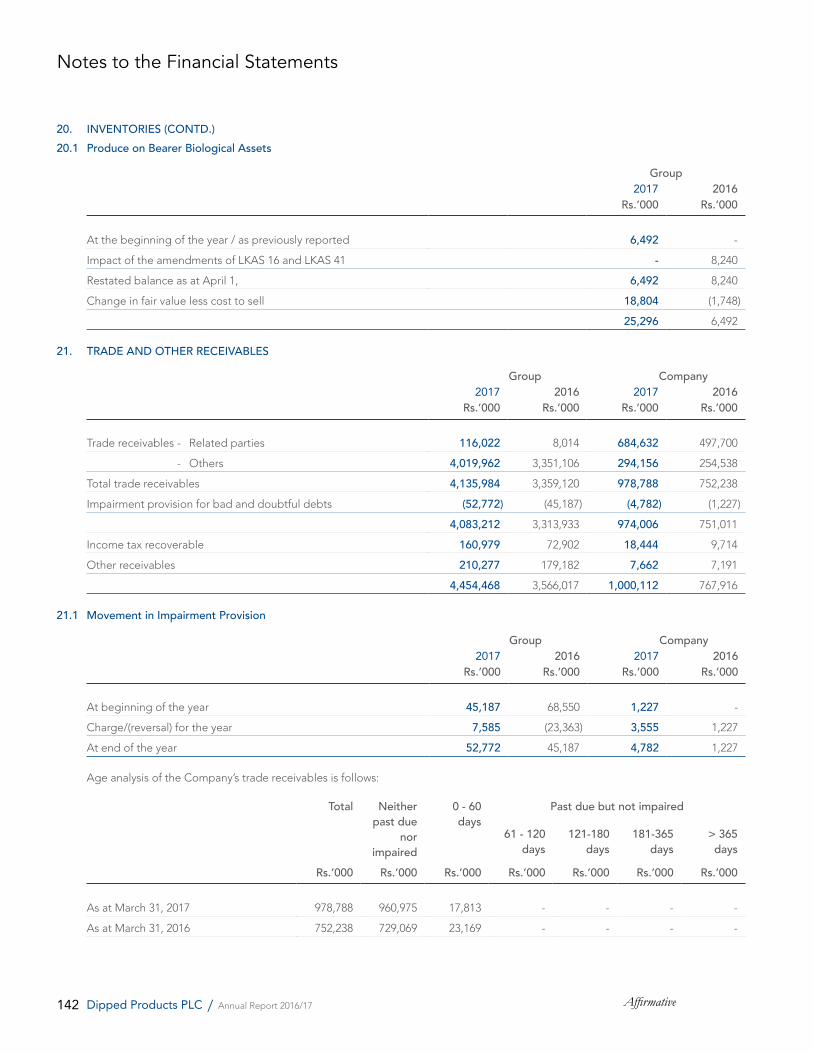
142 AffirmativeDipped Products PLC / Annual Report 2016/17
20. INVENTORIES (CONTD.)20.1 Produce on Bearer Biological Assets
Group2017 2016
Rs.’000 Rs.’000
At the beginning of the year / as previously reported 6,492 -
Impact of the amendments of LKAS 16 and LKAS 41 - 8,240
Restated balance as at April 1, 6,492 8,240
Change in fair value less cost to sell 18,804 (1,748)
25,296 6,492
21. TRADE AND OTHER RECEIVABLES
Group Company2017 2016 2017 2016
Rs.’000 Rs.’000 Rs.’000 Rs.’000
Trade receivables - Related parties 116,022 8,014 684,632 497,700
- Others 4,019,962 3,351,106 294,156 254,538
Total trade receivables 4,135,984 3,359,120 978,788 752,238
Impairment provision for bad and doubtful debts (52,772) (45,187) (4,782) (1,227)
4,083,212 3,313,933 974,006 751,011
Income tax recoverable 160,979 72,902 18,444 9,714
Other receivables 210,277 179,182 7,662 7,191
4,454,468 3,566,017 1,000,112 767,916
21.1 Movement in Impairment Provision
Group Company2017 2016 2017 2016
Rs.’000 Rs.’000 Rs.’000 Rs.’000
At beginning of the year 45,187 68,550 1,227 -
Charge/(reversal) for the year 7,585 (23,363) 3,555 1,227
At end of the year 52,772 45,187 4,782 1,227
Age analysis of the Company’s trade receivables is follows:
Total Neither past due
norimpaired
0 - 60days
Past due but not impaired
61 - 120days
121-180days
181-365days
> 365days
Rs.’000 Rs.’000 Rs.’000 Rs.’000 Rs.’000 Rs.’000 Rs.’000
As at March 31, 2017 978,788 960,975 17,813 - - - -
As at March 31, 2016 752,238 729,069 23,169 - - - -
Notes to the Financial Statements
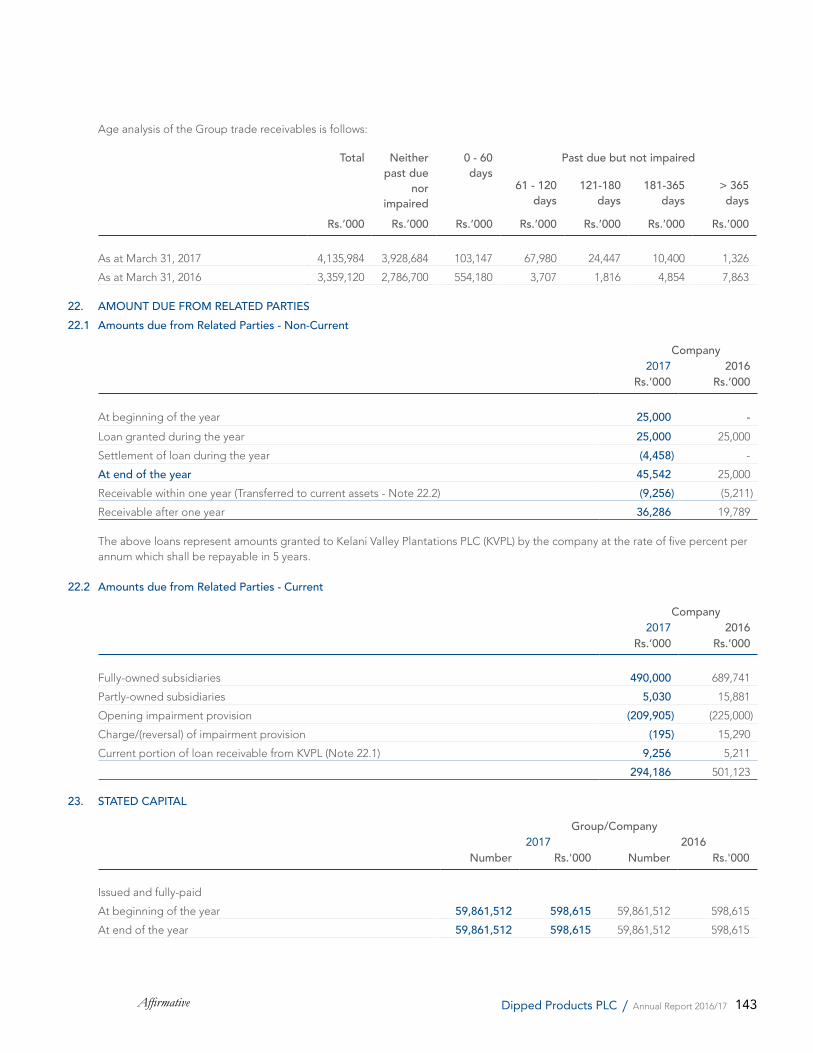
143Affirmative Dipped Products PLC / Annual Report 2016/17
Age analysis of the Group trade receivables is follows:
Total Neither past due
norimpaired
0 - 60days
Past due but not impaired
61 - 120days
121-180days
181-365days
> 365days
Rs.’000 Rs.’000 Rs.’000 Rs.’000 Rs.’000 Rs.’000 Rs.’000
As at March 31, 2017 4,135,984 3,928,684 103,147 67,980 24,447 10,400 1,326
As at March 31, 2016 3,359,120 2,786,700 554,180 3,707 1,816 4,854 7,863
22. AMOUNT DUE FROM RELATED PARTIES22.1 Amounts due from Related Parties - Non-Current
Company2017 2016
Rs.’000 Rs.’000
At beginning of the year 25,000 - Loan granted during the year 25,000 25,000
Settlement of loan during the year (4,458) -
At end of the year 45,542 25,000
Receivable within one year (Transferred to current assets - Note 22.2) (9,256) (5,211)
Receivable after one year 36,286 19,789
The above loans represent amounts granted to Kelani Valley Plantations PLC (KVPL) by the company at the rate of five percent per annum which shall be repayable in 5 years.
22.2 Amounts due from Related Parties - Current
Company2017 2016
Rs.’000 Rs.’000
Fully-owned subsidiaries 490,000 689,741
Partly-owned subsidiaries 5,030 15,881
Opening impairment provision (209,905) (225,000)
Charge/(reversal) of impairment provision (195) 15,290
Current portion of loan receivable from KVPL (Note 22.1) 9,256 5,211
294,186 501,123
23. STATED CAPITAL
Group/Company 2017 2016
Number Rs.'000 Number Rs.'000
Issued and fully-paid
At beginning of the year 59,861,512 598,615 59,861,512 598,615
At end of the year 59,861,512 598,615 59,861,512 598,615
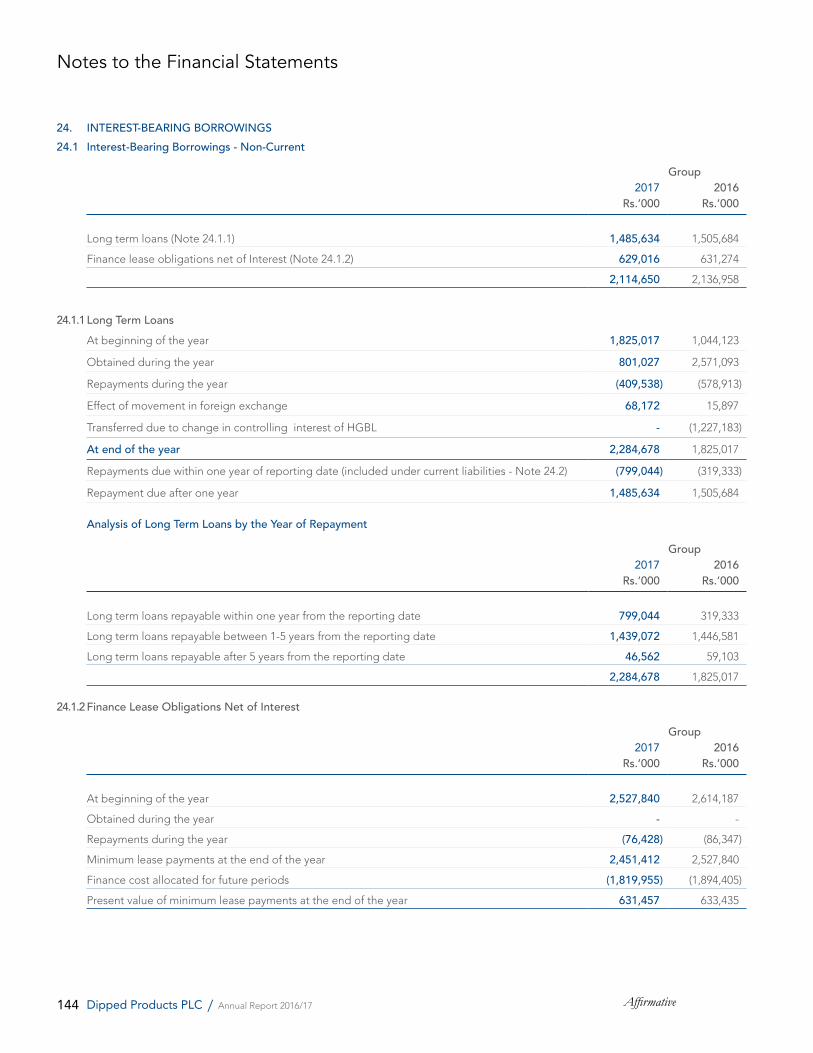
144 AffirmativeDipped Products PLC / Annual Report 2016/17
24. INTEREST-BEARING BORROWINGS24.1 Interest-Bearing Borrowings - Non-Current
Group2017 2016
Rs.’000 Rs.’000
Long term loans (Note 24.1.1) 1,485,634 1,505,684
Finance lease obligations net of Interest (Note 24.1.2) 629,016 631,274
2,114,650 2,136,958
24.1.1Long Term LoansAt beginning of the year 1,825,017 1,044,123
Obtained during the year 801,027 2,571,093
Repayments during the year (409,538) (578,913)
Effect of movement in foreign exchange 68,172 15,897
Transferred due to change in controlling interest of HGBL - (1,227,183)
At end of the year 2,284,678 1,825,017
Repayments due within one year of reporting date (included under current liabilities - Note 24.2) (799,044) (319,333)
Repayment due after one year 1,485,634 1,505,684
Analysis of Long Term Loans by the Year of Repayment
Group2017 2016
Rs.’000 Rs.’000
Long term loans repayable within one year from the reporting date 799,044 319,333
Long term loans repayable between 1-5 years from the reporting date 1,439,072 1,446,581
Long term loans repayable after 5 years from the reporting date 46,562 59,103
2,284,678 1,825,017
24.1.2 Finance Lease Obligations Net of Interest
Group2017 2016
Rs.’000 Rs.’000
At beginning of the year 2,527,840 2,614,187
Obtained during the year - -
Repayments during the year (76,428) (86,347)
Minimum lease payments at the end of the year 2,451,412 2,527,840
Finance cost allocated for future periods (1,819,955) (1,894,405)
Present value of minimum lease payments at the end of the year 631,457 633,435
Notes to the Financial Statements
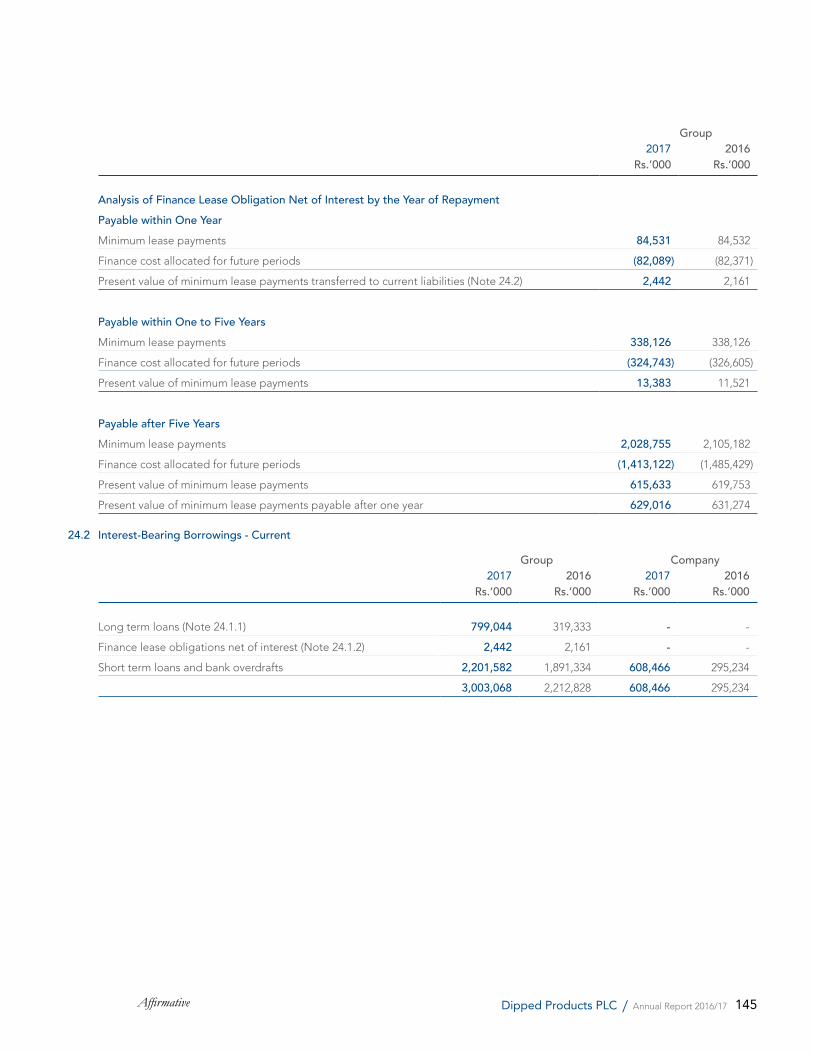
145Affirmative Dipped Products PLC / Annual Report 2016/17
Group2017 2016
Rs.’000 Rs.’000
Analysis of Finance Lease Obligation Net of Interest by the Year of RepaymentPayable within One YearMinimum lease payments 84,531 84,532
Finance cost allocated for future periods (82,089) (82,371)
Present value of minimum lease payments transferred to current liabilities (Note 24.2) 2,442 2,161
Payable within One to Five YearsMinimum lease payments 338,126 338,126
Finance cost allocated for future periods (324,743) (326,605)
Present value of minimum lease payments 13,383 11,521
Payable after Five YearsMinimum lease payments 2,028,755 2,105,182
Finance cost allocated for future periods (1,413,122) (1,485,429)
Present value of minimum lease payments 615,633 619,753
Present value of minimum lease payments payable after one year 629,016 631,274
24.2 Interest-Bearing Borrowings - Current
Group Company2017 2016 2017 2016
Rs.’000 Rs.’000 Rs.’000 Rs.’000
Long term loans (Note 24.1.1) 799,044 319,333 - -
Finance lease obligations net of interest (Note 24.1.2) 2,442 2,161 - -
Short term loans and bank overdrafts 2,201,582 1,891,334 608,466 295,234
3,003,068 2,212,828 608,466 295,234
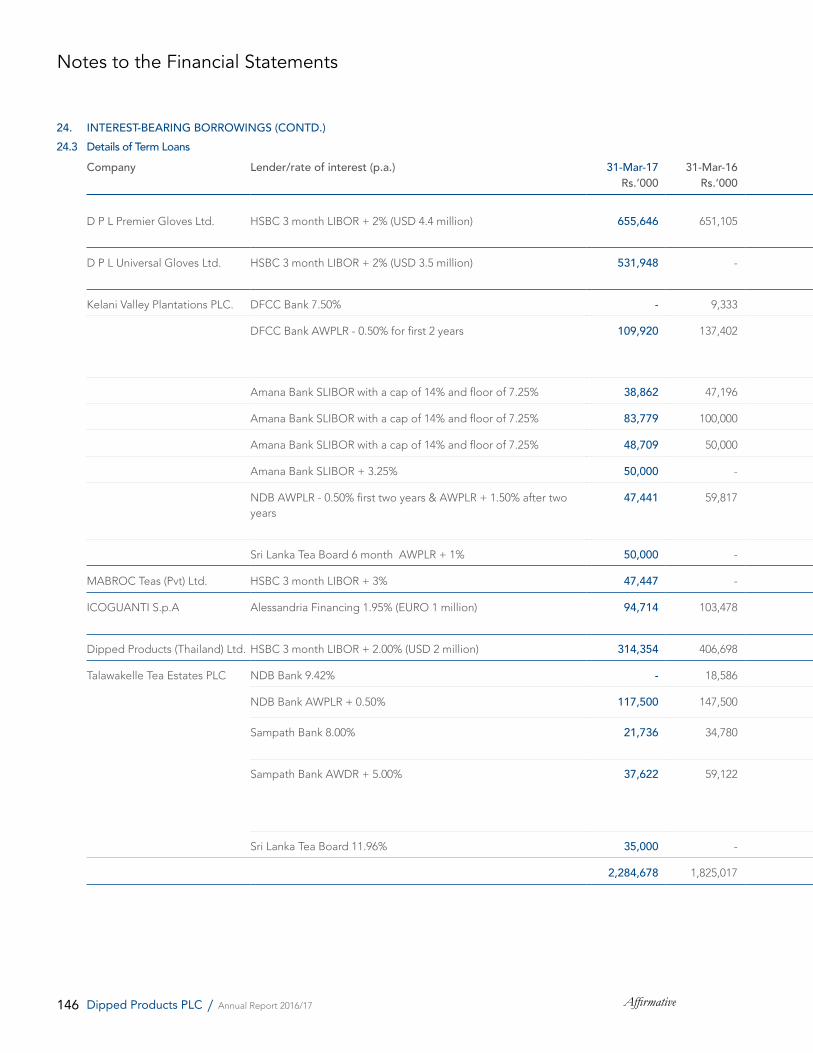
146 AffirmativeDipped Products PLC / Annual Report 2016/17
24. INTEREST-BEARING BORROWINGS (CONTD.)24.3 Details of Term Loans
Company Lender/rate of interest (p.a.) 31-Mar-17 31-Mar-16 Repayment SecurityRs.’000 Rs.’000 Rs.’000
D P L Premier Gloves Ltd. HSBC 3 month LIBOR + 2% (USD 4.4 million) 655,646 651,105 USD 125,000 x 36 inst. (with first 12 months grace period)
Monthly ending 27.04.2020 Primary mortgage over property at Biyagama Export Processing Zone Block B Walgama Malwana; carrying amount of which is Rs. 1,120 million.
D P L Universal Gloves Ltd. HSBC 3 month LIBOR + 2% (USD 3.5 million) 531,948 - USD 145,833 x 24 inst. (with first 12 months grace period)
Monthly ending 27.05.2019 Corporate guarantee from Dipped Products PLC
Kelani Valley Plantations PLC. DFCC Bank 7.50% - 9,333 933 x 90 inst. Monthly ending 31.01.2017 Primary mortgage of Rs. 348 million over the leasehold rights of Halgolla, We Oya, Polatagama and Ederapola Estates and letter of undertakings from DPL Plantations (Pvt) Ltd., was given to subordinate management fee and dividends in a default situation of Term Loan; carrying amount of which is Rs. 52 million.
DFCC Bank AWPLR - 0.50% for first 2 years 109,920 137,402 2,290 x 60 inst. Monthly ending 14.03.2021
Amana Bank SLIBOR with a cap of 14% and floor of 7.25% 38,862 47,196 as per schedule Monthly ending 14.12.2021 Nil
Amana Bank SLIBOR with a cap of 14% and floor of 7.25% 83,779 100,000 as per schedule Monthly ending 19.03.2023 Nil
Amana Bank SLIBOR with a cap of 14% and floor of 7.25% 48,709 50,000 as per schedule Monthly ending 21.01.2023 Nil
Amana Bank SLIBOR + 3.25% 50,000 - 833 x 60 inst. Monthly ending 17.11.2022 Nil
NDB AWPLR - 0.50% first two years & AWPLR + 1.50% after two years
47,441 59,817 1031 x 60 inst. Monthly ending 11.02.2021 Primary mortgage over the leasehold rights, Buildings,Plant & Machinery of Pedro, Mahagastota & Panawatte Estates; carrying amount of which is Rs. 163 million.
Sri Lanka Tea Board 6 month AWPLR + 1% 50,000 - 1389 x 48 inst. Monthly ending 17.08.2022 Trade receivables from tea brokers
MABROC Teas (Pvt) Ltd. HSBC 3 month LIBOR + 3% 47,447 - USD 21,250 x 16 inst. Monthly ending 27.08.2021 Nil
ICOGUANTI S.p.A Alessandria Financing 1.95% (EURO 1 million) 94,714 103,478 Repayment over 2 years as per agreed schedule
Monthly ending 30.06.2025 Nil
Dipped Products (Thailand) Ltd. HSBC 3 month LIBOR + 2.00% (USD 2 million) 314,354 406,698 USD 62,500 x 48 inst. Monthly ending 27.12.2019 Corporate guarantee from Dipped Products PLC
Talawakelle Tea Estates PLC NDB Bank 9.42% - 18,586 975 x 96 Inst. Monthly ending 31.12.2018 Primary mortgage over leasehold rights of Somerset, Great Western, Holyrood, Logie and Dessford Estates; carrying amount of which is Rs. 58 million.NDB Bank AWPLR + 0.50% 117,500 147,500 2,500 x 60 inst. Monthly ending 23.03.2021
Sampath Bank 8.00% 21,736 34,780 1,087 x 92 Inst. Monthly ending 30.11.2018 Primary mortgage bond for Rs. 100 million over leasehold rights of Mattakelle Estate; carrying amount of which is Rs. 9 million.
Sampath Bank AWDR + 5.00% 37,622 59,122 1,593 x 108 Inst. Monthly ending 31.12.2018 Primary mortgage over lease hold rights to the value of Rs. 30 million of Clarendon Estate and secondary mortgage over leasehold rights to the value of Rs. 20 million of Deniyaya Estate carrying amount of which is Rs. 15 million.
Sri Lanka Tea Board 11.96% 35,000 - 972 x 36 Inst. Monthly ending 31.08.2020 Tea sales proceeds.
2,284,678 1,825,017
Notes to the Financial Statements
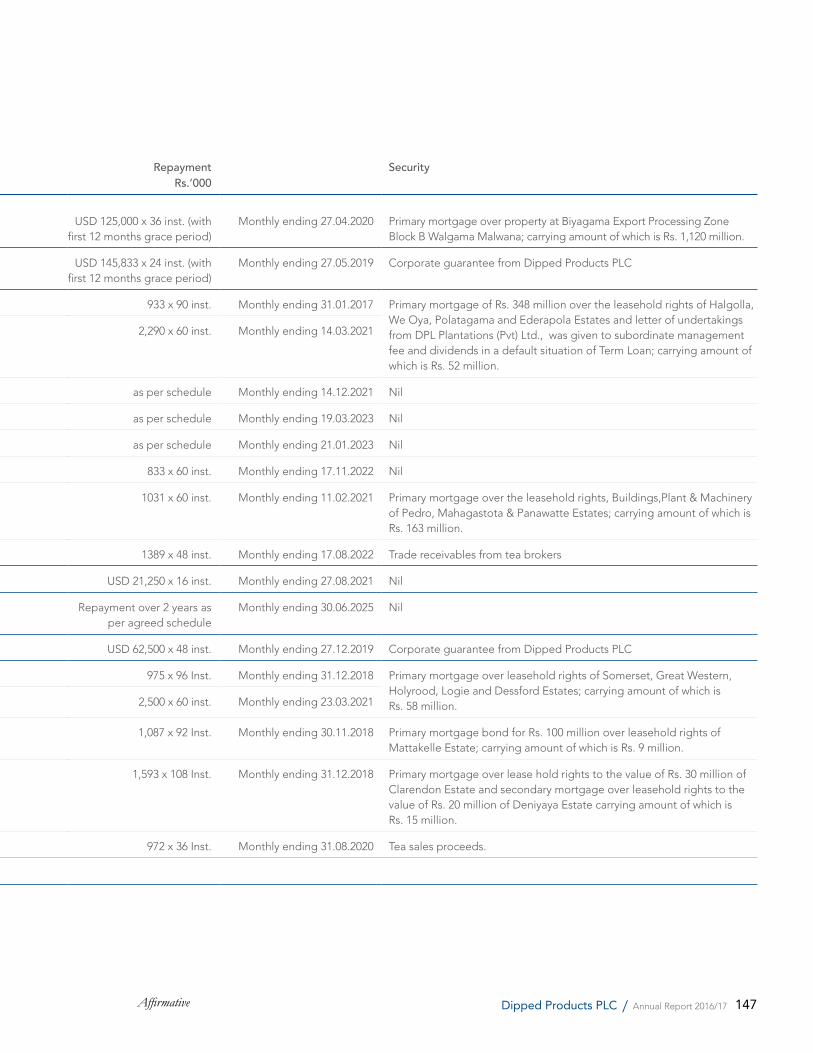
147Affirmative Dipped Products PLC / Annual Report 2016/17
24. INTEREST-BEARING BORROWINGS (CONTD.)24.3 Details of Term Loans
Company Lender/rate of interest (p.a.) 31-Mar-17 31-Mar-16 Repayment SecurityRs.’000 Rs.’000 Rs.’000
D P L Premier Gloves Ltd. HSBC 3 month LIBOR + 2% (USD 4.4 million) 655,646 651,105 USD 125,000 x 36 inst. (with first 12 months grace period)
Monthly ending 27.04.2020 Primary mortgage over property at Biyagama Export Processing Zone Block B Walgama Malwana; carrying amount of which is Rs. 1,120 million.
D P L Universal Gloves Ltd. HSBC 3 month LIBOR + 2% (USD 3.5 million) 531,948 - USD 145,833 x 24 inst. (with first 12 months grace period)
Monthly ending 27.05.2019 Corporate guarantee from Dipped Products PLC
Kelani Valley Plantations PLC. DFCC Bank 7.50% - 9,333 933 x 90 inst. Monthly ending 31.01.2017 Primary mortgage of Rs. 348 million over the leasehold rights of Halgolla, We Oya, Polatagama and Ederapola Estates and letter of undertakings from DPL Plantations (Pvt) Ltd., was given to subordinate management fee and dividends in a default situation of Term Loan; carrying amount of which is Rs. 52 million.
DFCC Bank AWPLR - 0.50% for first 2 years 109,920 137,402 2,290 x 60 inst. Monthly ending 14.03.2021
Amana Bank SLIBOR with a cap of 14% and floor of 7.25% 38,862 47,196 as per schedule Monthly ending 14.12.2021 Nil
Amana Bank SLIBOR with a cap of 14% and floor of 7.25% 83,779 100,000 as per schedule Monthly ending 19.03.2023 Nil
Amana Bank SLIBOR with a cap of 14% and floor of 7.25% 48,709 50,000 as per schedule Monthly ending 21.01.2023 Nil
Amana Bank SLIBOR + 3.25% 50,000 - 833 x 60 inst. Monthly ending 17.11.2022 Nil
NDB AWPLR - 0.50% first two years & AWPLR + 1.50% after two years
47,441 59,817 1031 x 60 inst. Monthly ending 11.02.2021 Primary mortgage over the leasehold rights, Buildings,Plant & Machinery of Pedro, Mahagastota & Panawatte Estates; carrying amount of which is Rs. 163 million.
Sri Lanka Tea Board 6 month AWPLR + 1% 50,000 - 1389 x 48 inst. Monthly ending 17.08.2022 Trade receivables from tea brokers
MABROC Teas (Pvt) Ltd. HSBC 3 month LIBOR + 3% 47,447 - USD 21,250 x 16 inst. Monthly ending 27.08.2021 Nil
ICOGUANTI S.p.A Alessandria Financing 1.95% (EURO 1 million) 94,714 103,478 Repayment over 2 years as per agreed schedule
Monthly ending 30.06.2025 Nil
Dipped Products (Thailand) Ltd. HSBC 3 month LIBOR + 2.00% (USD 2 million) 314,354 406,698 USD 62,500 x 48 inst. Monthly ending 27.12.2019 Corporate guarantee from Dipped Products PLC
Talawakelle Tea Estates PLC NDB Bank 9.42% - 18,586 975 x 96 Inst. Monthly ending 31.12.2018 Primary mortgage over leasehold rights of Somerset, Great Western, Holyrood, Logie and Dessford Estates; carrying amount of which is Rs. 58 million.NDB Bank AWPLR + 0.50% 117,500 147,500 2,500 x 60 inst. Monthly ending 23.03.2021
Sampath Bank 8.00% 21,736 34,780 1,087 x 92 Inst. Monthly ending 30.11.2018 Primary mortgage bond for Rs. 100 million over leasehold rights of Mattakelle Estate; carrying amount of which is Rs. 9 million.
Sampath Bank AWDR + 5.00% 37,622 59,122 1,593 x 108 Inst. Monthly ending 31.12.2018 Primary mortgage over lease hold rights to the value of Rs. 30 million of Clarendon Estate and secondary mortgage over leasehold rights to the value of Rs. 20 million of Deniyaya Estate carrying amount of which is Rs. 15 million.
Sri Lanka Tea Board 11.96% 35,000 - 972 x 36 Inst. Monthly ending 31.08.2020 Tea sales proceeds.
2,284,678 1,825,017

148 AffirmativeDipped Products PLC / Annual Report 2016/17
25. DEFERRED INCOMEGovernment Grants
Group2017 2016
Rs.’000 Rs.’000
GrantsAt beginning of the year 956,884 892,597
Received during the year 42,291 64,287
At end of the year 999,175 956,884
AmortisationAt beginning of the year 283,020 247,622
Amortised during the year 25,040 35,398
At end of the year 308,060 283,020
Carrying amount 691,115 673,864
Kelani Valley Plantations group received grants from the Plantation Reform Project (PRP), Plantation Human Development Trust, Ministry of Community Development, Asian Development Bank, Social Welfare Project, Estate Infrastructures Development Project, Plantation Development Support Project, Ceylon Electricity Board, Sri Lanka Tea Board and Rubber Development Division of Ministry of Plantations Industry.
Hayleys Plantation Services group has received funding from the Sri Lanka Tea Board during the year for replanting.
The amount spent is capitalized under relevant classification of improvement to leasehold property, plant & equipment. Corresponding grant component is reflected under deferred grants and subsidies and amortized over the useful life span of the asset.
26. DEFINED BENEFIT OBLIGATIONS The Group measures the Present Value of Defined Benefit Obligation (PVDBO) which is a defined benefit plan with the advice of an
actuary using the Projected Unit Credit Method (PUC).
The actuarial valuation involves making assumptions about discount rate, average expected future working lives, salary escalation rate, promotion rates and mortality rates.
Due to the long term nature of these plans, such estimates are subject to significant uncertainty. All assumptions are reviewed at each reporting date.
Accordingly, the employee benefit obligation actuarial valuation as of March 31, 2017, carried out by Messrs NMG Consulting, Actuaries, except for DPTL and ICOGUANTI which were valued by Mr. Surendran Ramanathan and Messrs. Managers & partners - Actuarial services S.p.A respectively.
The key assumptions used by the actuary include the following:
Assumptions regarding future mortality are based on a A1967/70 mortality table, issued by the Institute of Actuaries, London.
The demographic assumptions underlying the valuation with respect to retirement age, early withdrawals from service and retirement on medical grounds were considered.
Notes to the Financial Statements
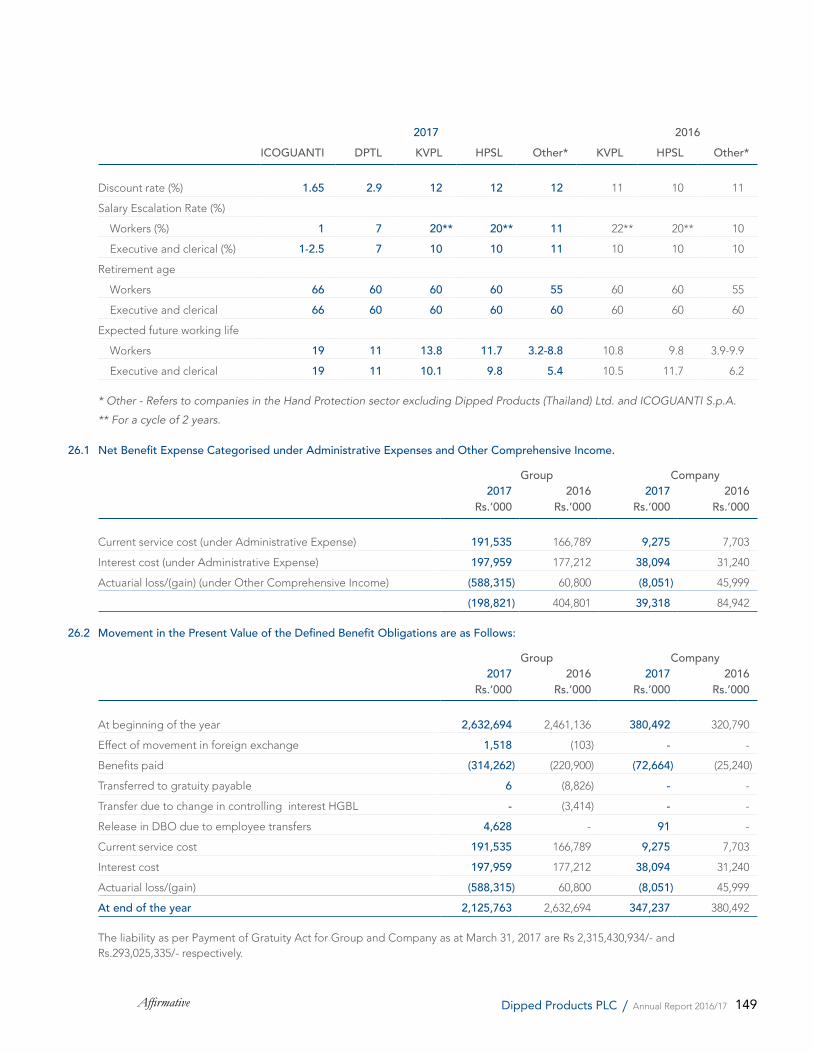
149Affirmative Dipped Products PLC / Annual Report 2016/17
2017 2016ICOGUANTI DPTL KVPL HPSL Other* KVPL HPSL Other*
Discount rate (%) 1.65 2.9 12 12 12 11 10 11
Salary Escalation Rate (%)
Workers (%) 1 7 20** 20** 11 22** 20** 10
Executive and clerical (%) 1-2.5 7 10 10 11 10 10 10
Retirement age
Workers 66 60 60 60 55 60 60 55
Executive and clerical 66 60 60 60 60 60 60 60
Expected future working life
Workers 19 11 13.8 11.7 3.2-8.8 10.8 9.8 3.9-9.9
Executive and clerical 19 11 10.1 9.8 5.4 10.5 11.7 6.2
* Other - Refers to companies in the Hand Protection sector excluding Dipped Products (Thailand) Ltd. and ICOGUANTI S.p.A.
** For a cycle of 2 years.
26.1 Net Benefit Expense Categorised under Administrative Expenses and Other Comprehensive Income.
Group Company2017 2016 2017 2016
Rs.’000 Rs.’000 Rs.’000 Rs.’000
Current service cost (under Administrative Expense) 191,535 166,789 9,275 7,703
Interest cost (under Administrative Expense) 197,959 177,212 38,094 31,240
Actuarial loss/(gain) (under Other Comprehensive Income) (588,315) 60,800 (8,051) 45,999
(198,821) 404,801 39,318 84,942
26.2 Movement in the Present Value of the Defined Benefit Obligations are as Follows:
Group Company2017 2016 2017 2016
Rs.’000 Rs.’000 Rs.’000 Rs.’000
At beginning of the year 2,632,694 2,461,136 380,492 320,790
Effect of movement in foreign exchange 1,518 (103) - -
Benefits paid (314,262) (220,900) (72,664) (25,240)
Transferred to gratuity payable 6 (8,826) - -
Transfer due to change in controlling interest HGBL - (3,414) - -
Release in DBO due to employee transfers 4,628 - 91 -
Current service cost 191,535 166,789 9,275 7,703
Interest cost 197,959 177,212 38,094 31,240
Actuarial loss/(gain) (588,315) 60,800 (8,051) 45,999
At end of the year 2,125,763 2,632,694 347,237 380,492
The liability as per Payment of Gratuity Act for Group and Company as at March 31, 2017 are Rs 2,315,430,934/- and Rs.293,025,335/- respectively.
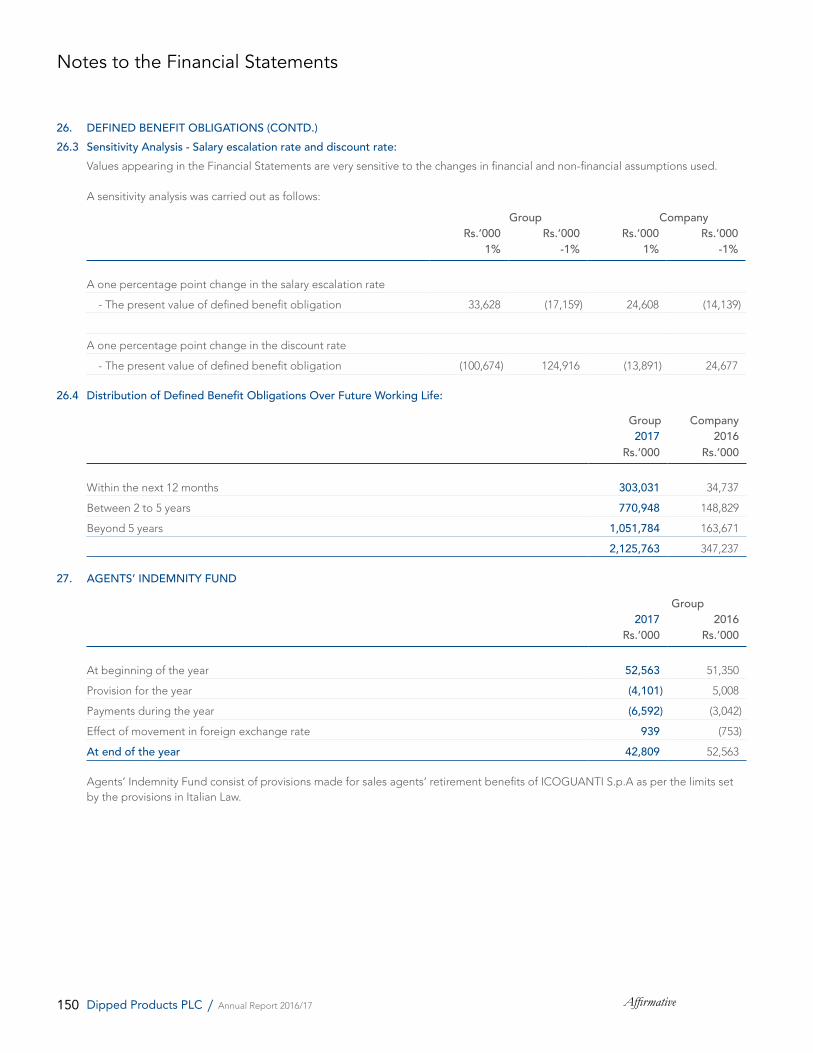
150 AffirmativeDipped Products PLC / Annual Report 2016/17
26. DEFINED BENEFIT OBLIGATIONS (CONTD.)26.3 Sensitivity Analysis - Salary escalation rate and discount rate: Values appearing in the Financial Statements are very sensitive to the changes in financial and non-financial assumptions used.
A sensitivity analysis was carried out as follows:
Group CompanyRs.’000 Rs.’000 Rs.’000 Rs.’000
1% -1% 1% -1%
A one percentage point change in the salary escalation rate
- The present value of defined benefit obligation 33,628 (17,159) 24,608 (14,139)
A one percentage point change in the discount rate
- The present value of defined benefit obligation (100,674) 124,916 (13,891) 24,677
26.4 Distribution of Defined Benefit Obligations Over Future Working Life:
Group Company2017 2016
Rs.’000 Rs.’000
Within the next 12 months 303,031 34,737
Between 2 to 5 years 770,948 148,829
Beyond 5 years 1,051,784 163,671
2,125,763 347,237
27. AGENTS’ INDEMNITY FUND
Group2017 2016
Rs.’000 Rs.’000
At beginning of the year 52,563 51,350
Provision for the year (4,101) 5,008
Payments during the year (6,592) (3,042)
Effect of movement in foreign exchange rate 939 (753)
At end of the year 42,809 52,563
Agents’ Indemnity Fund consist of provisions made for sales agents’ retirement benefits of ICOGUANTI S.p.A as per the limits set by the provisions in Italian Law.
Notes to the Financial Statements
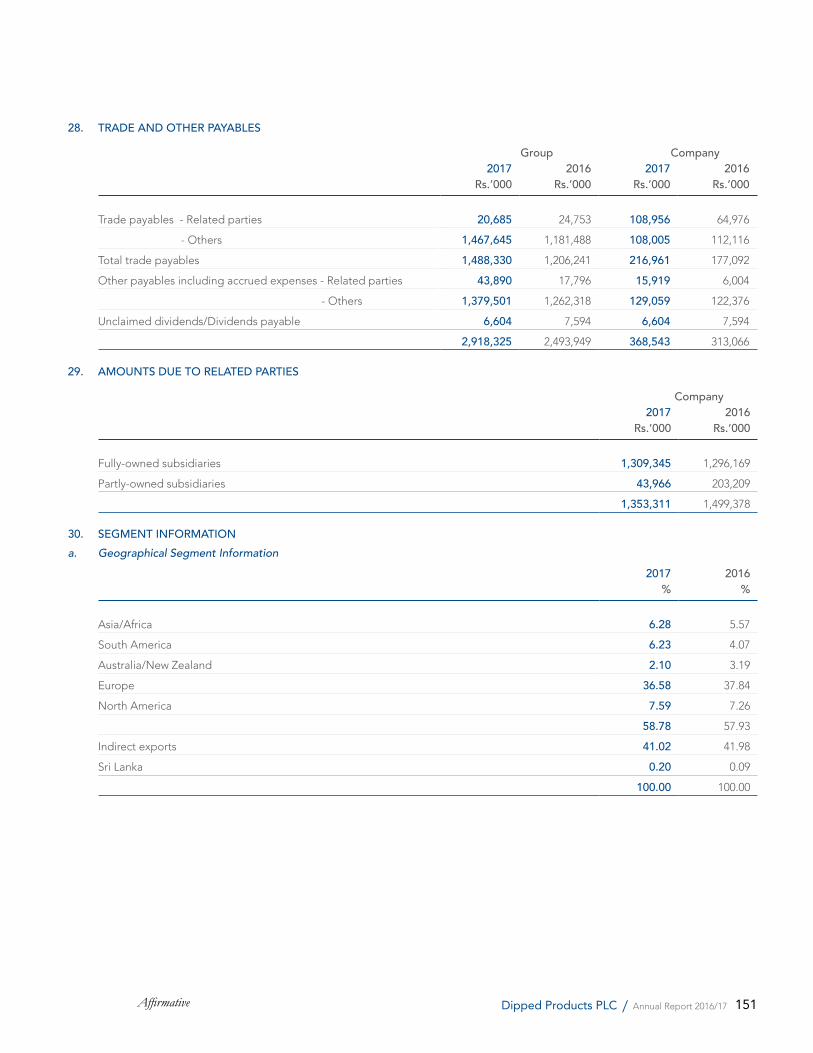
151Affirmative Dipped Products PLC / Annual Report 2016/17
28. TRADE AND OTHER PAYABLES
Group Company2017 2016 2017 2016
Rs.’000 Rs.’000 Rs.’000 Rs.’000
Trade payables - Related parties 20,685 24,753 108,956 64,976
- Others 1,467,645 1,181,488 108,005 112,116
Total trade payables 1,488,330 1,206,241 216,961 177,092
Other payables including accrued expenses - Related parties 43,890 17,796 15,919 6,004
- Others 1,379,501 1,262,318 129,059 122,376
Unclaimed dividends/Dividends payable 6,604 7,594 6,604 7,594
2,918,325 2,493,949 368,543 313,066
29. AMOUNTS DUE TO RELATED PARTIES
Company2017 2016
Rs.’000 Rs.’000
Fully-owned subsidiaries 1,309,345 1,296,169
Partly-owned subsidiaries 43,966 203,209
1,353,311 1,499,378
30. SEGMENT INFORMATIONa. Geographical Segment Information
2017 2016% %
Asia/Africa 6.28 5.57
South America 6.23 4.07
Australia/New Zealand 2.10 3.19
Europe 36.58 37.84
North America 7.59 7.26
58.78 57.93
Indirect exports 41.02 41.98
Sri Lanka 0.20 0.09
100.00 100.00
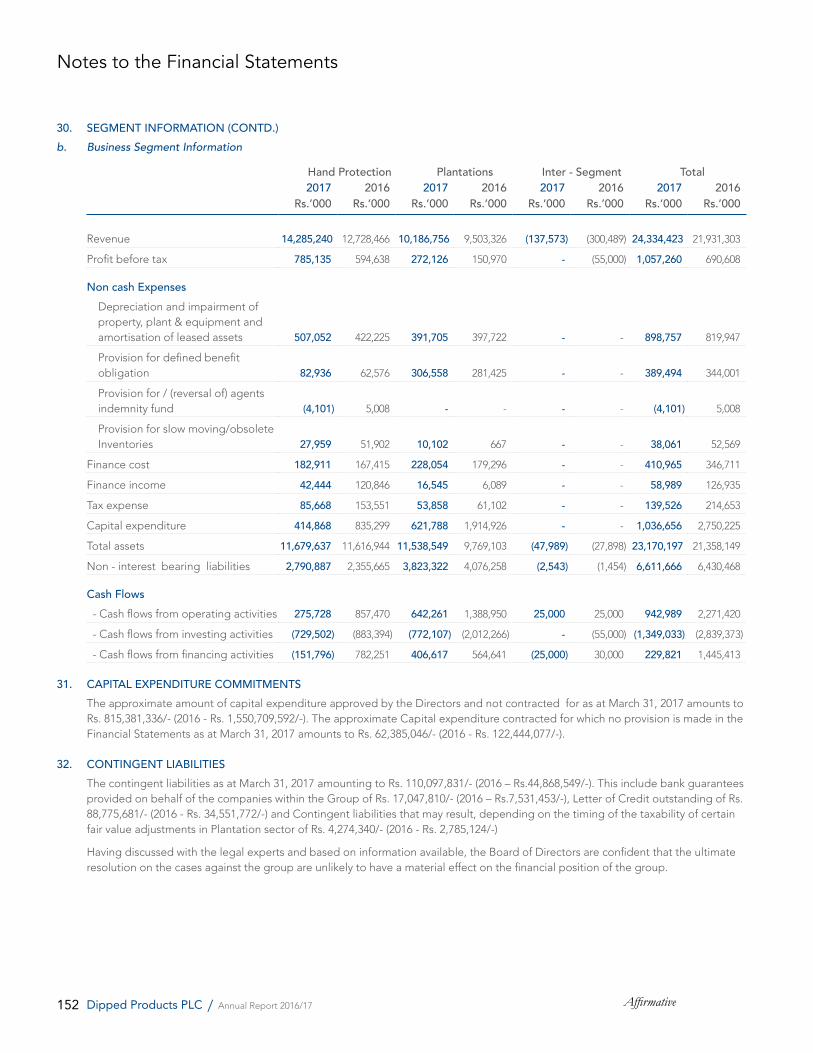
152 AffirmativeDipped Products PLC / Annual Report 2016/17
30. SEGMENT INFORMATION (CONTD.)b. Business Segment Information
Hand Protection Plantations Inter - Segment Total 2017 2016 2017 2016 2017 2016 2017 2016
Rs.’000 Rs.’000 Rs.’000 Rs.’000 Rs.’000 Rs.’000 Rs.’000 Rs.’000
Revenue 14,285,240 12,728,466 10,186,756 9,503,326 (137,573) (300,489) 24,334,423 21,931,303
Profit before tax 785,135 594,638 272,126 150,970 - (55,000) 1,057,260 690,608
Non cash Expenses Depreciation and impairment of
property, plant & equipment and amortisation of leased assets 507,052 422,225 391,705 397,722 - - 898,757 819,947
Provision for defined benefit obligation 82,936 62,576 306,558 281,425 - - 389,494 344,001
Provision for / (reversal of) agents indemnity fund (4,101) 5,008 - - - - (4,101) 5,008
Provision for slow moving/obsolete Inventories 27,959 51,902 10,102 667 - - 38,061 52,569
Finance cost 182,911 167,415 228,054 179,296 - - 410,965 346,711
Finance income 42,444 120,846 16,545 6,089 - - 58,989 126,935
Tax expense 85,668 153,551 53,858 61,102 - - 139,526 214,653
Capital expenditure 414,868 835,299 621,788 1,914,926 - - 1,036,656 2,750,225
Total assets 11,679,637 11,616,944 11,538,549 9,769,103 (47,989) (27,898) 23,170,197 21,358,149
Non - interest bearing liabilities 2,790,887 2,355,665 3,823,322 4,076,258 (2,543) (1,454) 6,611,666 6,430,468
Cash Flows - Cash flows from operating activities 275,728 857,470 642,261 1,388,950 25,000 25,000 942,989 2,271,420
- Cash flows from investing activities (729,502) (883,394) (772,107) (2,012,266) - (55,000) (1,349,033) (2,839,373)
- Cash flows from financing activities (151,796) 782,251 406,617 564,641 (25,000) 30,000 229,821 1,445,413
31. CAPITAL EXPENDITURE COMMITMENTS The approximate amount of capital expenditure approved by the Directors and not contracted for as at March 31, 2017 amounts to
Rs. 815,381,336/- (2016 - Rs. 1,550,709,592/-). The approximate Capital expenditure contracted for which no provision is made in the Financial Statements as at March 31, 2017 amounts to Rs. 62,385,046/- (2016 - Rs. 122,444,077/-).
32. CONTINGENT LIABILITIES The contingent liabilities as at March 31, 2017 amounting to Rs. 110,097,831/- (2016 – Rs.44,868,549/-). This include bank guarantees
provided on behalf of the companies within the Group of Rs. 17,047,810/- (2016 – Rs.7,531,453/-), Letter of Credit outstanding of Rs. 88,775,681/- (2016 - Rs. 34,551,772/-) and Contingent liabilities that may result, depending on the timing of the taxability of certain fair value adjustments in Plantation sector of Rs. 4,274,340/- (2016 - Rs. 2,785,124/-)
Having discussed with the legal experts and based on information available, the Board of Directors are confident that the ultimate resolution on the cases against the group are unlikely to have a material effect on the financial position of the group.
Notes to the Financial Statements
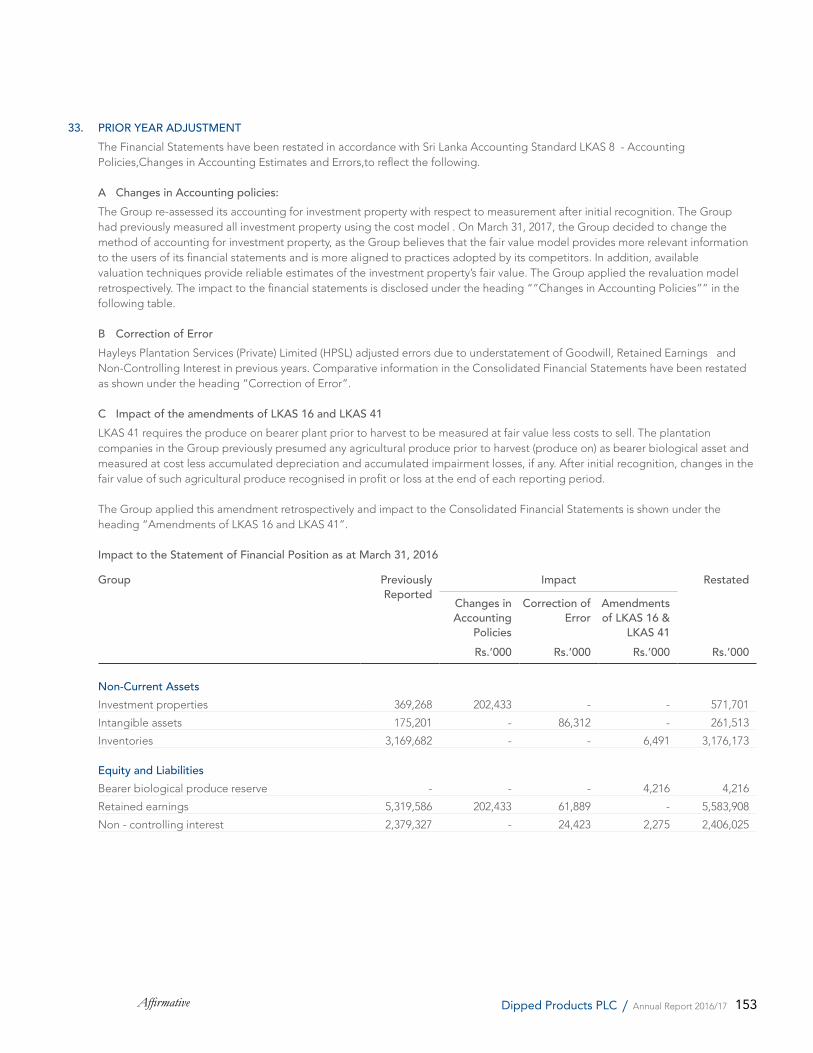
153Affirmative Dipped Products PLC / Annual Report 2016/17
33. PRIOR YEAR ADJUSTMENT The Financial Statements have been restated in accordance with Sri Lanka Accounting Standard LKAS 8 - Accounting
Policies,Changes in Accounting Estimates and Errors,to reflect the following.
A Changes in Accounting policies: The Group re-assessed its accounting for investment property with respect to measurement after initial recognition. The Group
had previously measured all investment property using the cost model . On March 31, 2017, the Group decided to change the method of accounting for investment property, as the Group believes that the fair value model provides more relevant information to the users of its financial statements and is more aligned to practices adopted by its competitors. In addition, available valuation techniques provide reliable estimates of the investment property’s fair value. The Group applied the revaluation model retrospectively. The impact to the financial statements is disclosed under the heading “”Changes in Accounting Policies”” in the following table.
B Correction of Error Hayleys Plantation Services (Private) Limited (HPSL) adjusted errors due to understatement of Goodwill, Retained Earnings and
Non-Controlling Interest in previous years. Comparative information in the Consolidated Financial Statements have been restated as shown under the heading “Correction of Error”.
C Impact of the amendments of LKAS 16 and LKAS 41 LKAS 41 requires the produce on bearer plant prior to harvest to be measured at fair value less costs to sell. The plantation
companies in the Group previously presumed any agricultural produce prior to harvest (produce on) as bearer biological asset and measured at cost less accumulated depreciation and accumulated impairment losses, if any. After initial recognition, changes in the fair value of such agricultural produce recognised in profit or loss at the end of each reporting period.
The Group applied this amendment retrospectively and impact to the Consolidated Financial Statements is shown under the heading “Amendments of LKAS 16 and LKAS 41”.
Impact to the Statement of Financial Position as at March 31, 2016
Group Previously Reported
Impact Restated
Changes in Accounting
Policies
Correction of Error
Amendments of LKAS 16 &
LKAS 41 Rs.’000 Rs.’000 Rs.’000 Rs.’000
Non-Current AssetsInvestment properties 369,268 202,433 - - 571,701
Intangible assets 175,201 - 86,312 - 261,513
Inventories 3,169,682 - - 6,491 3,176,173
Equity and LiabilitiesBearer biological produce reserve - - - 4,216 4,216
Retained earnings 5,319,586 202,433 61,889 - 5,583,908
Non - controlling interest 2,379,327 - 24,423 2,275 2,406,025
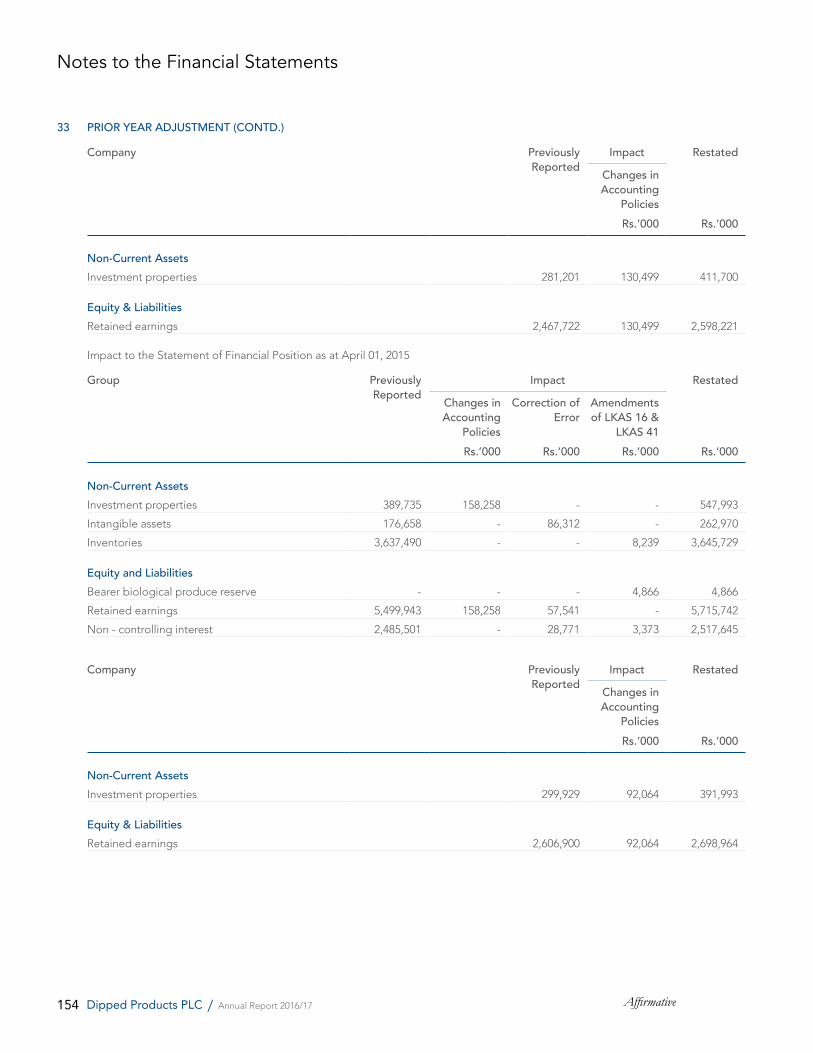
154 AffirmativeDipped Products PLC / Annual Report 2016/17
33 PRIOR YEAR ADJUSTMENT (CONTD.)
Company Previously Reported
Impact RestatedChanges in Accounting
PoliciesRs.’000 Rs.’000
Non-Current AssetsInvestment properties 281,201 130,499 411,700
Equity & LiabilitiesRetained earnings 2,467,722 130,499 2,598,221
Impact to the Statement of Financial Position as at April 01, 2015
Group Previously Reported
Impact RestatedChanges in Accounting
Policies
Correction of Error
Amendments of LKAS 16 &
LKAS 41 Rs.’000 Rs.’000 Rs.’000 Rs.’000
Non-Current AssetsInvestment properties 389,735 158,258 - - 547,993
Intangible assets 176,658 - 86,312 - 262,970
Inventories 3,637,490 - - 8,239 3,645,729
Equity and LiabilitiesBearer biological produce reserve - - - 4,866 4,866
Retained earnings 5,499,943 158,258 57,541 - 5,715,742
Non - controlling interest 2,485,501 - 28,771 3,373 2,517,645
Company Previously Reported
Impact RestatedChanges in Accounting
PoliciesRs.’000 Rs.’000
Non-Current AssetsInvestment properties 299,929 92,064 391,993
Equity & LiabilitiesRetained earnings 2,606,900 92,064 2,698,964
Notes to the Financial Statements
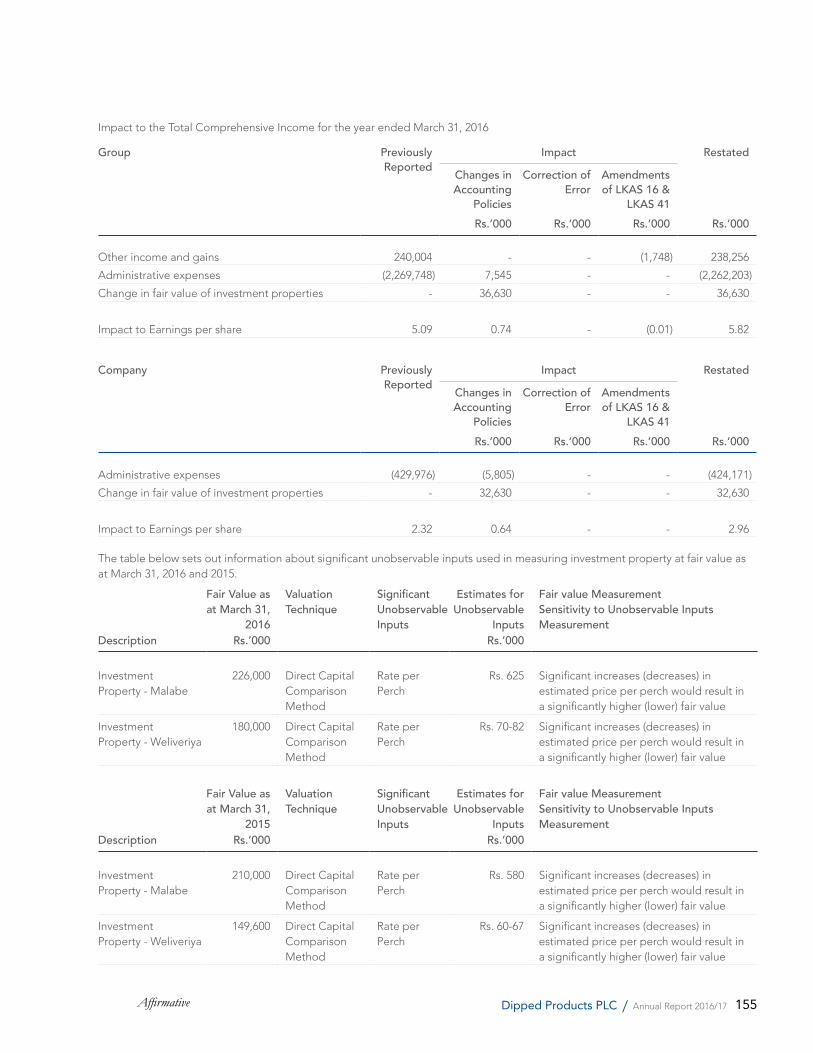
155Affirmative Dipped Products PLC / Annual Report 2016/17
Impact to the Total Comprehensive Income for the year ended March 31, 2016
Group Previously Reported
Impact RestatedChanges in Accounting
Policies
Correction of Error
Amendments of LKAS 16 &
LKAS 41 Rs.’000 Rs.’000 Rs.’000 Rs.’000
Other income and gains 240,004 - - (1,748) 238,256
Administrative expenses (2,269,748) 7,545 - - (2,262,203)
Change in fair value of investment properties - 36,630 - - 36,630
Impact to Earnings per share 5.09 0.74 - (0.01) 5.82
Company Previously Reported
Impact RestatedChanges in Accounting
Policies
Correction of Error
Amendments of LKAS 16 &
LKAS 41 Rs.’000 Rs.’000 Rs.’000 Rs.’000
Administrative expenses (429,976) (5,805) - - (424,171)
Change in fair value of investment properties - 32,630 - - 32,630
Impact to Earnings per share 2.32 0.64 - - 2.96
The table below sets out information about significant unobservable inputs used in measuring investment property at fair value as at March 31, 2016 and 2015.
Fair Value as at March 31,
2016
ValuationTechnique
SignificantUnobservableInputs
Estimates forUnobservable
Inputs
Fair value Measurement Sensitivity to Unobservable Inputs Measurement
Description Rs.’000 Rs.’000
Investment Property - Malabe
226,000 Direct CapitalComparisonMethod
Rate per Perch
Rs. 625 Significant increases (decreases) in estimated price per perch would result in a significantly higher (lower) fair value
Investment Property - Weliveriya
180,000 Direct CapitalComparisonMethod
Rate per Perch
Rs. 70-82 Significant increases (decreases) in estimated price per perch would result in a significantly higher (lower) fair value
Fair Value as at March 31,
2015
ValuationTechnique
SignificantUnobservableInputs
Estimates forUnobservable
Inputs
Fair value Measurement Sensitivity to Unobservable Inputs Measurement
Description Rs.’000 Rs.’000
Investment Property - Malabe
210,000 Direct CapitalComparisonMethod
Rate per Perch
Rs. 580 Significant increases (decreases) in estimated price per perch would result in a significantly higher (lower) fair value
Investment Property - Weliveriya
149,600 Direct CapitalComparisonMethod
Rate per Perch
Rs. 60-67 Significant increases (decreases) in estimated price per perch would result in a significantly higher (lower) fair value
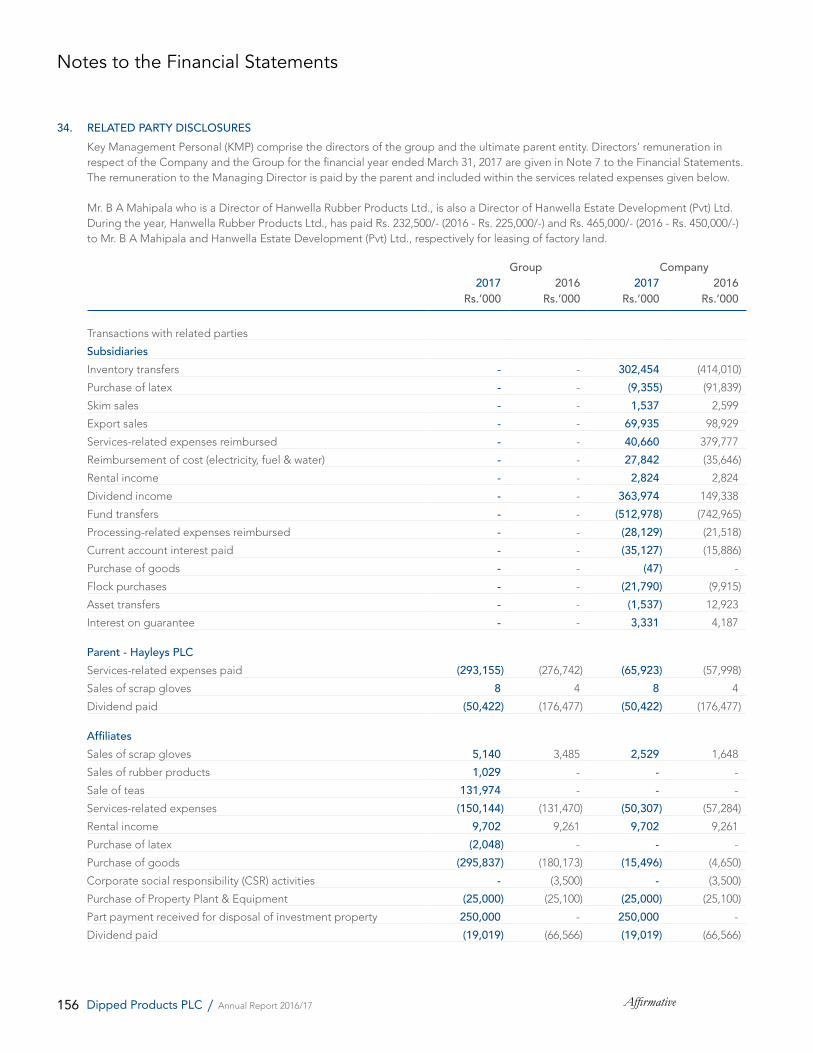
156 AffirmativeDipped Products PLC / Annual Report 2016/17
34. RELATED PARTY DISCLOSURES Key Management Personal (KMP) comprise the directors of the group and the ultimate parent entity. Directors’ remuneration in
respect of the Company and the Group for the financial year ended March 31, 2017 are given in Note 7 to the Financial Statements. The remuneration to the Managing Director is paid by the parent and included within the services related expenses given below.
Mr. B A Mahipala who is a Director of Hanwella Rubber Products Ltd., is also a Director of Hanwella Estate Development (Pvt) Ltd. During the year, Hanwella Rubber Products Ltd., has paid Rs. 232,500/- (2016 - Rs. 225,000/-) and Rs. 465,000/- (2016 - Rs. 450,000/-) to Mr. B A Mahipala and Hanwella Estate Development (Pvt) Ltd., respectively for leasing of factory land.
Group Company2017 2016 2017 2016
Rs.’000 Rs.’000 Rs.’000 Rs.’000
Transactions with related parties
SubsidiariesInventory transfers - - 302,454 (414,010)
Purchase of latex - - (9,355) (91,839)
Skim sales - - 1,537 2,599
Export sales - - 69,935 98,929
Services-related expenses reimbursed - - 40,660 379,777
Reimbursement of cost (electricity, fuel & water) - - 27,842 (35,646)
Rental income - - 2,824 2,824
Dividend income - - 363,974 149,338
Fund transfers - - (512,978) (742,965)
Processing-related expenses reimbursed - - (28,129) (21,518)
Current account interest paid - - (35,127) (15,886)
Purchase of goods - - (47) -
Flock purchases - - (21,790) (9,915)
Asset transfers - - (1,537) 12,923
Interest on guarantee - - 3,331 4,187
Parent - Hayleys PLCServices-related expenses paid (293,155) (276,742) (65,923) (57,998)
Sales of scrap gloves 8 4 8 4
Dividend paid (50,422) (176,477) (50,422) (176,477)
AffiliatesSales of scrap gloves 5,140 3,485 2,529 1,648
Sales of rubber products 1,029 - - -
Sale of teas 131,974 - - -
Services-related expenses (150,144) (131,470) (50,307) (57,284)
Rental income 9,702 9,261 9,702 9,261
Purchase of latex (2,048) - - -
Purchase of goods (295,837) (180,173) (15,496) (4,650)
Corporate social responsibility (CSR) activities - (3,500) - (3,500)
Purchase of Property Plant & Equipment (25,000) (25,100) (25,000) (25,100)
Part payment received for disposal of investment property 250,000 - 250,000 -
Dividend paid (19,019) (66,566) (19,019) (66,566)
Notes to the Financial Statements
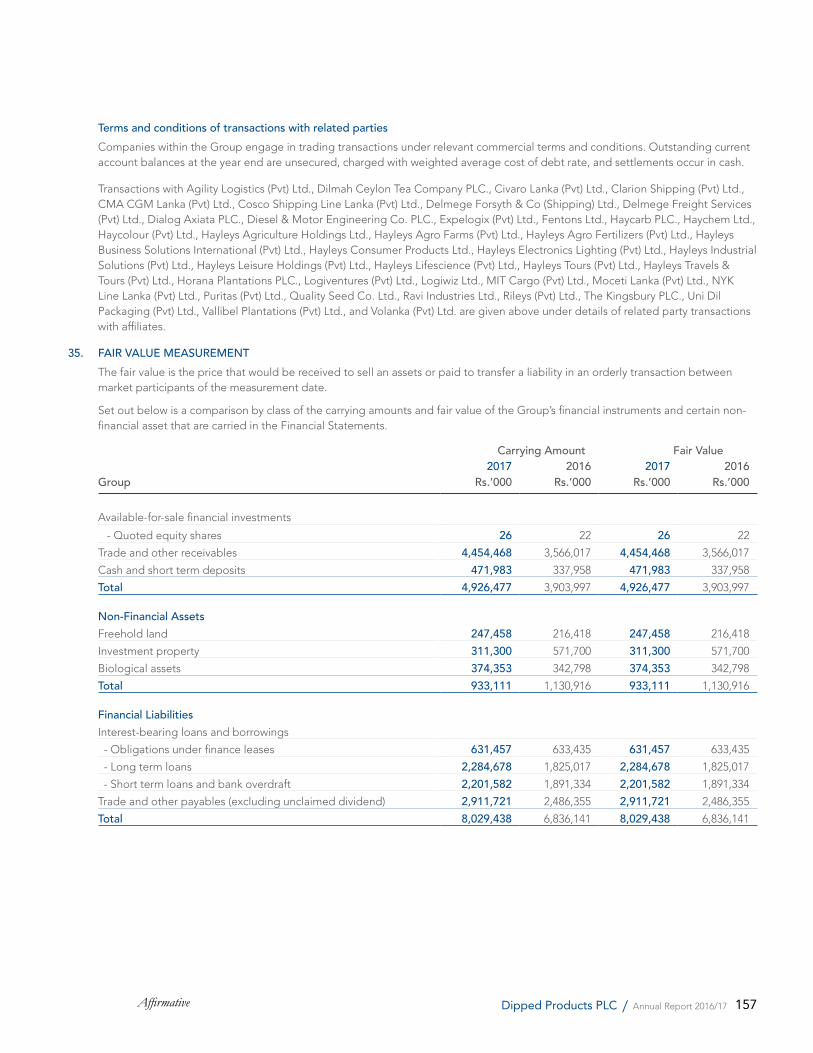
157Affirmative Dipped Products PLC / Annual Report 2016/17
Terms and conditions of transactions with related parties Companies within the Group engage in trading transactions under relevant commercial terms and conditions. Outstanding current
account balances at the year end are unsecured, charged with weighted average cost of debt rate, and settlements occur in cash.
Transactions with Agility Logistics (Pvt) Ltd., Dilmah Ceylon Tea Company PLC., Civaro Lanka (Pvt) Ltd., Clarion Shipping (Pvt) Ltd., CMA CGM Lanka (Pvt) Ltd., Cosco Shipping Line Lanka (Pvt) Ltd., Delmege Forsyth & Co (Shipping) Ltd., Delmege Freight Services (Pvt) Ltd., Dialog Axiata PLC., Diesel & Motor Engineering Co. PLC., Expelogix (Pvt) Ltd., Fentons Ltd., Haycarb PLC., Haychem Ltd., Haycolour (Pvt) Ltd., Hayleys Agriculture Holdings Ltd., Hayleys Agro Farms (Pvt) Ltd., Hayleys Agro Fertilizers (Pvt) Ltd., Hayleys Business Solutions International (Pvt) Ltd., Hayleys Consumer Products Ltd., Hayleys Electronics Lighting (Pvt) Ltd., Hayleys Industrial Solutions (Pvt) Ltd., Hayleys Leisure Holdings (Pvt) Ltd., Hayleys Lifescience (Pvt) Ltd., Hayleys Tours (Pvt) Ltd., Hayleys Travels & Tours (Pvt) Ltd., Horana Plantations PLC., Logiventures (Pvt) Ltd., Logiwiz Ltd., MIT Cargo (Pvt) Ltd., Moceti Lanka (Pvt) Ltd., NYK Line Lanka (Pvt) Ltd., Puritas (Pvt) Ltd., Quality Seed Co. Ltd., Ravi Industries Ltd., Rileys (Pvt) Ltd., The Kingsbury PLC., Uni Dil Packaging (Pvt) Ltd., Vallibel Plantations (Pvt) Ltd., and Volanka (Pvt) Ltd. are given above under details of related party transactions with affiliates.
35. FAIR VALUE MEASUREMENT The fair value is the price that would be received to sell an assets or paid to transfer a liability in an orderly transaction between
market participants of the measurement date.
Set out below is a comparison by class of the carrying amounts and fair value of the Group’s financial instruments and certain non-financial asset that are carried in the Financial Statements.
Carrying Amount Fair Value2017 2016 2017 2016
Group Rs.’000 Rs.’000 Rs.’000 Rs.’000
Available-for-sale financial investments
- Quoted equity shares 26 22 26 22
Trade and other receivables 4,454,468 3,566,017 4,454,468 3,566,017
Cash and short term deposits 471,983 337,958 471,983 337,958
Total 4,926,477 3,903,997 4,926,477 3,903,997
Non-Financial AssetsFreehold land 247,458 216,418 247,458 216,418
Investment property 311,300 571,700 311,300 571,700
Biological assets 374,353 342,798 374,353 342,798
Total 933,111 1,130,916 933,111 1,130,916
Financial LiabilitiesInterest-bearing loans and borrowings
- Obligations under finance leases 631,457 633,435 631,457 633,435
- Long term loans 2,284,678 1,825,017 2,284,678 1,825,017
- Short term loans and bank overdraft 2,201,582 1,891,334 2,201,582 1,891,334
Trade and other payables (excluding unclaimed dividend) 2,911,721 2,486,355 2,911,721 2,486,355
Total 8,029,438 6,836,141 8,029,438 6,836,141
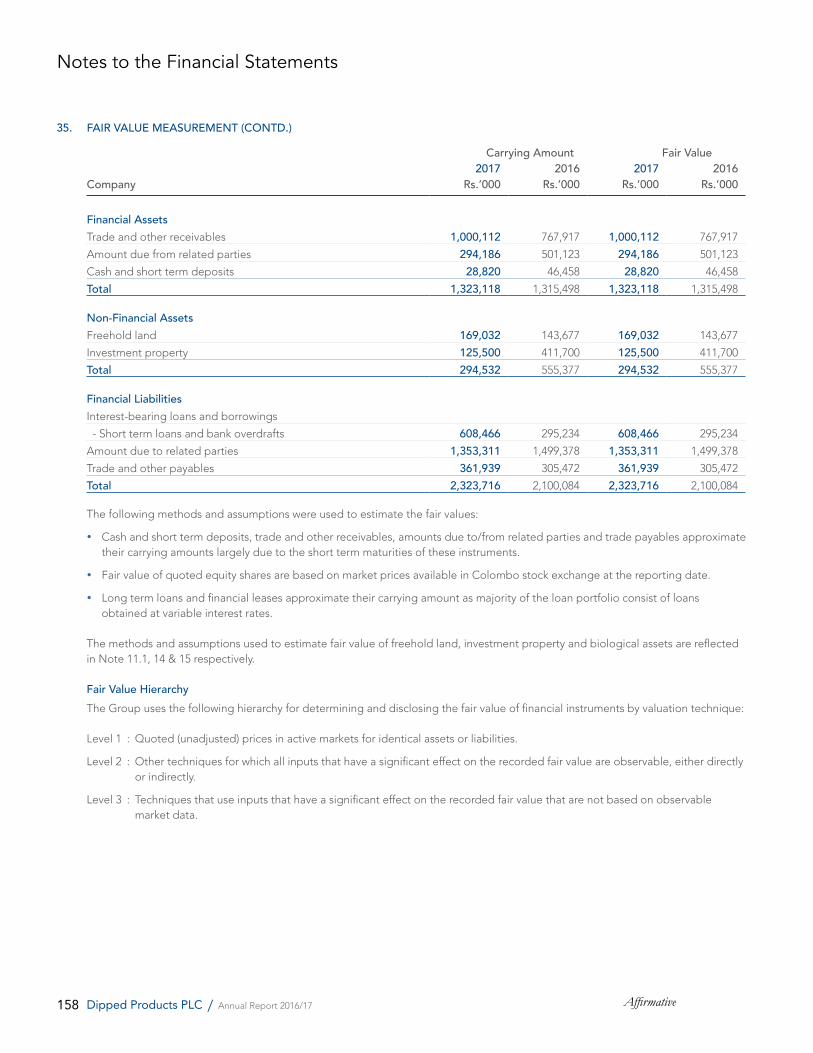
158 AffirmativeDipped Products PLC / Annual Report 2016/17
35. FAIR VALUE MEASUREMENT (CONTD.)
Carrying Amount Fair Value2017 2016 2017 2016
Company Rs.’000 Rs.’000 Rs.’000 Rs.’000
Financial AssetsTrade and other receivables 1,000,112 767,917 1,000,112 767,917
Amount due from related parties 294,186 501,123 294,186 501,123
Cash and short term deposits 28,820 46,458 28,820 46,458
Total 1,323,118 1,315,498 1,323,118 1,315,498
Non-Financial AssetsFreehold land 169,032 143,677 169,032 143,677
Investment property 125,500 411,700 125,500 411,700
Total 294,532 555,377 294,532 555,377
Financial LiabilitiesInterest-bearing loans and borrowings
- Short term loans and bank overdrafts 608,466 295,234 608,466 295,234
Amount due to related parties 1,353,311 1,499,378 1,353,311 1,499,378
Trade and other payables 361,939 305,472 361,939 305,472
Total 2,323,716 2,100,084 2,323,716 2,100,084
The following methods and assumptions were used to estimate the fair values:
Cash and short term deposits, trade and other receivables, amounts due to/from related parties and trade payables approximate their carrying amounts largely due to the short term maturities of these instruments.
Fair value of quoted equity shares are based on market prices available in Colombo stock exchange at the reporting date.
Long term loans and financial leases approximate their carrying amount as majority of the loan portfolio consist of loans obtained at variable interest rates.
The methods and assumptions used to estimate fair value of freehold land, investment property and biological assets are reflected in Note 11.1, 14 & 15 respectively.
Fair Value Hierarchy The Group uses the following hierarchy for determining and disclosing the fair value of financial instruments by valuation technique:
Level 1 : Quoted (unadjusted) prices in active markets for identical assets or liabilities.
Level 2 : Other techniques for which all inputs that have a significant effect on the recorded fair value are observable, either directly or indirectly.
Level 3 : Techniques that use inputs that have a significant effect on the recorded fair value that are not based on observable market data.
Notes to the Financial Statements
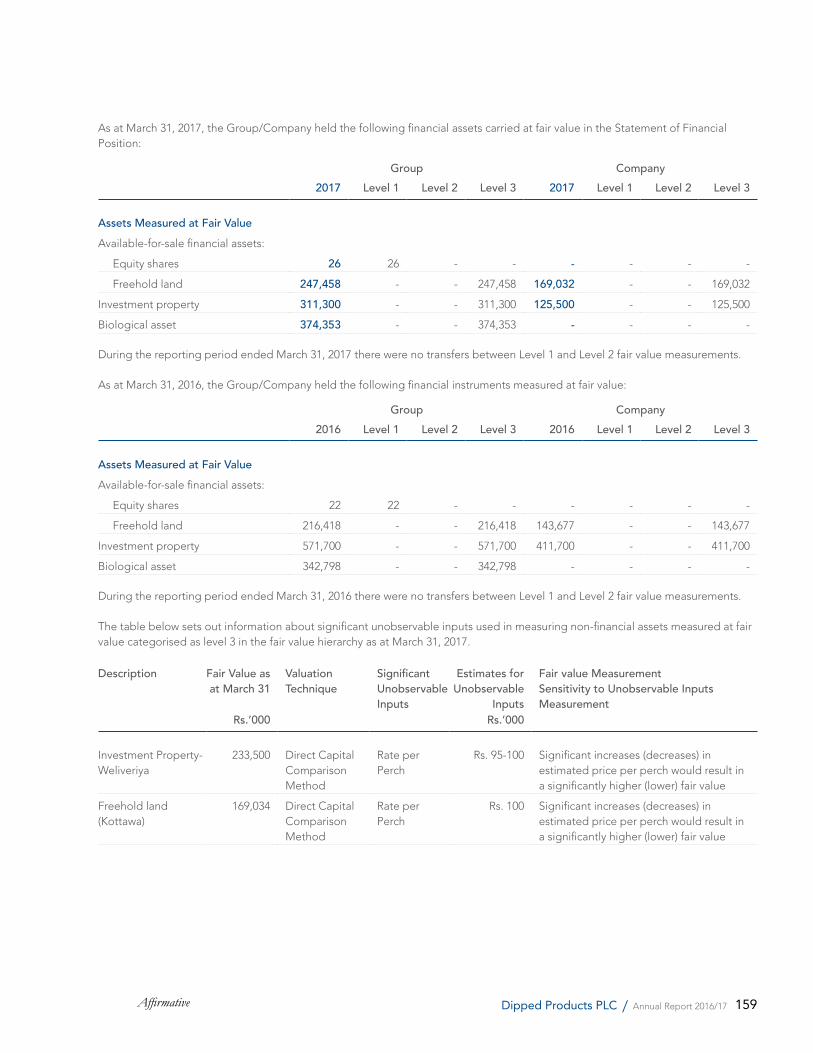
159Affirmative Dipped Products PLC / Annual Report 2016/17
As at March 31, 2017, the Group/Company held the following financial assets carried at fair value in the Statement of Financial Position:
Group Company2017 Level 1 Level 2 Level 3 2017 Level 1 Level 2 Level 3
Assets Measured at Fair ValueAvailable-for-sale financial assets:
Equity shares 26 26 - - - - - -
Freehold land 247,458 - - 247,458 169,032 - - 169,032
Investment property 311,300 - - 311,300 125,500 - - 125,500
Biological asset 374,353 - - 374,353 - - - -
During the reporting period ended March 31, 2017 there were no transfers between Level 1 and Level 2 fair value measurements.
As at March 31, 2016, the Group/Company held the following financial instruments measured at fair value:
Group Company2016 Level 1 Level 2 Level 3 2016 Level 1 Level 2 Level 3
Assets Measured at Fair ValueAvailable-for-sale financial assets:
Equity shares 22 22 - - - - - -
Freehold land 216,418 - - 216,418 143,677 - - 143,677
Investment property 571,700 - - 571,700 411,700 - - 411,700
Biological asset 342,798 - - 342,798 - - - -
During the reporting period ended March 31, 2016 there were no transfers between Level 1 and Level 2 fair value measurements.
The table below sets out information about significant unobservable inputs used in measuring non-financial assets measured at fair value categorised as level 3 in the fair value hierarchy as at March 31, 2017.
Description Fair Value as at March 31
ValuationTechnique
SignificantUnobservableInputs
Estimates forUnobservable
Inputs
Fair value Measurement Sensitivity to Unobservable Inputs Measurement
Rs.’000 Rs.’000
Investment Property- Weliveriya
233,500 Direct CapitalComparisonMethod
Rate per Perch
Rs. 95-100 Significant increases (decreases) in estimated price per perch would result in a significantly higher (lower) fair value
Freehold land (Kottawa)
169,034 Direct CapitalComparisonMethod
Rate per Perch
Rs. 100 Significant increases (decreases) in estimated price per perch would result in a significantly higher (lower) fair value
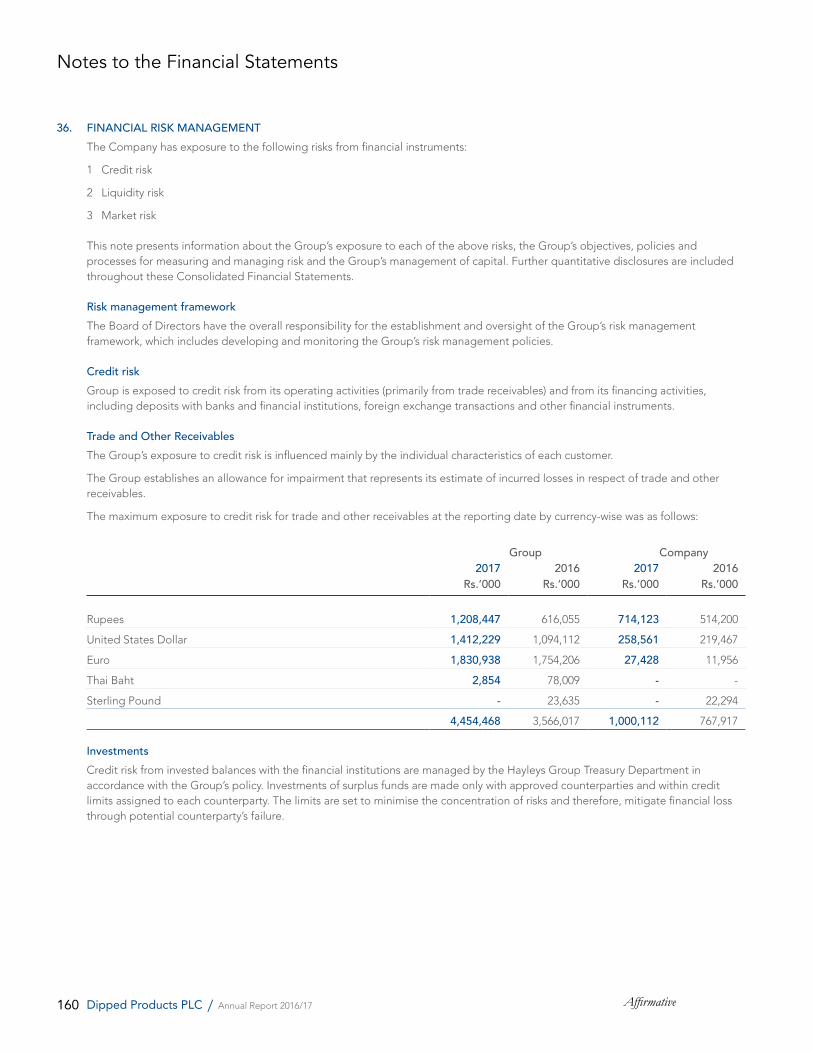
160 AffirmativeDipped Products PLC / Annual Report 2016/17
36. FINANCIAL RISK MANAGEMENT The Company has exposure to the following risks from financial instruments:
1 Credit risk
2 Liquidity risk
3 Market risk
This note presents information about the Group’s exposure to each of the above risks, the Group’s objectives, policies and processes for measuring and managing risk and the Group’s management of capital. Further quantitative disclosures are included throughout these Consolidated Financial Statements.
Risk management framework The Board of Directors have the overall responsibility for the establishment and oversight of the Group’s risk management
framework, which includes developing and monitoring the Group’s risk management policies.
Credit risk Group is exposed to credit risk from its operating activities (primarily from trade receivables) and from its financing activities,
including deposits with banks and financial institutions, foreign exchange transactions and other financial instruments.
Trade and Other Receivables The Group’s exposure to credit risk is influenced mainly by the individual characteristics of each customer.
The Group establishes an allowance for impairment that represents its estimate of incurred losses in respect of trade and other receivables.
The maximum exposure to credit risk for trade and other receivables at the reporting date by currency-wise was as follows:
Group Company2017 2016 2017 2016
Rs.’000 Rs.’000 Rs.’000 Rs.’000
Rupees 1,208,447 616,055 714,123 514,200
United States Dollar 1,412,229 1,094,112 258,561 219,467
Euro 1,830,938 1,754,206 27,428 11,956
Thai Baht 2,854 78,009 - -
Sterling Pound - 23,635 - 22,294
4,454,468 3,566,017 1,000,112 767,917
Investments Credit risk from invested balances with the financial institutions are managed by the Hayleys Group Treasury Department in
accordance with the Group’s policy. Investments of surplus funds are made only with approved counterparties and within credit limits assigned to each counterparty. The limits are set to minimise the concentration of risks and therefore, mitigate financial loss through potential counterparty’s failure.
Notes to the Financial Statements
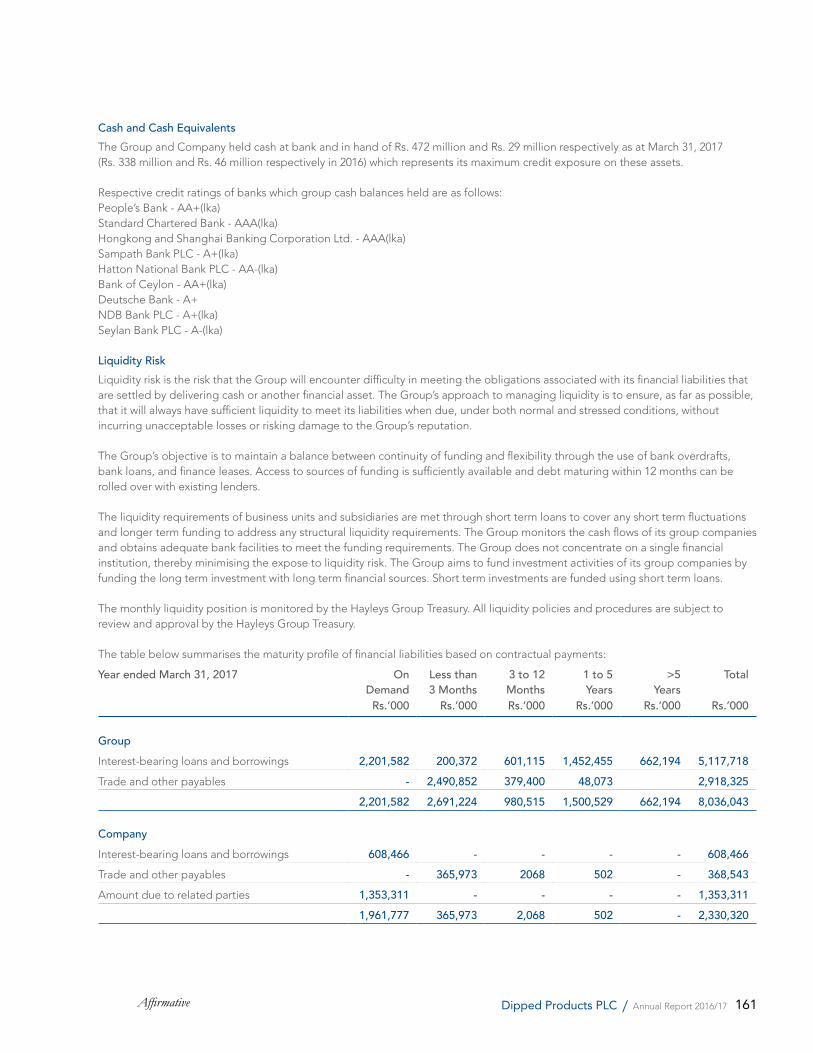
161Affirmative Dipped Products PLC / Annual Report 2016/17
Cash and Cash Equivalents The Group and Company held cash at bank and in hand of Rs. 472 million and Rs. 29 million respectively as at March 31, 2017
(Rs. 338 million and Rs. 46 million respectively in 2016) which represents its maximum credit exposure on these assets.
Respective credit ratings of banks which group cash balances held are as follows: People’s Bank - AA+(lka) Standard Chartered Bank - AAA(lka) Hongkong and Shanghai Banking Corporation Ltd. - AAA(lka) Sampath Bank PLC - A+(lka) Hatton National Bank PLC - AA-(lka) Bank of Ceylon - AA+(lka) Deutsche Bank - A+ NDB Bank PLC - A+(lka) Seylan Bank PLC - A-(lka)
Liquidity Risk Liquidity risk is the risk that the Group will encounter difficulty in meeting the obligations associated with its financial liabilities that
are settled by delivering cash or another financial asset. The Group’s approach to managing liquidity is to ensure, as far as possible, that it will always have sufficient liquidity to meet its liabilities when due, under both normal and stressed conditions, without incurring unacceptable losses or risking damage to the Group’s reputation.
The Group’s objective is to maintain a balance between continuity of funding and flexibility through the use of bank overdrafts, bank loans, and finance leases. Access to sources of funding is sufficiently available and debt maturing within 12 months can be rolled over with existing lenders.
The liquidity requirements of business units and subsidiaries are met through short term loans to cover any short term fluctuations and longer term funding to address any structural liquidity requirements. The Group monitors the cash flows of its group companies and obtains adequate bank facilities to meet the funding requirements. The Group does not concentrate on a single financial institution, thereby minimising the expose to liquidity risk. The Group aims to fund investment activities of its group companies by funding the long term investment with long term financial sources. Short term investments are funded using short term loans.
The monthly liquidity position is monitored by the Hayleys Group Treasury. All liquidity policies and procedures are subject to review and approval by the Hayleys Group Treasury.
The table below summarises the maturity profile of financial liabilities based on contractual payments:
Year ended March 31, 2017 On Demand
Less than 3 Months
3 to 12 Months
1 to 5 Years
>5 Years
Total
Rs.’000 Rs.’000 Rs.’000 Rs.’000 Rs.’000 Rs.’000
GroupInterest-bearing loans and borrowings 2,201,582 200,372 601,115 1,452,455 662,194 5,117,718Trade and other payables - 2,490,852 379,400 48,073 2,918,325
2,201,582 2,691,224 980,515 1,500,529 662,194 8,036,043
CompanyInterest-bearing loans and borrowings 608,466 - - - - 608,466Trade and other payables - 365,973 2068 502 - 368,543Amount due to related parties 1,353,311 - - - - 1,353,311
1,961,777 365,973 2,068 502 - 2,330,320
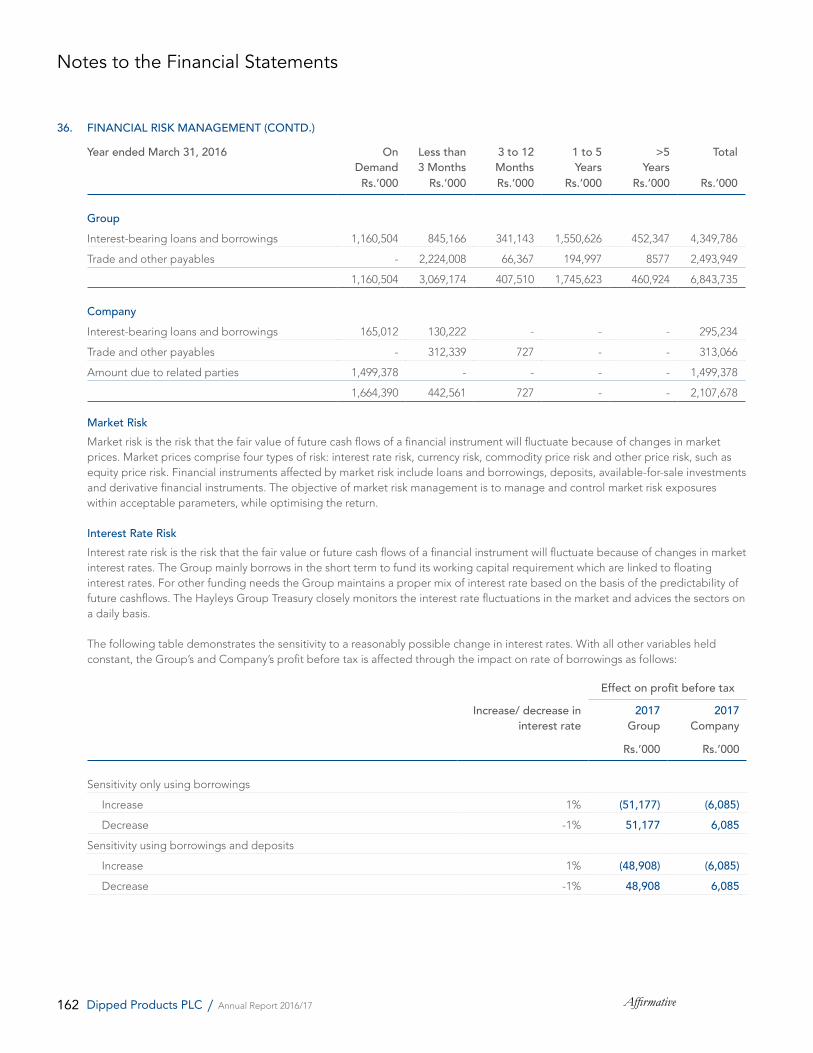
162 AffirmativeDipped Products PLC / Annual Report 2016/17
36. FINANCIAL RISK MANAGEMENT (CONTD.)
Year ended March 31, 2016 On Demand
Less than 3 Months
3 to 12 Months
1 to 5 Years
>5 Years
Total
Rs.’000 Rs.’000 Rs.’000 Rs.’000 Rs.’000 Rs.’000
GroupInterest-bearing loans and borrowings 1,160,504 845,166 341,143 1,550,626 452,347 4,349,786
Trade and other payables - 2,224,008 66,367 194,997 8577 2,493,949
1,160,504 3,069,174 407,510 1,745,623 460,924 6,843,735
CompanyInterest-bearing loans and borrowings 165,012 130,222 - - - 295,234
Trade and other payables - 312,339 727 - - 313,066
Amount due to related parties 1,499,378 - - - - 1,499,378
1,664,390 442,561 727 - - 2,107,678
Market Risk Market risk is the risk that the fair value of future cash flows of a financial instrument will fluctuate because of changes in market
prices. Market prices comprise four types of risk: interest rate risk, currency risk, commodity price risk and other price risk, such as equity price risk. Financial instruments affected by market risk include loans and borrowings, deposits, available-for-sale investments and derivative financial instruments. The objective of market risk management is to manage and control market risk exposures within acceptable parameters, while optimising the return.
Interest Rate Risk Interest rate risk is the risk that the fair value or future cash flows of a financial instrument will fluctuate because of changes in market
interest rates. The Group mainly borrows in the short term to fund its working capital requirement which are linked to floating interest rates. For other funding needs the Group maintains a proper mix of interest rate based on the basis of the predictability of future cashflows. The Hayleys Group Treasury closely monitors the interest rate fluctuations in the market and advices the sectors on a daily basis.
The following table demonstrates the sensitivity to a reasonably possible change in interest rates. With all other variables held constant, the Group’s and Company’s profit before tax is affected through the impact on rate of borrowings as follows:
Effect on profit before taxIncrease/ decrease in
interest rate2017
Group2017
Company
Rs.’000 Rs.’000
Sensitivity only using borrowings
Increase 1% (51,177) (6,085) Decrease -1% 51,177 6,085 Sensitivity using borrowings and deposits
Increase 1% (48,908) (6,085) Decrease -1% 48,908 6,085
Notes to the Financial Statements
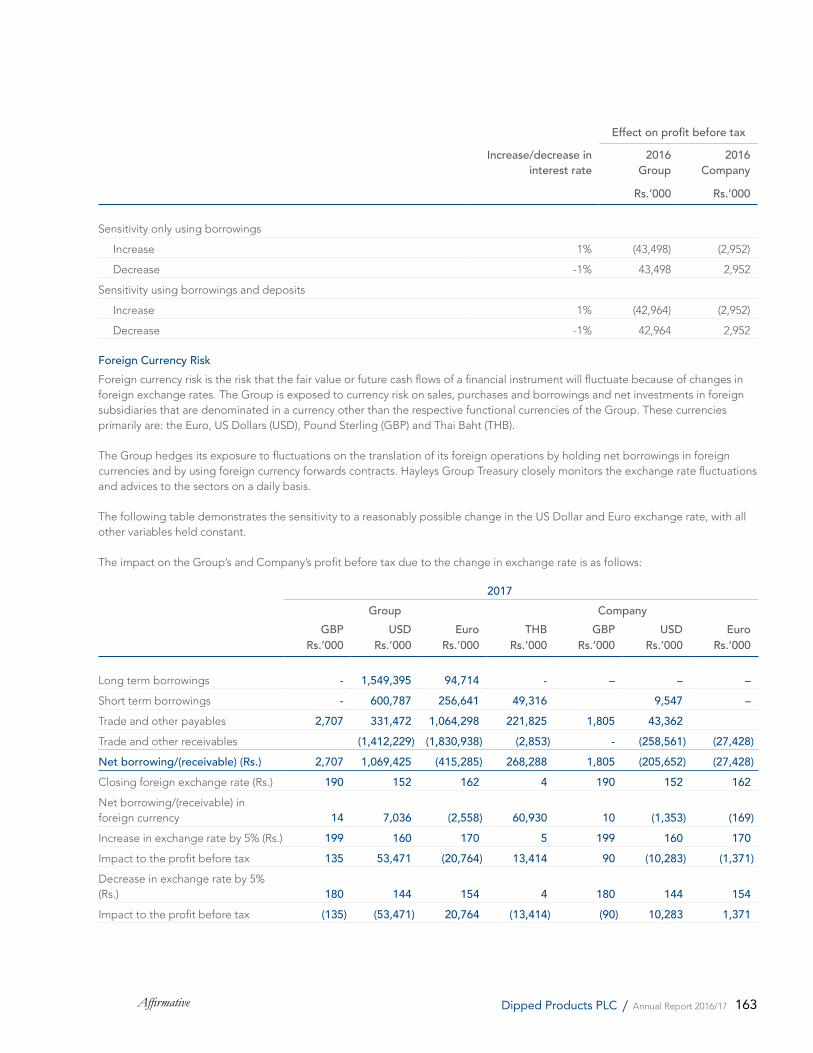
163Affirmative Dipped Products PLC / Annual Report 2016/17
Effect on profit before taxIncrease/decrease in
interest rate2016
Group2016
Company
Rs.’000 Rs.’000
Sensitivity only using borrowings
Increase 1% (43,498) (2,952)
Decrease -1% 43,498 2,952
Sensitivity using borrowings and deposits
Increase 1% (42,964) (2,952)
Decrease -1% 42,964 2,952
Foreign Currency Risk Foreign currency risk is the risk that the fair value or future cash flows of a financial instrument will fluctuate because of changes in
foreign exchange rates. The Group is exposed to currency risk on sales, purchases and borrowings and net investments in foreign subsidiaries that are denominated in a currency other than the respective functional currencies of the Group. These currencies primarily are: the Euro, US Dollars (USD), Pound Sterling (GBP) and Thai Baht (THB).
The Group hedges its exposure to fluctuations on the translation of its foreign operations by holding net borrowings in foreign currencies and by using foreign currency forwards contracts. Hayleys Group Treasury closely monitors the exchange rate fluctuations and advices to the sectors on a daily basis.
The following table demonstrates the sensitivity to a reasonably possible change in the US Dollar and Euro exchange rate, with all other variables held constant.
The impact on the Group’s and Company’s profit before tax due to the change in exchange rate is as follows:
2017Group Company
GBP USD Euro THB GBP USD EuroRs.’000 Rs.’000 Rs.’000 Rs.’000 Rs.’000 Rs.’000 Rs.’000
Long term borrowings - 1,549,395 94,714 - – – – Short term borrowings - 600,787 256,641 49,316 9,547 – Trade and other payables 2,707 331,472 1,064,298 221,825 1,805 43,362 Trade and other receivables (1,412,229) (1,830,938) (2,853) - (258,561) (27,428)Net borrowing/(receivable) (Rs.) 2,707 1,069,425 (415,285) 268,288 1,805 (205,652) (27,428)Closing foreign exchange rate (Rs.) 190 152 162 4 190 152 162 Net borrowing/(receivable) in foreign currency 14 7,036 (2,558) 60,930 10 (1,353) (169)Increase in exchange rate by 5% (Rs.) 199 160 170 5 199 160 170 Impact to the profit before tax 135 53,471 (20,764) 13,414 90 (10,283) (1,371)Decrease in exchange rate by 5% (Rs.) 180 144 154 4 180 144 154 Impact to the profit before tax (135) (53,471) 20,764 (13,414) (90) 10,283 1,371
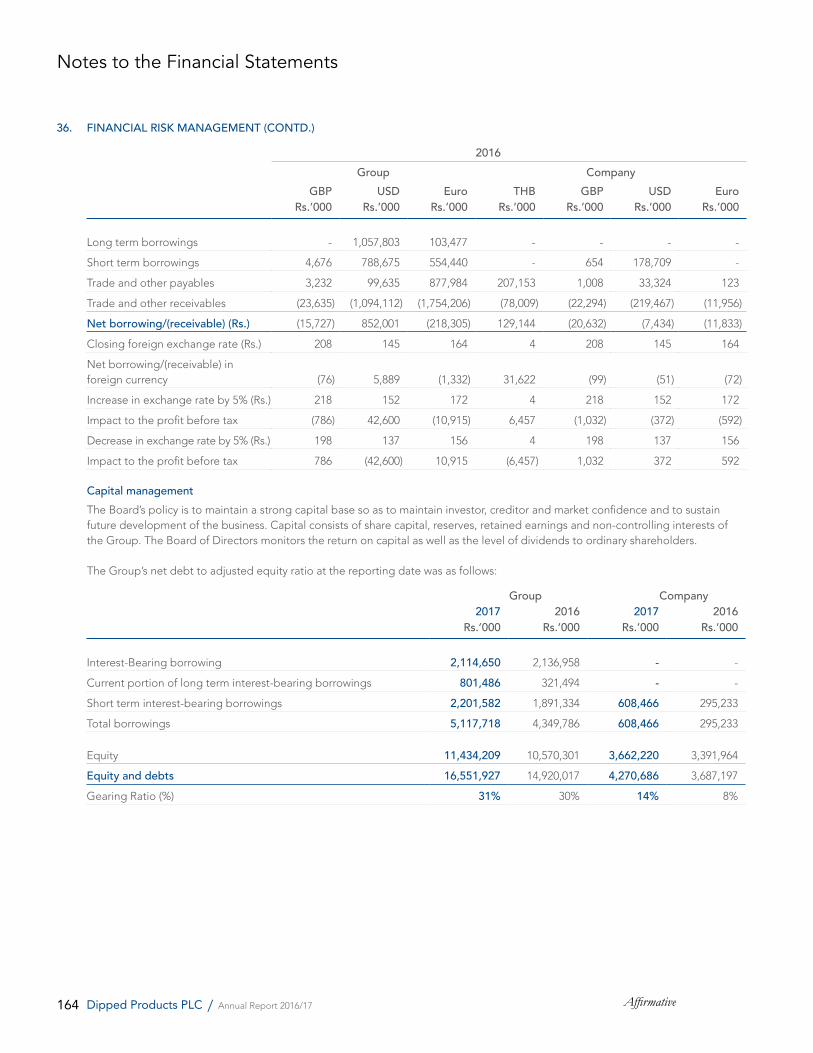
164 AffirmativeDipped Products PLC / Annual Report 2016/17
36. FINANCIAL RISK MANAGEMENT (CONTD.)
2016Group Company
GBP USD Euro THB GBP USD EuroRs.’000 Rs.’000 Rs.’000 Rs.’000 Rs.’000 Rs.’000 Rs.’000
Long term borrowings - 1,057,803 103,477 - - - -
Short term borrowings 4,676 788,675 554,440 - 654 178,709 -
Trade and other payables 3,232 99,635 877,984 207,153 1,008 33,324 123
Trade and other receivables (23,635) (1,094,112) (1,754,206) (78,009) (22,294) (219,467) (11,956)
Net borrowing/(receivable) (Rs.) (15,727) 852,001 (218,305) 129,144 (20,632) (7,434) (11,833)
Closing foreign exchange rate (Rs.) 208 145 164 4 208 145 164
Net borrowing/(receivable) in foreign currency (76) 5,889 (1,332) 31,622 (99) (51) (72)
Increase in exchange rate by 5% (Rs.) 218 152 172 4 218 152 172
Impact to the profit before tax (786) 42,600 (10,915) 6,457 (1,032) (372) (592)
Decrease in exchange rate by 5% (Rs.) 198 137 156 4 198 137 156
Impact to the profit before tax 786 (42,600) 10,915 (6,457) 1,032 372 592
Capital management The Board’s policy is to maintain a strong capital base so as to maintain investor, creditor and market confidence and to sustain
future development of the business. Capital consists of share capital, reserves, retained earnings and non-controlling interests of the Group. The Board of Directors monitors the return on capital as well as the level of dividends to ordinary shareholders.
The Group’s net debt to adjusted equity ratio at the reporting date was as follows:
Group Company2017 2016 2017 2016
Rs.’000 Rs.’000 Rs.’000 Rs.’000
Interest-Bearing borrowing 2,114,650 2,136,958 - -
Current portion of long term interest-bearing borrowings 801,486 321,494 - -
Short term interest-bearing borrowings 2,201,582 1,891,334 608,466 295,233
Total borrowings 5,117,718 4,349,786 608,466 295,233
Equity 11,434,209 10,570,301 3,662,220 3,391,964
Equity and debts 16,551,927 14,920,017 4,270,686 3,687,197
Gearing Ratio (%) 31% 30% 14% 8%
Notes to the Financial Statements
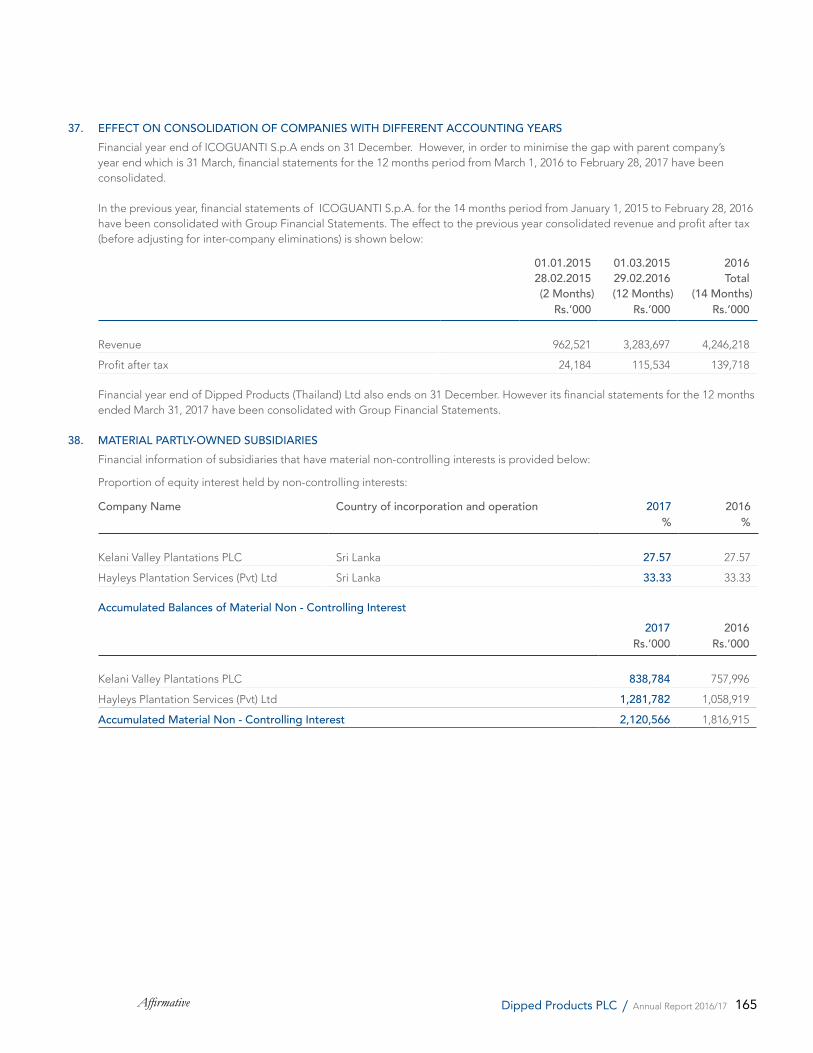
165Affirmative Dipped Products PLC / Annual Report 2016/17
37. EFFECT ON CONSOLIDATION OF COMPANIES WITH DIFFERENT ACCOUNTING YEARS Financial year end of ICOGUANTI S.p.A ends on 31 December. However, in order to minimise the gap with parent company’s
year end which is 31 March, financial statements for the 12 months period from March 1, 2016 to February 28, 2017 have been consolidated.
In the previous year, financial statements of ICOGUANTI S.p.A. for the 14 months period from January 1, 2015 to February 28, 2016 have been consolidated with Group Financial Statements. The effect to the previous year consolidated revenue and profit after tax (before adjusting for inter-company eliminations) is shown below:
01.01.201528.02.2015(2 Months)
01.03.201529.02.2016(12 Months)
2016Total
(14 Months)Rs.’000 Rs.’000 Rs.’000
Revenue 962,521 3,283,697 4,246,218
Profit after tax 24,184 115,534 139,718
Financial year end of Dipped Products (Thailand) Ltd also ends on 31 December. However its financial statements for the 12 months ended March 31, 2017 have been consolidated with Group Financial Statements.
38. MATERIAL PARTLY-OWNED SUBSIDIARIES Financial information of subsidiaries that have material non-controlling interests is provided below:
Proportion of equity interest held by non-controlling interests:
Company Name Country of incorporation and operation 2017 2016% %
Kelani Valley Plantations PLC Sri Lanka 27.57 27.57
Hayleys Plantation Services (Pvt) Ltd Sri Lanka 33.33 33.33
Accumulated Balances of Material Non - Controlling Interest2017 2016
Rs.’000 Rs.’000
Kelani Valley Plantations PLC 838,784 757,996
Hayleys Plantation Services (Pvt) Ltd 1,281,782 1,058,919
Accumulated Material Non - Controlling Interest 2,120,566 1,816,915
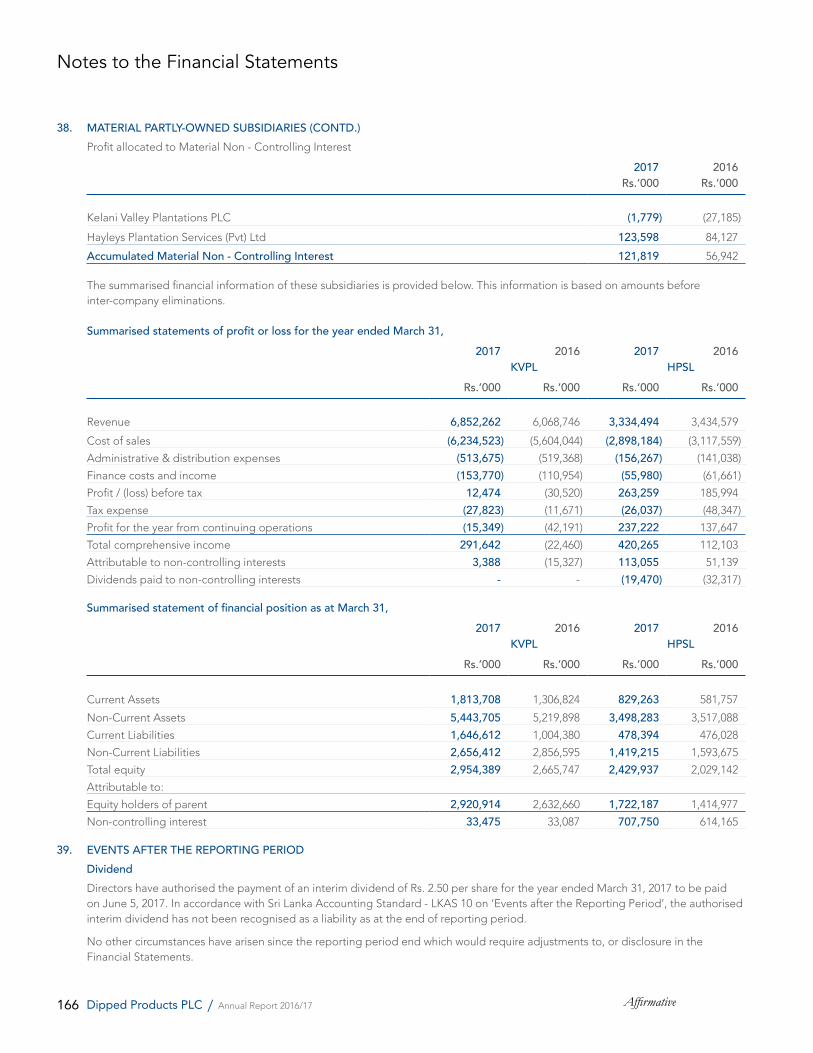
166 AffirmativeDipped Products PLC / Annual Report 2016/17
38. MATERIAL PARTLY-OWNED SUBSIDIARIES (CONTD.) Profit allocated to Material Non - Controlling Interest
2017 2016Rs.’000 Rs.’000
Kelani Valley Plantations PLC (1,779) (27,185)
Hayleys Plantation Services (Pvt) Ltd 123,598 84,127
Accumulated Material Non - Controlling Interest 121,819 56,942
The summarised financial information of these subsidiaries is provided below. This information is based on amounts before inter-company eliminations.
Summarised statements of profit or loss for the year ended March 31,2017 2016 2017 2016 KVPL HPSL
Rs.’000 Rs.’000 Rs.’000 Rs.’000
Revenue 6,852,262 6,068,746 3,334,494 3,434,579
Cost of sales (6,234,523) (5,604,044) (2,898,184) (3,117,559)
Administrative & distribution expenses (513,675) (519,368) (156,267) (141,038)
Finance costs and income (153,770) (110,954) (55,980) (61,661)
Profit / (loss) before tax 12,474 (30,520) 263,259 185,994
Tax expense (27,823) (11,671) (26,037) (48,347)
Profit for the year from continuing operations (15,349) (42,191) 237,222 137,647
Total comprehensive income 291,642 (22,460) 420,265 112,103
Attributable to non-controlling interests 3,388 (15,327) 113,055 51,139
Dividends paid to non-controlling interests - - (19,470) (32,317)
Summarised statement of financial position as at March 31,2017 2016 2017 2016 KVPL HPSL
Rs.’000 Rs.’000 Rs.’000 Rs.’000
Current Assets 1,813,708 1,306,824 829,263 581,757
Non-Current Assets 5,443,705 5,219,898 3,498,283 3,517,088
Current Liabilities 1,646,612 1,004,380 478,394 476,028
Non-Current Liabilities 2,656,412 2,856,595 1,419,215 1,593,675
Total equity 2,954,389 2,665,747 2,429,937 2,029,142
Attributable to:
Equity holders of parent 2,920,914 2,632,660 1,722,187 1,414,977
Non-controlling interest 33,475 33,087 707,750 614,165
39. EVENTS AFTER THE REPORTING PERIODDividend
Directors have authorised the payment of an interim dividend of Rs. 2.50 per share for the year ended March 31, 2017 to be paid on June 5, 2017. In accordance with Sri Lanka Accounting Standard - LKAS 10 on ‘Events after the Reporting Period’, the authorised interim dividend has not been recognised as a liability as at the end of reporting period.
No other circumstances have arisen since the reporting period end which would require adjustments to, or disclosure in the Financial Statements.
Notes to the Financial Statements
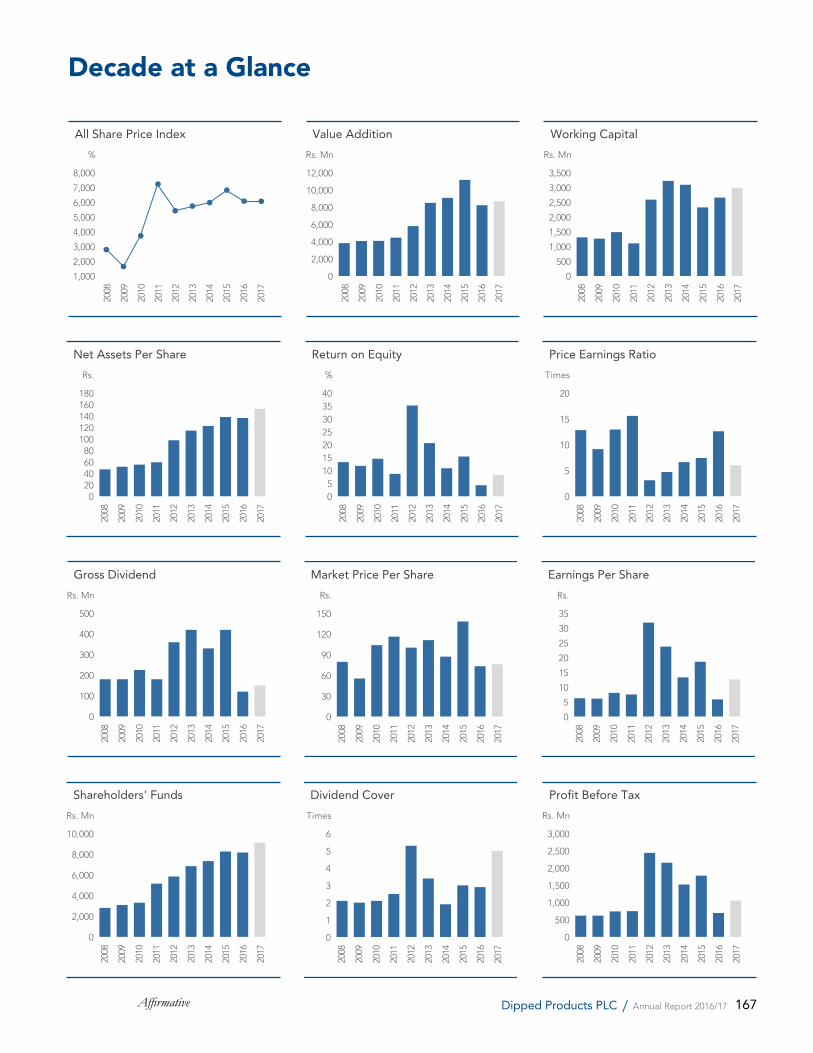
167Affirmative Dipped Products PLC / Annual Report 2016/17
Decade at a Glance
1,000
2,000
3,000
4,000
5,000
6,000
7,000
8,000
All Share Price Index
2008
2009
2010
2011
2012
2013
2014
2015
2017
2016
%
0
2,000
4,000
6,000
8,000
10,000
12,000
Value Addition
2008
2009
2010
2011
2012
2013
2014
2015
2017
2016
Rs. Mn
0
500
1,000
1,500
2,000
2,500
3,000
3,500
Working Capital
2008
2009
2010
2011
2012
2013
2014
2015
2017
2016
Rs. Mn
05
10152025303540
Return on Equity20
08
2009
2010
2011
2012
2013
2014
2015
2017
2016
%
0
5
10
15
20
Price Earnings Ratio
2008
2009
2010
2011
2012
2013
2014
2015
2017
2016
Times
020406080
100120140160180
Net Assets Per Share
2008
2009
2010
2011
2012
2013
2014
2015
2017
2016
Rs.
0
30
60
90
120
150
Market Price Per Share
2008
2009
2010
2011
2012
2013
2014
2015
2017
2016
Rs.
0
5
10
15
20
25
30
35
Earnings Per Share20
08
2009
2010
2011
2012
2013
2014
2015
2017
2016
Rs.
0
100
200
300
400
500
Gross Dividend
2008
2009
2010
2011
2012
2013
2014
2015
2017
2016
Rs. Mn
0
1
2
3
4
5
6
Dividend Cover
2008
2009
2010
2011
2012
2013
2014
2015
2017
2016
Times
0
2,000
4,000
6,000
8,000
10,000
Shareholders' Funds
2008
2009
2010
2011
2012
2013
2014
2015
2017
2016
Rs. Mn
0
500
1,000
1,500
2,000
2,500
3,000
Profit Before Tax
2008
2009
2010
2011
2012
2013
2014
2015
2017
2016
Rs. Mn
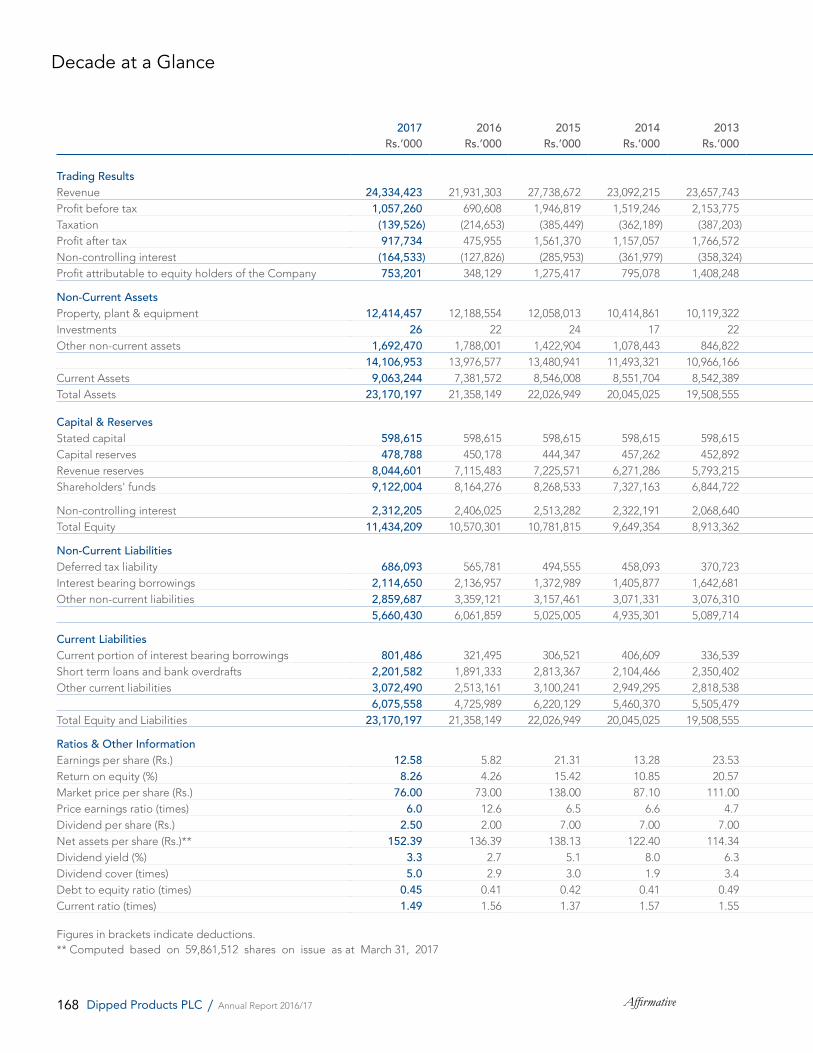
168 AffirmativeDipped Products PLC / Annual Report 2016/17
Decade at a Glance
2017 2016 2015 2014 2013 2012 2011 2010 2009 2008Rs.’000 Rs.’000 Rs.’000 Rs.’000 Rs.’000 Rs.’000 Rs.’000 Rs.’000 Rs.’000 Rs.’000
Trading Results Trading ResultsRevenue 24,334,423 21,931,303 27,738,672 23,092,215 23,657,743 19,693,665 14,869,245 11,823,707 11,895,985 11,152,895 RevenueProfit before tax 1,057,260 690,608 1,946,819 1,519,246 2,153,775 2,437,677 748,110 737,609 616,437 615,969 Profit before taxTaxation (139,526) (214,653) (385,449) (362,189) (387,203) (294,922) (162,527) (173,332) (113,709) (100,627) TaxationProfit after tax 917,734 475,955 1,561,370 1,157,057 1,766,572 2,142,755 585,583 564,277 502,728 515,342 Profit after taxNon-controlling interest (164,533) (127,826) (285,953) (361,979) (358,324) (236,780) (138,969) (83,391) (139,858) (144,220) Non-controlling interestProfit attributable to equity holders of the Company 753,201 348,129 1,275,417 795,078 1,408,248 1,905,975 446,614 480,886 362,870 371,122 Profit attributable to equity holders of the Company
Non-Current Assets Non-Current AssetsProperty, plant & equipment 12,414,457 12,188,554 12,058,013 10,414,861 10,119,322 9,451,513 6,246,770 4,899,811 4,826,977 4,402,997 Property, plant & equipmentInvestments 26 22 24 17 22 2,575 1,353,751 289,211 287,307 295,619 InvestmentsOther non-current assets 1,692,470 1,788,001 1,422,904 1,078,443 846,822 809,644 586,313 39,700 37,276 27,617 Other non-current assets
14,106,953 13,976,577 13,480,941 11,493,321 10,966,166 10,263,732 8,186,834 5,228,722 5,151,560 4,726,233 Current Assets 9,063,244 7,381,572 8,546,008 8,551,704 8,542,389 8,500,569 6,803,292 5,548,561 5,275,073 4,871,990 Current AssetsTotal Assets 23,170,197 21,358,149 22,026,949 20,045,025 19,508,555 18,764,301 14,990,126 10,777,283 10,426,633 9,598,223 Total Assets
Capital & Reserves Capital & ReservesStated capital 598,615 598,615 598,615 598,615 598,615 598,615 598,615 598,615 598,615 598,615 Stated capitalCapital reserves 478,788 450,178 444,347 457,262 452,892 236,852 1,390,231 228,505 174,223 172,018 Capital reservesRevenue reserves 8,044,601 7,115,483 7,225,571 6,271,286 5,793,215 4,965,582 3,153,487 2,483,243 2,306,312 2,039,771 Revenue reservesShareholders' funds 9,122,004 8,164,276 8,268,533 7,327,163 6,844,722 5,801,049 5,142,333 3,310,363 3,079,150 2,810,404 Shareholders' funds
Non-controlling interest 2,312,205 2,406,025 2,513,282 2,322,191 2,068,640 1,750,494 840,397 758,047 785,912 710,504 Non-controlling interestTotal Equity 11,434,209 10,570,301 10,781,815 9,649,354 8,913,362 7,551,543 5,982,730 4,068,410 3,865,062 3,520,908 Total Equity
Non-Current Liabilities Non-Current LiabilitiesDeferred tax liability 686,093 565,781 494,555 458,093 370,723 290,486 210,707 135,956 140,385 133,120 Deferred tax liabilityInterest bearing borrowings 2,114,650 2,136,957 1,372,989 1,405,877 1,642,681 1,899,973 1,238,387 1,049,654 1,219,073 1,360,252 Interest bearing borrowingsOther non-current liabilities 2,859,687 3,359,121 3,157,461 3,071,331 3,076,310 2,920,336 1,682,435 1,461,311 1,192,936 1,021,749 Other non-current liabilities
5,660,430 6,061,859 5,025,005 4,935,301 5,089,714 5,110,795 3,131,529 2,646,921 2,552,394 2,515,121
Current Liabilities Current LiabilitiesCurrent portion of interest bearing borrowings 801,486 321,495 306,521 406,609 336,539 327,218 416,968 337,519 311,742 256,454 Current portion of interest bearing borrowingsShort term loans and bank overdrafts 2,201,582 1,891,333 2,813,367 2,104,466 2,350,402 3,447,198 3,288,557 2,272,163 2,405,206 1,896,960 Short term loans and bank overdraftsOther current liabilities 3,072,490 2,513,161 3,100,241 2,949,295 2,818,538 2,327,547 2,170,342 1,452,270 1,292,229 1,408,780 Other current liabilities
6,075,558 4,725,989 6,220,129 5,460,370 5,505,479 6,101,963 5,875,867 4,061,952 4,009,177 3,562,194 Total Equity and Liabilities 23,170,197 21,358,149 22,026,949 20,045,025 19,508,555 18,764,301 14,990,126 10,777,283 10,426,633 9,598,223 Total Equity and Liabilities
Ratios & Other Information Ratios & Other InformationEarnings per share (Rs.) 12.58 5.82 21.31 13.28 23.53 31.84 7.46 8.03 6.06 6.20 Earnings per share (Rs.)Return on equity (%) 8.26 4.26 15.42 10.85 20.57 32.86 8.69 14.50 11.80 13.20 Return on equity (%)Market price per share (Rs.) 76.00 73.00 138.00 87.10 111.00 100.10 116.10 103.75 55.25 79.50 Market price per share (Rs.)Price earnings ratio (times) 6.0 12.6 6.5 6.6 4.7 3.1 15.6 12.90 9.10 12.80 Price earnings ratio (times)Dividend per share (Rs.) 2.50 2.00 7.00 7.00 7.00 6.00 3.00 3.75 3.00 3.00 Dividend per share (Rs.)Net assets per share (Rs.)** 152.39 136.39 138.13 122.40 114.34 96.91 85.90 55.30 51.44 46.95 Net assets per share (Rs.)**Dividend yield (%) 3.3 2.7 5.1 8.0 6.3 6.0 2.6 3.60 5.40 3.80 Dividend yield (%)Dividend cover (times) 5.0 2.9 3.0 1.9 3.4 5.3 2.5 2.10 2.00 2.10 Dividend cover (times)Debt to equity ratio (times) 0.45 0.41 0.42 0.41 0.49 0.75 0.83 0.90 1.02 1.00 Debt to equity ratio (times)Current ratio (times) 1.49 1.56 1.37 1.57 1.55 1.39 1.16 1.37 1.32 1.37 Current ratio (times)
Figures in brackets indicate deductions.** Computed based on 59,861,512 shares on issue as at March 31, 2017

169Affirmative Dipped Products PLC / Annual Report 2016/17
2017 2016 2015 2014 2013 2012 2011 2010 2009 2008Rs.’000 Rs.’000 Rs.’000 Rs.’000 Rs.’000 Rs.’000 Rs.’000 Rs.’000 Rs.’000 Rs.’000
Trading Results Trading ResultsRevenue 24,334,423 21,931,303 27,738,672 23,092,215 23,657,743 19,693,665 14,869,245 11,823,707 11,895,985 11,152,895 RevenueProfit before tax 1,057,260 690,608 1,946,819 1,519,246 2,153,775 2,437,677 748,110 737,609 616,437 615,969 Profit before taxTaxation (139,526) (214,653) (385,449) (362,189) (387,203) (294,922) (162,527) (173,332) (113,709) (100,627) TaxationProfit after tax 917,734 475,955 1,561,370 1,157,057 1,766,572 2,142,755 585,583 564,277 502,728 515,342 Profit after taxNon-controlling interest (164,533) (127,826) (285,953) (361,979) (358,324) (236,780) (138,969) (83,391) (139,858) (144,220) Non-controlling interestProfit attributable to equity holders of the Company 753,201 348,129 1,275,417 795,078 1,408,248 1,905,975 446,614 480,886 362,870 371,122 Profit attributable to equity holders of the Company
Non-Current Assets Non-Current AssetsProperty, plant & equipment 12,414,457 12,188,554 12,058,013 10,414,861 10,119,322 9,451,513 6,246,770 4,899,811 4,826,977 4,402,997 Property, plant & equipmentInvestments 26 22 24 17 22 2,575 1,353,751 289,211 287,307 295,619 InvestmentsOther non-current assets 1,692,470 1,788,001 1,422,904 1,078,443 846,822 809,644 586,313 39,700 37,276 27,617 Other non-current assets
14,106,953 13,976,577 13,480,941 11,493,321 10,966,166 10,263,732 8,186,834 5,228,722 5,151,560 4,726,233 Current Assets 9,063,244 7,381,572 8,546,008 8,551,704 8,542,389 8,500,569 6,803,292 5,548,561 5,275,073 4,871,990 Current AssetsTotal Assets 23,170,197 21,358,149 22,026,949 20,045,025 19,508,555 18,764,301 14,990,126 10,777,283 10,426,633 9,598,223 Total Assets
Capital & Reserves Capital & ReservesStated capital 598,615 598,615 598,615 598,615 598,615 598,615 598,615 598,615 598,615 598,615 Stated capitalCapital reserves 478,788 450,178 444,347 457,262 452,892 236,852 1,390,231 228,505 174,223 172,018 Capital reservesRevenue reserves 8,044,601 7,115,483 7,225,571 6,271,286 5,793,215 4,965,582 3,153,487 2,483,243 2,306,312 2,039,771 Revenue reservesShareholders' funds 9,122,004 8,164,276 8,268,533 7,327,163 6,844,722 5,801,049 5,142,333 3,310,363 3,079,150 2,810,404 Shareholders' funds
Non-controlling interest 2,312,205 2,406,025 2,513,282 2,322,191 2,068,640 1,750,494 840,397 758,047 785,912 710,504 Non-controlling interestTotal Equity 11,434,209 10,570,301 10,781,815 9,649,354 8,913,362 7,551,543 5,982,730 4,068,410 3,865,062 3,520,908 Total Equity
Non-Current Liabilities Non-Current LiabilitiesDeferred tax liability 686,093 565,781 494,555 458,093 370,723 290,486 210,707 135,956 140,385 133,120 Deferred tax liabilityInterest bearing borrowings 2,114,650 2,136,957 1,372,989 1,405,877 1,642,681 1,899,973 1,238,387 1,049,654 1,219,073 1,360,252 Interest bearing borrowingsOther non-current liabilities 2,859,687 3,359,121 3,157,461 3,071,331 3,076,310 2,920,336 1,682,435 1,461,311 1,192,936 1,021,749 Other non-current liabilities
5,660,430 6,061,859 5,025,005 4,935,301 5,089,714 5,110,795 3,131,529 2,646,921 2,552,394 2,515,121
Current Liabilities Current LiabilitiesCurrent portion of interest bearing borrowings 801,486 321,495 306,521 406,609 336,539 327,218 416,968 337,519 311,742 256,454 Current portion of interest bearing borrowingsShort term loans and bank overdrafts 2,201,582 1,891,333 2,813,367 2,104,466 2,350,402 3,447,198 3,288,557 2,272,163 2,405,206 1,896,960 Short term loans and bank overdraftsOther current liabilities 3,072,490 2,513,161 3,100,241 2,949,295 2,818,538 2,327,547 2,170,342 1,452,270 1,292,229 1,408,780 Other current liabilities
6,075,558 4,725,989 6,220,129 5,460,370 5,505,479 6,101,963 5,875,867 4,061,952 4,009,177 3,562,194 Total Equity and Liabilities 23,170,197 21,358,149 22,026,949 20,045,025 19,508,555 18,764,301 14,990,126 10,777,283 10,426,633 9,598,223 Total Equity and Liabilities
Ratios & Other Information Ratios & Other InformationEarnings per share (Rs.) 12.58 5.82 21.31 13.28 23.53 31.84 7.46 8.03 6.06 6.20 Earnings per share (Rs.)Return on equity (%) 8.26 4.26 15.42 10.85 20.57 32.86 8.69 14.50 11.80 13.20 Return on equity (%)Market price per share (Rs.) 76.00 73.00 138.00 87.10 111.00 100.10 116.10 103.75 55.25 79.50 Market price per share (Rs.)Price earnings ratio (times) 6.0 12.6 6.5 6.6 4.7 3.1 15.6 12.90 9.10 12.80 Price earnings ratio (times)Dividend per share (Rs.) 2.50 2.00 7.00 7.00 7.00 6.00 3.00 3.75 3.00 3.00 Dividend per share (Rs.)Net assets per share (Rs.)** 152.39 136.39 138.13 122.40 114.34 96.91 85.90 55.30 51.44 46.95 Net assets per share (Rs.)**Dividend yield (%) 3.3 2.7 5.1 8.0 6.3 6.0 2.6 3.60 5.40 3.80 Dividend yield (%)Dividend cover (times) 5.0 2.9 3.0 1.9 3.4 5.3 2.5 2.10 2.00 2.10 Dividend cover (times)Debt to equity ratio (times) 0.45 0.41 0.42 0.41 0.49 0.75 0.83 0.90 1.02 1.00 Debt to equity ratio (times)Current ratio (times) 1.49 1.56 1.37 1.57 1.55 1.39 1.16 1.37 1.32 1.37 Current ratio (times)
Figures in brackets indicate deductions.** Computed based on 59,861,512 shares on issue as at March 31, 2017
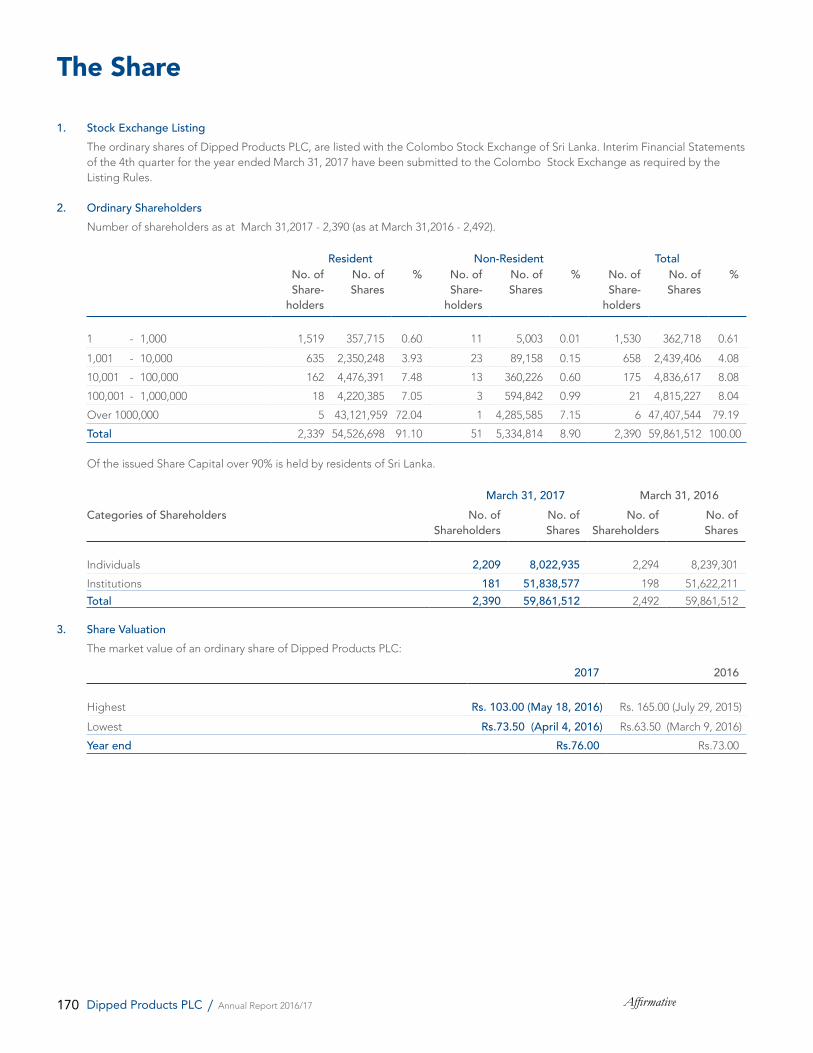
170 AffirmativeDipped Products PLC / Annual Report 2016/17
The Share
1. Stock Exchange Listing The ordinary shares of Dipped Products PLC, are listed with the Colombo Stock Exchange of Sri Lanka. Interim Financial Statements
of the 4th quarter for the year ended March 31, 2017 have been submitted to the Colombo Stock Exchange as required by the Listing Rules.
2. Ordinary Shareholders Number of shareholders as at March 31,2017 - 2,390 (as at March 31,2016 - 2,492).
Resident Non-Resident TotalNo. of Share-
holders
No. of Shares
% No. of Share-
holders
No. of Shares
% No. of Share-
holders
No. of Shares
%
1 - 1,000 1,519 357,715 0.60 11 5,003 0.01 1,530 362,718 0.61
1,001 - 10,000 635 2,350,248 3.93 23 89,158 0.15 658 2,439,406 4.08
10,001 - 100,000 162 4,476,391 7.48 13 360,226 0.60 175 4,836,617 8.08
100,001 - 1,000,000 18 4,220,385 7.05 3 594,842 0.99 21 4,815,227 8.04
Over 1000,000 5 43,121,959 72.04 1 4,285,585 7.15 6 47,407,544 79.19
Total 2,339 54,526,698 91.10 51 5,334,814 8.90 2,390 59,861,512 100.00
Of the issued Share Capital over 90% is held by residents of Sri Lanka.
March 31, 2017 March 31, 2016Categories of Shareholders No. of
ShareholdersNo. of Shares
No. of Shareholders
No. of Shares
Individuals 2,209 8,022,935 2,294 8,239,301
Institutions 181 51,838,577 198 51,622,211
Total 2,390 59,861,512 2,492 59,861,512
3. Share Valuation The market value of an ordinary share of Dipped Products PLC:
2017 2016
Highest Rs. 103.00 (May 18, 2016) Rs. 165.00 (July 29, 2015)
Lowest Rs.73.50 (April 4, 2016) Rs.63.50 (March 9, 2016)
Year end Rs.76.00 Rs.73.00
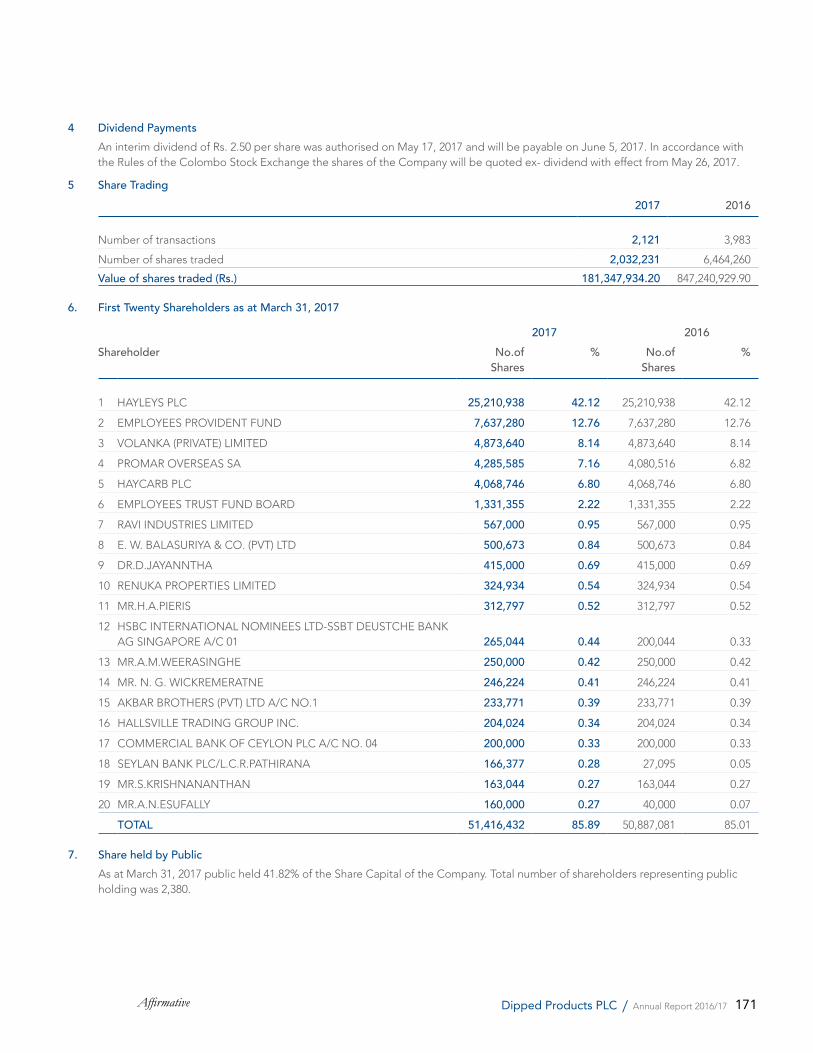
171Affirmative Dipped Products PLC / Annual Report 2016/17
4 Dividend Payments An interim dividend of Rs. 2.50 per share was authorised on May 17, 2017 and will be payable on June 5, 2017. In accordance with
the Rules of the Colombo Stock Exchange the shares of the Company will be quoted ex- dividend with effect from May 26, 2017.
5 Share Trading2017 2016
Number of transactions 2,121 3,983
Number of shares traded 2,032,231 6,464,260
Value of shares traded (Rs.) 181,347,934.20 847,240,929.90
6. First Twenty Shareholders as at March 31, 2017
2017 2016Shareholder No.of
Shares % No.of
Shares %
1 HAYLEYS PLC 25,210,938 42.12 25,210,938 42.12
2 EMPLOYEES PROVIDENT FUND 7,637,280 12.76 7,637,280 12.76
3 VOLANKA (PRIVATE) LIMITED 4,873,640 8.14 4,873,640 8.14
4 PROMAR OVERSEAS SA 4,285,585 7.16 4,080,516 6.82
5 HAYCARB PLC 4,068,746 6.80 4,068,746 6.80
6 EMPLOYEES TRUST FUND BOARD 1,331,355 2.22 1,331,355 2.22
7 RAVI INDUSTRIES LIMITED 567,000 0.95 567,000 0.95
8 E. W. BALASURIYA & CO. (PVT) LTD 500,673 0.84 500,673 0.84
9 DR.D.JAYANNTHA 415,000 0.69 415,000 0.69
10 RENUKA PROPERTIES LIMITED 324,934 0.54 324,934 0.54
11 MR.H.A.PIERIS 312,797 0.52 312,797 0.52
12 HSBC INTERNATIONAL NOMINEES LTD-SSBT DEUSTCHE BANK AG SINGAPORE A/C 01 265,044 0.44 200,044 0.33
13 MR.A.M.WEERASINGHE 250,000 0.42 250,000 0.42
14 MR. N. G. WICKREMERATNE 246,224 0.41 246,224 0.41
15 AKBAR BROTHERS (PVT) LTD A/C NO.1 233,771 0.39 233,771 0.39
16 HALLSVILLE TRADING GROUP INC. 204,024 0.34 204,024 0.34
17 COMMERCIAL BANK OF CEYLON PLC A/C NO. 04 200,000 0.33 200,000 0.33
18 SEYLAN BANK PLC/L.C.R.PATHIRANA 166,377 0.28 27,095 0.05
19 MR.S.KRISHNANANTHAN 163,044 0.27 163,044 0.27
20 MR.A.N.ESUFALLY 160,000 0.27 40,000 0.07
TOTAL 51,416,432 85.89 50,887,081 85.01
7. Share held by Public As at March 31, 2017 public held 41.82% of the Share Capital of the Company. Total number of shareholders representing public
holding was 2,380.
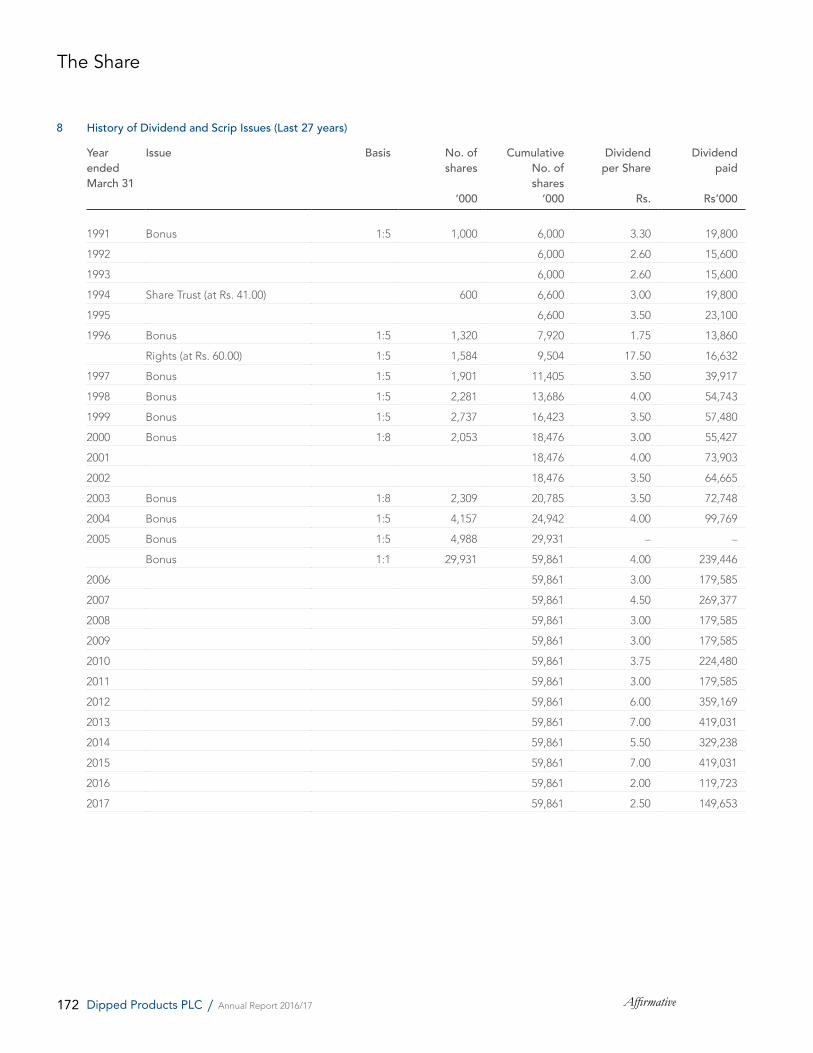
172 AffirmativeDipped Products PLC / Annual Report 2016/17
8 History of Dividend and Scrip Issues (Last 27 years)
Year ended March 31
Issue Basis No. of shares
‘000
Cumulative No. of shares
‘000
Dividend per Share
Rs.
Dividend paid
Rs’000
1991 Bonus 1:5 1,000 6,000 3.30 19,800
1992 6,000 2.60 15,600
1993 6,000 2.60 15,600
1994 Share Trust (at Rs. 41.00) 600 6,600 3.00 19,800
1995 6,600 3.50 23,100
1996 Bonus 1:5 1,320 7,920 1.75 13,860
Rights (at Rs. 60.00) 1:5 1,584 9,504 17.50 16,632
1997 Bonus 1:5 1,901 11,405 3.50 39,917
1998 Bonus 1:5 2,281 13,686 4.00 54,743
1999 Bonus 1:5 2,737 16,423 3.50 57,480
2000 Bonus 1:8 2,053 18,476 3.00 55,427
2001 18,476 4.00 73,903
2002 18,476 3.50 64,665
2003 Bonus 1:8 2,309 20,785 3.50 72,748
2004 Bonus 1:5 4,157 24,942 4.00 99,769
2005 Bonus 1:5 4,988 29,931 – –
Bonus 1:1 29,931 59,861 4.00 239,446
2006 59,861 3.00 179,585
2007 59,861 4.50 269,377
2008 59,861 3.00 179,585
2009 59,861 3.00 179,585
2010 59,861 3.75 224,480
2011 59,861 3.00 179,585
2012 59,861 6.00 359,169
2013 59,861 7.00 419,031
2014 59,861 5.50 329,238
2015 59,861 7.00 419,031
2016 59,861 2.00 119,723
2017 59,861 2.50 149,653
The Share

173Affirmative Dipped Products PLC / Annual Report 2016/17
Market Capitalisation (Last 27 years)
Year ended March 31
Market capitalisation
Rs. million
Net assets
Rs. million
1991 690 178
1992 618 210
1993 537 223
1994 574 284
1995 574 340
1996 893 492
1997 984 611
1998 1,505 794
1999 854 961
2000 905 1,032
2001 859 1,179
2002 1,109 1,312
2003 1,143 1,498
2004 2,120 1,782
2005 5,507 2,148
2006 4,909 2,179
2007 6,540 2,646
2008 4,759 2,810
2009 3,307 3,079
2010 6,211 3,310
2011 6,950 5,142
2012 5,992 5,801
2013 6,645 6,845
2014 5,214 7,327
2015 8,261 8,044
2016 4,370 8,164
2017 4,550 9,122
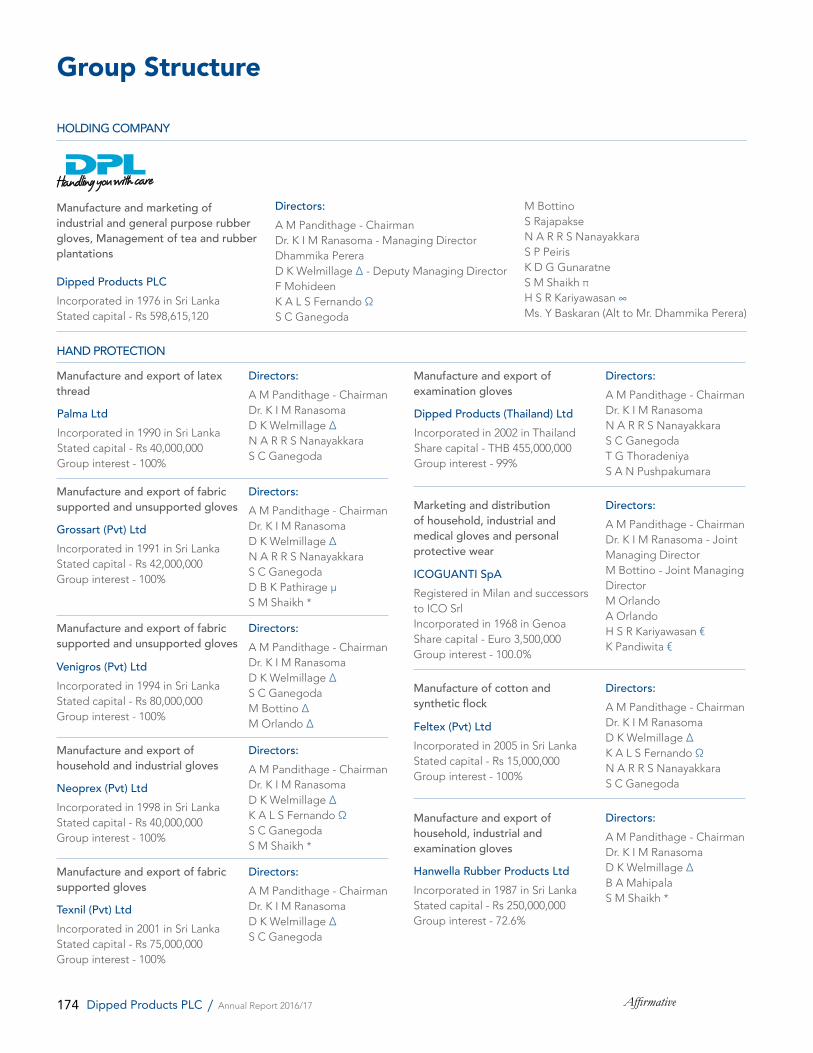
174 AffirmativeDipped Products PLC / Annual Report 2016/17
Group Structure
Dipped Products PLCIncorporated in 1976 in Sri LankaStated capital - Rs 598,615,120
Palma LtdIncorporated in 1990 in Sri LankaStated capital - Rs 40,000,000Group interest - 100%
Dipped Products (Thailand) LtdIncorporated in 2002 in ThailandShare capital - THB 455,000,000Group interest - 99%
Grossart (Pvt) LtdIncorporated in 1991 in Sri LankaStated capital - Rs 42,000,000Group interest - 100% ICOGUANTI SpA
Registered in Milan and successors to ICO SrlIncorporated in 1968 in GenoaShare capital - Euro 3,500,000Group interest - 100.0%
Venigros (Pvt) LtdIncorporated in 1994 in Sri LankaStated capital - Rs 80,000,000Group interest - 100%
Feltex (Pvt) LtdIncorporated in 2005 in Sri LankaStated capital - Rs 15,000,000Group interest - 100%
Neoprex (Pvt) LtdIncorporated in 1998 in Sri LankaStated capital - Rs 40,000,000Group interest - 100%
Hanwella Rubber Products LtdIncorporated in 1987 in Sri LankaStated capital - Rs 250,000,000 Group interest - 72.6%
Texnil (Pvt) LtdIncorporated in 2001 in Sri LankaStated capital - Rs 75,000,000Group interest - 100%
Directors:A M Pandithage - ChairmanDr. K I M Ranasoma - Managing DirectorDhammika PereraD K Welmillage ∆ - Deputy Managing DirectorF MohideenK A L S Fernando ΩS C Ganegoda
Directors:A M Pandithage - ChairmanDr. K I M Ranasoma D K Welmillage ∆N A R R S NanayakkaraS C Ganegoda
Directors:A M Pandithage - ChairmanDr. K I M Ranasoma N A R R S Nanayakkara S C Ganegoda T G Thoradeniya S A N Pushpakumara
Directors:A M Pandithage - ChairmanDr. K I M Ranasoma D K Welmillage ∆N A R R S NanayakkaraS C Ganegoda D B K Pathirage µS M Shaikh *
Directors:A M Pandithage - ChairmanDr. K I M Ranasoma - Joint Managing DirectorM Bottino - Joint Managing DirectorM OrlandoA OrlandoH S R Kariyawasan €K Pandiwita €
Directors:A M Pandithage - ChairmanDr. K I M Ranasoma D K Welmillage ∆S C GanegodaM Bottino ∆M Orlando ∆
Directors:A M Pandithage - ChairmanDr. K I M Ranasoma D K Welmillage ∆K A L S Fernando ΩN A R R S NanayakkaraS C Ganegoda
Directors:A M Pandithage - ChairmanDr. K I M Ranasoma D K Welmillage ∆K A L S Fernando ΩS C GanegodaS M Shaikh *
Directors:A M Pandithage - ChairmanDr. K I M Ranasoma D K Welmillage ∆B A MahipalaS M Shaikh *
Directors:A M Pandithage - ChairmanDr. K I M Ranasoma D K Welmillage ∆S C Ganegoda
M BottinoS RajapakseN A R R S Nanayakkara S P Peiris K D G Gunaratne S M Shaikh πH S R Kariyawasan ∞Ms. Y Baskaran (Alt to Mr. Dhammika Perera)
HOLDING COMPANY
HAND PROTECTION
Manufacture and marketing of industrial and general purpose rubber gloves, Management of tea and rubber plantations
Manufacture and export of latex thread
Manufacture and export of examination gloves
Manufacture and export of fabric supported and unsupported gloves Marketing and distribution
of household, industrial and medical gloves and personal protective wear
Manufacture and export of fabric supported and unsupported gloves
Manufacture of cotton and synthetic flock
Manufacture and export of household and industrial gloves
Manufacture and export of household, industrial and examination gloves
Manufacture and export of fabric supported gloves
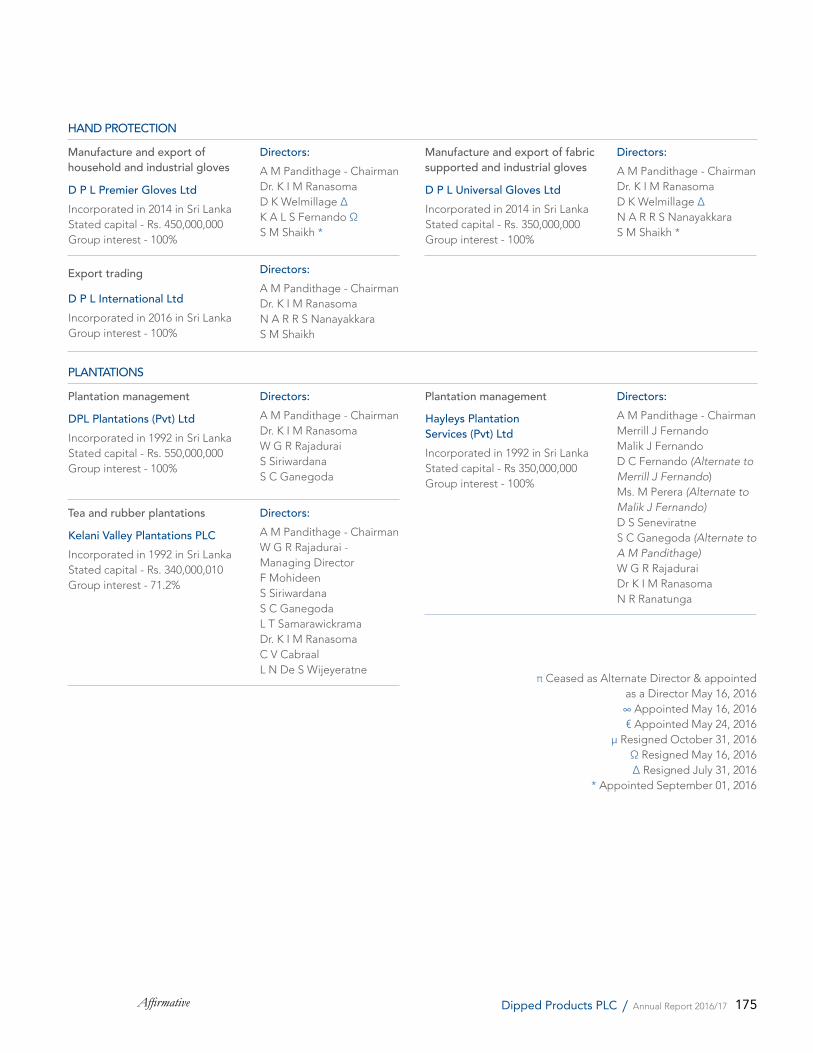
175Affirmative Dipped Products PLC / Annual Report 2016/17
D P L Premier Gloves LtdIncorporated in 2014 in Sri LankaStated capital - Rs. 450,000,000 Group interest - 100%
D P L International LtdIncorporated in 2016 in Sri LankaGroup interest - 100%
DPL Plantations (Pvt) LtdIncorporated in 1992 in Sri LankaStated capital - Rs. 550,000,000Group interest - 100%
Kelani Valley Plantations PLCIncorporated in 1992 in Sri LankaStated capital - Rs. 340,000,010Group interest - 71.2%
D P L Universal Gloves Ltd Incorporated in 2014 in Sri LankaStated capital - Rs. 350,000,000 Group interest - 100%
Hayleys Plantation Services (Pvt) Ltd Incorporated in 1992 in Sri LankaStated capital - Rs 350,000,000 Group interest - 100%
Directors:A M Pandithage - ChairmanDr. K I M Ranasoma D K Welmillage ∆K A L S Fernando ΩS M Shaikh *
Directors:A M Pandithage - ChairmanDr. K I M Ranasoma N A R R S NanayakkaraS M Shaikh
Directors:A M Pandithage - ChairmanDr. K I M RanasomaW G R Rajadurai S SiriwardanaS C Ganegoda
Directors:A M Pandithage - ChairmanW G R Rajadurai - Managing Director F MohideenS Siriwardana S C Ganegoda L T Samarawickrama Dr. K I M RanasomaC V Cabraal L N De S Wijeyeratne
Directors:A M Pandithage - ChairmanDr. K I M Ranasoma D K Welmillage ∆N A R R S NanayakkaraS M Shaikh *
Directors:A M Pandithage - ChairmanMerrill J Fernando Malik J Fernando D C Fernando (Alternate to Merrill J Fernando) Ms. M Perera (Alternate to Malik J Fernando)D S SeneviratneS C Ganegoda (Alternate to A M Pandithage)W G R Rajadurai Dr K I M RanasomaN R Ranatunga
HAND PROTECTION
PLANTATIONS
Manufacture and export of household and industrial gloves
Plantation management
Tea and rubber plantations
Manufacture and export of fabric supported and industrial gloves
Plantation management
π Ceased as Alternate Director & appointed as a Director May 16, 2016∞ Appointed May 16, 2016€ Appointed May 24, 2016
µ Resigned October 31, 2016Ω Resigned May 16, 2016∆ Resigned July 31, 2016
* Appointed September 01, 2016
Export trading
176 AffirmativeDipped Products PLC / Annual Report 2016/17
Glossary
ACCOUNTING POLICIESSpecific principles, bases, conventions, rules and practices adopted by an enterprise in preparing and presenting Financial Statements.
BORROWINGSBank loans, overdrafts and finance lease obligations.
CAPITAL EMPLOYEDTotal assets less interest free liabilities.
CAPITAL RESERVESReserves identified for specific purposes and considered not available for distribution.
CASH EQUIVALENTSLiquid investments with original maturities of three months or less.
CONTINGENT LIABILITIESConditions or situations at the Statement of Financial Position date, the financial effect of which are to be determined by future events which may or may not occur.
CURRENT RATIOCurrent assets divided by current liabilities.
DIVIDEND COVERPost-tax profit divided by gross dividend. Measures the number of times dividend is covered by distributable profit.
DIVIDEND YIELDGross dividend per share as a percentage of the market price.
EARNINGS PER SHAREProfit attributable to ordinary shareholders divided by a weighted average number of ordinary shares in issue and ranking for dividend.
GROSS DIVIDENDPortion of profits inclusive of tax withheld distributed to shareholders.
NET ASSETS PER SHAREShareholders’ funds divided by the number of ordinary shares issued.
OPERATING PROFIT MARGINOperating profit divided by Group turnover.
PRICE EARNINGS RATIOMarket price of a share divided by earnings per share.
RELATED PARTIESA person or entity that is reporting to the reporting entity.
RETURN ON EQUITYAttributable profits divided by average shareholders’ funds.
REVENUE RESERVESReserves considered as being available for distributions and investments.
SEGMENTConstituent business units grouped in terms of nature and similarity of operations.
SLFRS/LKASSri Lanka Accounting Standards corresponding to International Financial Reporting Standards.
TOTAL EQUITYShare capital, reserves and minority interest.
VALUE ADDITIONThe quantum of wealth generated by the activities of the Group and its distribution.
WORKING CAPITALCapital required to finance the day-to-day operations (current assets minus current liabilities
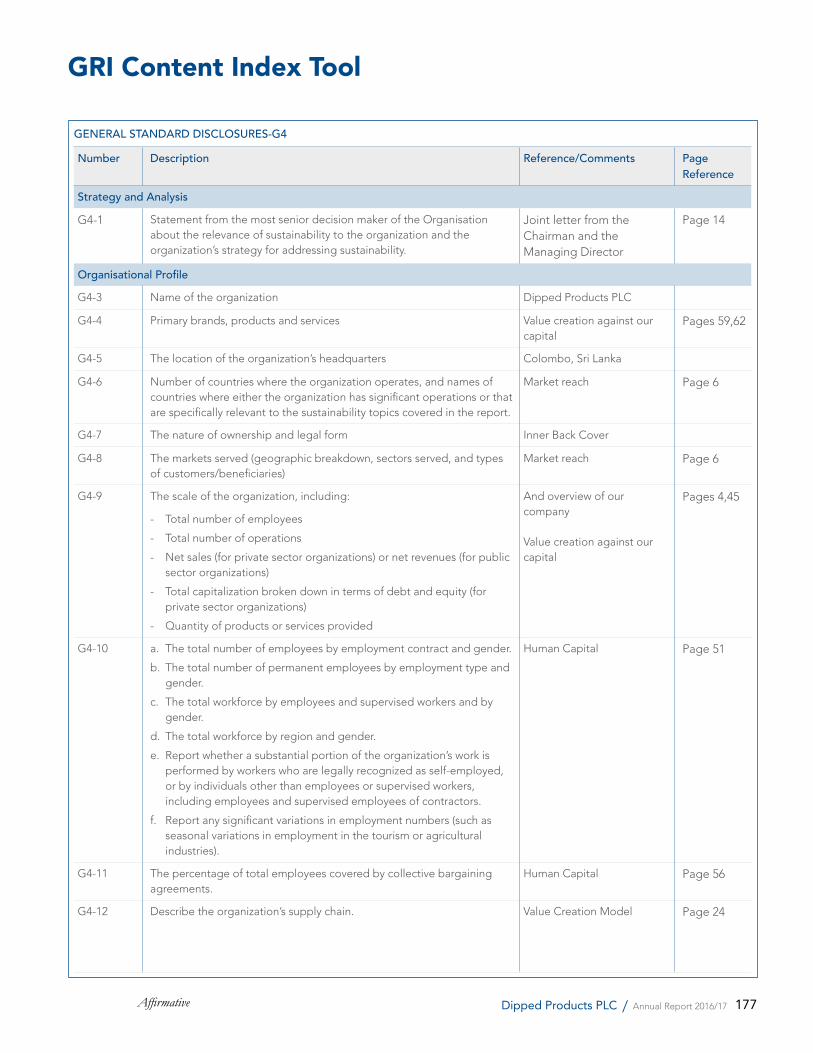
177Affirmative Dipped Products PLC / Annual Report 2016/17
GRI Content Index Tool
GENERAL STANDARD DISCLOSURES-G4
Number Description Reference/Comments Page Reference
Strategy and Analysis
G4-1 Statement from the most senior decision maker of the Organisation about the relevance of sustainability to the organization and the organization’s strategy for addressing sustainability.
Joint letter from the Chairman and the Managing Director
Page 14
Organisational ProfileG4-3 Name of the organization Dipped Products PLC
G4-4 Primary brands, products and services Value creation against our capital
Pages 59,62
G4-5 The location of the organization’s headquarters Colombo, Sri Lanka
G4-6 Number of countries where the organization operates, and names of countries where either the organization has significant operations or that are specifically relevant to the sustainability topics covered in the report.
Market reach Page 6
G4-7 The nature of ownership and legal form Inner Back Cover
G4-8 The markets served (geographic breakdown, sectors served, and types of customers/beneficiaries)
Market reach Page 6
G4-9 The scale of the organization, including:
- Total number of employees
- Total number of operations
- Net sales (for private sector organizations) or net revenues (for public sector organizations)
- Total capitalization broken down in terms of debt and equity (for private sector organizations)
- Quantity of products or services provided
And overview of our company
Value creation against our capital
Pages 4,45
G4-10 a. The total number of employees by employment contract and gender.
b. The total number of permanent employees by employment type and gender.
c. The total workforce by employees and supervised workers and by gender.
d. The total workforce by region and gender.
e. Report whether a substantial portion of the organization’s work is performed by workers who are legally recognized as self-employed, or by individuals other than employees or supervised workers, including employees and supervised employees of contractors.
f. Report any significant variations in employment numbers (such as seasonal variations in employment in the tourism or agricultural industries).
Human Capital Page 51
G4-11 The percentage of total employees covered by collective bargaining agreements.
Human Capital Page 56
G4-12 Describe the organization’s supply chain. Value Creation Model Page 24
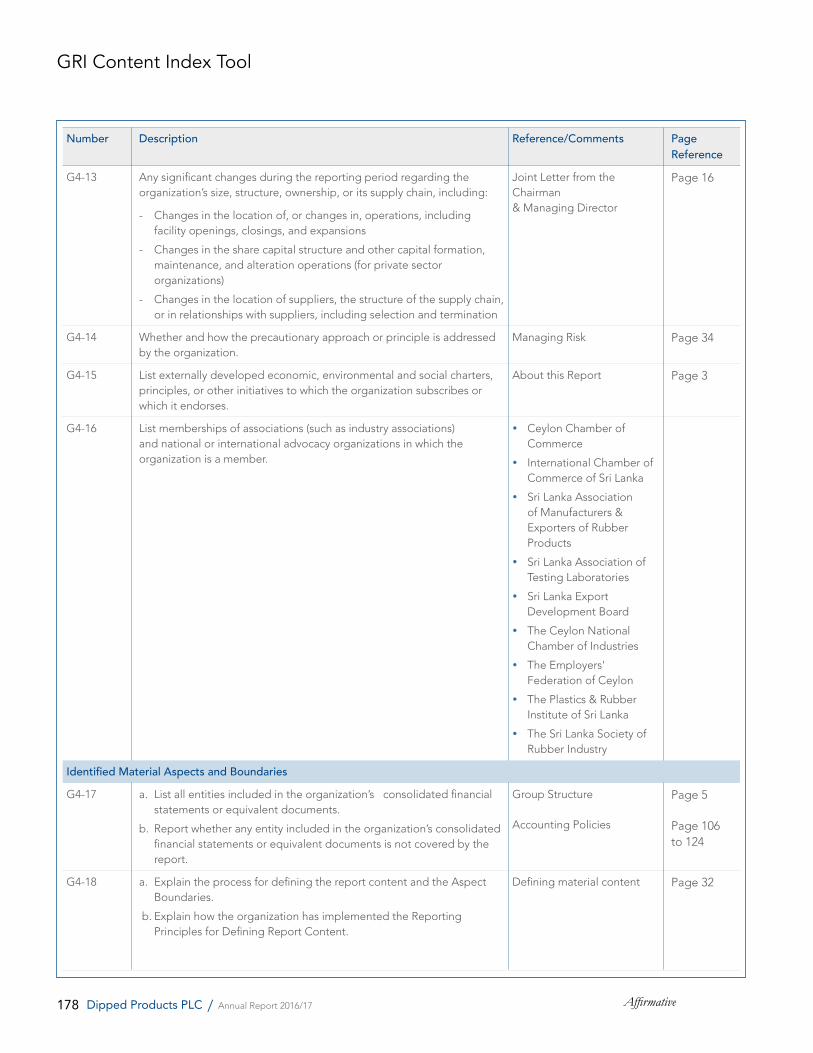
178 AffirmativeDipped Products PLC / Annual Report 2016/17
Number Description Reference/Comments Page Reference
G4-13 Any significant changes during the reporting period regarding the organization’s size, structure, ownership, or its supply chain, including:
- Changes in the location of, or changes in, operations, including facility openings, closings, and expansions
- Changes in the share capital structure and other capital formation, maintenance, and alteration operations (for private sector organizations)
- Changes in the location of suppliers, the structure of the supply chain, or in relationships with suppliers, including selection and termination
Joint Letter from the Chairman & Managing Director
Page 16
G4-14 Whether and how the precautionary approach or principle is addressed by the organization.
Managing Risk Page 34
G4-15 List externally developed economic, environmental and social charters, principles, or other initiatives to which the organization subscribes or which it endorses.
About this Report Page 3
G4-16 List memberships of associations (such as industry associations) and national or international advocacy organizations in which the organization is a member.
Ceylon Chamber of Commerce
International Chamber of Commerce of Sri Lanka
Sri Lanka Association of Manufacturers & Exporters of Rubber Products
Sri Lanka Association of Testing Laboratories
Sri Lanka Export Development Board
The Ceylon National Chamber of Industries
The Employers' Federation of Ceylon
The Plastics & Rubber Institute of Sri Lanka
The Sri Lanka Society of Rubber Industry
Identified Material Aspects and BoundariesG4-17 a. List all entities included in the organization’s consolidated financial
statements or equivalent documents.
b. Report whether any entity included in the organization’s consolidated financial statements or equivalent documents is not covered by the report.
Group Structure
Accounting Policies
Page 5
Page 106 to 124
G4-18 a. Explain the process for defining the report content and the Aspect Boundaries.
b. Explain how the organization has implemented the Reporting Principles for Defining Report Content.
Defining material content Page 32
GRI Content Index Tool
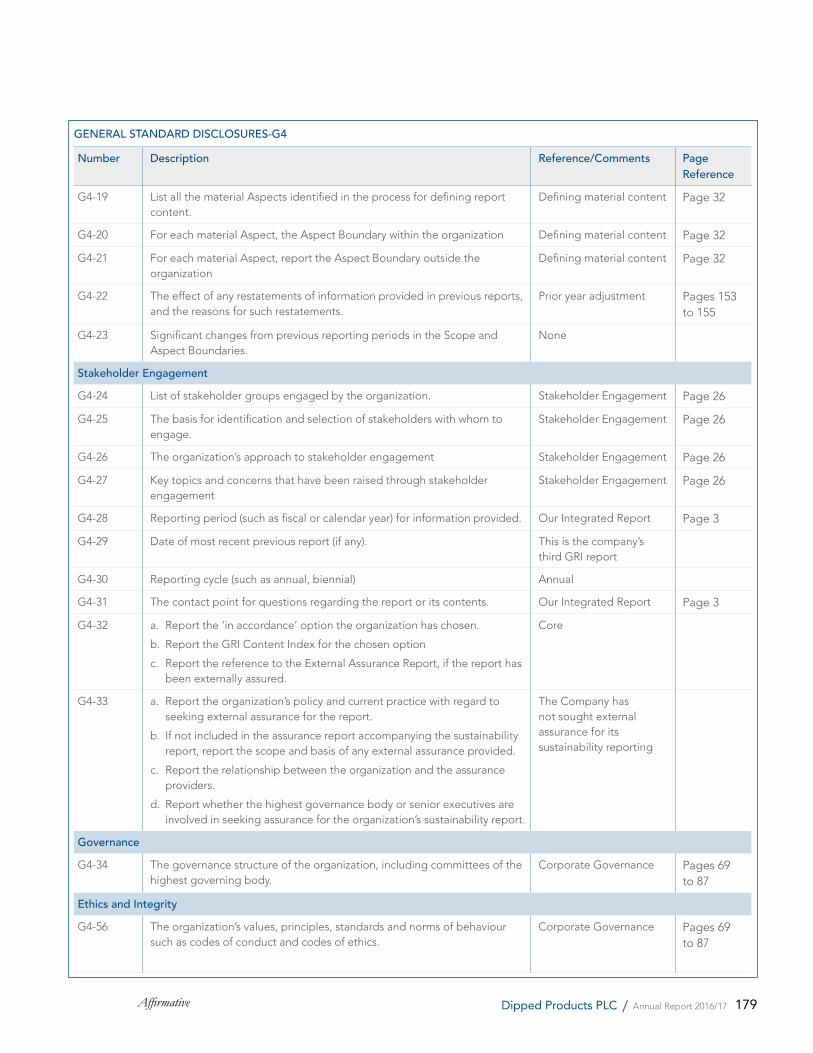
179Affirmative Dipped Products PLC / Annual Report 2016/17
GENERAL STANDARD DISCLOSURES-G4
Number Description Reference/Comments Page Reference
G4-19 List all the material Aspects identified in the process for defining report content.
Defining material content Page 32
G4-20 For each material Aspect, the Aspect Boundary within the organization Defining material content Page 32
G4-21 For each material Aspect, report the Aspect Boundary outside the organization
Defining material content Page 32
G4-22 The effect of any restatements of information provided in previous reports, and the reasons for such restatements.
Prior year adjustment Pages 153 to 155
G4-23 Significant changes from previous reporting periods in the Scope and Aspect Boundaries.
None
Stakeholder EngagementG4-24 List of stakeholder groups engaged by the organization. Stakeholder Engagement Page 26
G4-25 The basis for identification and selection of stakeholders with whom to engage.
Stakeholder Engagement Page 26
G4-26 The organization’s approach to stakeholder engagement Stakeholder Engagement Page 26
G4-27 Key topics and concerns that have been raised through stakeholder engagement
Stakeholder Engagement Page 26
G4-28 Reporting period (such as fiscal or calendar year) for information provided. Our Integrated Report Page 3
G4-29 Date of most recent previous report (if any). This is the company’s third GRI report
G4-30 Reporting cycle (such as annual, biennial) Annual
G4-31 The contact point for questions regarding the report or its contents. Our Integrated Report Page 3
G4-32 a. Report the ‘in accordance’ option the organization has chosen.
b. Report the GRI Content Index for the chosen option
c. Report the reference to the External Assurance Report, if the report has been externally assured.
Core
G4-33 a. Report the organization’s policy and current practice with regard to seeking external assurance for the report.
b. If not included in the assurance report accompanying the sustainability report, report the scope and basis of any external assurance provided.
c. Report the relationship between the organization and the assurance providers.
d. Report whether the highest governance body or senior executives are involved in seeking assurance for the organization’s sustainability report.
The Company has not sought external assurance for its sustainability reporting
GovernanceG4-34 The governance structure of the organization, including committees of the
highest governing body.Corporate Governance Pages 69
to 87
Ethics and IntegrityG4-56 The organization’s values, principles, standards and norms of behaviour
such as codes of conduct and codes of ethics.Corporate Governance Pages 69
to 87
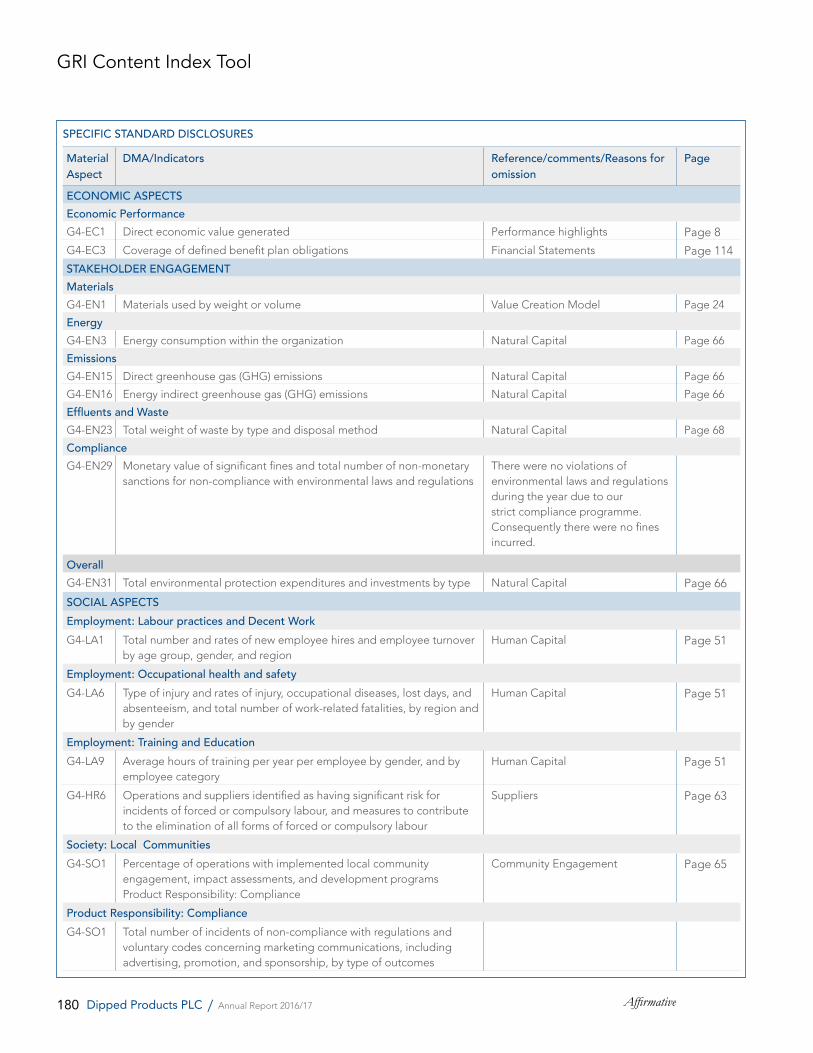
180 AffirmativeDipped Products PLC / Annual Report 2016/17
GRI Content Index Tool
SPECIFIC STANDARD DISCLOSURES
Material Aspect
DMA/Indicators Reference/comments/Reasons for omission
Page
ECONOMIC ASPECTSEconomic PerformanceG4-EC1 Direct economic value generated Performance highlights Page 8
G4-EC3 Coverage of defined benefit plan obligations Financial Statements Page 114
STAKEHOLDER ENGAGEMENTMaterialsG4-EN1 Materials used by weight or volume Value Creation Model Page 24
EnergyG4-EN3 Energy consumption within the organization Natural Capital Page 66
EmissionsG4-EN15 Direct greenhouse gas (GHG) emissions Natural Capital Page 66
G4-EN16 Energy indirect greenhouse gas (GHG) emissions Natural Capital Page 66
Effluents and WasteG4-EN23 Total weight of waste by type and disposal method Natural Capital Page 68
ComplianceG4-EN29 Monetary value of significant fines and total number of non-monetary
sanctions for non-compliance with environmental laws and regulationsThere were no violations of environmental laws and regulations during the year due to our strict compliance programme. Consequently there were no fines incurred.
OverallG4-EN31 Total environmental protection expenditures and investments by type Natural Capital Page 66
SOCIAL ASPECTSEmployment: Labour practices and Decent WorkG4-LA1 Total number and rates of new employee hires and employee turnover
by age group, gender, and regionHuman Capital Page 51
Employment: Occupational health and safetyG4-LA6 Type of injury and rates of injury, occupational diseases, lost days, and
absenteeism, and total number of work-related fatalities, by region and by gender
Human Capital Page 51
Employment: Training and EducationG4-LA9 Average hours of training per year per employee by gender, and by
employee categoryHuman Capital Page 51
G4-HR6 Operations and suppliers identified as having significant risk for incidents of forced or compulsory labour, and measures to contribute to the elimination of all forms of forced or compulsory labour
Suppliers Page 63
Society: Local CommunitiesG4-SO1 Percentage of operations with implemented local community
engagement, impact assessments, and development programs Product Responsibility: Compliance
Community Engagement Page 65
Product Responsibility: ComplianceG4-SO1 Total number of incidents of non-compliance with regulations and
voluntary codes concerning marketing communications, including advertising, promotion, and sponsorship, by type of outcomes
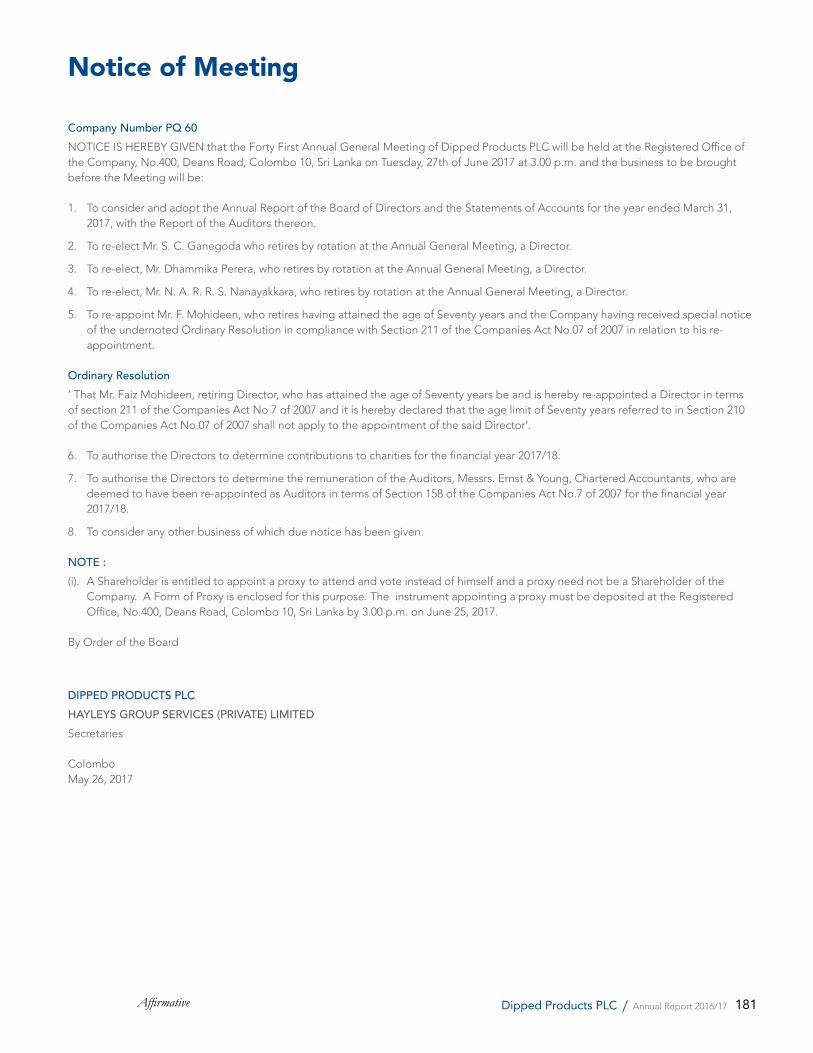
181Affirmative Dipped Products PLC / Annual Report 2016/17
Notice of Meeting
Company Number PQ 60NOTICE IS HEREBY GIVEN that the Forty First Annual General Meeting of Dipped Products PLC will be held at the Registered Office of the Company, No.400, Deans Road, Colombo 10, Sri Lanka on Tuesday, 27th of June 2017 at 3.00 p.m. and the business to be brought before the Meeting will be:
1. To consider and adopt the Annual Report of the Board of Directors and the Statements of Accounts for the year ended March 31, 2017, with the Report of the Auditors thereon.
2. To re-elect Mr. S. C. Ganegoda who retires by rotation at the Annual General Meeting, a Director.
3. To re-elect, Mr. Dhammika Perera, who retires by rotation at the Annual General Meeting, a Director.
4. To re-elect, Mr. N. A. R. R. S. Nanayakkara, who retires by rotation at the Annual General Meeting, a Director.
5. To re-appoint Mr. F. Mohideen, who retires having attained the age of Seventy years and the Company having received special notice of the undernoted Ordinary Resolution in compliance with Section 211 of the Companies Act No.07 of 2007 in relation to his re-appointment.
Ordinary Resolution‘ That Mr. Faiz Mohideen, retiring Director, who has attained the age of Seventy years be and is hereby re-appointed a Director in terms of section 211 of the Companies Act No 7 of 2007 and it is hereby declared that the age limit of Seventy years referred to in Section 210 of the Companies Act No.07 of 2007 shall not apply to the appointment of the said Director’.
6. To authorise the Directors to determine contributions to charities for the financial year 2017/18.
7. To authorise the Directors to determine the remuneration of the Auditors, Messrs. Ernst & Young, Chartered Accountants, who are deemed to have been re-appointed as Auditors in terms of Section 158 of the Companies Act No.7 of 2007 for the financial year 2017/18.
8. To consider any other business of which due notice has been given.
NOTE :(i). A Shareholder is entitled to appoint a proxy to attend and vote instead of himself and a proxy need not be a Shareholder of the
Company. A Form of Proxy is enclosed for this purpose. The instrument appointing a proxy must be deposited at the Registered Office, No.400, Deans Road, Colombo 10, Sri Lanka by 3.00 p.m. on June 25, 2017.
By Order of the Board
DIPPED PRODUCTS PLCHAYLEYS GROUP SERVICES (PRIVATE) LIMITED Secretaries
ColomboMay 26, 2017

182 AffirmativeDipped Products PLC / Annual Report 2016/17
Notes
183Affirmative Dipped Products PLC / Annual Report 2016/17
Form of Proxy
I/We* ……………………………………………………………………………………………………………………… full name of shareholder**)
NIC No./Reg. No. of Shareholder (**) …………………………………………………………………………………………………………………
of ……………………………………………………………………………………………………………………………………………………………
being Shareholder/Shareholders* of DIPPED PRODUCTS PLC hereby appoint:
(1) ………………………………………………………………………………………………………………………… full name of proxyholder**)
NIC No. of Proxyholder (**) ……………………………………………………………………………………………………………………………
of ……………………………………………………………………………………………………………………………………………………… or,
failing him/them
2. ABEYAKUMAR MOHAN PANDITHAGE (Chairman of the Company) of Colombo, or failing him, one of the Directors of the Company as my/our * proxy to attend and vote as indicated hereunder for me/us* and on my/our* behalf at the Forty First Annual General Meeting of the Company to be held on Tuesday, 27th of June 2017 and at every poll which may be taken in consequence of the aforesaid meeting and at any adjournment thereof.
For Against
1. To adopt the Annual Report of the Directors and the Statements of Accounts for the year ended 31st March 2017 with the Report of the Auditors thereon.
2. To re-elect Mr. S. C. Ganegoda who retires by rotation at the Annual General Meeting, a Director.
3. To re-elect, Mr. Dhammika Perera, who retires by rotation at the Annual General Meeting, a Director.
4. To re-elect, Mr. N. A. R. R. S. Nanayakkara, who retires by rotation at the Annual General Meeting, a Director.
5. To re-appoint Mr. F. Mohideen, who retires having attained the age of Seventy years
6. To authorise the Directors to determine contributions to charities for the financial Year 2017/18.
7. To authorise the Directors to determine the remuneration of the Auditors, Messrs. Ernst & Young, Chartered Accountants, who are deemed to have been re-appointed as Auditors in terms of Section 158 of the Companies Act No.7 of 2007 for the financial year 2017/18
(***) The proxy may vote as he thinks fit on any other resolution brought before the Meeting of which due notice has been given
As witness my/our* hands this ……………………. day of …………………………….2017.
Witnesses: Signature : …………………………………………………
Name : …………………………………………………
Address : …………………………………………………
NIC No. : …………………………………………………
Notes: (a) * Please delete the inappropriate words.
(b) A shareholder entitled to attend and vote at the Annual General meeting of the Company, is entitled to appoint a proxy to …… attend and vote instead of him/her and the proxy need not be a shareholder of the company.
** Full name of shareholder/proxy holder and their NIC Nos and Witness are mandatory. Your Proxy Form will be rejected if these details are not completed.
(c) A shareholder is not entitled to appoint more than one proxy to attend on the same occasion.
(d) Instructions are noted on the reverse hereof.
(e) This Form of Proxy is in terms of the Articles of Association of the Company.
……………………………………Signature of Shareholder
184 AffirmativeDipped Products PLC / Annual Report 2016/17
Form of Proxy
INSTRUCTIONS AS TO COMPLETION :1. To be valid, the completed Form of Proxy must be deposited with the Company Secretaries, Hayleys
Group Services (Pvt) Ltd at No.400, Deans Road, Colombo 10, Sri Lanka not less than 48 hours before the start of the Meeting.
2. In perfecting the Form of Proxy, please ensure that all requested details are filled in legibly including mandatory details. Kindly sign and fill in the date of signing.
3. If you wish to appoint a person other than the Chairman of the Company (or failing him, one of the Directors) as your proxy, please insert the relevant details at (1) overleaf. The proxy need not be a member of the Company.
4. Please indicate with an X in the space provided how your proxy is to vote on the resolutions. If no indication is given, the proxy in his discretion will vote as he thinks fit. Please also delete (***) if you do not wish your proxy to vote as he thinks fit on any other resolution brought before the meeting.
5. In the Case of a Company /Corporation the proxy must be under its common seal which should be affixed and attested in the manner prescribed by its Articles of Association.
In the case of the individual shareholders, the signature of the shareholder should be witnessed by any person over 18 years of age.
6. Where the Form of Proxy is signed under a Power of Attorney (POA) which has not been registered with the Company, the original POA together with a photocopy of same or a copy certified by a Notary Public must be lodged with the Company along with the Form of Proxy.
7. In case of Marginal Trading Accounts (slash accounts), the form of Proxy should be signed by the respective authorised Fund Manager/Banker with whom the account is maintained.
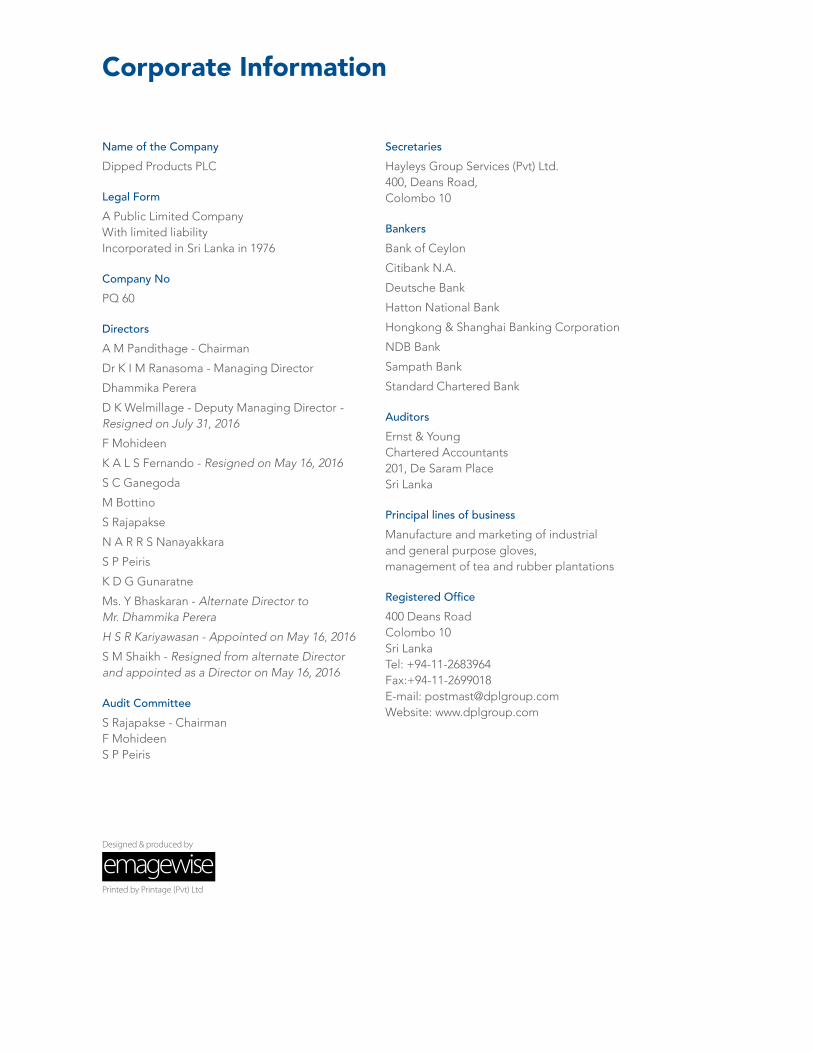
Corporate Information
Name of the CompanyDipped Products PLC
Legal FormA Public Limited CompanyWith limited liabilityIncorporated in Sri Lanka in 1976
Company NoPQ 60
DirectorsA M Pandithage - Chairman
Dr K I M Ranasoma - Managing Director
Dhammika Perera
D K Welmillage - Deputy Managing Director - Resigned on July 31, 2016
F Mohideen
K A L S Fernando - Resigned on May 16, 2016
S C Ganegoda
M Bottino
S Rajapakse
N A R R S Nanayakkara
S P Peiris
K D G Gunaratne
Ms. Y Bhaskaran - Alternate Director to Mr. Dhammika Perera
H S R Kariyawasan - Appointed on May 16, 2016
S M Shaikh - Resigned from alternate Director and appointed as a Director on May 16, 2016
Audit CommitteeS Rajapakse - ChairmanF MohideenS P Peiris
SecretariesHayleys Group Services (Pvt) Ltd.400, Deans Road,Colombo 10
BankersBank of Ceylon
Citibank N.A.
Deutsche Bank
Hatton National Bank
Hongkong & Shanghai Banking Corporation
NDB Bank
Sampath Bank
Standard Chartered Bank
AuditorsErnst & YoungChartered Accountants201, De Saram PlaceSri Lanka
Principal lines of businessManufacture and marketing of industrialand general purpose gloves,management of tea and rubber plantations
Registered Office400 Deans RoadColombo 10Sri LankaTel: +94-11-2683964 Fax:+94-11-2699018 E-mail: [email protected]: www.dplgroup.com
Designed & produced by
Printed by Printage (Pvt) Ltd