Dipl. Geow. Henrike Baumgarten
132
Climate implications and lithological characteristics of sediments from Lake Van (Turkey) and Lake Ohrid (Macedonia / Albania) obtained from downhole logging data Dipl. Geow. Henrike Baumgarten Leibniz Institute for Applied Geophysics, Hannover, Germany Doctoral thesis (Dr. rer. nat.) Disposed at the University of Bremen, Germany Primary advisor: Prof. Dr. Bernd Zolitschka, Department of Geography, University of Bremen, Germany Secondary advisor: Prof. Dr. Helga de Wall, Lithosphere dynamics, GeoZentrum Nordbayern, Germany
Transcript of Dipl. Geow. Henrike Baumgarten
Climate implications and lithological characteristics of sediments from
Lake Van (Turkey) and Lake Ohrid (Macedonia / Albania) obtained from
downhole logging data
Dipl. Geow. Henrike Baumgarten
Leibniz Institute for Applied Geophysics, Hannover, Germany
Doctoral thesis (Dr. rer. nat.)
Disposed at the University of Bremen, Germany
Primary advisor: Prof. Dr. Bernd Zolitschka, Department of Geography, University of
Bremen, Germany
Secondary advisor: Prof. Dr. Helga de Wall, Lithosphere dynamics, GeoZentrum
Nordbayern, Germany
Table of contents
ACKNOWLEDGEMENTS ...................................................................................................... I
LIST OF FIGURES ................................................................................................................ II
LIST OF TABLES ............................................................................................................... VII
ZUSAMMENFASSUNG ..................................................................................................... VIII
SUMMARY ........................................................................................................................... XI
OUTLINE OF THE THESIS ................................................................................................... 1
1. INTRODUCTION ............................................................................................................... 2
1.1 Paleoclimatic studies of lakes ............................................................................................................. 2
1.2 Motivation of this study and research questions ............................................................................ 4
1.3 Lake Van: high resolution climate archive of the Middle East ...................................................... 7
1.3.1 Site highlights and major preparatory work for the PALEOVAN project ........................................ 7
1.3.2 Geological setting of Lake Van ............................................................................................................ 9
1.3.3 ICDP drilling campaign ......................................................................................................................... 9
1.3.4 Lithology and composite profile ......................................................................................................... 11
1.4 Lake Ohrid: an environmental archive back to the Tertiary? ...................................................... 11
1.4.1 Lake Ohrid’s special features ............................................................................................................. 11
1.4.2 Geology of Lake Ohrid ........................................................................................................................ 13
1.4.3 ICDP SCOPSCO campaign ............................................................................................................... 14
1.4.4 Lake Ohrid’s sediment lithology ......................................................................................................... 15
2. METHODS .......................................................................................................................17
2.1 Borehole geophysics .......................................................................................................................... 17
2.1.1 Spectral gamma ray ............................................................................................................................ 17
2.1.2 Resistivity .............................................................................................................................................. 18
2.1.3 Sonic ...................................................................................................................................................... 18
2.1.4 Magnetic susceptibility ........................................................................................................................ 19
2.2 Mathematical methods ........................................................................................................................ 20
2.2.1 Cluster analysis .................................................................................................................................... 20
2.2.2 Sliding window method (spectral analysis) ...................................................................................... 20
2.2.3 Decompaction modelling .................................................................................................................... 21
3. RESULTS ........................................................................................................................22
3.1 Facies characterization based on physical properties from downhole logging for the sediment record of
Lake Van, Turkey ............................................................................................................................................ 22
3.1.1 Introduction ........................................................................................................................................... 23
3.1.2 Regional setting ................................................................................................................................... 24
3.1.3 Material and methods .......................................................................................................................... 26
Data acquisition and preprocessing ....................................................................................................... 26
Cluster analysis ......................................................................................................................................... 29
Input parameters for cluster analysis ..................................................................................................... 29
Significance of Ca, Zr, Fe, K, Th and U ................................................................................................. 30
3.1.4 Results ................................................................................................................................................... 34
Lithological reconstruction and physical properties from cluster analysis ........................................ 34
Properties of lacustrine sediments ......................................................................................................... 35
Properties of tephra .................................................................................................................................. 36
3.1.5 Discussion ............................................................................................................................................. 36
Reconstruction of sediment characteristics and its limits ................................................................... 36
Lacustrine sediments ............................................................................................................................... 38
Linking of detected tephra layers to volcanic composition and source ............................................. 40
Development of volcanic products based on cluster analysis ............................................................ 43
3.1.6 Conclusions .......................................................................................................................................... 43
3.2 Cyclostratigraphic studies of sediments from Lake Van (Turkey) based on their uranium contents
obtained from downhole logging and paleoclimatic implications .................................................................. 45
3.2.1 Introduction ........................................................................................................................................... 46
3.2.2 Regional setting ................................................................................................................................... 47
3.2.3 Material and methods .......................................................................................................................... 49
Data acquisition, preprocessing and processing.................................................................................. 49
Cyclostratigraphic analysis ...................................................................................................................... 50
Data preparation for spectral analysis ................................................................................................... 53
Compaction ................................................................................................................................................ 54
The role of spectral gamma ray data for cyclostratigraphic studies .................................................. 55
3.2.4 Results ................................................................................................................................................... 56
Compaction ................................................................................................................................................ 56
Milanković cycles and sedimentation rates from the sliding window technique .............................. 58
Sub-Milanković cycles over the past 75 ka ........................................................................................... 60
3.2.5 Discussion ............................................................................................................................................. 63
Evolution of sedimentation rates ............................................................................................................ 63
The role of compaction............................................................................................................................. 66
(Sub-) Milanković cycles and small-scale fluctuations in the sedimentation rate ............................ 68
3.2.6 Conclusions .......................................................................................................................................... 70
3.3 Age depth-model of the past 630 ka for Lake Ohrid (Macedonia/Albania) based on cyclostratigraphic
analysis of downhole gamma ray data ........................................................................................................... 71
3.3.1 Introduction ........................................................................................................................................... 72
3.3.2 Setting and sediment dynamics of Lake Ohrid ........................................................................... 74
3.3.3 Methods and background ................................................................................................................... 75
Downhole logging data acquisition and processing ............................................................................. 75
Sliding window method ............................................................................................................................ 76
Depth matching of downhole logging and core data ........................................................................... 77
Compaction ................................................................................................................................................ 78
3.3.4 Results ................................................................................................................................................... 78
Selection of SGR data .............................................................................................................................. 78
Correlation of GR with the global climate reference δ18
O record ...................................................... 79
Spectral characteristics of GR data, temporal evolution and sedimentation rates.......................... 81
Decompaction of pelagic sediments and subsequent spectral analysis on GR data on
decompacted depth-scale ....................................................................................................................... 85
3.3.5 Discussion ............................................................................................................................................. 88
Climate response of GR over the past 630 ka...................................................................................... 88
Sedimentation rates: major trends, small-scale fluctuations and the effect of compaction ........... 89
3.3.6 Conclusions ..................................................................................................................................... 92
4. DISCUSSION AND CONCLUSIONS ...............................................................................98
4.1 Key points of Lake Van ....................................................................................................................... 98
4.1.1 Sediment facies of Lake Van and its properties .............................................................................. 98
4.1.2 Environmental reconstructions .......................................................................................................... 98
4.2 Highlights of Lake Ohrid .................................................................................................................... 99
4.2.1 Sediment dynamics and climate proxies .......................................................................................... 99
4.3 Final conclusions .............................................................................................................................. 100
4.3.1 New insights into the environmental past of Lake Van and Lake Ohrid .................................... 100
4.3.2 Potential of logging data for environmental studies ................................................................ 102

4.4 Perspectives ....................................................................................................................................... 103
5. REFERENCES ............................................................................................................... 106
6. ERKLÄRUNG ................................................................................................................ 116

I
Acknowledgements
Here within I want to thank Thomas Wonik for introducing me into the world of borehole
geophysics. He has constantly supported me during my study with fruitful discussions
and guidance.
I warmly thank Bernd Zolitschka for being my first referee and for constructive
discussions about the research results.
My special thanks go to Helga de Wall for being my second referee and guiding me
towards preparation of two separate manuscripts about the interpretation of downhole
logging data from Lake Van as well as helpful discussions.
I want to thank the co-authors, in particular Bernd Wagner and Alex Francke for their
work and constructive discussions about the results from the lake drilling project at Lake
Ohrid.
Furthermore I want to thank the PALEOVAN Science Team for many fruitful discussions
during post-drill workshops.
The SCOPSCO Science Team has widened my perspective and helped me to
understand the sedimentary system of Lake Ohrid and to improve the data
interpretation.
This study was possible due to the financial support of the German Research
Foundation (DFG; grant no. WO 672/9, WO 672/10-1) as well as funding of the research
projects by the International Continental Scientific Drilling Program.
The acquisition of the downhole logging data was successful due to the great
commitment of our technical staff Thomas Grelle and Jens Kuhnisch.
Finally, my thanks go to Annalena Hesshaus and Matthias Halisch for proofreading of
this work.
II
List of figures
Fig. 1.1.1 Overview of ancient lakes (L.) which were targeted in the International Continental
Scientific Drilling Program to investigate paleoenvironmental changes at several
climate-sensitive locations. Map: GinkoMaps-project, http://www.ginkgomaps.com.
Fig. 1.2.1 Orbital variations affect the climate system on Earth and the sediment
characteristics are controlled by the interplay of several environmental factors. The
response of different downhole logging tools can be used to detect variations in the
physical and chemical sediment properties. E – eccentricity, O – obliquity, P –
precession. Orbital parameters modified after Wilson et al. (2000).
Fig. 1.3.1 Overview of the major circulation systems and their mean positions during the year
which affect the area around Lake Van. PFJ – Polar Front Jet, STJ – Subtropical
Jet, ITCZ – Intertropical Convergence Zone, mP – Marine Polar Air Mass, mT –
Marine Tropical Air Mass, cP – Continental Tropical Air Mass (modified after Litt et
al., 2009).
Fig. 1.3.2 The geological map shows the major tectonic units, thrust zones and volcanic
centres of different sizes of the Eastern Anatolia region. EATF – East Anatolian
Fault, NATF – North Anatolian Fault, E-K-P – Erzurum-Kars Plaetau, volcanic
centres (mounts): Ag – Agri, Al - Aladag, Bi – Bingol, BI – Bilicandagi, D –
Dumanlidag, E – Etrusk, H – Hamadag, Ka – Karatepe, Ki – Kisirdag, M –
Meydandag, N – Nemrut, S – Süphan, T – Tendürek, Z – Ziyaretdag (modified after
Keskin, 2005 and Litt et al., 2009).
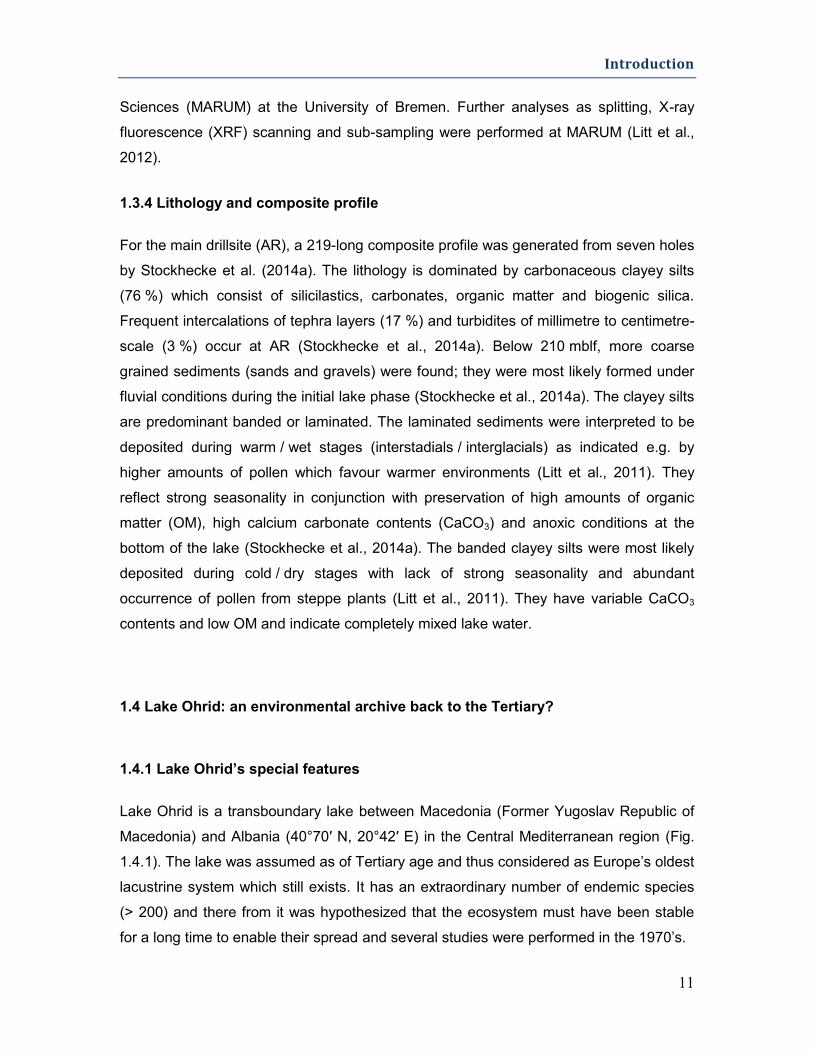
Fig. 1.4.1 Overview of the location of Lake Ohrid in the Central Mediterranean region and
topographical map of the “sister lakes” Ohrid and Prespa (Wagner et al., 2008).
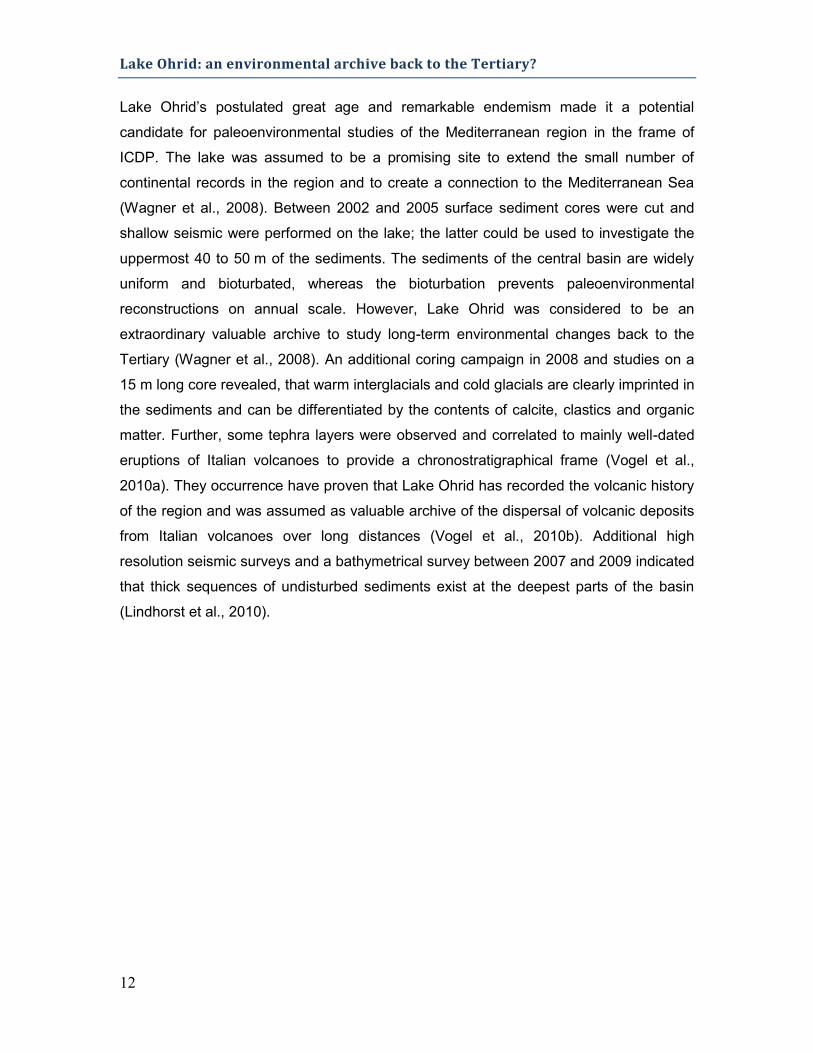
Fig. 1.4.2 Geological overview map of the area surrounding Lake Ohrid (modified after
Wagner et al., 2008).
Fig. 1.4.3 Bathymetric map of Lake Ohrid and the drillsites from the ICDP SCOPSCO
campaign (modified after Wagner et al., 2014b).
Fig. 3.1.1 Geological map of the area around Lake Van (modified after Litt et al., 2009).
Several volcanic centers are marked. N – Nemrut volcano, S – Süphan volcano,
NATF – North Anatolian Fault, EATF – East Anatolian Fault.
Fig. 3.1.2 Bathymetric map of Lake Van (modified after Litt et al., 2009) with sites marked. AR
- Ahlat Ridge, NB – Northern Basin. Inserted map shows location of the studied area
in the east of Turkey.
III
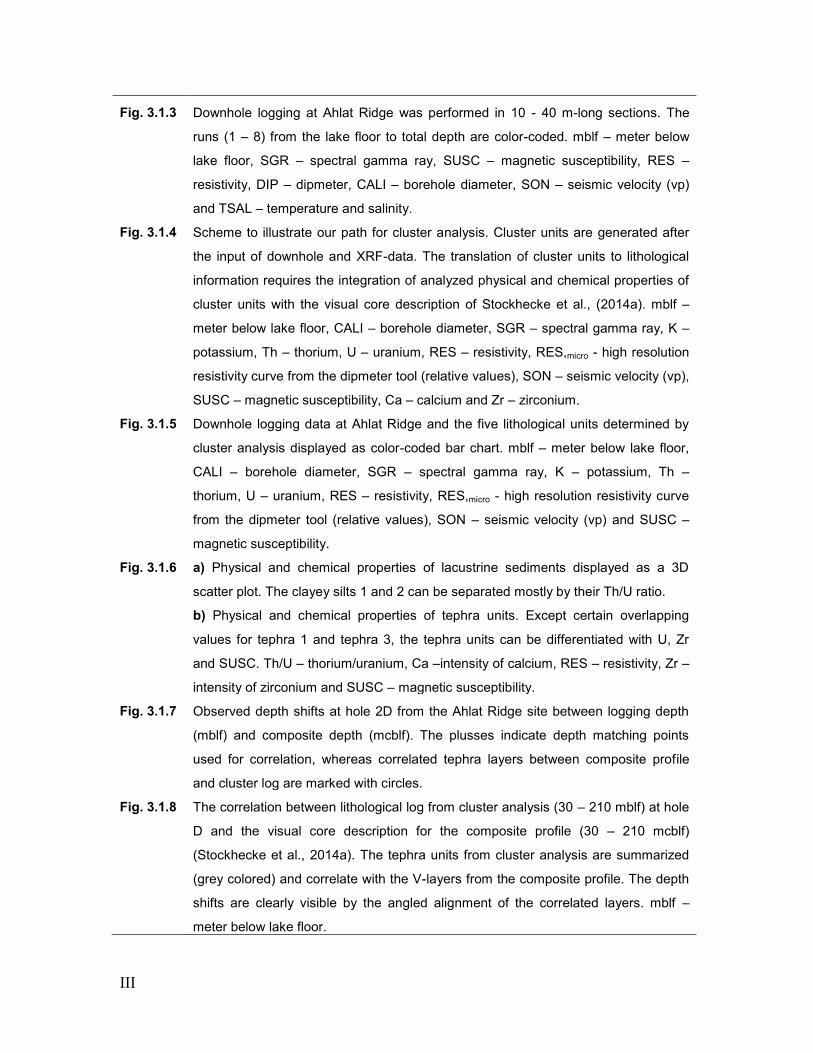
Fig. 3.1.3 Downhole logging at Ahlat Ridge was performed in 10 - 40 m-long sections. The
runs (1 – 8) from the lake floor to total depth are color-coded. mblf – meter below
lake floor, SGR – spectral gamma ray, SUSC – magnetic susceptibility, RES –
resistivity, DIP – dipmeter, CALI – borehole diameter, SON – seismic velocity (vp)
and TSAL – temperature and salinity.
Fig. 3.1.4 Scheme to illustrate our path for cluster analysis. Cluster units are generated after
the input of downhole and XRF-data. The translation of cluster units to lithological
information requires the integration of analyzed physical and chemical properties of
cluster units with the visual core description of Stockhecke et al., (2014a). mblf –
meter below lake floor, CALI – borehole diameter, SGR – spectral gamma ray, K –
potassium, Th – thorium, U – uranium, RES – resistivity, RES,micro - high resolution
resistivity curve from the dipmeter tool (relative values), SON – seismic velocity (vp),
SUSC – magnetic susceptibility, Ca – calcium and Zr – zirconium.
Fig. 3.1.5 Downhole logging data at Ahlat Ridge and the five lithological units determined by
cluster analysis displayed as color-coded bar chart. mblf – meter below lake floor,
CALI – borehole diameter, SGR – spectral gamma ray, K – potassium, Th –
thorium, U – uranium, RES – resistivity, RES,micro - high resolution resistivity curve
from the dipmeter tool (relative values), SON – seismic velocity (vp) and SUSC –
magnetic susceptibility.
Fig. 3.1.6 a) Physical and chemical properties of lacustrine sediments displayed as a 3D
scatter plot. The clayey silts 1 and 2 can be separated mostly by their Th/U ratio.
b) Physical and chemical properties of tephra units. Except certain overlapping
values for tephra 1 and tephra 3, the tephra units can be differentiated with U, Zr
and SUSC. Th/U – thorium/uranium, Ca –intensity of calcium, RES – resistivity, Zr –
intensity of zirconium and SUSC – magnetic susceptibility.
Fig. 3.1.7 Observed depth shifts at hole 2D from the Ahlat Ridge site between logging depth
(mblf) and composite depth (mcblf). The plusses indicate depth matching points
used for correlation, whereas correlated tephra layers between composite profile
and cluster log are marked with circles.
Fig. 3.1.8 The correlation between lithological log from cluster analysis (30 – 210 mblf) at hole
D and the visual core description for the composite profile (30 – 210 mcblf)
(Stockhecke et al., 2014a). The tephra units from cluster analysis are summarized
(grey colored) and correlate with the V-layers from the composite profile. The depth
shifts are clearly visible by the angled alignment of the correlated layers. mblf –
meter below lake floor.
IV
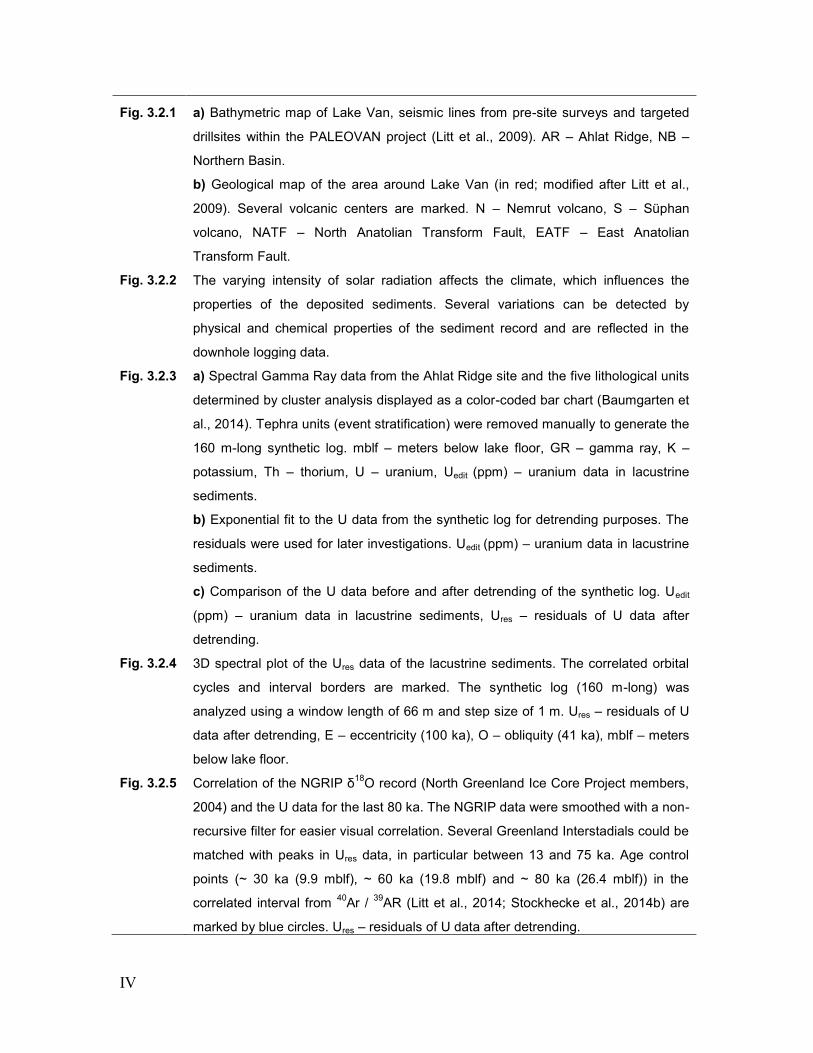
Fig. 3.2.1 a) Bathymetric map of Lake Van, seismic lines from pre-site surveys and targeted
drillsites within the PALEOVAN project (Litt et al., 2009). AR – Ahlat Ridge, NB –
Northern Basin.
b) Geological map of the area around Lake Van (in red; modified after Litt et al.,
2009). Several volcanic centers are marked. N – Nemrut volcano, S – Süphan
volcano, NATF – North Anatolian Transform Fault, EATF – East Anatolian
Transform Fault.
Fig. 3.2.2 The varying intensity of solar radiation affects the climate, which influences the
properties of the deposited sediments. Several variations can be detected by
physical and chemical properties of the sediment record and are reflected in the
downhole logging data.
Fig. 3.2.3 a) Spectral Gamma Ray data from the Ahlat Ridge site and the five lithological units
determined by cluster analysis displayed as a color-coded bar chart (Baumgarten et
al., 2014). Tephra units (event stratification) were removed manually to generate the
160 m-long synthetic log. mblf – meters below lake floor, GR – gamma ray, K –
potassium, Th – thorium, U – uranium, Uedit (ppm) – uranium data in lacustrine
sediments.
b) Exponential fit to the U data from the synthetic log for detrending purposes. The
residuals were used for later investigations. Uedit (ppm) – uranium data in lacustrine
sediments.
c) Comparison of the U data before and after detrending of the synthetic log. Uedit
(ppm) – uranium data in lacustrine sediments, Ures – residuals of U data after
detrending.
Fig. 3.2.4 3D spectral plot of the Ures data of the lacustrine sediments. The correlated orbital
cycles and interval borders are marked. The synthetic log (160 m-long) was
analyzed using a window length of 66 m and step size of 1 m. Ures – residuals of U
data after detrending, E – eccentricity (100 ka), O – obliquity (41 ka), mblf – meters
below lake floor.
Fig. 3.2.5 Correlation of the NGRIP δ18
O record (North Greenland Ice Core Project members,
2004) and the U data for the last 80 ka. The NGRIP data were smoothed with a non-
recursive filter for easier visual correlation. Several Greenland Interstadials could be
matched with peaks in Ures data, in particular between 13 and 75 ka. Age control
points (~ 30 ka (9.9 mblf), ~ 60 ka (19.8 mblf) and ~ 80 ka (26.4 mblf)) in the
correlated interval from 40
Ar / 39
AR (Litt et al., 2014; Stockhecke et al., 2014b) are
marked by blue circles. Ures – residuals of U data after detrending.
V
Fig. 3.2.6 a) Amplitude spectrum of NGRIP δ18
O record (North Greenland Ice Core Project
members, 2004) for 13 – 75 ka. The NGRIP data were smoothed with a non-
recursive filter. Several high-frequency signals are indicated by spectra peaks. The
associated cyclicitiy (1.5 ka) is labeled.
b) Amplitude spectrum of residuals of U data after detrending (Ures) in the lacustrine
sediments from 13 – 75 ka. The periodicity of 1.5 ka is evident in this dataset and is
indicated by a red label.
Fig. 3.2.7 Comparison of the age-depth models from spectral analysis (red line) and core
correlation (black line; averaged after Stockhecke et al., 2014b). The increase of the
sedimentation rates coincides with the > 9 m thick tephra layer and suggests a
change in the sedimentary system at approximately 270 - 300 ka, mblf – meters
below lake floor.
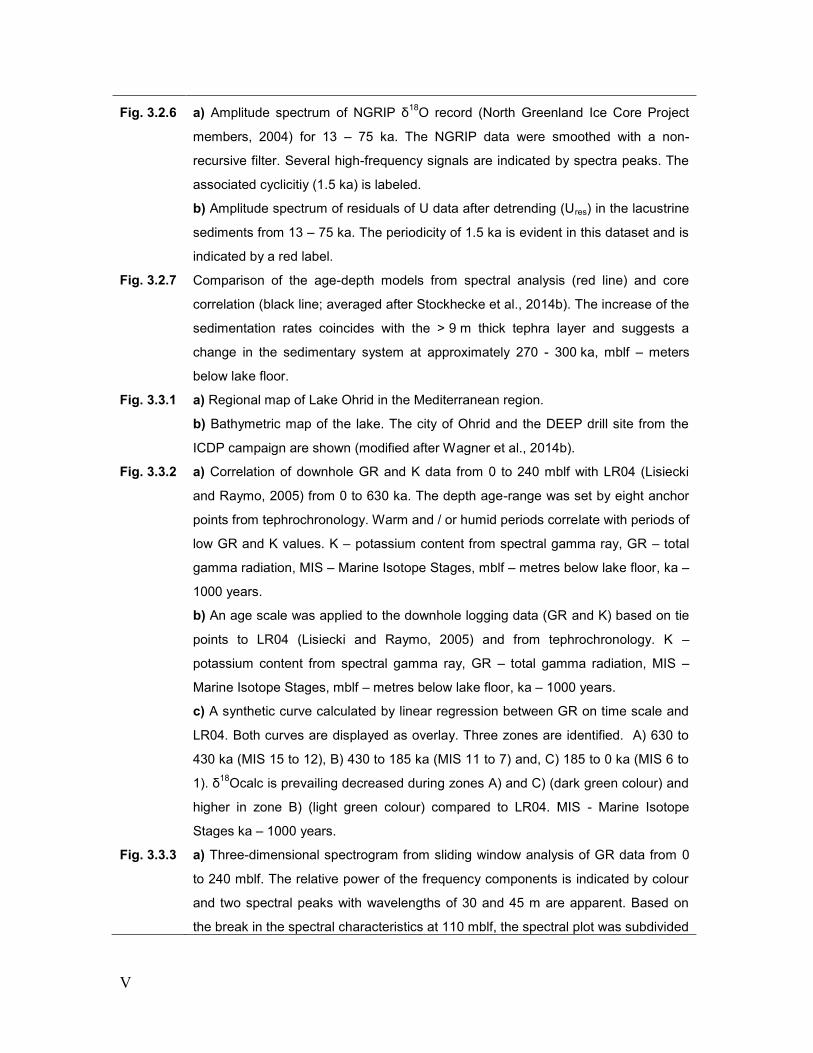
Fig. 3.3.1 a) Regional map of Lake Ohrid in the Mediterranean region.
b) Bathymetric map of the lake. The city of Ohrid and the DEEP drill site from the
ICDP campaign are shown (modified after Wagner et al., 2014b).
Fig. 3.3.2 a) Correlation of downhole GR and K data from 0 to 240 mblf with LR04 (Lisiecki
and Raymo, 2005) from 0 to 630 ka. The depth age-range was set by eight anchor
points from tephrochronology. Warm and / or humid periods correlate with periods of
low GR and K values. K – potassium content from spectral gamma ray, GR – total
gamma radiation, MIS – Marine Isotope Stages, mblf – metres below lake floor, ka –
1000 years.
b) An age scale was applied to the downhole logging data (GR and K) based on tie
points to LR04 (Lisiecki and Raymo, 2005) and from tephrochronology. K –
potassium content from spectral gamma ray, GR – total gamma radiation, MIS –
Marine Isotope Stages, mblf – metres below lake floor, ka – 1000 years.
c) A synthetic curve calculated by linear regression between GR on time scale and
LR04. Both curves are displayed as overlay. Three zones are identified. A) 630 to
430 ka (MIS 15 to 12), B) 430 to 185 ka (MIS 11 to 7) and, C) 185 to 0 ka (MIS 6 to
1). δ18
Ocalc is prevailing decreased during zones A) and C) (dark green colour) and
higher in zone B) (light green colour) compared to LR04. MIS - Marine Isotope
Stages ka – 1000 years.
Fig. 3.3.3 a) Three-dimensional spectrogram from sliding window analysis of GR data from 0
to 240 mblf. The relative power of the frequency components is indicated by colour
and two spectral peaks with wavelengths of 30 and 45 m are apparent. Based on
the break in the spectral characteristics at 110 mblf, the spectral plot was subdivided
VI
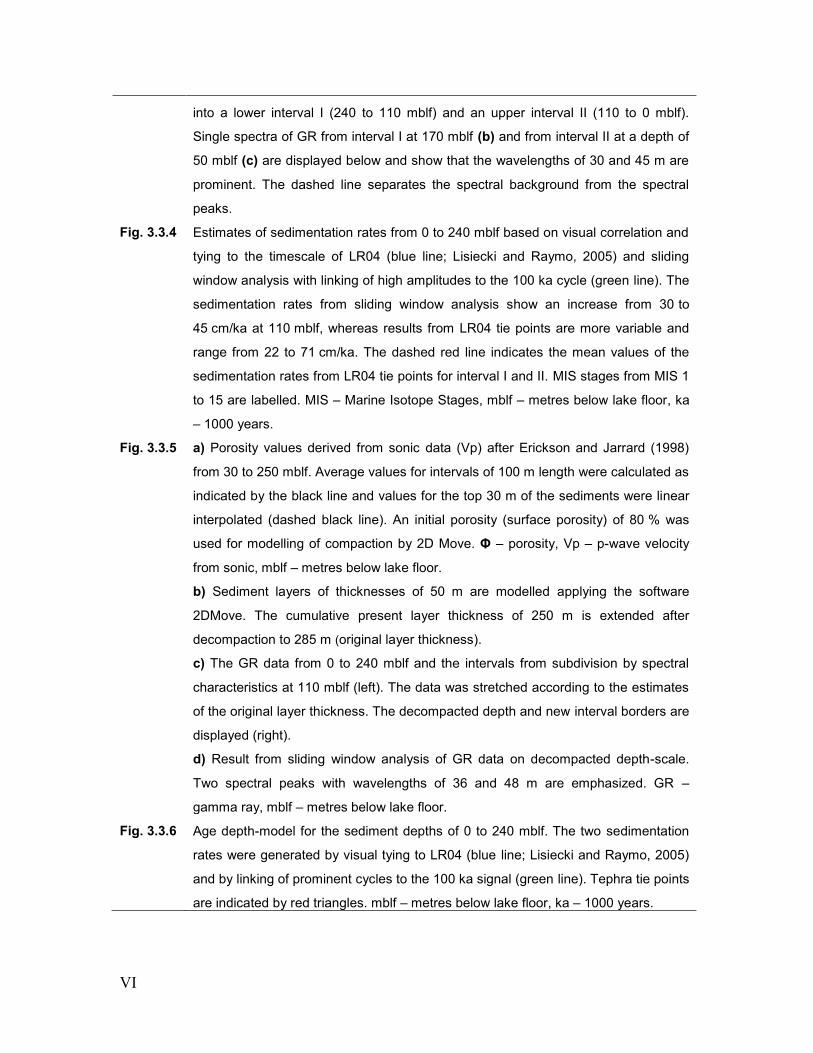
into a lower interval I (240 to 110 mblf) and an upper interval II (110 to 0 mblf).
Single spectra of GR from interval I at 170 mblf (b) and from interval II at a depth of
50 mblf (c) are displayed below and show that the wavelengths of 30 and 45 m are
prominent. The dashed line separates the spectral background from the spectral
peaks.
Fig. 3.3.4 Estimates of sedimentation rates from 0 to 240 mblf based on visual correlation and
tying to the timescale of LR04 (blue line; Lisiecki and Raymo, 2005) and sliding
window analysis with linking of high amplitudes to the 100 ka cycle (green line). The
sedimentation rates from sliding window analysis show an increase from 30 to
45 cm/ka at 110 mblf, whereas results from LR04 tie points are more variable and
range from 22 to 71 cm/ka. The dashed red line indicates the mean values of the
sedimentation rates from LR04 tie points for interval I and II. MIS stages from MIS 1
to 15 are labelled. MIS – Marine Isotope Stages, mblf – metres below lake floor, ka
– 1000 years.
Fig. 3.3.5 a) Porosity values derived from sonic data (Vp) after Erickson and Jarrard (1998)
from 30 to 250 mblf. Average values for intervals of 100 m length were calculated as
indicated by the black line and values for the top 30 m of the sediments were linear
interpolated (dashed black line). An initial porosity (surface porosity) of 80 % was
used for modelling of compaction by 2D Move. Φ – porosity, Vp – p-wave velocity
from sonic, mblf – metres below lake floor.
b) Sediment layers of thicknesses of 50 m are modelled applying the software
2DMove. The cumulative present layer thickness of 250 m is extended after
decompaction to 285 m (original layer thickness).
c) The GR data from 0 to 240 mblf and the intervals from subdivision by spectral
characteristics at 110 mblf (left). The data was stretched according to the estimates
of the original layer thickness. The decompacted depth and new interval borders are
displayed (right).
d) Result from sliding window analysis of GR data on decompacted depth-scale.
Two spectral peaks with wavelengths of 36 and 48 m are emphasized. GR –
gamma ray, mblf – metres below lake floor.
Fig. 3.3.6 Age depth-model for the sediment depths of 0 to 240 mblf. The two sedimentation
rates were generated by visual tying to LR04 (blue line; Lisiecki and Raymo, 2005)
and by linking of prominent cycles to the 100 ka signal (green line). Tephra tie points
are indicated by red triangles. mblf – metres below lake floor, ka – 1000 years.
VII
List of tables
3.1.1 Physical and chemical properties (mean and standard deviations) for five lithological
units determined by cluster analysis.
3.1.2 Classification of prevailing volcanic compositions for Lake Van according to their
physical and chemical properties. Displayed are possible detection methods (Log-
/XRF response) and linking of tephra units 1 – 3 to the volcanic composition.
3.3.1 Downhole logging data correlated to LR04 (Lisiecki and Raymo, 2005). Eight anchor
points from tephrochronology are added and 30 additional tie points of significant
features between the downhole data and LR04 are set. The tephra ages were
recalculated (except Y-3) according relative to ACs-2 at 1.193 Ma (Nomade et al.,
2005) and the total decay constant of Steiger and Jäger (1977), uncertainties are
2δ. mblf – metres below lake floor.
VIII
Zusammenfassung
Im Rahmen des Internationalen Kontinentalen Bohrprogrammes (International
Continental Scientific Drilling Program; ICDP) wurden in zahlreichen Projekten lakustrine
Sedimentarchive erbohrt um das Verständnis klimatischer Steuerungsfaktoren und
geänderter Umweltdynamik zu vergrößern. In vielen Projekten wurden geophysikalische
Bohrlochmethoden eingesetzt, für wissenschaftliche Fragestellungen wurden diese
jedoch nur gering berücksichtigt. In dieser Arbeit wurde die Verwertbarkeit der
Bohrlochmessdaten hinsichtlich paläoklimatischer Fragestellungen evaluiert.
Die Basis der Untersuchungen bilden Messdaten zweier quartärer Seen, die als
besonders wertvolle Sedimentarchive eingeschätzt werden. Der in Ost-Anatolien
gelegene Lake Van umfasst die Klimageschichte des nahen Ostens der vergangenen
600 000 Jahre und der zwischen Mazedonien und Albanien liegende Lake Ohrid hat die
klimatische Vergangenheit des zentralen Mittelmeerraumes über mehr als 1 Millionen
Jahre archiviert. Die Sedimente der Seen wurden mithilfe tiefer, multiple Kernbohrungen
im Rahmen von ICDP Projekten beprobt und mit der Bohrlochmessaparatur des Leibniz
Institutes für Angewandte Geophysik (LIAG) vermessen.
Am Lake Van wurden in 2010 die Bohrlochmessdaten zweier Lokationen gewonnen. Die
paläoklimatischen Auswertungen konzentrierten sich auf das primäre Bohrziel, die Ahlat
Ridge site. Die Sedimente bestehen überwiegend aus tonigen Silten und Tephra
Schichten, die hauptsächlich vier vulkanischen, lokalen Quellen entstammen: 1) dem
Süphan (nördliches Seeufer), 2) dem Nemrut (15 km westlich vom westlichen Seeufer),
3) dem Incekaya (südwestliches Seeufer) und nicht näher definierten Eruptionszentren
innerhalb des Sees.
Über eine Clusteranalyse an Bohrlochmessdaten und Kerndaten aus
Röntgenfluoreszenzanalyse (X-ray fluorescence scanning) wurde ein kontinuierliches
lithologisches Profil der Sedimente von 30 bis 210 m unter Seeboden (mblf) erstellt. Fünf
Clustereinheiten wurden daraus abgeleitet und als zwei tonige Silte und drei Tephra
Einheiten übersetzt. Über starke Unterschiede in den Wertebereichen von spektralem
Gamma Ray (SGR), Zirkon Intensitäten (Zr) und magnetischer Suszeptibilität (SZ)
konnten die beiden Hauptgruppen klar unterschieden werden. Das litholgische
Kompositprofil wurde von Stockhecke et al. (2014a) aus den Kernen von sieben
parallelen Bohrlöchern erstellt, extrem detailliert beschrieben und in 15 lithologische
IX
Einheiten unterteilt. Um eine Vergleichbarkeit mit den Ergebnissen der Clusteranalyse
zu ermöglichen, wurde dieses heterogene Profil vereinfacht und zu zwei Hauptgruppen
zusammen gefasst. Diese zwei Gruppen mit paläoklimatischer Indikation sind
gebänderte tonige Silte (als kaltzeitliche Ablagerung interpretiert) und laminierte tonige
Silte (warmzeitliche Ablagerung).
Trotz dieser Vereinfachung wurde konnte keine Korrelation zwischen den
Clustereinheiten und den lithologischen Gruppen festgestellt werden. Folgende Gründe
erschweren den Vergleich beider Datensätze: a) Teufenunterschiede bis zu 2,5 m
zwischen Kern- und Logteufen, b) Unterschiede im vertikalen Auflösungsvermögen der
Bohrlochmessungen (im dm-Bereich) und der mm-genauen visuellen Kernbeschreibung,
c) geringe Schichtmächtigkeiten mit häufigem lithologischen Wechsel, der in den Logs
ein Mischsignal verursacht und d) geringe Unterschiede in den Wertebereichen der
verwendeten Parameter der kaltzeitlichen gegenüber den warmzeitlichen tonigen Silte.
Die Tephra Einheiten unterscheiden sich in SZ, SGR, Zr und Kalzium Intensitäten (Ca)
und wurden entsprechend ihrer physikalischen und chemischen Eigenschaften der
jeweiligen dominanten vulkanischen Zusammensetzung zugeordnet. Ein
Entwicklungstrend von überwiegend basaltischen Schichten von 210 bis 128 mblf zu
vermehrt dazitisch und rhyolitisch / trachytischen Ablagerungen im oberen Teil der
Bohrung wurde beobachtet.
Der Uran (U)- gehalt aus SGR wurde mit zyklostratigraphischen Methoden vom
Seeboden bis zu einer Tiefe von 210 mblf analysiert um Sedimentationsraten und die
Dauer der Ablagerung abzuschätzen. Da die zahlreichen Tephra Schichten die
kontinuierliche, pelagische Sedimentation unterbrochen haben, wurden diese aus dem
Datensatz entfernt. Das verbliebene, 160 m lange Log der U Konzentration wurde
spektral analysiert und mehrere deutlich ausgeprägte Zyklizitäten wurden als Milanković
Zyklen interpretiert. Aus dieser Interpretation wurden Sedimentationsraten abgeschätzt,
die von mittleren 33 cm/ka auf 22 cm/ka im oberen Teil der Bohrung abnehmen. Die
Dauer der Sedimentablagerung vom Seeboden bis zu einer Tiefe von 210 mblf beträgt
demnach 587 000 Jahre (587 ka). Die Kerninterpretation, die z.B. über Korrelation
zwischen dem gesamten organischen Kohlenstoff und den marinen Isotopenstadien
durchgeführt wurde, liefert mit 600 ka ein ähnliches Ergebnis.
Weiterhin wurden in den Urangehalten der vergangenen 75 ka höherfrequente
Fluktuationen beobachtet, die auf mit den aus Nordgrönland‘s Eiskernen (North
Greenland Ice Core Project) bekannten Interstadialen korrelieren. Unserer Interpretation
nach haben die Urangehalte in den Sedimenten des Lake Van’s die klimatischen
X
Schwankungen der vergangen sechs Glazial-Interglazial-Zyklen aufgezeichnet und das
Sedimentsystem hat in den letzten 75 ka sogar auf Änderungen im sub-Milanković
Bereich reagiert.
Am Lake Ohrid wurden im Jahre 2013 vier Lokationen erbohrt und die bisherigen
Untersuchungen konzentrieren sich auf die DEEP site, wo die Sedimente über den
längsten Zeitraum kontinuierlich abgelagert wurden. Von 569 bis 433 mblf wurde eine
Flachwasserfazies erbohrt und ab einer Tiefe von 433 mblf herrschen pelagische
Bedingungen mit der Ablagerung von tonigen Silten vor.
Die aus Bohrlochmessungen gewonnenen Gamma Ray (GR) und Kalium (K) Gehalte
von 0 bis 240 mblf korrelieren deutlich mit Fluktuationen in der globalen Sauerstoff-
Isotopenfraktionierung (δ18O) aus marinen Sedimentkernen (Lisiecki und Raymo,
2005). GR und K werden als verlässliche Indikatoren für Glazial-Interglazial-Zyklen
interpretiert mit vermehrtem Eintrag von klastischem Material während kaltzeitlich und /
oder trockener Perioden und einer erhöhten Karbonatausfällung in warmzeitlich und /
oder humiden Abschnitten. Das postulierte Klimasignal und die Änderung der zyklischen
Charakteristik der Daten wurde mittels Spektralanalyse untersucht. Ein starker Einfluss
des 100 ka Zyklus wurde als dominant interpretiert und daraus Sedimentationsraten und
die Dauer der Ablagerung ermittelt. Hierbei wurde der Effekt der Kompaktion auf die
Sedimentationsraten untersucht und entsprechend korrigiert. Die Korrektur um 14 %
liefert Sedimentationsraten von 36 cm/ka (240 bis 110 mblf) und 48 cm/ka (110 mblf bis
zum Seeboden). Aus der Kombination der Ergebnisse sowie acht
tephrostratigraphischer Alters-Tiefen-Punkte aus Kernanalysen wurde ein belastbares
Altersmodell des Lake Ohrid der vergangenen 630 ka erstellt.
Die Interpretation der Bohrlochmessdaten vom Lake Van und Lake Ohrid haben
wertvolle Erkenntnisse über die Klimageschichte der Seen geliefert. Über die integrierte
Auswertung dieser Ergebnisse mit Kernanalysen lassen sich paläoklimatische Studien
erweitern und verbessern. Das volle Potential dieser Methoden sollte daher umfassend
genutzt werden.
XI
Summary
Several studies on lacustrine sediment records were performed in the frame of the
International Continental Scientific Drilling Program (ICDP) to enhance the knowledge of
past environmental dynamics and climate controls. Downhole logging data was often
acquired in these drilling campaigns but the data is rarely used to contribute to research
themes of the projects. In this thesis, potential applications of these datasets to improve
paleoenvironmental studies were investigated.
This study is based on interpretation of downhole logging data from the sediments of two
ancient lakes, Lake Van (Turkey) and Lake Ohrid (Macedonia / Albania). Both lakes are
considered to be outstanding archives for paleoenvironmental studies whereas Lake
Van has recorded the climate history of the Middle East over 600,000 years (ka) and
Lake Ohrid of the Central Mediterranean region over more than one million years. Deep
drilling campaigns in the framework of ICDP were executed at Lake Van in 2010 and at
Lake Ohrid in 2013. Multiple and parallel coring were used and the downhole logging
tools of the Leibniz Institute for Applied Geophysics (LIAG) were applied at one hole of
each drill site.
Two sites were targeted at Lake Van and data interpretations were focused on Ahlat
Ridge site which is the primary drill site for paleoclimatic investigations. Cores have
shown that the sediments are mainly composed of clayey silts and tephra deposits. The
latter were supplied by four volcanic sources: 1) the Süphan volcano, located on the
northern shore, 2) the Nemrut volcano, 15 km west of the western shore, 3) the Incekaya
volcano, on the southwestern shore and 4) intralake eruptive centers.
The sedimentary record of Lake Van from 30 to 210 m below lake floor (mblf) was
differentiated by downhole logging and additional X-ray fluorescence (XRF) scanning
data through cluster analysis to construct a continuous lithological profile. Five cluster
units were derived and transformed into three tephra and two clayey silt units. Spectral
gamma ray (SGR), zirconium intensities (Zr) and magnetic susceptibility (SZ) are most
useful to separate the lacustrine facies from tephra deposits.
The lithology was classified into 15 lithological units by Stockhecke et al. (2014a) and a
composite profile was created from seven parallel holes. This heterogeneous profile was
simplified into two major groups of lacustrine sediments: banded clayey silts (interpreted
as glacial deposits) and laminated clayey silts (interpreted as interglacial deposits) for
comparability purposes with the cluster analysis.
XII
However, no correlation between the two clayey silt units derived from cluster analysis
and the banded and laminated clayey silts could be found. The following reasons are
proposed: (a) significant depth shifts of up to 2.5 m between the core depth and the
downhole measurements, (b) differences in between the vertical resolution of the used
data and the detailed core description in mm-scale, (c) thin layers and intercalations of
different lithotypes have produced mixed signals by the used methods and, (d)
separation of cluster units was difficult to perform because the contrast within the input
data is too low (possibly background sedimentation) to distinguish between glacial and
interglacial deposits.
The tephra units have contrasting properties and differ in their SZ, SGR and XRF
intensities of calcium (Ca) and Zr. A spatial evolution of basaltic deposits in the bottom
part (128 to 210 mblf) to more highly differentiated (dacitic and rhyolitic / trachytic)
products towards the top of the record was observed.
The U data from SGR logging of the sediments from 0 to 210 mblf was used for
cyclostratigraphic studies to estimate the sedimentation rates and the time of deposition.
Numerous tephra layers prevent the detection and analysis of climate cycles and these
layers were removed. A synthetic log was created afterwards and spectral analyzed
(cumulative thickness of the tephra ≈ 50 m; remaining lacustrine sediments ≈ 160 m).
High amplitudes were detected and correlated to Milanković cycles. Their evolution was
analyzed and interpreted as variations in sedimentation rates of mean values of
22 cm/ka in the lower part to 33 cm/ka in the upper section. According to the estimates
of sedimentation rates, the sediments between the lake floor and a depth of 210 mblf
were deposited over a period of 587 ka. The results agree with core interpretations (e.g.,
correlation of total organic carbon with Marine Isotope Stages) which suggest a time
span of deposition of 600 ka.
High-frequency cycles were detected and correlated with interstadials from the North
Greenland δ18O record for the past 75 ka and the two datasets agreed closely.
It has been demonstrated that climate signals, even on sub-Milanković scale, are
imprinted in U data of Lake Van’s sediments and cyclostratigraphic methods are
applicable if event layers are substracted from the record.
XIII
Four sites were cored during the ICDP project at Lake Ohrid and investigations are
concentrated on the DEEP site. This primary site has most likely recorded the longest
part of Lake Ohrid’s geological past. First results from cores indicate, that lacustrine
clayey silts build up the main part of the record down to a depth of 433 mblf and a
shallow water facies prevail from 433 to 569 mblf.
Gamma ray (GR) fluctuations and potassium (K) values from downhole logging data
obtained in the sediments of Lake Ohrid from 0 to 240 mblf correlate with fluctuations in
δ18O values from the global benthic isotope stack LR04 (Lisiecki and Raymo, 2005). GR
and K values are considered a reliable proxy to depict glacial-interglacial cycles, with
high clastic input during cold and / or drier periods and high carbonate precipitation
during warm and / or humid periods at Lake Ohrid. Spectral analysis was applied to
investigate the climate signal and their evolution over the length of the record. Linking
downhole logging data with orbital cycles was used to estimate sedimentation rates and
the effect of compaction was compensated for. Sedimentation rates increase on average
by 14 % after decompaction of the sediment layers and the mean sedimentation rates
shift from 48 cm/ka between 0 to 110 m to 36 cm/ka from 110 to 240 mblf. Tuning of
minima and maxima of gamma ray and potassium values versus LR04 extrema, in
combination with eight independent tephrostratigraphical tie points, allows establishing
of a robust age model over the past 630 ka.
In summary, important new insights about the environmental history of Lake Van and
Lake Ohrid were gained by interpretation of downhole logging data. In conjunction with
core analysis and integration of both datasets, paleoclimatic studies of lake archives can
be complemented and improved. There from, the use of its full potential is highly
recommended in the frame of paleoenvironmental studies.

1
Outline of the thesis
This thesis consists of three scientific publications as well as of a framework paper. It
starts with an introduction about the scientific background of research on ancient lakes in
the framework of the International Continental Scientific Drilling Program (ICDP). In the
following section, the motivation of this study as well as research questions of the
individual articles are outlined. The next part introduces the study sites and highlights the
specific conditions of Lake Van (Turkey) and Lake Ohrid (Macedonia / Albania). In
addition, a brief overview about the projects, the drilling campaigns and the recovered
sediment cores is given.
Within the methods section, the physical principles of the used downhole logging data
and their general application in sediments are described shortly. Subsequently, the used
mathematical methods are summarized.
The results section contains three research articles and form the core of this thesis. Two
of the papers show results from the ICDP project at Lake Van which have been
published in 2014. The 3rd paper is based on data from the ICDP drilling campaign at
Lake Ohrid and it was submitted to the journal “Biogeochemistry”. The article is accepted
for publication as discussion paper at the present time and therefore, slight modifications
from the included version are expected.
The final discussion and conclusions section discusses the main findings of the
individual articles and compare their results. Furthermore, conclusions from this study
are presented as well as perspectives for further research.
2
1. Introduction
1.1 Paleoclimatic studies of lakes
Due to the high social and economic impact of climate change, sediment records have
been studied in the last decades to improve the understanding of past climate dynamics
and to predict future climate change. Studies of paleoclimate archives were extensively
done on marine sediment archives starting with the Deep Sea Drilling Project (DSDP) in
1966 and are ongoing within recent drilling projects under the framework of the
International Ocean Discovery Program (IODP). The continuous and undisturbed
(pelagic) sedimentary conditions of many marine sites predestine them for investigations
of their environmental past.
However, long and complete sediment records can be preserved on continents as well
and make them potential valuable for paleoclimate studies. Terrestrial sediment archives
were targeted with particular focus on lake sediments for the past two decades in the
frame of ICDP. Shipborne seismic surveys and multiple coring of these sediments were
conducted as well as often geophysical downhole logging (Fig. 1.1.1). Here within,
several ancient lakes from climate-sensitive regions were selected to the present time,
which have recorded the environmental history and the associated sedimentary
conditions over a long period of time (e.g. Litt et al., 2014; Melles et al., 2012;
Prokopenko et al., 2006; Scholz et al., 2011; Zolitschka et al., 2013).
These records cover time spans of hundreds of thousands to million years and
complement the data from marine sites. The climatic conditions are highly dependent on
the location of a certain site (latitude) and the intensity of the solar insolation differs
significantly between, e.g. tropics and Polar Regions. Thus, for best possible studies of
climate dynamics, a high spatial and temporal coverage of records from potential
climate-sensitive sites is required. Compared to the marine realm, lakes are relatively
small and some are closed hydrologic systems. These conditions make them highly
sensitive for changes in temperature and humidity and their ecosystems can be affected
even by subtle climate changes which might be “smoothed” by the larger and slower
responding oceans. Furthermore, the sedimentation rates of lacustrine systems are
mostly higher, compared to distal marine settings, and allow for very high resolution
Introduction
3
studies up to annual scale (Zolitschka and Negendank, 1999). However, the more
proximal location of lake records to potential source areas of detrital material and lake
basin geometries (small sub-basins, steep slopes) might yield the risk of disturbances of
continuous sedimentation by event deposits (mass wasting deposits) (Cukur et al., 2013;
Lindhorst et al., 2015).
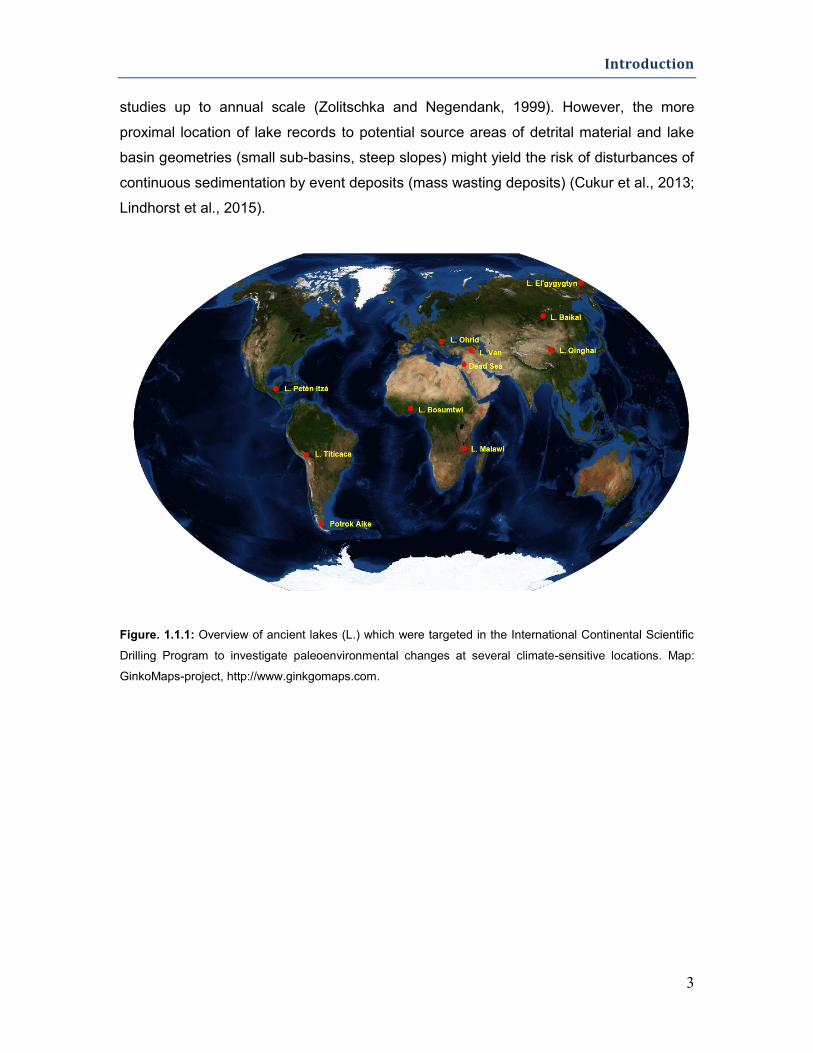
Figure. 1.1.1: Overview of ancient lakes (L.) which were targeted in the International Continental Scientific
Drilling Program to investigate paleoenvironmental changes at several climate-sensitive locations. Map:
GinkoMaps-project, http://www.ginkgomaps.com.
Motivation of this study and research questions
4
1.2 Motivation of this study and research questions
The majority of the paleoclimatic investigations from scientific drilling projects in the
ICDP program were performed on sediment cores. Several studies were focused on
climate proxies that span from direct indicators for a certain environmental state, such as
pollen or diatom assemblages, to indirect indicators, e.g. the elemental distribution
(Prokopenko et al., 2001; Solotchina et al., 2009). The latter might e.g. indicate climate-
related variations in surface processes and associated content of detrital material. The
analyses range from relatively fast and simple detection of physical properties by Multi
Sensor Core Logging to extensive analyses on discrete samples, such as isotopes or
pollen (Litt et al., 2014; Nowaczyk et al., 2013; Scholz et al., 2011; Shanahan et al.,
2012). The investigations of multiple proxies use an integrated interpretation of as many
as possible of the environmental indicators to provide a comprehensive picture of the
geological past (Nowaczyk et al., 2013).
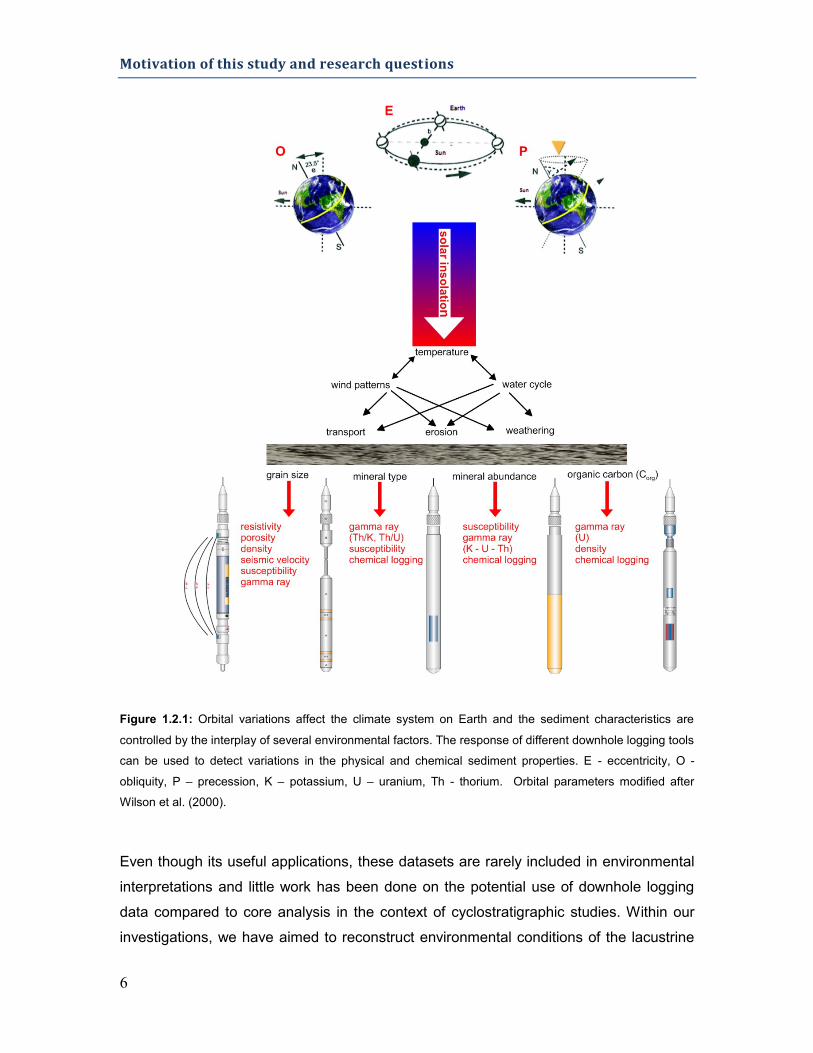
Sediment characteristics are affected by several environmental factors as temperature
and humidity and numerous physical and chemical properties can be used to detect
changes in these characteristics (Fig. 1.2.1). Differences in the porosity or texture of
sediments, such as sorting and grain size, can be detected easily by resistivity or
acoustic velocity whereas different sediment composition (mineral content, components)
is most likely reflected in e.g. spectral gamma ray (contents of potassium, thorium and
uranium) or magnetic susceptibility data (Buecker et al., 2000; Rider and Kennedy,
2011; Serra and Serra, 2003). Therefore, downhole logging data can be analyzed in
terms of sediment dynamics and lithological changes and has the potential to indicate
certain climatic conditions or climatic trends.
Environmental reconstructions of sediments require a robust temporal framework of their
past geological evolution and there from a reliable age depth-model. Several
approaches are involved to achieve this, such as the tuning of proxy data (e.g. δ18O or
total organic carbon; TOC) to reference records (Lang and Wolff, 2011; Stockhecke et
al., 2014a) and the use of radiometric ages (e.g. from dating of volcanic material in the
cores) as well as tephrostratigraphy (Sulpizio et al., 2010; Sumita and Schmincke,
2013b, Vogel et al., 2010c). However, suitable material for independent dating might be
scarce and the temporal evolution in between age control-points (changes in the
sedimentation rates) remains uncertain.
Global climate signals (Milanković cycles; Milanković, 1920) are known to have an effect
Introduction
5
on sediment properties and can contribute to the reconstruction of the temporal
framework of a sedimentary record (Batenburg et al., 2012; Prokopenko et al., 2006; Wu
et al., 2012). These cycles have periodicities of 100,000 years (eccentricity = E), 41,000
years (obliquity = O), 23,000 and 19,000 years (precession = P2, P1) in the Quaternary
Period and determine the intensity of the solar insolation on Earth (Fig. 1.2.1), whereas
their effect is non-uniform and depends on the location of a certain site (e.g. the effect of
O is strongest at polar regions) (Pälike, 2005). The 100,000 years (ka) cycle dominates
the past circa (c.) 900 ka (Berger and Loutre, 2010), which is evident in sedimentary
records and strongly imprinted in the widely-used climate reference record, the global
benthic isotope stack LR04 (Lisiecki and Raymo, 2005, 2007). However,
cyclostratigraphic studies require a good preservation of these cycles as well as their
complete recording.
Contrasting physical properties and therefore changes in the sediment characteristics,
such as sedimentological composition and grain size, can trigger cyclic changes in the
logging data (Baumgarten and Wonik, 2014; Kashiwaya et al., 1999; Paulissen and
Luthi, 2011; Scholz et al., 2011) and cyclostratigraphic analysis of these datasets have
been proven successful within several works (Barthes et al., 1999; Golovchenko et al.,
1990; Jarrard and Arthur, 1989; Molinie and Ogg, 1990b; Wonik, 2001).
Further, a dataset of physical and chemical in situ sediment properties is provided by
downhole logging methods, which is available within hours after the measurements were
initiated. In addition to the time saving, it offers some more advantages in comparison to
core analysis. Many physical properties depend strongly on the sediment texture (e.g.
resistivity and acoustic velocity) which are most likely disturbed in sediment cores by
pressure release and cutting of even smaller volume samples after cores are at surface
level. In contrast to core analysis, less-disturbed formation characteristics can be
recorded by downhole logging methods.
Multiple coring of a certain site is commonly used in scientific drilling projects, to reduce
the likelihood of low core recovery. However, core gaps cannot be precluded and a core
recovery of e.g. 85 % only, can leave significant parts of the geological past unravelled;
for investigation of a 600 ka-long record, a 15 % core loss mean losing about 90 ka of
the climate history. The complete coverage of the sedimentary succession by downhole
logging methods is more likely in comparison to coring.
Motivation of this study and research questions
6
Figure 1.2.1: Orbital variations affect the climate system on Earth and the sediment characteristics are
controlled by the interplay of several environmental factors. The response of different downhole logging tools
can be used to detect variations in the physical and chemical sediment properties. E - eccentricity, O -
obliquity, P – precession, K – potassium, U – uranium, Th - thorium. Orbital parameters modified after
Wilson et al. (2000).
Even though its useful applications, these datasets are rarely included in environmental
interpretations and little work has been done on the potential use of downhole logging
data compared to core analysis in the context of cyclostratigraphic studies. Within our
investigations, we have aimed to reconstruct environmental conditions of the lacustrine
Introduction
7
sediments and to generate an age depth-model by cyclostratigraphic analysis. We have
focused on several questions which are of high importance for the respective projects:
(1) Can one separate the sediments of different environmental states of the study
sites (glacial vs. interglacial sedimentary conditions) by the downhole logging
data and how are they characterized?
(2) Is it possible to derive environmental proxies from our data and are they
transferable in between the lakes?
(3) Have orbital signals affected the sedimentation and are these cycles identifiable
by contrasting chemical and physical properties?
(4) Have even climate oscillations in millennial scales played a significant role and
are the sedimentation rates sufficiently high to allow the detection of these
cycles?
(5) Can the signals be used for cyclostratigraphic methods to reconstruct an age
depth-model and estimate sedimentation rates? What is the effect of compaction
(porosity reduction) on these calculations?
1.3 Lake Van: high resolution climate archive of the Middle East
1.3.1 Site highlights and major preparatory work for the PALEOVAN project
Very few long sediment records of several glacial-interglacial cycles were identified up to
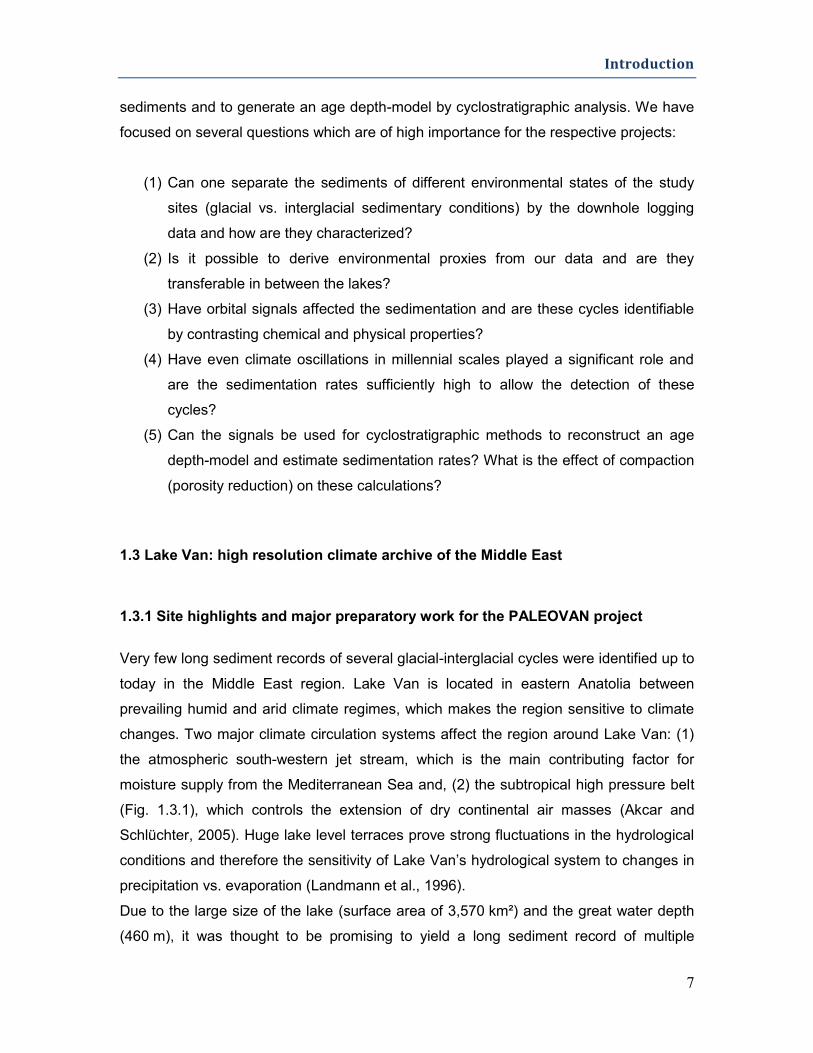
today in the Middle East region. Lake Van is located in eastern Anatolia between
prevailing humid and arid climate regimes, which makes the region sensitive to climate
changes. Two major climate circulation systems affect the region around Lake Van: (1)
the atmospheric south-western jet stream, which is the main contributing factor for
moisture supply from the Mediterranean Sea and, (2) the subtropical high pressure belt
(Fig. 1.3.1), which controls the extension of dry continental air masses (Akcar and
Schlüchter, 2005). Huge lake level terraces prove strong fluctuations in the hydrological
conditions and therefore the sensitivity of Lake Van’s hydrological system to changes in
precipitation vs. evaporation (Landmann et al., 1996).
Due to the large size of the lake (surface area of 3,570 km²) and the great water depth
(460 m), it was thought to be promising to yield a long sediment record of multiple
Lake Van: high resolution climate archive of the Middle East
8
glacial-interglacial cycles. Several studies have demonstrated the potential of Lake Van
for a deep scientific drilling campaign to investigate the paleoclimatic history of the
Middle East. Shallow coring in 1990 has shown that the sediments have an annual
resolution of at least 15 ka (Landmann et al., 1996); this extraordinary high resolution
makes the record promising to study climate oscillations even on millennial-scale.
Furthermore, numerous tephra layers were identified in the sediments from shallow
coring; at least 11 volcanic ash layers were described for the past 15 ka (Landmann et
al., 1996). A pre-site survey, including an extended seismic campaign, was carried out in
2004 and the lake geometry and sedimentary pattern were investigated on larger scale;
well-stratified and undisturbed lacustrine sediments were identified in the deepest part of
the lake, the Tatvan Basin (Litt et al., 2009). Amongst other methods as orbital tuning,
the high number of tephra layers was considered as promising to provide a robust
chronological framework of the record by tephrochronology. There from, Lake Van was
considered as key site for investigation of quaternary climate evolution and amplitude in
the Middle East region as well as its volcanic and tectonic history (Litt et al., 2009).
Figure 1.3.1: Overview of the major circulation systems and their mean positions during the year which
affect the area around Lake Van. PFJ – Polar Front Jet, STJ – Subtropical Jet, ITCZ – Intertropical
Convergence Zone, mP – Marine Polar Air Mass, mT – Marine Tropical Air Mass, cP – Continental Tropical
Air Mass (modified after Litt et al., 2009).
Introduction
9
1.3.2 Geological setting of Lake Van
Lake Van is located on a high plateau in eastern Anatolia (38° 38' N, 42° 54' E) and its
present lake level is at 1665 m above sea level (m asl) (Litt et al., 2011). Eastern
Anatolia has three major tectonic units, the Pontide unit, the Eastern Anatolian
Accretionary Complex, and the Bitlis-Poturge Massif (Keskin, 2003) (Fig. 1.3.2). The
lake is located close to the Bitlis Thrust zone where the northwards moving
Afro / Arabian plate collides with the Anatolian / Eurasian plate. The region is
volcanically active as evidenced by regional volcanism, earthquakes and hydrothermal
activity (Litt et al., 2009). Lake Van’s basin is part of the Muş basin which extends
towards the south and is separated from the lake by a large volcano (Nemrut) with an
elevation of 2,948 m asl. It is hypothesized that the basin of Lake Van was formed due to
the growth of Nemrut, which has hampered the outflow of the Muş basin (Cukur et al.,
2013). Two more large volcanic systems are situated closely to Lake Van, the Süphan
volcano lies on the northern lake shore and the Incekaya volcano on the southwestern
shore.
The region is widely covered by Tertiary to Holocene volcanic deposits and the chemical
weathering of these volcanic deposits, in conjunction with hydrothermal activity, have
influenced the high alkalinity (pH = 10.8) of the lake water (Litt et al., 2009). Lake Van’s
water level was subject of major changes up to hundreds of metres, which is evidenced
by huge lake level terraces (Cukur et al., 2013; Litt et al., 2009). The basin geometry can
be divided into the physiographic provinces of a lacustrine shelf, a sublacustrine slope
and the lake basin, whereas the Tatvan basin is the deepest part of the lake (Cukur et
al., 2013).
1.3.3 ICDP drilling campaign
A deep drilling campaign within the frame of the ICDP project (PALEOVAN) was
executed from July to August 2010. The Deep Lake Drilling System (DLDS) of the
company DOSECC (Drilling, Observation and Sampling of the Earth’s Continental Crust)
Exploration Services was used (Litt et al., 2012). Two sites were cored multiple times,
the Northern Basin (NB) site was drilled down to 140 mblf and the Ahlat Ridge (AR) site
to a terminal depth of 220 mblf with core recoveries of 71 % (NB) and 91 % (AR) (Litt et

Lake Van: high resolution climate archive of the Middle East
10
Figure 1.3.2: The geological map shows the major tectonic units, thrust zones and volcanic centres of
different sizes of the Eastern Anatolia region. EATF – East Anatolian Fault, NATF – North Anatolian Fault,
E-K-P – Erzurum-Kars Plateau, volcanic centres (mounts): Ag – Agri, Al - Aladag, Bi – Bingol, BI –
Bilicandagi, D – Dumanlidag, E – Etrusk, H – Hamadag, Ka – Karatepe, Ki – Kisirdag, M – Meydandag, N –
Nemrut, S – Süphan, T – Tendürek, Z – Ziyaretdag (modified after Keskin, 2005 and Litt et al., 2009).
al., 2011).The coring was greatly slowed down due to thick tephra layers (tens of
metres); their unconsolidated nature made them difficult to drill. Downhole logging tools
from the Leibniz Institute for Applied Geophysics (LIAG) were used to measure one hole
of each site. After few drillpipes were pulled, the sondes were run into the hole and the
accessible open hole-sections were logged. The uppermost pipes (from the lake floor to
30 mblf) were kept in the sediments to prevent caving in; most of the used downhole
logging tools require open hole conditions and the data could be acquired below 30 mblf.
First core analyses by Multi Sensor Core Logger (MSCL) were performed in onshore
laboratories and the cores were shipped to the Center for Marine Environmental
Introduction
11
Sciences (MARUM) at the University of Bremen. Further analyses as splitting, X-ray
fluorescence (XRF) scanning and sub-sampling were performed at MARUM (Litt et al.,
2012).
1.3.4 Lithology and composite profile
For the main drillsite (AR), a 219-long composite profile was generated from seven holes
by Stockhecke et al. (2014a). The lithology is dominated by carbonaceous clayey silts
(76 %) which consist of silicilastics, carbonates, organic matter and biogenic silica.
Frequent intercalations of tephra layers (17 %) and turbidites of millimetre to centimetre-
scale (3 %) occur at AR (Stockhecke et al., 2014a). Below 210 mblf, more coarse
grained sediments (sands and gravels) were found; they were most likely formed under
fluvial conditions during the initial lake phase (Stockhecke et al., 2014a). The clayey silts
are predominant banded or laminated. The laminated sediments were interpreted to be
deposited during warm / wet stages (interstadials / interglacials) as indicated e.g. by
higher amounts of pollen which favour warmer environments (Litt et al., 2011). They
reflect strong seasonality in conjunction with preservation of high amounts of organic
matter (OM), high calcium carbonate contents (CaCO3) and anoxic conditions at the
bottom of the lake (Stockhecke et al., 2014a). The banded clayey silts were most likely
deposited during cold / dry stages with lack of strong seasonality and abundant
occurrence of pollen from steppe plants (Litt et al., 2011). They have variable CaCO3
contents and low OM and indicate completely mixed lake water.
1.4 Lake Ohrid: an environmental archive back to the Tertiary?
1.4.1 Lake Ohrid’s special features
Lake Ohrid is a transboundary lake between Macedonia (Former Yugoslav Republic of
Macedonia) and Albania (40°70′ N, 20°42′ E) in the Central Mediterranean region (Fig.
1.4.1). The lake was assumed as of Tertiary age and thus considered as Europe’s oldest
lacustrine system which still exists. It has an extraordinary number of endemic species
(> 200) and there from it was hypothesized that the ecosystem must have been stable
for a long time to enable their spread and several studies were performed in the 1970’s.
Lake Ohrid: an environmental archive back to the Tertiary?
12
Lake Ohrid’s postulated great age and remarkable endemism made it a potential
candidate for paleoenvironmental studies of the Mediterranean region in the frame of
ICDP. The lake was assumed to be a promising site to extend the small number of
continental records in the region and to create a connection to the Mediterranean Sea
(Wagner et al., 2008). Between 2002 and 2005 surface sediment cores were cut and
shallow seismic were performed on the lake; the latter could be used to investigate the
uppermost 40 to 50 m of the sediments. The sediments of the central basin are widely
uniform and bioturbated, whereas the bioturbation prevents paleoenvironmental
reconstructions on annual scale. However, Lake Ohrid was considered to be an
extraordinary valuable archive to study long-term environmental changes back to the
Tertiary (Wagner et al., 2008). An additional coring campaign in 2008 and studies on a
15 m long core revealed, that warm interglacials and cold glacials are clearly imprinted in
the sediments and can be differentiated by the contents of calcite, clastics and organic
matter. Further, some tephra layers were observed and correlated to mainly well-dated
eruptions of Italian volcanoes to provide a chronostratigraphical frame (Vogel et al.,
2010a). They occurrence have proven that Lake Ohrid has recorded the volcanic history
of the region and was assumed as valuable archive of the dispersal of volcanic deposits
from Italian volcanoes over long distances (Vogel et al., 2010b). Additional high
resolution seismic surveys and a bathymetrical survey between 2007 and 2009 indicated
that thick sequences of undisturbed sediments exist at the deepest parts of the basin
(Lindhorst et al., 2010).
Introduction
13
Figure 1.4.1: Overview of the location of Lake Ohrid in the Central Mediterranean region and topographical
map of the “sister lakes” Ohrid and Prespa (Wagner et al., 2008).
1.4.2 Geology of Lake Ohrid
Lake Ohrid is located on the Balkan Peninsula and is part of the Dinaride-Albanide-
Hellenide mountain belt (Lindhorst et al., 2015). The lake is situated at an altitude of 693
m asl, has a surface area of 360 km² and a present water depth of a maximum of 290 m.
The lake basin is assumed to have formed within two stages: in late Miocene a pull-apart
basin was generated and during Pliocene east-west extension caused the recent
geometry (Lindhorst et al., 2015). Lake Ohrid lies in an earthquake zone (Korca–Ohrid
Earthquake Source Zone) and several earthquakes in the younger past document, that
the area is tectonically active (Lindhorst et al., 2015; Wagner et al., 2008).
Triassic carbonates and clastics are exposed towards the east, southeast, and
northwest of the lake. Ophiolites of Jurassic to Cretaceous age occur on the western and
Lake Ohrid: an environmental archive back to the Tertiary?
14
southwestern shore and metamorphic and magmatic rocks (Paleozoic age) are exposed
to the north and northeast of Lake Ohrid’s valley (Fig. 1.4.2) (Vogel et al., 2010b).
The lake water is oligotrophic and originates from karstic springs as well as runoff and
precipitation. Lake Ohrid has a river outflow towards the north (Vogel et al., 2010a). The
catchment of Lake Ohrid includes the 150 m higher elevated “sister lake” Prespa (Fig.
1.4.2) which is the main contributor of the karst inflows (Wagner et al., 2014b).
Figure 1.4.2: Geological overview map of the area surrounding Lake Ohrid (modified after Wagner et al.,
2008).
1.4.3 ICDP SCOPSCO campaign
A deep drilling campaign in the scope of the ICDP SCOPSCO project (Scientific
Collaboration on Past Speciation Conditions in Lake Ohrid) was executed in April to May
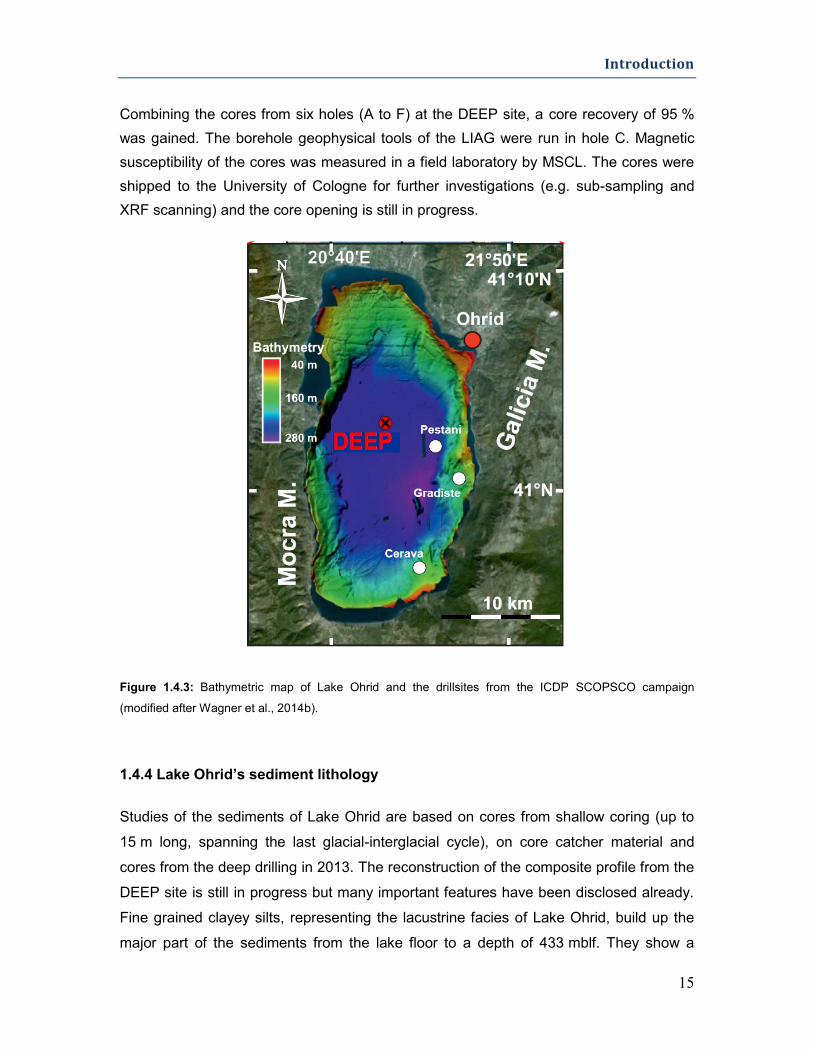
2013. Four sites (Fig.1.4.3; DEEP, CERAVA, GRADISTE, PESTANI) were cored
multiple times in water depth up to 260 m to a final depth of 569 mblf (Wagner et al.,
2014b). The main drill site (DEEP) is located in the central lake basin and was cored
multiple times.
Introduction
15
Combining the cores from six holes (A to F) at the DEEP site, a core recovery of 95 %
was gained. The borehole geophysical tools of the LIAG were run in hole C. Magnetic
susceptibility of the cores was measured in a field laboratory by MSCL. The cores were
shipped to the University of Cologne for further investigations (e.g. sub-sampling and
XRF scanning) and the core opening is still in progress.
Figure 1.4.3: Bathymetric map of Lake Ohrid and the drillsites from the ICDP SCOPSCO campaign
(modified after Wagner et al., 2014b).
1.4.4 Lake Ohrid’s sediment lithology
Studies of the sediments of Lake Ohrid are based on cores from shallow coring (up to
15 m long, spanning the last glacial-interglacial cycle), on core catcher material and
cores from the deep drilling in 2013. The reconstruction of the composite profile from the
DEEP site is still in progress but many important features have been disclosed already.
Fine grained clayey silts, representing the lacustrine facies of Lake Ohrid, build up the
major part of the sediments from the lake floor to a depth of 433 mblf. They show a

Lake Ohrid: an environmental archive back to the Tertiary?
16
cyclic alternation of two lithofacies: siliciclastics-rich sediments with low CaCO3-contents
and low OM and, in contrast sediments with high CaCO3 contents, high contents of OM
and very little clastics (Francke et al., 2014). The alternating pattern is interpreted to
reflect glacial-interglacial dynamics of the lacustrine facies. In the deeper part of the
sediments (below 433 mblf) a shallow water facies prevails and at 569 mblf gravel and
pebbles were hit, which prevented deeper penetration (Wagner et al., 2014b).
Methods
17
2. Methods
2.1 Borehole geophysics
The downhole logging data was acquired by use of the slimhole logging tools from the
LIAG, specified in Aghib et al. (1999). The following parameters were used in this study:
spectral gamma ray (SGR), magnetic susceptibility (SZ), resistivity (RES) and seismic
velocity (Vp) from Sonic (SON).
2.1.1 Spectral gamma ray
The SGR tool can be used in open hole and cased hole environments. It detects the
natural radioactivity of its surrounding whereas it gives measures of the sum of the
gamma rays (GR) as well as the spectral components of potassium (K), thorium (Th)
and uranium (U) by using a scintillation detector (Bismuth germinate; BGO) (Barrett et
al., 2000, Aghib et al., 1999). The SGR detects energies of different discrete windows of
the elements to differentiate between the spectral components (Rider and Kennedy,
2011). Whereas the contents of K, Th and U are given in absolute values (K - %; Th, U -
ppm), GR is measured in gAPI, a unit defined by the American Petroleum Institute (API)
in Houston, Texas. By using a standard pit with high- and low radioactive cement, the
gAPI unit is defined as 0.5 % of the difference between their GR-readings (Rider and
Kennedy, 2011). The vertical resolution (minimum bed resolution) is controlled by the
size of the cylindrical BGO crystal (diameter: 5 cm, length: 15 cm), the logging speed (3
m/min) and formation characteristics (heterogeneity of GR values) (Theys, 1991) and
ranges from 15 to 20 cm for the applied tool.
Generally, the SGR is considered to be a useful discriminator between shale and sand in
sediments and sedimentary rocks based on the abundance of the radioactive isotopes of
K, Th and U in clay minerals. However, the GR is not only increased in shaly formations
but e.g. K-feldspars rich sands / silts or acidic volcanic deposits can have remarkably
high GR values (Rider and Kennedy, 2011).
Borehole geophysics
18
2.1.2 Resistivity
The RES can be measured only in open hole conditions and water-filled boreholes. RES
can be determined by use of the Dual Laterolog (DLL) tool which emits dual focussed
electrical currents into the formation and detects the voltage drop after passing through
the formation. The DLL tool measures the resistivity (Ωm) in two depth of investigations:
shallow – close to the borehole wall and therefore in the invaded zone (disturbed due to
drilling and mud invasion) and, deep – in the formation at a distance of 30 to 100 cm
from the borehole (Rider and Kennedy, 2011). The vertical resolution depends on the
emitter-to-receiver distance and can be estimated as 10 to15 cm for the used tool.
RES is used to detect formation resistivity and results from the conductivities of the
sediment matrix and the formation fluid. The majority of minerals have very high
resistivities with exceptions of shaly formations, which are conductive due to the
negatively-charged surface layers of clay minerals. In most cases, the conductivity of an
electrical current is higher through the (water-filled) pore space compared to the
surrounding sedimentary matrix and is mainly controlled by the texture of rocks or
sediments as grain size, sorting and other factors (Rider and Kennedy, 2011; Serra and
Serra, 2003). Due to the high sensitivity of RES to texture changes, which are likely in
different sedimentary facies, it can be used to discriminate between different lithologies.
2.1.3 Sonic
The SON tool is used in open hole conditions to determine p- and s-wave velocity (m/s)
of a formation. The LIAG’s tool operates with an acoustic transmitter and two receivers
with a certain distance. The runtime and amplitude of the waves are measured after they
have passed through the formation and the p- and s-wave velocities of the formation are
determined according to the tool geometry (Rider and Kennedy, 2011). The tool of the
LIAG operates with a vertical resolution of c. 20 cm.
The velocity depends on the lithology and some general trends can be identified (e.g.
velocities of sands exceed shales). However, due to overlapping value range, the
lithological discrimination from SON is of lower value than compared to e.g. SGR. The
depth of a formation and subsequent compaction (porosity reduction with greater
depths) affects the acoustic characteristics strongly (Rider and Kennedy, 2011; Serra
and Serra, 2003). An empirical relationship between Vp and porosity exist, which need
Methods
19
to be adjusted to match a certain formation and has proven useful for a wide range of
reservoirs if the matrix and fluid velocities are known (Wyllie et al., 1956). However, the
common relationships are applicable for low porosity formation (< 25 %) only and
adjustments are required for unconsolidated high-porosity sediments. Based on
empirical studies on siliciclastic marine deposits, more suitable relationships have been
derived (e.g., Erickson and Jarrard, 1998).
2.1.4 Magnetic susceptibility
The SZ is a measure of the magnetisability of a material, that is dimensionless and
usually given in SI units (10-6 to 10-4 SI). The tool is used in open hole environments; it
emits an electromagnetic signal of a frequency of 1 kHz that is detected after passing
through the formation (Aghib et al., 1999). The vertical resolution of the used tool
amounts c. 20 cm.
The magnetic properties of sediments are mainly controlled by the occurrence or non-
occurrence of ferrimagnetic minerals (Fe-oxides) and to minor proportions from
paramagnetic (e.g. biotite) and diamagnetic minerals, such as CaCO3 (Stage, 1999).
There from, the SZ depends strongly on the composition of sediments (e.g. occurrence
of volcanogenic material). Further, the grain size controls the magnetic properties;
magnetite is the dominant detrital magnetic mineral of hemipelagic sediments and
occurs mostly in the clay fraction (Butler, 1992).
Mathematical methods
20
2.2 Mathematical methods
The cluster analysis was applied to the downhole logging data from Lake Van and the
sliding window method was used on the data from both lakes. The decompaction was
calculated exclusively for the data from Lake Ohrid.
2.2.1 Cluster analysis
The cluster analysis is used to evaluate the data from different downhole logging
parameters and to construct a lithological log based on the measurement values.
Groups of similar properties (statistical electrofacies) are determined with the aim to
maximize the distance between them (Buecker et al., 2000). The groups are defined as
a set of log responses that characterize a lithological unit and allow vertical classification
from other units (Buecker et al., 2000; Serra, 1986; Serra and Serra, 2003). The number
of cluster is determined by use of a dendrogram; the balance must be kept in between
the maximal coverage of measurement values and a reasonable number of clusters in
comparison to possible lithological units.
The properties of the clusters are analyzed by the use of box-and-whisker plots and
crossplots and are transformed into lithological units according to the lithological
description. The data is standardized to equalize it across different value ranges and to
allow an equal-weighting comparison (Backhaus et al., 2008; Buecker et al., 2000). In
this study, the “WINSTAT Statistic for Windows” software was used, which was operated
by selecting Ward’s method (Davis, 1986) for complete-linkage clustering.
2.2.2 Sliding window method (spectral analysis)
Spectral analysis is performed to identify the characteristic periodicities (Jenkins and
Watts, 1969; Priestley, 1981). The spectral analysis is calculated for a certain depth
interval that is defined by the window size. After the interval was analyzed, the window is
shifted downwards continuously at a specific step. The calculation is repeated, and the
results are displayed at the centre of each window, resulting in a three-dimensional
spectral plot. The optimal window size is determined empirically whereas the window
needs to be as short as possible to maximize the length of the resulting plot but long
Methods
21
enough to cover the signal. The spectral analysis was performed on normalized SGR
data as fast Fourier Transform (Windowed Fourier transform; Torrence and Compo,
1998), by using MATLAB (MathWorks®).
2.2.3 Decompaction modelling
To perform cyclostratigraphic studies and to estimate an age depth-relationship and
sedimentation rates, the compaction and associated reduction of sediment thickness
due to overburden pressure must be considered. The calculation of the original
thickness of the decompacted sediments requires that the initial porosity (at surface
level) and the compaction coefficient can be determined (Brunet, 1998). The sediment
properties, such as grain size and sorting, affect the amount of porosity decrease with
greater depth (Serra and Serra, 2003). It can be expressed as:
Eq. (2.2.1)
where the porosity (Φ) at a specific depth (z) is to be estimated; Φ0 is the initial porosity
and c is the compaction coefficient (Athy, 1930; Brunet, 1998).
Porosity estimates were derived by an empirical relationship from sonic data (Vp)
(Erickson and Jarrard, 1998), that was recorded continuously from below 30 mblf at the
DEEP site at Lake Ohrid. The decompaction modelling of the sediments and calculation
of the original sediment thickness was performed under use of the software 2DMove®
(Midland Valley Exploration Ltd.)
Facies characterization based on physical properties from downhole logging for the sediment record of Lake Van, Turkey
22
3. Results
3.1 Facies characterization based on physical
properties from downhole logging for the
sediment record of Lake Van, Turkey
Baumgarten, H. Wonik, T., Kwiecien, O.
23
3.1.1 Introduction
Lake Van in eastern Anatolia, Turkey, is the 4th largest terminal lake (surface area >
3,500 m²) and the largest soda lake worldwide, with the soda-characteristic likely
controlled by volcanic CO2-input into the lake (Degens et al., 1984). This lake is located
at the transition between prevailing arid and humid areas; therefore, it is sensitive to
climatic changes, which have been recorded in the hydrological system and are evident
in the lake-level terraces around the lake (Landmann et al., 1996; Litt et al., 2009).
Extensive studies that included shallow coring and surface geophysics were started in
the 1970s. These cores (length of 8 – 9 m) document that the Lake Van record has
sediment with a high (annual) resolution during at least the last 15 ka (Landmann et al.,
1996).
A drilling campaign was initiated in the summer of 2010 by the ICDP project
‘PALEOVAN’ with the objective of enhancing the understanding of the paleoclimatic and
paleoenvironmental conditions for a period of 500,000 years in the Middle East. A site at
the Ahlat Ridge (AR) and at the Northern Basin (NB) have been multiple cored.
Nevertheless, the core recovery after combining all the cores amounts to 91 % and 71
%, respectively.
When coring into unconsolidated sediments and an incomplete core recovery occurs,
downhole logging is of extremely high value because the only possible method of
reconstructing the complete record is by lithological interpretation of continuously
recorded downhole logging data. This is especially true for the challenging sedimentary
record of Lake Van, which consists primarily of clayey silts and tephra deposits. The low
stability of these tephra layers leads to low core recovery in the vicinity and thus
produces gaps in the core record.
In this work, a dataset of downhole logs has been acquired and interpreted. The
objectives of this work are to identify the lithological units and their borders, interpret the
lithological properties and their links to sediment characteristics and fill in the gaps for
sections without adequate core recovery (e.g., thick tephra layers).
We have focused our interpretation on the downhole logging data acquired at the AR
site for several reasons: 1) it is the longest drilled sedimentary section in the lake, 2) the
sedimentary record covers the longest time frame and is assumed to be continuous, 3)
the AR site is the main focus of the PALEOVAN project and the evaluations are the most
detailed and 4) compared to the NB site, the AR site has additional downhole logging
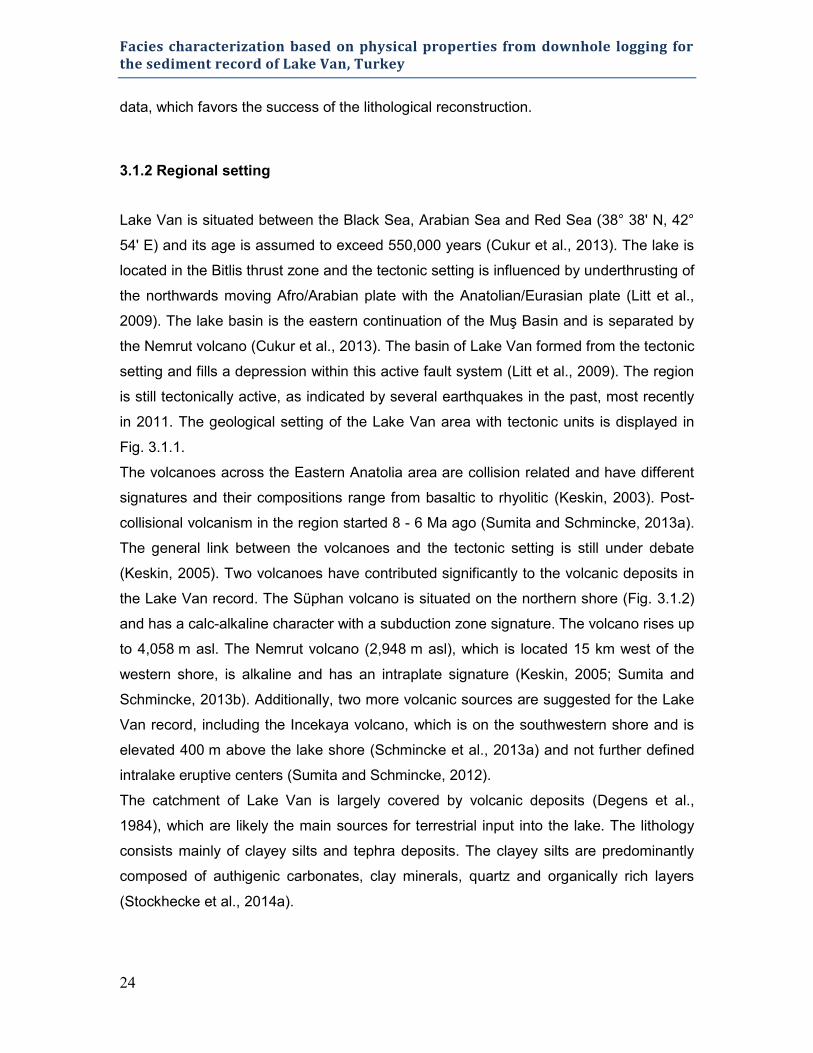
Facies characterization based on physical properties from downhole logging for the sediment record of Lake Van, Turkey
24
data, which favors the success of the lithological reconstruction.
3.1.2 Regional setting
Lake Van is situated between the Black Sea, Arabian Sea and Red Sea (38° 38' N, 42°
54' E) and its age is assumed to exceed 550,000 years (Cukur et al., 2013). The lake is
located in the Bitlis thrust zone and the tectonic setting is influenced by underthrusting of
the northwards moving Afro/Arabian plate with the Anatolian/Eurasian plate (Litt et al.,
2009). The lake basin is the eastern continuation of the Muş Basin and is separated by
the Nemrut volcano (Cukur et al., 2013). The basin of Lake Van formed from the tectonic
setting and fills a depression within this active fault system (Litt et al., 2009). The region
is still tectonically active, as indicated by several earthquakes in the past, most recently
in 2011. The geological setting of the Lake Van area with tectonic units is displayed in
Fig. 3.1.1.
The volcanoes across the Eastern Anatolia area are collision related and have different
signatures and their compositions range from basaltic to rhyolitic (Keskin, 2003). Post-
collisional volcanism in the region started 8 - 6 Ma ago (Sumita and Schmincke, 2013a).
The general link between the volcanoes and the tectonic setting is still under debate
(Keskin, 2005). Two volcanoes have contributed significantly to the volcanic deposits in
the Lake Van record. The Süphan volcano is situated on the northern shore (Fig. 3.1.2)
and has a calc-alkaline character with a subduction zone signature. The volcano rises up
to 4,058 m asl. The Nemrut volcano (2,948 m asl), which is located 15 km west of the
western shore, is alkaline and has an intraplate signature (Keskin, 2005; Sumita and
Schmincke, 2013b). Additionally, two more volcanic sources are suggested for the Lake
Van record, including the Incekaya volcano, which is on the southwestern shore and is
elevated 400 m above the lake shore (Schmincke et al., 2013a) and not further defined
intralake eruptive centers (Sumita and Schmincke, 2012).
The catchment of Lake Van is largely covered by volcanic deposits (Degens et al.,
1984), which are likely the main sources for terrestrial input into the lake. The lithology
consists mainly of clayey silts and tephra deposits. The clayey silts are predominantly
composed of authigenic carbonates, clay minerals, quartz and organically rich layers
(Stockhecke et al., 2014a).
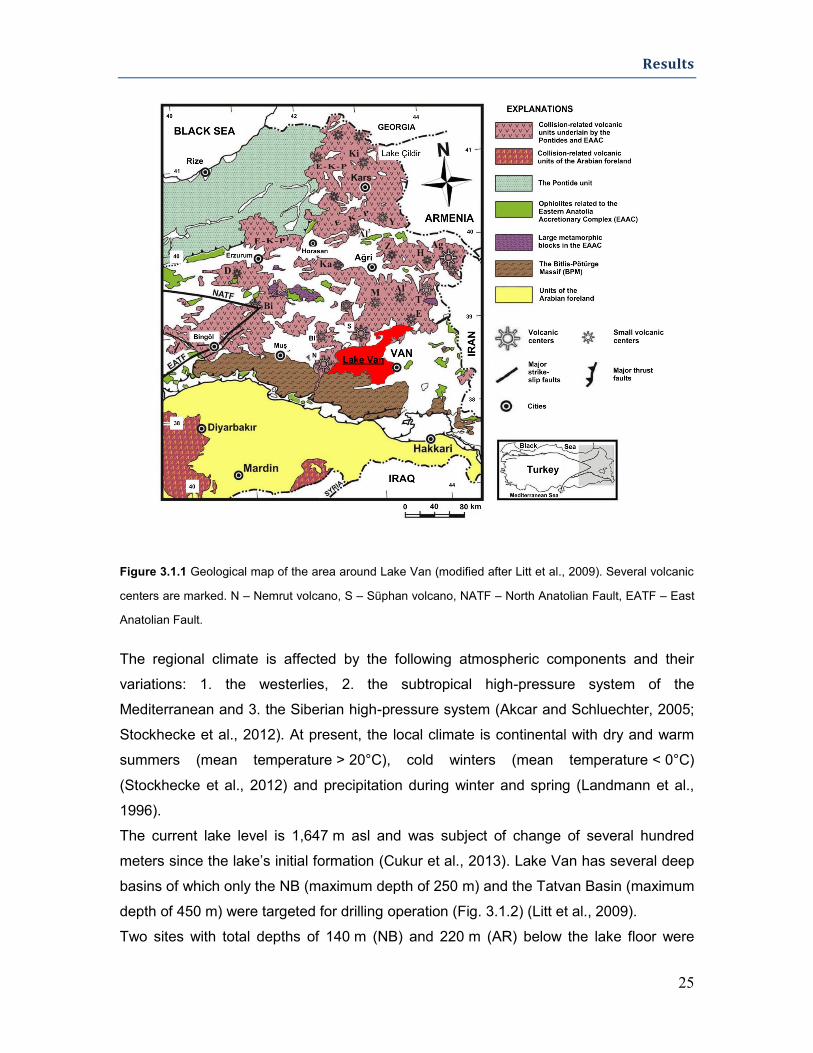
Results
25
Figure 3.1.1 Geological map of the area around Lake Van (modified after Litt et al., 2009). Several volcanic
centers are marked. N – Nemrut volcano, S – Süphan volcano, NATF – North Anatolian Fault, EATF – East
Anatolian Fault.
The regional climate is affected by the following atmospheric components and their
variations: 1. the westerlies, 2. the subtropical high-pressure system of the
Mediterranean and 3. the Siberian high-pressure system (Akcar and Schluechter, 2005;
Stockhecke et al., 2012). At present, the local climate is continental with dry and warm
summers (mean temperature > 20°C), cold winters (mean temperature < 0°C)
(Stockhecke et al., 2012) and precipitation during winter and spring (Landmann et al.,
1996).
The current lake level is 1,647 m asl and was subject of change of several hundred
meters since the lake’s initial formation (Cukur et al., 2013). Lake Van has several deep
basins of which only the NB (maximum depth of 250 m) and the Tatvan Basin (maximum
depth of 450 m) were targeted for drilling operation (Fig. 3.1.2) (Litt et al., 2009).
Two sites with total depths of 140 m (NB) and 220 m (AR) below the lake floor were
Facies characterization based on physical properties from downhole logging for the sediment record of Lake Van, Turkey
26
multiple-cored and the core recovery after combining the cores was 71 % (NB) and 91 %
(AR).
The AR site (water depth of 360 m) is located in the Tatvan basin. The results from a
pre-site seismic survey indicate that an undisturbed sedimentary sequence is preserved,
which increases its potential to yield a complete paleoenvironmental and paleoclimatic
record (Litt et al., 2009). Further, it is located in a deep basin, far from the lake shore,
where occurrences of turbidites are unlikely. The AR borehole is much deeper compared
to the NB borehole and covers a longer time of deposition.
Figure 3.1.2 Bathymetric map of Lake Van (modified after Litt et al., 2009) with sites marked. AR - Ahlat
Ridge, NB – Northern Basin. Inserted map shows location of the studied area in the east of Turkey.
3.1.3 Material and methods
Data acquisition and preprocessing
The site 5034-2 at AR was drilled with a diameter of 149.2 mm. Bentonit mud with added
citric acid was used to compensate for the extreme pH conditions (pH=9.8) of the lake
water. The downhole logging data have been recorded with the slimhole tools of the
Leibniz Institute for Applied Geophysics. The sampling rate of the tools ranges from
Results
27
0.05 cm to 10 cm, which set the vertical resolutions from 2 cm to 30 cm. A description of
the logging tools is given by Barrett et al. (2000) and Buecker et al. (2000) and the
physical principals are described, e.g. by Rider and Kennedy (2011). The following
downhole data have been acquired: spectral gamma ray (SGR), including the spectral
components (contents of potassium (K), thorium (Th) and uranium (U)), magnetic
susceptibility (SUSC), resistivity (RES), dipmeter and total magnetic field (DIP/MAG),
borehole diameter (CALI), seismic velocity (vp) (SON) and the temperature and salinity
of the drill mud (TSAL). Only a partial record of vp was made because of malfunctions of
the equipment. The radioactive tools’ density, neutron porosity and geochemical
properties could not be used because they were not authorized for import into Turkey.
All data of this contribution are from hole D of AR. This hole was drilled in two phases:
phase I went down to 118 meters below the lake floor (mblf) and phase II went down to
217 mblf. Logging was performed directly after each drilling phase. SGR was recorded
through the drillpipe and all other tools were run in the open hole. The borehole stability
was low because of the unconsolidated sediments, especially in the vicinity of un-
solidified tephra layers. Several drillpipes were pulled, the tools were lowered into the
string and the open hole sections were logged. Each tool was deployed separately within
a single run. Because of this procedure, only relatively short sections (10 – 40 m) could
be measured (Fig. 3.1.3). Minor gaps (RES and SUSC) were generated because of this
procedure and because of power fluctuations during operation. For data acquisition,
preprocessing and processing, the software GeoBase (Antares, Stuhr, Germany) was
used. Logs were depth-matched and sections were spliced to generate a continuous
data file for further interpretation.
X-ray fluorescence (XRF) analysis on cores from AR was performed by applying the
Avaatech XRF Core Scanner III at the MARUM core repository – University of Bremen
(Germany). Bulk intensities of the major elements, such as aluminum, silicon and K,
were determined (Roehl and Abrams, 2000) and measured on split sediment cores with
a sampling rate of 2 cm. The element intensities of the presented data (zirconium (Zr)
and calcium (Ca)) were achieved with a generator setting and an X-ray current of 0.2 mA
and 10 kV (Ca) and 1 mA and 30 kV (Zr) and are presented in counts per second (cps).
Depth-matching of cores and downhole logging data was performed with the help of
XRF data. The K-curve from XRF scanning and K data from SGR were depth matched;
however, the susceptibility data from the Multi Sensor Core Logger (MSCL), which was
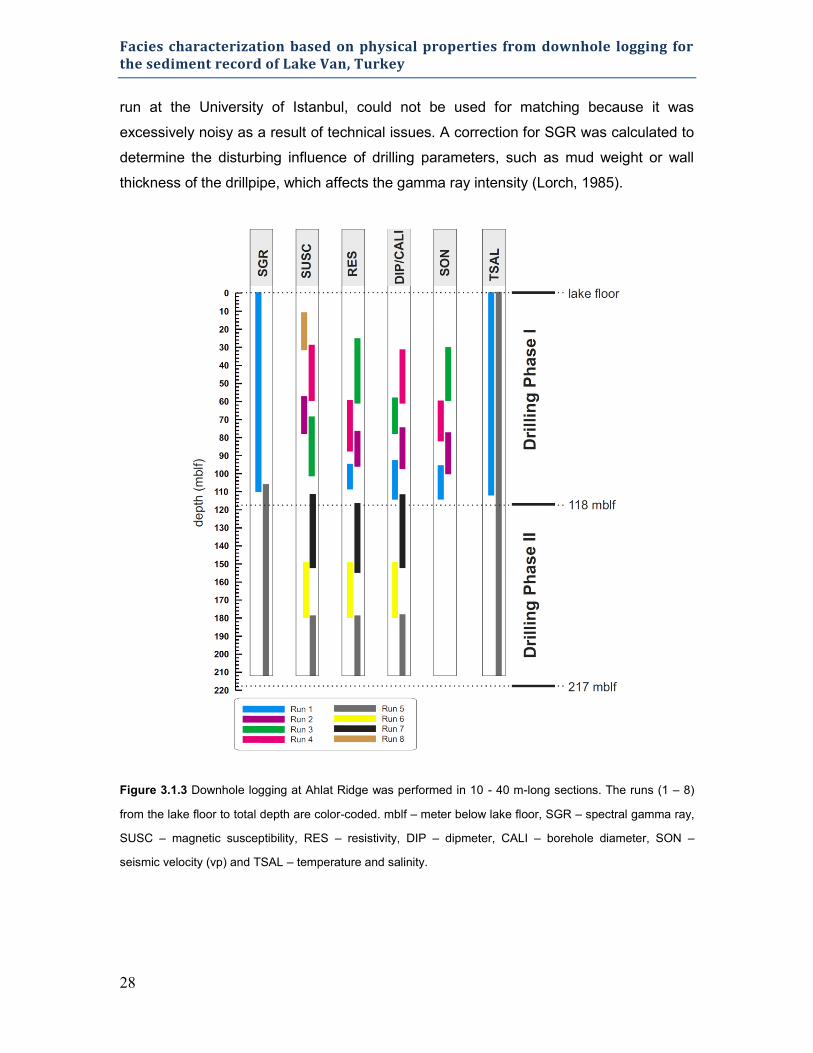
Facies characterization based on physical properties from downhole logging for the sediment record of Lake Van, Turkey
28
run at the University of Istanbul, could not be used for matching because it was
excessively noisy as a result of technical issues. A correction for SGR was calculated to
determine the disturbing influence of drilling parameters, such as mud weight or wall
thickness of the drillpipe, which affects the gamma ray intensity (Lorch, 1985).
Figure 3.1.3 Downhole logging at Ahlat Ridge was performed in 10 - 40 m-long sections. The runs (1 – 8)
from the lake floor to total depth are color-coded. mblf – meter below lake floor, SGR – spectral gamma ray,
SUSC – magnetic susceptibility, RES – resistivity, DIP – dipmeter, CALI – borehole diameter, SON –
seismic velocity (vp) and TSAL – temperature and salinity.
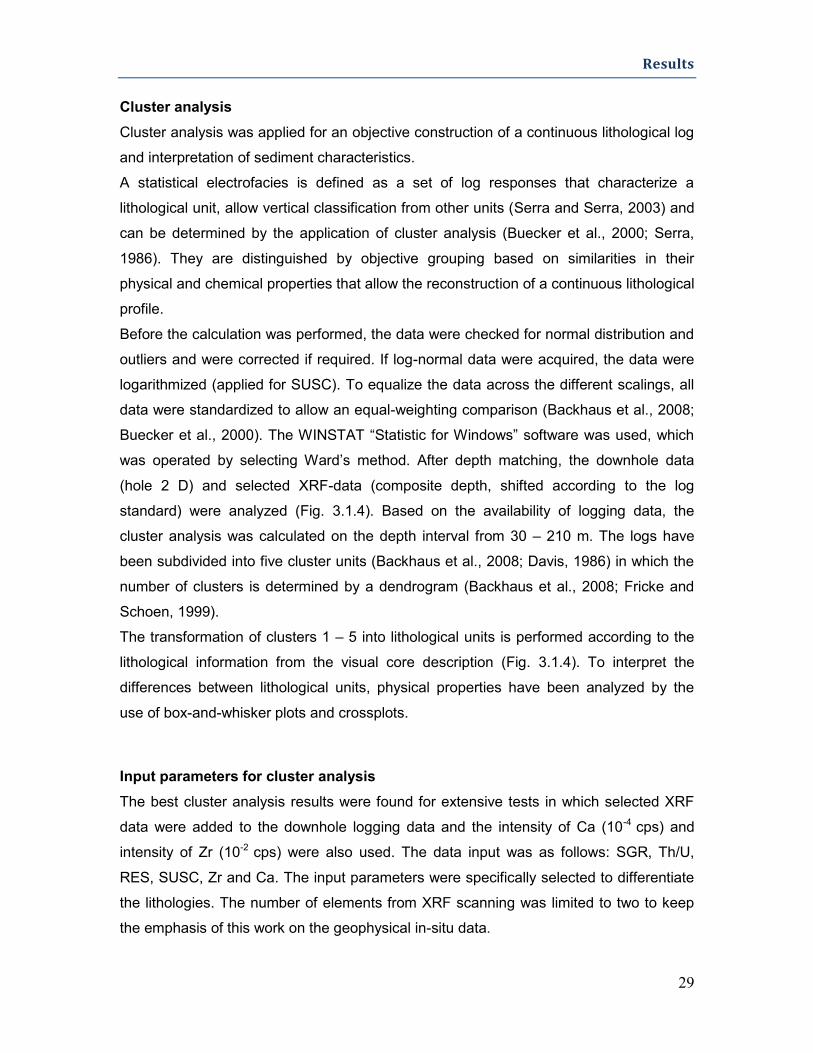
Results
29
Cluster analysis
Cluster analysis was applied for an objective construction of a continuous lithological log
and interpretation of sediment characteristics.
A statistical electrofacies is defined as a set of log responses that characterize a
lithological unit, allow vertical classification from other units (Serra and Serra, 2003) and
can be determined by the application of cluster analysis (Buecker et al., 2000; Serra,
1986). They are distinguished by objective grouping based on similarities in their
physical and chemical properties that allow the reconstruction of a continuous lithological
profile.
Before the calculation was performed, the data were checked for normal distribution and
outliers and were corrected if required. If log-normal data were acquired, the data were
logarithmized (applied for SUSC). To equalize the data across the different scalings, all
data were standardized to allow an equal-weighting comparison (Backhaus et al., 2008;
Buecker et al., 2000). The WINSTAT “Statistic for Windows” software was used, which
was operated by selecting Ward’s method. After depth matching, the downhole data
(hole 2 D) and selected XRF-data (composite depth, shifted according to the log
standard) were analyzed (Fig. 3.1.4). Based on the availability of logging data, the
cluster analysis was calculated on the depth interval from 30 – 210 m. The logs have
been subdivided into five cluster units (Backhaus et al., 2008; Davis, 1986) in which the
number of clusters is determined by a dendrogram (Backhaus et al., 2008; Fricke and
Schoen, 1999).
The transformation of clusters 1 – 5 into lithological units is performed according to the
lithological information from the visual core description (Fig. 3.1.4). To interpret the
differences between lithological units, physical properties have been analyzed by the
use of box-and-whisker plots and crossplots.
Input parameters for cluster analysis
The best cluster analysis results were found for extensive tests in which selected XRF
data were added to the downhole logging data and the intensity of Ca (10-4 cps) and
intensity of Zr (10-2 cps) were also used. The data input was as follows: SGR, Th/U,
RES, SUSC, Zr and Ca. The input parameters were specifically selected to differentiate
the lithologies. The number of elements from XRF scanning was limited to two to keep
the emphasis of this work on the geophysical in-situ data.
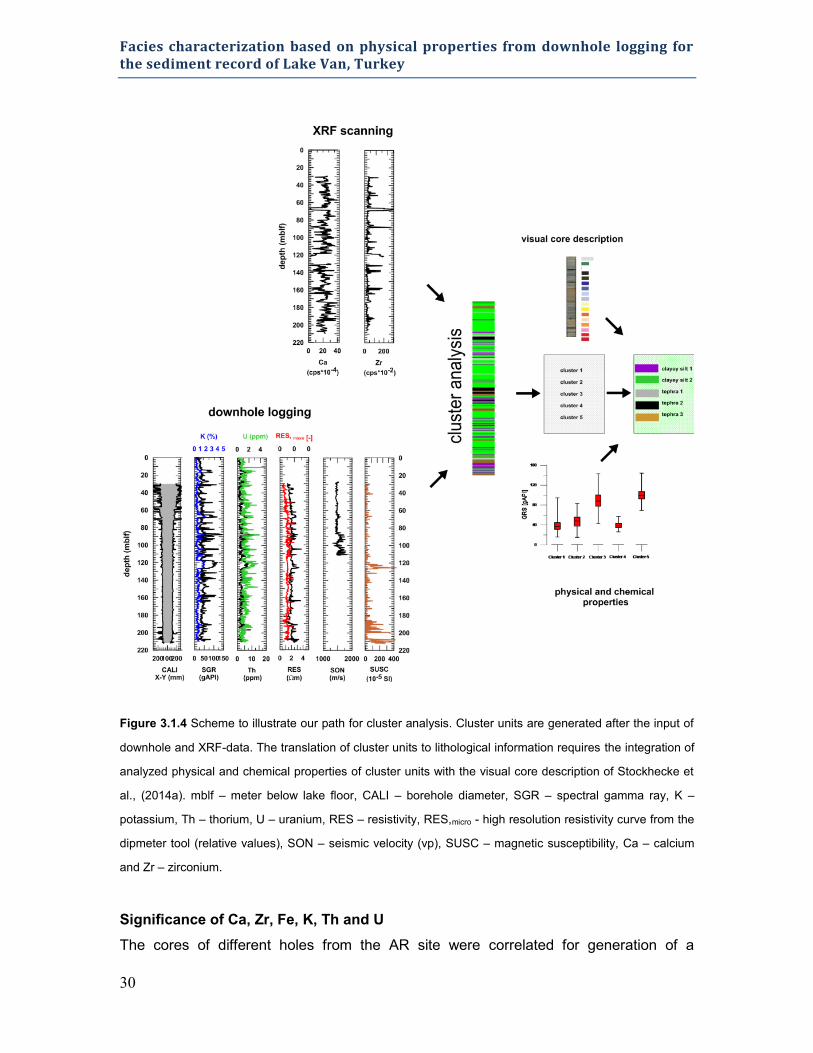
Facies characterization based on physical properties from downhole logging for the sediment record of Lake Van, Turkey
30
Figure 3.1.4 Scheme to illustrate our path for cluster analysis. Cluster units are generated after the input of
downhole and XRF-data. The translation of cluster units to lithological information requires the integration of
analyzed physical and chemical properties of cluster units with the visual core description of Stockhecke et
al., (2014a). mblf – meter below lake floor, CALI – borehole diameter, SGR – spectral gamma ray, K –
potassium, Th – thorium, U – uranium, RES – resistivity, RES,micro - high resolution resistivity curve from the
dipmeter tool (relative values), SON – seismic velocity (vp), SUSC – magnetic susceptibility, Ca – calcium
and Zr – zirconium.
Significance of Ca, Zr, Fe, K, Th and U
The cores of different holes from the AR site were correlated for generation of a

Results
31
composite profile in which the meters of composite depth below the lake floor (mcblf)
reference was used (Stockhecke et al., 2014a). Core analysis has revealed the
predominance of carbonaceous clayey silts, which reach up to 76 % of the lacustrine
facies of the recovered cores. Based on visual features such as the components, color
and internal structures, 15 lithological units have been determined. The prominent
outstanding lithotypes ‘laminated clayey silts’ and ‘banded clayey silts’ are interpreted as
interglacial and glacial deposits, respectively (Stockhecke et al., 2014a).
We have focused on these two lacustrine lithotypes and their intercalations and
transition zones and consider them as two major groups. From a sedimentological
perspective, simplification is required because a separation of 15 lithological units is not
feasible by the application of geophysical methods.
Carbonates (calcium carbonate and aragonite) are one of the main components of the
lacustrine sediments. The deposition of calcium carbonate in lake sediments is
dependent on water chemistry and input of Ca into the system by surface runoff or
groundwater flow and is transported as either dissolved Ca2+ ions or as detritic particles.
Intensities of evaporation and precipitation are climate driven and affect lake level
variations (lake water volume), particularly in closed lake systems (Zolitschka et al.,
2013). Therefore, the concentration of Ca2+ ions in the water column and variations of
deposited calcium carbonate can be linked to climate (Lezine et al., 2010) and
glacial/interglacial fluctuations are expected. This should be reflected by variations of Ca
intensities from XRF scanning for glacial vs. interglacial deposits.
According to Akcar and Schlüchter (2005), the conditions during the Last Glacial
Maximum at Lake Van were characterized by a lake level highstand in a cold climate
with reduced vegetation cover and high surface runoff. This suggests a higher input of
terrigenous material into the lake compared to the conditions of the interglacial periods,
which had higher temperatures, humidity and vegetation cover in the catchment basin.
Conditions with high terrigenous input have been confirmed by pollen records and high
contents of Fe and Ti for the Younger Dryas (Litt et al., 2009). Thus, a higher input of
terrigenous K during glacial periods should be reflected in higher K values from the
SGR. SUSC is the ability of a material to acquire magnetization and is strongly
controlled by the magnetic behavior (diamagnetic, paramagnetic and ferromagnetic) of
the accumulated minerals. The abundance of ferromagnetic minerals enhances the
SUSC values. Such variations for lake sediments have been interpreted as being
derived from high detritic input of Fe-bearing minerals into the system. In combination,
Facies characterization based on physical properties from downhole logging for the sediment record of Lake Van, Turkey
32
the Ca/Fe ratio reflects the lake internal (lacustrine productivity) vs. terrestrial (detrital
input) control on sedimentation (Roeser et al., 2013).
The laminated clayey silts (interglacial) of Lake Van are characterized by higher TOC
values (Stockhecke et al., 2014a) compared to the banded clayey silts (glacial). U ions
are highly soluble and often show an affinity for organic matter (Rider and Kennedy,
2011). This suggests an enrichment of U (detected by SGR) in lake sediments if organic
matter content is high.
Information on lithological variation can also be gained from SGR data by elemental
ratios, such as the Th/U ratio for the depositional environment (Rider and Kennedy
2011). Th is usually generated from detrital grains in the clay fraction, is transported via
runoff and is likely associated with terrestrial input. High Th/U ratios might therefore
reflect stronger terrestrial influence for the sediments of Lake Van. Combined with the
assumed lower productivity of organic matter (lower U values), the ratio might reflect
environmental changes during glacial and interglacial cycles. Therefore, the Th/U ratio
has been used as a separate input parameter for cluster analysis.
The results of the cluster analysis are linked to the chemical composition of the tephra
layers and to their likely sources by using the available data from the downhole logs and
additional information from the XRF scanning. Several attempts have been made to use
borehole data to differentiate between volcanic rocks. According to Rider and Kennedy
(2011), intermediate and acidic rocks have higher SGR, K, Th and U values compared to
basaltic rocks. Furthermore, high SUSC values are characteristic of basalts and suitable
for the differentiation between rhyolitic and basaltic deposits (Delius, 2000). Chemical
classification of volcanic rocks are generally based on the total alkali-silica content, ratio
of Na2O + K2O versus SiO2 (Le Bas et al., 1986) and the contoured alkali-silica diagrams
for FeO+Fe2O3 or CaO contents (Cox et al., 1979). Zr and Th contents can vary
significantly in volcanic deposits because of their incompatible behaviors (Schmincke,
2004) and subsequent selective occurrence in volcanic deposits. In general,
incompatible elements are enriched in highly differentiated melts (Schmincke, 2004).
Variations of CaO content are also sensitive in different volcanic products (Cox et al.,
1979) and the greatest contrasts are known between basic and acidic compositions.
Sumita and Schmincke (2012) related the volcanic deposits of Lake Van to four different
sources (Nemrut, Süphan, Incekaya and intralake eruptive centers) and concluded that
Nemrut and Süphan were the major suppliers of volcanic deposits to the sediments of
Lake Van (Schmincke and Sumita, 2013a). Volcanic deposits have been studied on land
Results
33
during field campaigns between 2008 and 2011 and the chemical composition was
determined by XRF analysis on whole rock samples and electron microprobe analysis
(Sumita and Schmincke, 2013b). The tephra layers in the cores are under study (Sumita
and Schmincke, 2012) and the volcanics are characterized by different dominant
compositions:
(1) Nemrut volcano, trachytic to rhyolitic composition.
(2) Süphan volcano, dacitic to rhyolitic composition.
(3) Incekaya, basaltic composition.
(4) Intralake eruptive centers, intermediate to trachytic composition.
Trachytic tephra is characterized by high Na2O + K2O contents (Le Bas et al., 1986), low
to medium FeO+Fe2O3 contents (Schmincke, 2004) and low CaO content (Cox et al.,
1979). Incompatible elements such as Zr and Th are found in medium to high
concentrations (Schmincke, 2004).
Rhyolitic tephra is characterized by medium to high Na2O + K2O contents (Le Bas et al.,
1986), low FeO and Fe2O3 contents (Schmincke, 2004) and low CaO content (Cox et al.,
1979). The Zr content is high in the highly evolved magma sources (Schmincke, 2004)
and the Th content is also high and is used as a diagnostic parameter (Delius, 2000).
Dacitic tephra has low to medium Na2O + K2O contents (Le Bas et al., 1986) and
medium FeO + Fe2O3 (Schmincke, 2004) and CaO contents (Cox et al., 1979).
Incompatible elements such as Zr and Th are found in medium to high concentrations in
dacitic compositions.
Basaltic tephra is typically characterized by low Na2O + K2O contents (Le Bas et al.,
1986). According to Schmincke and Sumita (2013a), basaltic tephra from Incekaya has
moderate K2O content. The basalts have high FeO+ Fe2O3 (Schmincke, 2004) and CaO
contents (Cox et al., 1979), whereas the Zr and Th contents are low (Schmincke, 2004).
Intermediate tephra has medium properties between basaltic and rhyolitic tephra.
Because of the dominant compositions of the volcanic sources, a differentiation of the
tephra with SGR, K, Th, SUSC, Ca and Zr data is expected. These parameters are
considered to be good discriminators for distinguishing between the volcanic deposits;
therefore, they were used as inputs for cluster analysis.

Facies characterization based on physical properties from downhole logging for the sediment record of Lake Van, Turkey
34
3.1.4 Results
Lithological reconstruction and physical properties from cluster analysis
As a result of the cluster analysis, the section from 30 m to 210 m can be divided into
five statistical electrofacies. After translation of these cluster units into lithological units, a
lithology log can be determined, which is shown in the right column of Fig. 3.1.5.
Figure 3.1.5 Downhole logging data at Ahlat Ridge and the five lithological units determined by cluster
analysis displayed as color-coded bar chart. mblf – meter below lake floor, CALI – borehole diameter, SGR
– spectral gamma ray, K – potassium, Th – thorium, U – uranium, RES – resistivity, RES,micro - high
resolution resistivity curve from the dipmeter tool (relative values), SON – seismic velocity (vp) and SUSC –
magnetic susceptibility.
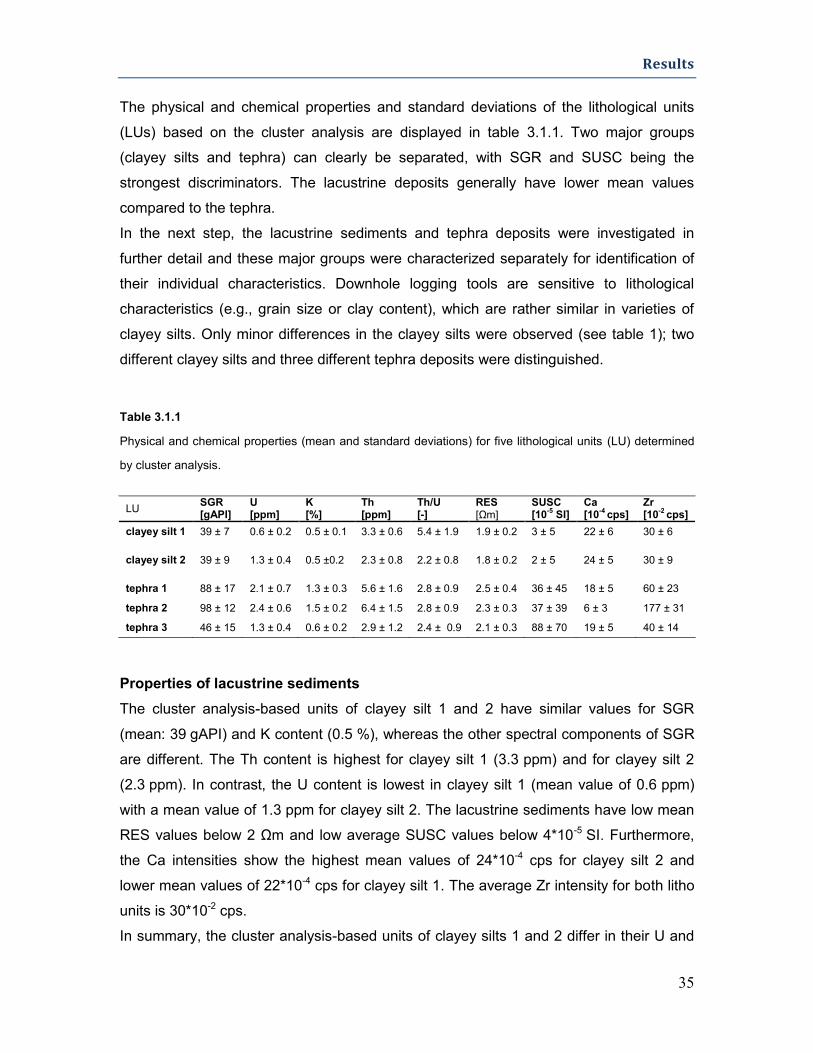
Results
35
The physical and chemical properties and standard deviations of the lithological units
(LUs) based on the cluster analysis are displayed in table 3.1.1. Two major groups
(clayey silts and tephra) can clearly be separated, with SGR and SUSC being the
strongest discriminators. The lacustrine deposits generally have lower mean values
compared to the tephra.
In the next step, the lacustrine sediments and tephra deposits were investigated in
further detail and these major groups were characterized separately for identification of
their individual characteristics. Downhole logging tools are sensitive to lithological
characteristics (e.g., grain size or clay content), which are rather similar in varieties of
clayey silts. Only minor differences in the clayey silts were observed (see table 1); two
different clayey silts and three different tephra deposits were distinguished.
Table 3.1.1
Physical and chemical properties (mean and standard deviations) for five lithological units (LU) determined
by cluster analysis.
LU SGR [gAPI]
U [ppm]
K [%]
Th [ppm]
Th/U [-]
RES [Ωm]
SUSC [10
-5 SI]
Ca [10
-4 cps]
Zr [10
-2 cps]
clayey silt 1 39 ± 7 0.6 ± 0.2 0.5 ± 0.1 3.3 ± 0.6 5.4 ± 1.9 1.9 ± 0.2 3 ± 5 22 ± 6 30 ± 6
clayey silt 2 39 ± 9 1.3 ± 0.4 0.5 ±0.2 2.3 ± 0.8 2.2 ± 0.8 1.8 ± 0.2 2 ± 5 24 ± 5 30 ± 9
tephra 1 88 ± 17 2.1 ± 0.7 1.3 ± 0.3 5.6 ± 1.6 2.8 ± 0.9 2.5 ± 0.4 36 ± 45 18 ± 5 60 ± 23
tephra 2 98 ± 12 2.4 ± 0.6 1.5 ± 0.2 6.4 ± 1.5 2.8 ± 0.9 2.3 ± 0.3 37 ± 39 6 ± 3 177 ± 31
tephra 3 46 ± 15 1.3 ± 0.4 0.6 ± 0.2 2.9 ± 1.2 2.4 ± 0.9 2.1 ± 0.3 88 ± 70 19 ± 5 40 ± 14
Properties of lacustrine sediments
The cluster analysis-based units of clayey silt 1 and 2 have similar values for SGR
(mean: 39 gAPI) and K content (0.5 %), whereas the other spectral components of SGR
are different. The Th content is highest for clayey silt 1 (3.3 ppm) and for clayey silt 2
(2.3 ppm). In contrast, the U content is lowest in clayey silt 1 (mean value of 0.6 ppm)
with a mean value of 1.3 ppm for clayey silt 2. The lacustrine sediments have low mean
RES values below 2 Ωm and low average SUSC values below 4*10-5 SI. Furthermore,
the Ca intensities show the highest mean values of 24*10-4 cps for clayey silt 2 and
lower mean values of 22*10-4 cps for clayey silt 1. The average Zr intensity for both litho
units is 30*10-2 cps.
In summary, the cluster analysis-based units of clayey silts 1 and 2 differ in their U and

Facies characterization based on physical properties from downhole logging for the sediment record of Lake Van, Turkey
36
Th contents and their Ca and RES values show slight variations. Fig. 3.1.6a displays
Th/U, Ca and RES as a 3D scatter plot to demonstrate the differences in the properties
of the clayey silts. The other physical and chemical properties of the two cluster units
clayey silt 1 and 2 are too similar and therefore do not contribute to the differentiation of
these lithological units.
Properties of tephra
The cluster analysis resulted in three tephra units that are characterized by strong
differences in SGR. They are highest for tephra 2, with mean values of 98 gAPI, lower
for tephra 1 (88 gAPI) and lowest for tephra 3 (46 gAPI). The U, Th and K contents show
similar trends for the three tephra units (see table 3.1.1). The RES values are generally
low in the tephra deposits, highest for tephra 1 (mean: 2.5 Ωm) and slightly lower for
tephra 2 (2.3 Ωm) and tephra 3 (2.1 Ωm). SUSC shows stronger variability and has the
highest mean values for tephra 3 (88*10-5 SI) and lower values for tephra 1 and 2
(35*10-5 SI). The Ca intensities are highest for tephra 1 and 3 (19*10-4 cps) and lower for
tephra 2 (6*10-4 cps). In contrast, the Zr intensities are highest for tephra 2 (177*10-2
cps), lower for tephra 1 (60*10-2 cps) and lowest for tephra 3 (40*10-2 cps).
Differentiation of the three tephra units by the cluster analysis is based mainly on SGR,
U, Th, K, SUSC, Ca and Zr values (see table 3.1.1, Fig. 3.1.6b). The downhole logs
generally distinguish tephra 3 from tephra 1 and 2, whereas the core XRF data
distinguish tephra 2 from 1 and 3.
3.1.5 Discussion
Reconstruction of sediment characteristics and its limits
The construction of a continuous lithological profile and exact knowledge of stratigraphy
and layer thickness is of extremely high value for the ‘PALEOVAN’ project. Correlation of
the lithological profile from VCD (Stockhecke et al., 2014a) with downhole logging data is
a necessary condition for a complete lithology log. After correlation of both datasets,
filling of gaps in sections with insufficient core recovery is possible.
Fig. 3.1.7 illustrates a problem that occurs when comparing both datasets: significant
depth shifts of up to 2.5 m (positive and negative) between the composite profile based
on VCD and the downhole measurements in hole 2D of AR have been observed by
depth matching of K from XRF scanning and K from SGR. These differences in depth
are caused by the factors below.
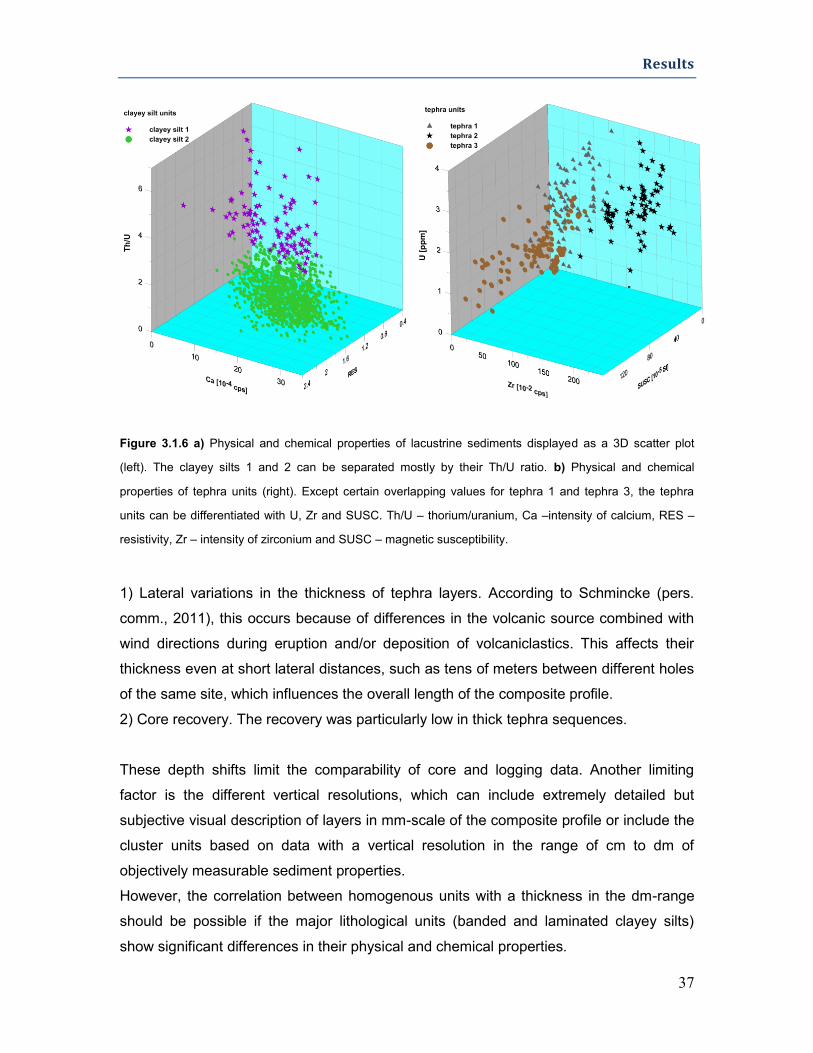
Results
37
Figure 3.1.6 a) Physical and chemical properties of lacustrine sediments displayed as a 3D scatter plot
(left). The clayey silts 1 and 2 can be separated mostly by their Th/U ratio. b) Physical and chemical
properties of tephra units (right). Except certain overlapping values for tephra 1 and tephra 3, the tephra
units can be differentiated with U, Zr and SUSC. Th/U – thorium/uranium, Ca –intensity of calcium, RES –
resistivity, Zr – intensity of zirconium and SUSC – magnetic susceptibility.
1) Lateral variations in the thickness of tephra layers. According to Schmincke (pers.
comm., 2011), this occurs because of differences in the volcanic source combined with
wind directions during eruption and/or deposition of volcaniclastics. This affects their
thickness even at short lateral distances, such as tens of meters between different holes
of the same site, which influences the overall length of the composite profile.
2) Core recovery. The recovery was particularly low in thick tephra sequences.
These depth shifts limit the comparability of core and logging data. Another limiting
factor is the different vertical resolutions, which can include extremely detailed but
subjective visual description of layers in mm-scale of the composite profile or include the
cluster units based on data with a vertical resolution in the range of cm to dm of
objectively measurable sediment properties.
However, the correlation between homogenous units with a thickness in the dm-range
should be possible if the major lithological units (banded and laminated clayey silts)
show significant differences in their physical and chemical properties.
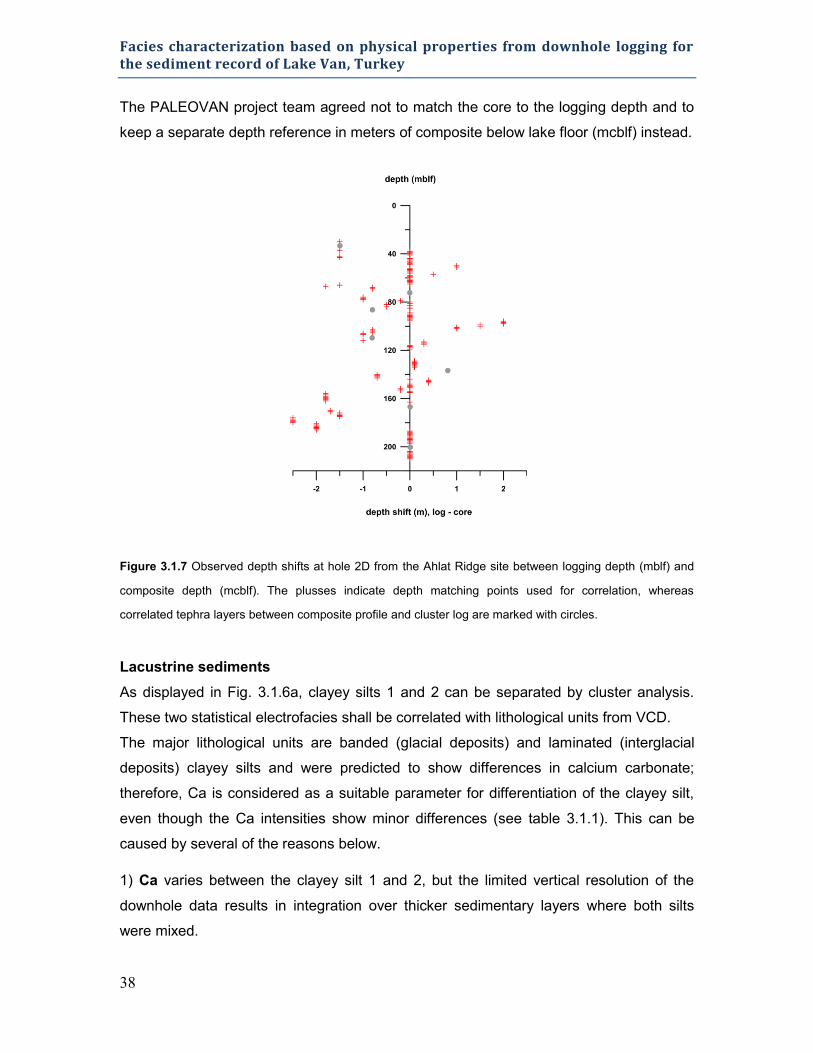
Facies characterization based on physical properties from downhole logging for the sediment record of Lake Van, Turkey
38
The PALEOVAN project team agreed not to match the core to the logging depth and to
keep a separate depth reference in meters of composite below lake floor (mcblf) instead.
Figure 3.1.7 Observed depth shifts at hole 2D from the Ahlat Ridge site between logging depth (mblf) and
composite depth (mcblf). The plusses indicate depth matching points used for correlation, whereas
correlated tephra layers between composite profile and cluster log are marked with circles.
Lacustrine sediments
As displayed in Fig. 3.1.6a, clayey silts 1 and 2 can be separated by cluster analysis.
These two statistical electrofacies shall be correlated with lithological units from VCD.
The major lithological units are banded (glacial deposits) and laminated (interglacial
deposits) clayey silts and were predicted to show differences in calcium carbonate;
therefore, Ca is considered as a suitable parameter for differentiation of the clayey silt,
even though the Ca intensities show minor differences (see table 3.1.1). This can be
caused by several of the reasons below.
1) Ca varies between the clayey silt 1 and 2, but the limited vertical resolution of the
downhole data results in integration over thicker sedimentary layers where both silts
were mixed.

Results
39
2) In glacial and interglacial periods, Ca supply and calcium carbonate deposition were
similar.
3) The Ca supply from Ca-rich volcanic deposits of trachytic to rhyolitic composition
either from surface runoff or input of dispersed tephra into the lake, which effects the
lacustrine depositions as background sedimentation. This background signal possibly
masks the differences in calcium carbonate supply because of changing climatic
conditions.
The K, Th and Fe contents were hypothesized to vary within clayey silts depending on
the terrigenous input. Links between environmental conditions and weathering and
erosion intensity in the catchment is known to be archived in lake sediments. However,
K and SUSC are not variable within the clayey silts (see table 3.1.1) and neither K nor
SUSC are suitable for separation of glacial vs. interglacial deposits for this sediment
record. This could be the result of a constant supply and deposition of K and Fe during
glacial and interglacial periods. Furthermore, the input of K and Fe into the sediments
might have been variable, but because of background sedimentation of volcaniclastics,
these variations are not resolvable. Dispersed volcanic particles with high K and SUSC
signals (see table 3.1.1) could have overprinted/veiled the climate signal.
The Th content of the clayey silts 1 and 2 determined by cluster analysis show slight
differences (table 3.1.1), which might be the result of changing detrital input. Another
possible source for Th might be a varying supply of Th-rich volcanic particles. The U
content of the clayey silts 1 and 2 were assumed to show differences between
interglacial (laminated) and glacial (banded) deposits because of different contents of
organic matter and its likely association with U. The U content is variable in the clayey
silts 1 and 2 and is considered a suitable parameter for differentiation between the
lacustrine sediments (see table 3.1.1). The Zr intensity is presumably less-variable in
clayey silts as in the tephra of Lake Van, which is supported by the cluster properties
(see table 3.1.1). Variations may occur because of changes in detrital input of Zr-rich
volcanic deposits.
Because the cluster analysis-based lithology log is based on the input variables, the
cluster units were expected to show an acceptable correlation with the (major)
lithological units from the composite profile derived from the VCD. However, the
composite profile and the cluster log show very little correlation. Therefore, the lacustrine
units are not differentiable with the available downhole logging parameters. Although
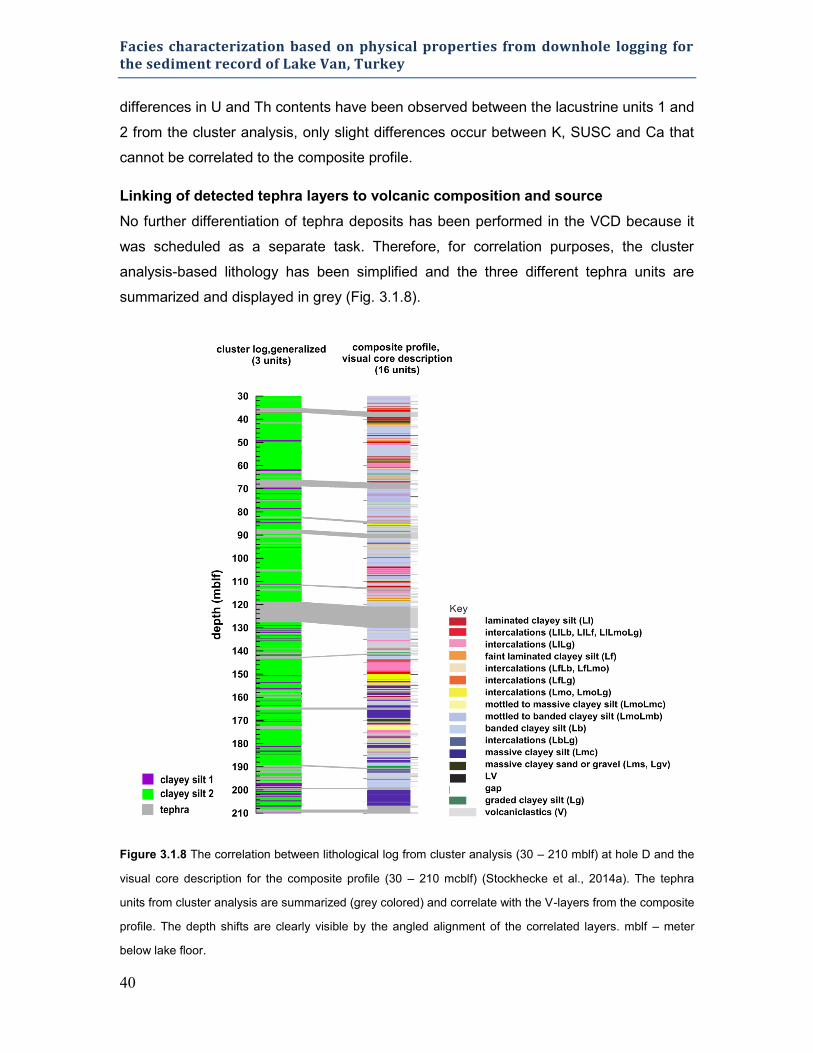
Facies characterization based on physical properties from downhole logging for the sediment record of Lake Van, Turkey
40
differences in U and Th contents have been observed between the lacustrine units 1 and
2 from the cluster analysis, only slight differences occur between K, SUSC and Ca that
cannot be correlated to the composite profile.
Linking of detected tephra layers to volcanic composition and source
No further differentiation of tephra deposits has been performed in the VCD because it
was scheduled as a separate task. Therefore, for correlation purposes, the cluster
analysis-based lithology has been simplified and the three different tephra units are
summarized and displayed in grey (Fig. 3.1.8).
Figure 3.1.8 The correlation between lithological log from cluster analysis (30 – 210 mblf) at hole D and the
visual core description for the composite profile (30 – 210 mcblf) (Stockhecke et al., 2014a). The tephra
units from cluster analysis are summarized (grey colored) and correlate with the V-layers from the composite
profile. The depth shifts are clearly visible by the angled alignment of the correlated layers. mblf – meter
below lake floor.
Results
41
The cluster log shows good correlation with the volcaniclastics (V-layers) of the
composite profile. In addition, the existing depth shifts between logs and the composite
profiles are clearly visible. Some of the gaps in the composite profile could be filled by
the correlation (e.g., 207 – 209 mcblf and 69 – 70 mcblf). Interpretation of the cluster
analysis (three tephra units) and the known volcanic sources for the Lake Van record,
suggests a correlation between tephra units according to their physical and chemical
properties and the composition of the volcanic deposits.
Tephra 1 can be correlated by its low-medium K content and SUSC values (indicative
for medium FeO + Fe2O3 contents) to dacitic composition. Furthermore, high CaO and
medium to high Zr and Th contents are indicative of dacitic tephra (table 3.1.2).
Tephra 2 has medium-high K content and medium SUSC values. In contrast to tephra 1,
the CaO content is much lower and the incompatible elements Zr and Th are medium to
high. The physical and chemical properties suggest a rhyolitic composition; however, a
trachytic source is possible as well (table 3.1.2). A clear separation based on the
available data is difficult. Tephra 3 is characterized by a low K content and high SUSC
values. The CaO content is high as well, whereas the Th and Zr contents are low.
Tephra 3 is likely dominated by a basaltic composition (table 3.1.2).
We suggest a link between tephra units 1 to 3 and the dominant magma compositions.
The contrasting compositions of the magma sources of the Nemrut and Süphan
volcanoes (Sumita and Schmincke, 2013b) are reflected by their physical and chemical
properties. At this stage of research, we have found correlations for the tephra units not
only with the chemical composition but also with the related volcanic source.
Tephra 2 (rhyolitic/trachytic composition) is most likely sourced by the Nemrut volcano.
This is supported by the high Zr intensities. For Lake Van, Zr is considered useful in
identifying the volcanic source because abundance of Zr is indicative of the Nemrut
volcano (pers. comm., Schmincke, 2011).
The Incekaya volcano supplied basaltic products, with one layer at 31.5 mblf, which
confirms our interpretation of tephra unit 3 as basaltic. However, as the tephra in the
cores are under study, up to now we have not known whether the other basaltic products
are also from this source. According to Sumita and Schmincke (2013a), Nemrut supplied
minor amounts of intermediate and basaltic tephra as well. The basaltic products might
be sourced from Nemrut during an early phase when the magma composition was less
differentiated (Sumita and Schmincke, 2012); however, it is still uncertain whether some
of tephra 3 might have originated from the Nemrut volcano.
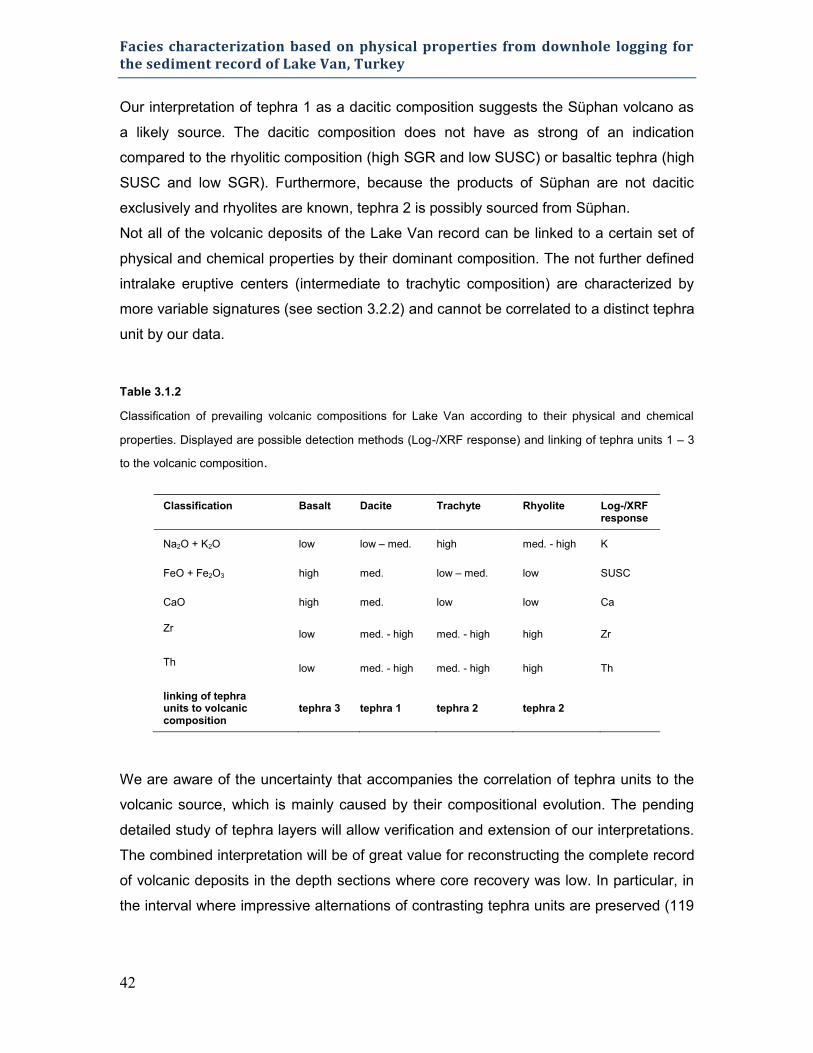
Facies characterization based on physical properties from downhole logging for the sediment record of Lake Van, Turkey
42
Our interpretation of tephra 1 as a dacitic composition suggests the Süphan volcano as
a likely source. The dacitic composition does not have as strong of an indication
compared to the rhyolitic composition (high SGR and low SUSC) or basaltic tephra (high
SUSC and low SGR). Furthermore, because the products of Süphan are not dacitic
exclusively and rhyolites are known, tephra 2 is possibly sourced from Süphan.
Not all of the volcanic deposits of the Lake Van record can be linked to a certain set of
physical and chemical properties by their dominant composition. The not further defined
intralake eruptive centers (intermediate to trachytic composition) are characterized by
more variable signatures (see section 3.2.2) and cannot be correlated to a distinct tephra
unit by our data.
Table 3.1.2
Classification of prevailing volcanic compositions for Lake Van according to their physical and chemical
properties. Displayed are possible detection methods (Log-/XRF response) and linking of tephra units 1 – 3
to the volcanic composition.
Classification Basalt Dacite Trachyte Rhyolite Log-/XRF response
Na2O + K2O low low – med. high med. - high K
FeO + Fe2O3 high med. low – med. low SUSC
CaO high med. low low Ca
Zr
low med. - high med. - high high Zr
Th
low med. - high med. - high high Th
linking of tephra units to volcanic composition
tephra 3 tephra 1 tephra 2 tephra 2
We are aware of the uncertainty that accompanies the correlation of tephra units to the
volcanic source, which is mainly caused by their compositional evolution. The pending
detailed study of tephra layers will allow verification and extension of our interpretations.
The combined interpretation will be of great value for reconstructing the complete record
of volcanic deposits in the depth sections where core recovery was low. In particular, in
the interval where impressive alternations of contrasting tephra units are preserved (119
Results
43
– 128 mblf), no cores have been recovered and the logging data can contribute to
completing the reconstruction of the volcanic evolution.
Development of volcanic products based on cluster analysis
Interpretation of the tephra units suggests an evolution of volcanic deposits for the Lake
Van record. In the bottom part of the drilled sediments (128 – 210 mblf), basaltic
products (tephra 3) prevail, which is in accordance with Sumita and Schmincke (2012).
Additionally, minor layers of dacitic and rhyolitic/trachytic tephra are preserved. The
tephra layers occur mostly in thicknesses below 2 m. At 128 mblf, a thick basaltic layer
(2 m) is detected, which is followed by a rhyolitic/trachytic tephra. A similar succession
follows with another basaltic layer and an even thicker rhyolitic/trachytic layer (3 m) on
top. These alternations build up to the thickest volcanic deposit (9 m) in the whole
analyzed section (30 – 210 mblf). According to our interpretation, no basaltic deposits
are evident for the next 83 m of accumulated sediments up to the well-known basaltic
layer (35 – 37 mblf) from Incekaya volcano (pers. comm., Schmincke, 2011). In contrast,
a more frequent occurrence of dacitic and rhyolitic/trachytic tephra with thickness up to
1.5 m is recorded.
We suggest a compositional evolution of the recorded deposits at 128 mblf, starting with
a peak in basaltic composition followed by a decrease and the gradual outweighing of
more highly evolved magma (dacitic and rhyolitic/trachytic products).
3.1.6 Conclusions
The drilled sedimentary record of Lake Van was differentiated by downhole logging and
additional XRF scanning data through cluster analysis. A continuous lithological profile of
the record from 30 m to 210 mblf was constructed and five lithological units were
determined and interpreted as two clayey silts and three tephra units.
For lacustrine facies vs. tephra deposits, SGR, Zr and SUSC are the clearest
discriminators. Further separation of the lacustrine facies is difficult based on the used
data because of little contrast in the analyzed physical and chemical properties and a
minor occurrence of homogenous layers above detection limit for downhole logging.
However, with the available physical in-situ data from downhole logging and the data
from XRF scanning, no discrimination between glacial (banded and their intercalations)
and interglacial (laminated and their intercalations) can be achieved in the Lake Van
Facies characterization based on physical properties from downhole logging for the sediment record of Lake Van, Turkey
44
record.
Three tephra units were distinguished, which differ in their SGR, SUSC, U, Zr and Ca
values. The known suppliers for volcanic deposits and their dominant compositions allow
linking of their physical and chemical properties to the prevailing composition and even
partly to their volcanic sources. Depth trends could be determined with prevailing
basaltic deposits in the bottom section (128–210 mblf), which are gradually outweighed
by more highly differentiated (dacitic and rhyolitic/trachytic) products.
Results
45
3.2 Cyclostratigraphic studies of sediments
from Lake Van (Turkey) based on their
uranium contents obtained from downhole
logging and paleoclimatic implications
Baumgarten, H., Wonik, T.
46
3.2.1 Introduction
In the framework of the International Continental Scientific Drilling Program (ICDP) a
drilling campaign was carried out in the summer of 2010. The objectives of the project
(PALEOVAN) were to enhance the understanding of the paleoclimatic and
paleoenvironmental conditions of the Middle East for the past 500 ka. Multiple cores
were collected from two boreholes with total depths of 140 m (Northern Basin site) and
217 m (Ahlat Ridge site) (Fig. 3.2.1a). The Ahlat Ridge (AR) site is located in a deep
basin (water depths of 360 m). Pre-site seismic surveys indicated that a continuous
sedimentary sequence is preserved at AR, which increases the potential to yield a
complete paleoenvironmental and paleoclimatic record (Litt et al., 2009).
A comprehensive set of downhole logging data was acquired in hole D at AR. In this
paper, we present results from spectral analysis applied on spectral gamma ray (SGR)
data. Further results of statistical evaluations (cluster analysis) on downhole logging and
X-ray fluorescence (XRF) scanning data from split cores to reconstruct the sediment
record are published by Baumgarten et al. (2014).
Paleoenvironmental investigations on sediments are feasible only if a robust age-depth
model can be achieved. Because incomplete core recovery often occurs when coring
unconsolidated sediments, continuously recorded downhole logging data and following
evaluations are extremely valuable to fill core gaps or for independent testing of core
interpretation. The challenging sedimentary record of Lake Van, which includes several
meters of tephra layers that are difficult to drill, can be analyzed using the in-situ physical
properties achieved by downhole logging.
The main objectives of this contribution are:
(1) analysis and interpretation of orbitally driven cyclicities recorded by physical
properties due to their sensitivity to changes in sediment characteristics and (2)
development of an age-depth relationship based on cyclostratigraphic characteristics of
downhole logging data.
Even though orbital cycles have been interpreted in numerous marine records (Barthes
et al., 1999; Golovchenko et al., 1990; Jarrard and Arthur, 1989; Molinie and Ogg,
1990a) and several lacustrine sedimentary sequences (Bogota-A et al., 2011;
Kashiwaya et al., 2010; Prokopenko et al., 2006), this approach pre-requires continuous
sedimentation and preservation of the cycles. The sediment record of Lake Van is by its
nature not well suited for identification of cycles because they are intersected by
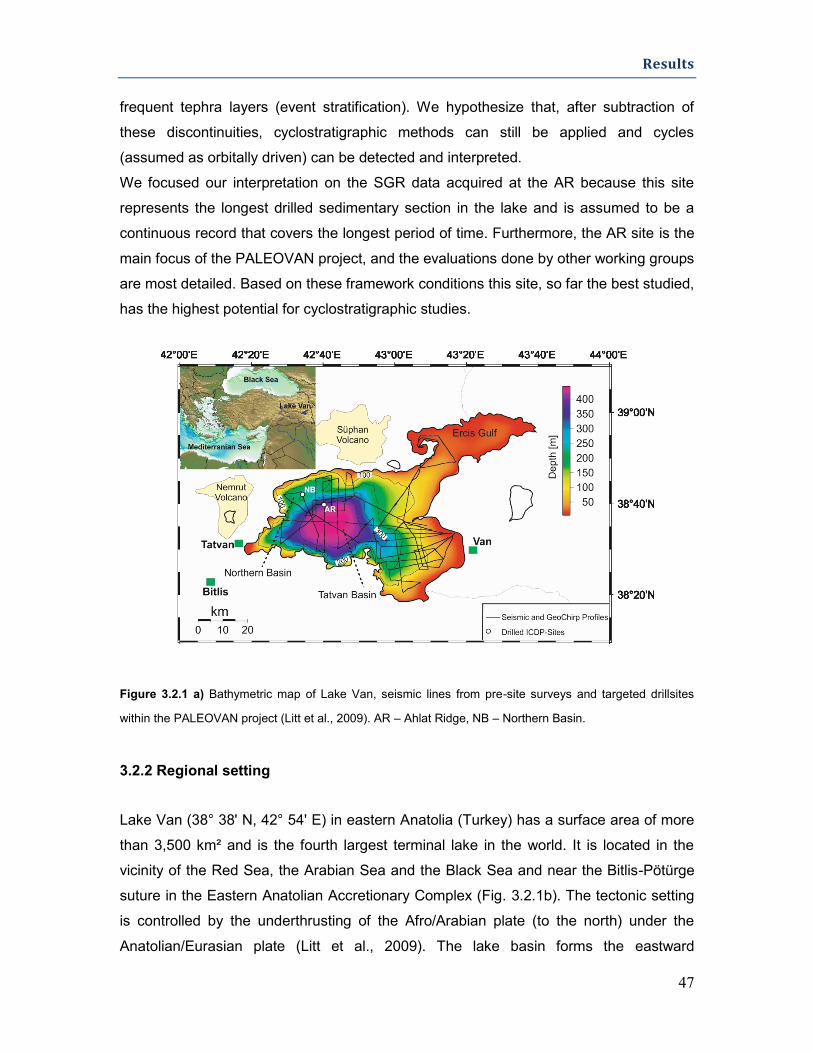
Results
47
frequent tephra layers (event stratification). We hypothesize that, after subtraction of
these discontinuities, cyclostratigraphic methods can still be applied and cycles
(assumed as orbitally driven) can be detected and interpreted.
We focused our interpretation on the SGR data acquired at the AR because this site
represents the longest drilled sedimentary section in the lake and is assumed to be a
continuous record that covers the longest period of time. Furthermore, the AR site is the
main focus of the PALEOVAN project, and the evaluations done by other working groups
are most detailed. Based on these framework conditions this site, so far the best studied,
has the highest potential for cyclostratigraphic studies.
Figure 3.2.1 a) Bathymetric map of Lake Van, seismic lines from pre-site surveys and targeted drillsites
within the PALEOVAN project (Litt et al., 2009). AR – Ahlat Ridge, NB – Northern Basin.
3.2.2 Regional setting
Lake Van (38° 38' N, 42° 54' E) in eastern Anatolia (Turkey) has a surface area of more
than 3,500 km² and is the fourth largest terminal lake in the world. It is located in the
vicinity of the Red Sea, the Arabian Sea and the Black Sea and near the Bitlis-Pötürge
suture in the Eastern Anatolian Accretionary Complex (Fig. 3.2.1b). The tectonic setting
is controlled by the underthrusting of the Afro/Arabian plate (to the north) under the
Anatolian/Eurasian plate (Litt et al., 2009). The lake basin forms the eastward
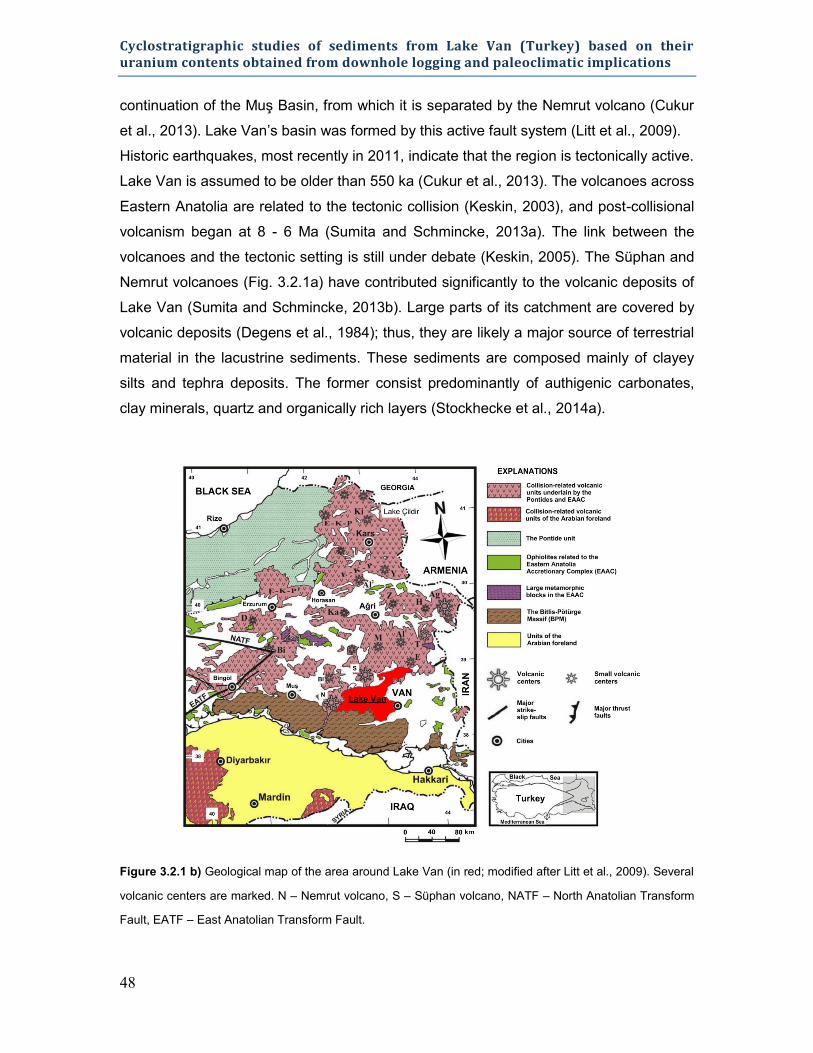
Cyclostratigraphic studies of sediments from Lake Van (Turkey) based on their uranium contents obtained from downhole logging and paleoclimatic implications
48
continuation of the Muş Basin, from which it is separated by the Nemrut volcano (Cukur
et al., 2013). Lake Van’s basin was formed by this active fault system (Litt et al., 2009).
Historic earthquakes, most recently in 2011, indicate that the region is tectonically active.
Lake Van is assumed to be older than 550 ka (Cukur et al., 2013). The volcanoes across
Eastern Anatolia are related to the tectonic collision (Keskin, 2003), and post-collisional
volcanism began at 8 - 6 Ma (Sumita and Schmincke, 2013a). The link between the
volcanoes and the tectonic setting is still under debate (Keskin, 2005). The Süphan and
Nemrut volcanoes (Fig. 3.2.1a) have contributed significantly to the volcanic deposits of
Lake Van (Sumita and Schmincke, 2013b). Large parts of its catchment are covered by
volcanic deposits (Degens et al., 1984); thus, they are likely a major source of terrestrial
material in the lacustrine sediments. These sediments are composed mainly of clayey
silts and tephra deposits. The former consist predominantly of authigenic carbonates,
clay minerals, quartz and organically rich layers (Stockhecke et al., 2014a).
Figure 3.2.1 b) Geological map of the area around Lake Van (in red; modified after Litt et al., 2009). Several
volcanic centers are marked. N – Nemrut volcano, S – Süphan volcano, NATF – North Anatolian Transform
Fault, EATF – East Anatolian Transform Fault.
Results
49
The climate in the region is affected by several atmospheric elements, including the mid-
latitude westerlies (Chavaillaz et al., 2013) (westerly jet streams; which are triggered by
the equator-to-pole gradient), the Mediterranean subtropical high-pressure system and
the Siberian high-pressure system (Akcar and Schlüchter, 2005; Stockhecke et al.,
2012). The position of Lake Van between prevailing arid and humid regions makes it
sensitive to climatic changes. Lake-level terraces surrounding Lake Van have recorded
past changes in the hydrological system (Landmann et al., 1996; Litt et al., 2009). The
lake water has an alkaline-characteristic, which is likely due to volcanic inputs of CO2
(Degens et al., 1984). The current local climate is continental, with dry and warm
summers (mean temperature > 20°C), cold winters (mean temperature < 0°C) and
precipitation during winter and spring (Landmann et al., 1996; Stockhecke et al., 2012).
The lake level is currently at 1,647 m asl and has undergone significant changes
(hundreds of meters) since the lake’s initial formation (Cukur et al., 2013). Extensive
investigations, including shallow coring to depths of 8 – 9 m and surface geophysics,
began in the 1970s. These cores revealed an annual resolution of at least 15 ka
(Landmann et al., 1996). The sedimentation rates in the Holocene were determined by
varve counting in short cores and ranges from 30 to 100 cm/ka (Degens et al., 1984).
Additional short cores (3 – 9 m) were drilled at AR in 2004 (Fig. 3.2.1a). By correlating
prominent ash layers in the short cores with those found in cores drilled in 2009, Litt et
al. (2009) estimated a mean sedimentation rate of 50 cm/ka.
Lake Van contains several deep basins, and the Tatvan Basin was targeted for drilling
(Fig. 3.2.1a) (Litt et al., 2009). The AR site is located in the Tatvan Basin, and multiple
cores were collected to a total depth of 217 m with an overall core recovery of 91 %.
This site is assumed to yield a complete paleoenvironmental and paleoclimatic record
because the results from a pre-site seismic survey indicate that an undisturbed
sedimentary sequence is preserved (Litt et al., 2009). Additionally, the location of the
deep basin far from the lake shore decreases the likelihood of mass-flow deposits in the
sediments, which occur close to the southern shore in Lake Van (Cukur et al., 2013).
3.2.3 Material and methods
Data acquisition, preprocessing and processing
Hole D at AR was drilled with a diameter of 149 mm. Water-based mud was used with
additives (citric acid) to compensate for the high pH (9.8) of the lake water. The SGR
data, including the potassium (K), thorium (Th) and uranium (U) contents, were recorded
Cyclostratigraphic studies of sediments from Lake Van (Turkey) based on their uranium contents obtained from downhole logging and paleoclimatic implications
50
with the slimhole tool (SGR 70, Antares, Germany) of the Leibniz Institute for Applied
Geophysics. The sampling rate was 10 cm and the logging speed was 3 m/min. The
vertical resolution (minimum bed resolution) which can be achieved depends amongst
the tool specification (size of the BGO crystal: 5 x 15 cm) on formation characteristics,
e.g. the contrast of values between a thin bed (reference) and its neighbor bed and the
absolute value range (Theys, 1991). Therefore, we can estimate the vertical resolution
only as 15 -20 cm. Descriptions of this logging tool are given by Barrett et al. (2000) and
Buecker et al. (2000), and the physical principles are described by Rider and Kennedy
(2011). Hole D was first drilled to 118 m below lake floor (mblf) and extended to a final
depth of 217 mblf in a second phase of drilling.
SGR was recorded through the drillpipe directly after each drilling phase and covers the
complete drilled sediment record. The software GeoBase® (Antares, Germany) was used
for data acquisition, preprocessing and processing. After depth matching of the logs, the
two sections (0 – 118 and 118 – 217 mblf) were spliced for further analysis.
The environmental correction of the SGR was calculated to take into account the
disturbance due to drilling (Lehmann, 2010). The uncorrected and corrected data differ
only by a constant factor; thus, the original data were used for the evaluations because
potential periodicities in the data are not affected by an offset in the absolute values.
Cyclostratigraphic analysis
Variations of the solar insolation on the Earth are a major control of the climate
(Milanković, 1920) and therefore affect the properties of deposited sediments (Rachold
and Brumsack, 2001). Several periodicities have been defined for the solar variations in
the Quaternary (Berger and Loutre, 2010), including eccentricity (E: 100 ka), obliquity
(O: 41 ka) and precession (P2: 23 ka and P1: 19 ka). The 100 ka E cycle is known to be
dominant in paleoclimate records, particularly for the last 900 ka.
Variations in sediment characteristics, which are controlled by varying climatic
conditions, are detectable by their different physical properties (Lamont-Doherty Earth
Observatory Borehole Research Group, 2001). Possible responses of downhole logging
data to (climate-driven) variations in sediment characteristics are shown in Fig. 3.2.2.
Cyclostratigraphic studies of downhole data have been successfully performed on
gamma ray (Molinie and Ogg, 1990b; Wonik, 2001), resistivity (Golovchenko et al.,
1990), seismic velocity (vp) (Jarrard and Arthur, 1989) and magnetic susceptibility

Results
51
(Barthes et al., 1999). Such cyclicities can be interpreted as repeated sedimentary
sequences, which are characterized by varying physical properties. If the cycles can be
successfully correlated with orbital cycles, the depth scale can be converted to a time
scale and mean sedimentation rates can be determined (Molinie and Ogg, 1990a).
Figure 3.2.2 The varying intensity of solar radiation affects the climate, which influences the properties of
the deposited sediments. Several variations can be detected by physical and chemical properties of the
sediment record and are reflected in the downhole logging data.
For cyclostratigraphic analysis, the sedimentation is considered to be continuous over
the analyzed time interval. Additional event deposition (thick turbidites or volcanic ash
layers) or erosional events (hiatuses) disturb continuous sedimentation and – if not
corrected for - produce erroneous estimates of sedimentation rates. Artificial time series
have been examined to determine the impact of geological disruptions, such as
hiatuses, on time series analysis (Stage, 1999). He introduced hiatuses in the amount of
Cyclostratigraphic studies of sediments from Lake Van (Turkey) based on their uranium contents obtained from downhole logging and paleoclimatic implications
52
15 % of the original time series which have been found to significantly change the
spectrum. Because the depth scale is converted to a time scale, the vertical resolution of
the downhole logging tools and the sedimentation rate control the temporal resolution.
Generally, the vertical resolution that can be achieved by spectral analysis is defined by
the Nyquist frequency (2 times the sampling rate) (Molinie and Ogg, 1990a). Thus, for
SGR with a vertical resolution of 15 - 20 cm and a mean sedimentation rate of 30 cm/ka,
a time resolution of c. 1.0 – 1.3 ka can be achieved.
Sedimentation rate variations for the recorded data can be detected using the sliding
window method (Molinie and Ogg, 1990b; Wonik, 2001). The spectral analysis is
calculated for a certain depth interval (window size), and the window is then shifted
downwards continuously at a specific step. The calculation is repeated, and the results
are displayed at the center of each window, resulting in a three-dimensional spectral
plot. The optimal window size is determined empirically. The window needs to be as
short as possible to maximize the length of the resulting plot but long enough to cover
the signal. For example, a 30 m-long E cycle cannot be detected properly by a 20 m-
long window. A window that is too short will smear the signal.
The window length and step size used for this dataset are indicated in the results
section. The characteristic periodicities were identified by application of spectral analysis
(Jenkins and Watts, 1969; Priestley, 1981) performed as fast Fourier Transform
(Windowed Fourier transform) (Torrence and Compo, 1998), by using MATLAB
(MathWorks®). In addition to the Milanković cycles, higher-frequency signals (sub-
Milanković) have been recorded by the North Greenland δ18O record (NGRIP), which
indicates 24 Greenland Interstadials (GIS) over the past 123 ka (Andersen et al., 2004;
North Greenland Ice Core Project members, 2004). These rapid warming events
(Dansgaard-Oeschger cycles; Dansgaard et al., 1993) have a periodicity of
approximately 1.5 ka and 3 ka and 4.5 ka which are multiples of 1.5 ka (Rahmstorf,
2002; Alley et al., 2001).
Several high-frequency fluctuations have been observed in Quaternary paleoclimate
records, such as in pollen (Mueller et al., 2011), total organic carbon (Prokopenko et al.,
2001) or carbonate contents (Wagner et al., 2010). Depending on sedimentation rates
and the resulting temporal resolution, even climate signals in the range of sub-
Milanković frequencies can be detected using downhole logging techniques (Paulissen
and Luthi, 2011).

Results
53
Data preparation for spectral analysis
Discontinuities in the sedimentary process, such as event stratifications (Schwarzacher,
2000) that were not deposited at “normal” sedimentation rates, cause uncertainties in
linking the sediment thickness to time. Therefore, an approach was needed to eliminate
the numerous tephra layers (= event deposits; deposited almost instantaneously) from
the Lake Van record.
A continuous lithological profile is the first step to identify these layers. It was
reconstructed based on cluster analysis of several downhole logging data as well as
additional parameters from XRF scanning of split cores (Baumgarten et al., 2014). The
vertical resolution of the cluster analysis is controlled by the input data which range from
c. 2 cm (resistivity from Dipmeter) to c. 20 cm (magnetic susceptibility). The combined
vertical resolution cannot be determined precisely, but we consider thin lithological
layers (< 15 cm) below the detection limit. After the integrated interpretation of the
results of the cluster analysis and the composite lithological profile from visual core
descriptions (compiled by Stockhecke et al., 2014a), the tephra deposits were separated
clearly. They are generally characterized by higher mean gamma ray (GR) values (> 40
gAPI) than the lacustrine deposits. Thus, this value was used as a cutoff, and layers with
GR values above 40 gAPI were interpreted as tephra and removed from the profile.
Border effects and thin tephra layers below minimum bed resolution cannot be excluded.
To run the spectral analysis on a continuous depth section, a synthetic depth scale was
created. For example, after removing the 9 m-thick tephra layers from 120 to 129 mblf,
the upper part of the log was manually shifted down; hence, the log was shortened by 9
m. After eliminating approximately 50 m of tephra, the resulting “synthetic log”
(composed mainly of lacustrine clayey silts) was 160 m long. The spectral analysis was
performed on this record. Fig. 3.2.3a shows the result of this processing step for the
uranium log (Uedit).
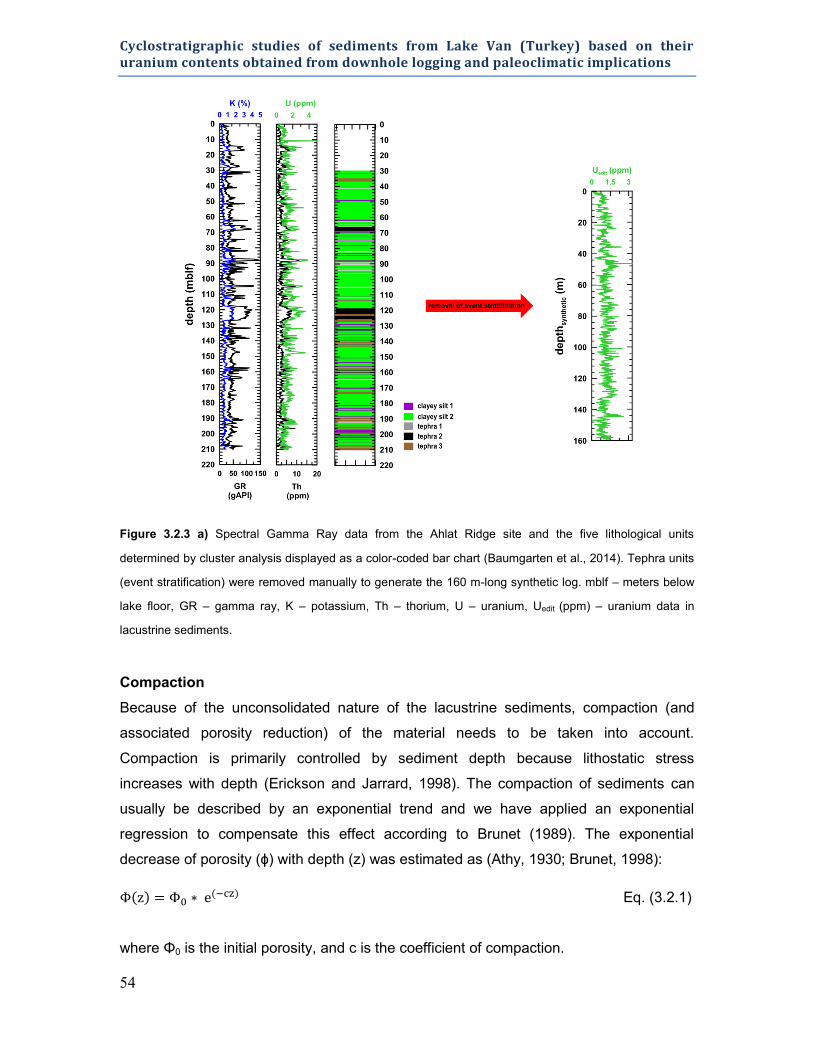
Cyclostratigraphic studies of sediments from Lake Van (Turkey) based on their uranium contents obtained from downhole logging and paleoclimatic implications
54
Figure 3.2.3 a) Spectral Gamma Ray data from the Ahlat Ridge site and the five lithological units
determined by cluster analysis displayed as a color-coded bar chart (Baumgarten et al., 2014). Tephra units
(event stratification) were removed manually to generate the 160 m-long synthetic log. mblf – meters below
lake floor, GR – gamma ray, K – potassium, Th – thorium, U – uranium, Uedit (ppm) – uranium data in
lacustrine sediments.
Compaction
Because of the unconsolidated nature of the lacustrine sediments, compaction (and
associated porosity reduction) of the material needs to be taken into account.
Compaction is primarily controlled by sediment depth because lithostatic stress
increases with depth (Erickson and Jarrard, 1998). The compaction of sediments can
usually be described by an exponential trend and we have applied an exponential
regression to compensate this effect according to Brunet (1989). The exponential
decrease of porosity (ϕ) with depth (z) was estimated as (Athy, 1930; Brunet, 1998):
Eq. (3.2.1)
where Φ0 is the initial porosity, and c is the coefficient of compaction.
Results
55
Assuming that the compaction of the sum of the GR data and their spectral components
can be described in a similar manner as the porosity (Eq. 3.2.1), the respective residuals
were computed.
The role of spectral gamma ray data for cyclostratigraphic studies
The imprinting of orbital (climate) signals in sediments requires mechanisms for the
response of the observed parameter to changes in climatic conditions. GR data have
been used for cyclostratigraphic analyses and variations in the natural radioactivity are
often linked to the abundance of clay minerals or differences in clay mineralogy (Serra,
1986; Rider and Kennedy, 2011). However, the spectral components have the potential
to yield more detailed information than the sum of the natural radioactivity. The roles of
K, Th and U in changing climatic conditions require further investigations, in particular for
lacustrine sedimentary climate archives.
The spectral components have several sources in sediments. The host minerals for K
are mainly feldspars, micas and clays, whereas Th originates from feldspars, clays,
phosphates and Th-bearing minerals such as monazite. U occurs in feldspars, clays and
heavy minerals (e.g., zircon) and is also associated with organic matter (Rider and
Kennedy, 2011; Schnyder et al., 2006).
The Th/K ratio is often considered to be indicative of humid vs. arid periods because it
reflects the kaolinite/illite distribution, which increases during weathering in humid
conditions (Grabowski et al., 2013). The more soluble components U (and K) are likely
removed by intense weathering in conjunction with higher concentrations of Th, which
leads to increased Th/U (and Th/K) ratios in the remaining sediments. The presence of a
climate signal requires the assumption that the signature of the minerals is preserved
during transport and deposition (Ruffell and Worden, 2000), and thereafter strong
diagenesis is an issue (Schnyder et al., 2006). Several investigations have shown that
the Th/K ratio is not necessarily a climate indicator for humidity (Grabowski et al., 2013).
Schnyder et al. (2006) found no direct correlation between the U content and the total
organic carbon (TOC) content of the analyzed (prevailing marine) sediments. They
proposed that oxic vs. anoxic conditions of the water masses cause the signal and
trigger U degradation (redox-dependent) in organic-rich intervals. Nowaczyk et al. (2013)
performed a multi-proxy study, including TOC content, of the lacustrine sediments of
Lake El’gygytgyn and found a correlation between high TOC contents during glacial

Cyclostratigraphic studies of sediments from Lake Van (Turkey) based on their uranium contents obtained from downhole logging and paleoclimatic implications
56
conditions with anoxic lake bottom water, which favors the preservation of organic
matter. However, an inverse correlation was observed for several super-interglacials
(Melles et al., 2012) that were accompanied by TOC preservation during oxic conditions
and intermediate TOC contents. They suggested that an increased flux of organic matter
caused TOC preservation.
The lithological record of the AR site is composed of cores from seven boreholes, which
were described and correlated to create a composite profile (Stockhecke et al., 2014a).
They used meters of composite depth below the lake floor (mcblf) as the reference for
the profile, which spans 219 m. Carbonaceous clayey silts make up the majority (76 %)
of the lacustrine facies. The visual core description revealed 15 lithological units. Two
prominent lithotypes, ‘laminated clayey silts’ and ‘banded clayey silts’, can be linked to
interglacial and glacial conditions, respectively (Stockhecke et al., 2014a). They
observed strong fluctuations in the TOC values in the Lake Van record, which reflect the
content of organic matter in the sediments. These fluctuations suggest a strong
response of the organic matter to climatic variations. The banded clayey silts were
deposited during cold/dry climate conditions with low productivity (low TOC), high
aeolian and fluvial terrigenous input and oxic bottom water conditions during (prevailing)
regressive lake levels. The laminated clayey silts formed during warm/wet climate
periods with higher lake productivity (higher TOC) under anoxic conditions at the water-
sediment interface, most likely during lake level rises (Stockhecke et al., 2014a).
U ions have an affinity for organic matter and are insoluble under anoxic conditions
(Rider and Kennedy, 2011; Schnyder et al., 2006). Therefore, they are expected to be
more concentrated in the carbonaceous clayey silts of Lake Van if the productivity,
transport and preservation of organic material, and therefore the content of humic
organic matter, in sediments increase. Thus, variations in the U content are expected
and may be imprinted as climate signals in the U values.
Climate-driven variations of terrigenous input (e.g., of K and Th into Lake Van’s
sediments) could be reflected in the SGR values. Furthermore, high (chemical)
weathering intensity during humid interglacial periods are expected to be reflected as
higher Th/U and Th/K ratios compared to drier glacial periods.
3.2.4 Results
Compaction
The exponential regression was calculated using Eq. 3.2.1 for all four datasets (GR, Th,
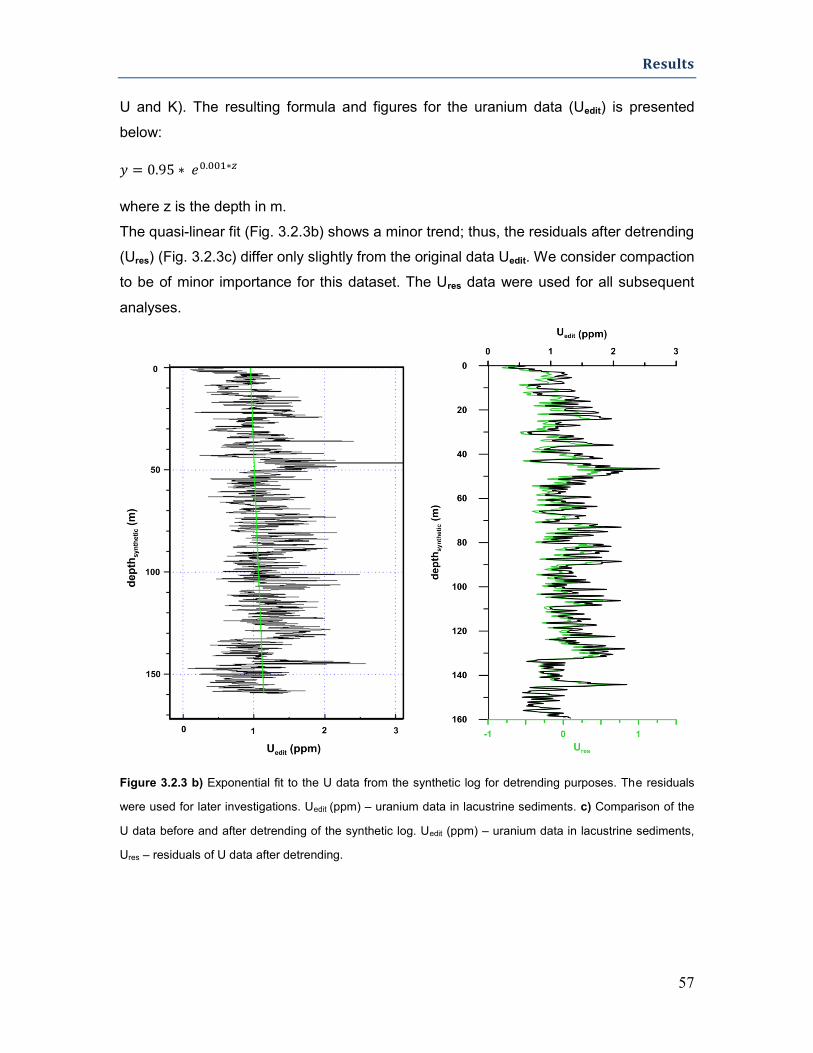
Results
57
U and K). The resulting formula and figures for the uranium data (Uedit) is presented
below:
where z is the depth in m.
The quasi-linear fit (Fig. 3.2.3b) shows a minor trend; thus, the residuals after detrending
(Ures) (Fig. 3.2.3c) differ only slightly from the original data Uedit. We consider compaction
to be of minor importance for this dataset. The Ures data were used for all subsequent
analyses.
Figure 3.2.3 b) Exponential fit to the U data from the synthetic log for detrending purposes. The residuals
were used for later investigations. Uedit (ppm) – uranium data in lacustrine sediments. c) Comparison of the
U data before and after detrending of the synthetic log. Uedit (ppm) – uranium data in lacustrine sediments,
Ures – residuals of U data after detrending.
Cyclostratigraphic studies of sediments from Lake Van (Turkey) based on their uranium contents obtained from downhole logging and paleoclimatic implications
58
Milanković cycles and sedimentation rates from the sliding window technique
GR, K, Th and U were analyzed by spectral analysis. However, the cyclicity is most
pronounced for the U data. Therefore, the U data (Ures) was used for further
interpretation.
The sliding window method was applied by choosing a window length of 66 m and a step
size of 1 m (see “Cyclostratigraphic analysis” section) on the 160 m-long synthetic log.
These parameters remain unchanged for the complete analysis. Because each
spectrum is allocated to the center of the window, the plot has a total length of 94 m (Fig.
3.2.4). The resulting 3D spectral plot shows a clear break in the observed dominant
wavelengths from bottom to top and the plot can be subdivided into two intervals based
on the intensity of the spectral amplitude. Interval I is 67 m long and extends from the
bottom of the analyzed section to 120 mblf, while interval II is 93 m long and extends
from 120 mblf to the top of the section.
The amplitudes are highest in interval II, which indicates stronger cyclicity in the younger
part of the sequence. Wavelengths longer than 7 m have higher amplitudes in both
intervals.
Interval I
Several high amplitudes were observed with wavelengths (λ) of 22.0 m, 16.5 m and
8.3 m. The high amplitude of λ = 22.0 m occurs from the bottom of the interval to
139.0 mblf with a slight decrease in energy from 165.6 to 161.1 mblf and a subsequent
recovery. The high amplitude of λ = 16.5 m occurs from the bottom of interval I to
153.0 mblf with increasing amplitudes from 167.8 mblf. The high amplitude of λ = 8.3 m
starts at the bottom of interval I and extends to 135.4 mblf with a low energy level and
increases slightly towards the top (starting from 140.3 mblf).
We suggest that two of the high amplitudes are correlated with orbital cycles: eccentricity
with λ = 22.0 m and obliquity O with λ = 8.3 m. A change in the system can be detected
by comparing the signals over the complete sequence. Therefore, the borehole is
subdivided at the center of the low amplitude section (120 mblf) from the base upwards
into the next interval (II). The average sedimentation rate was calculated using Eq. 3.2.2:
Eq. (3.2.2)
Assuming that the correlations of the high amplitudes with orbital cycles are correct for
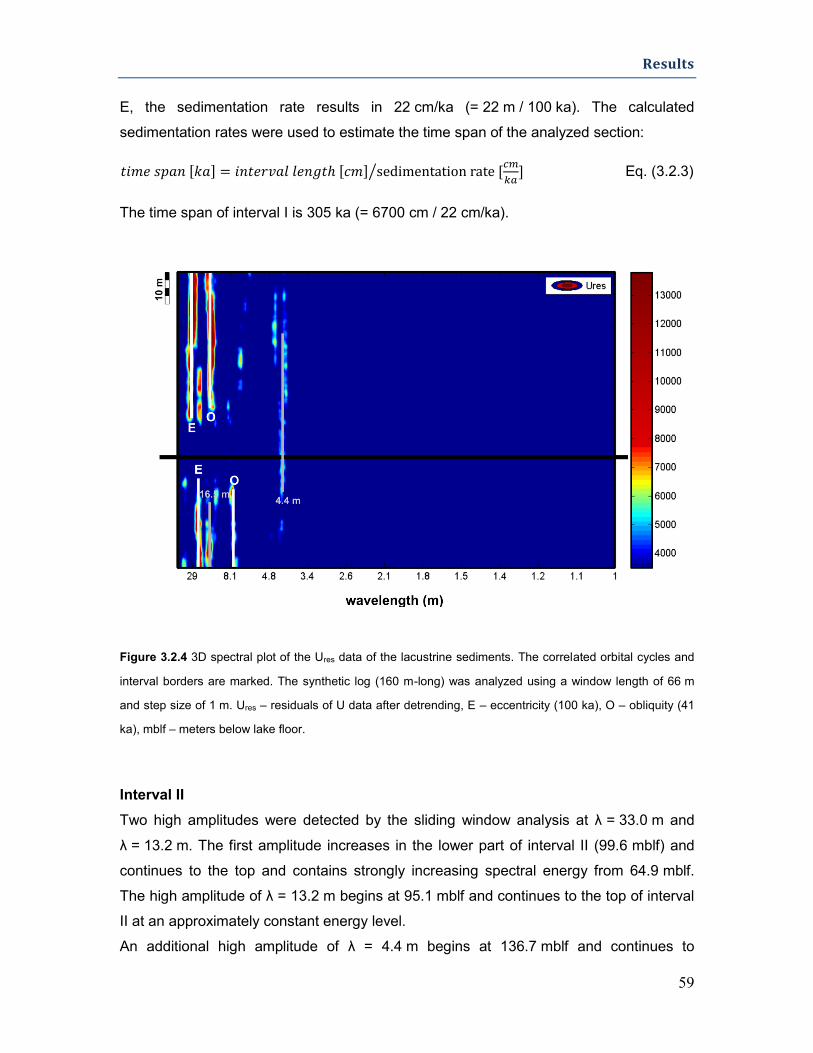
Results
59
E, the sedimentation rate results in 22 cm/ka (= 22 m / 100 ka). The calculated
sedimentation rates were used to estimate the time span of the analyzed section:
Eq. (3.2.3)
The time span of interval I is 305 ka (= 6700 cm / 22 cm/ka).
Figure 3.2.4 3D spectral plot of the Ures data of the lacustrine sediments. The correlated orbital cycles and
interval borders are marked. The synthetic log (160 m-long) was analyzed using a window length of 66 m
and step size of 1 m. Ures – residuals of U data after detrending, E – eccentricity (100 ka), O – obliquity (41
ka), mblf – meters below lake floor.
Interval II
Two high amplitudes were detected by the sliding window analysis at λ = 33.0 m and
λ = 13.2 m. The first amplitude increases in the lower part of interval II (99.6 mblf) and
continues to the top and contains strongly increasing spectral energy from 64.9 mblf.
The high amplitude of λ = 13.2 m begins at 95.1 mblf and continues to the top of interval
II at an approximately constant energy level.
An additional high amplitude of λ = 4.4 m begins at 136.7 mblf and continues to
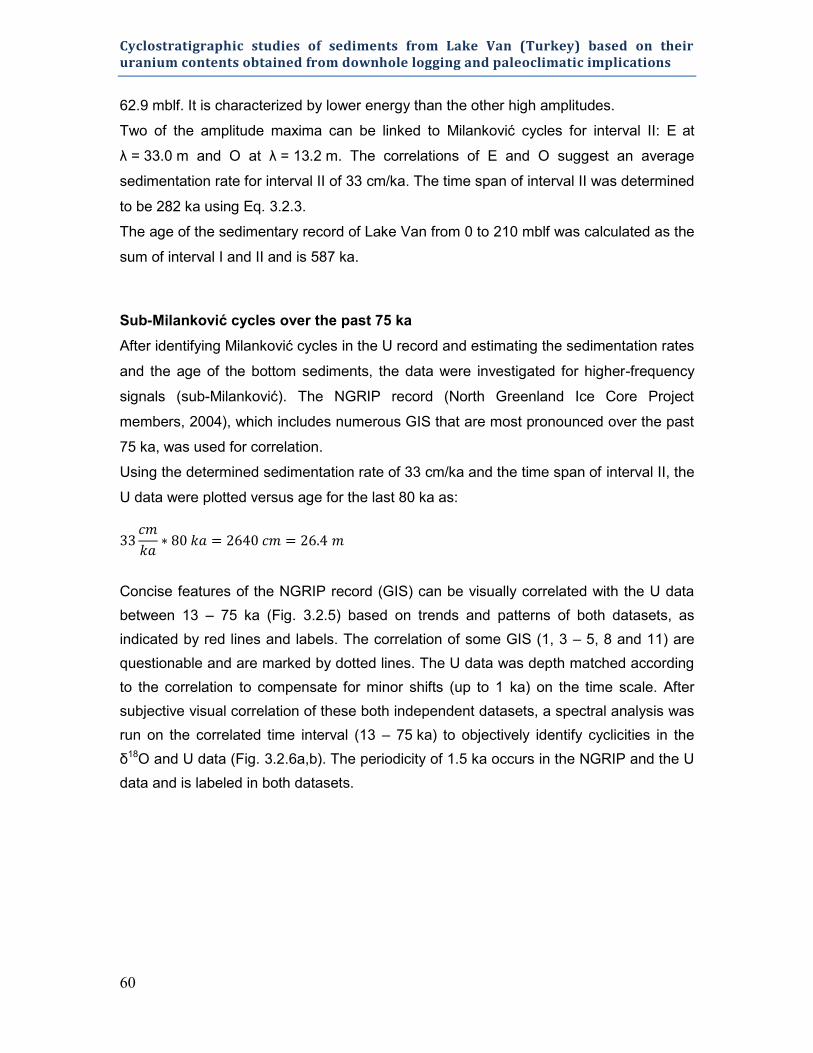
Cyclostratigraphic studies of sediments from Lake Van (Turkey) based on their uranium contents obtained from downhole logging and paleoclimatic implications
60
62.9 mblf. It is characterized by lower energy than the other high amplitudes.
Two of the amplitude maxima can be linked to Milanković cycles for interval II: E at
λ = 33.0 m and O at λ = 13.2 m. The correlations of E and O suggest an average
sedimentation rate for interval II of 33 cm/ka. The time span of interval II was determined
to be 282 ka using Eq. 3.2.3.
The age of the sedimentary record of Lake Van from 0 to 210 mblf was calculated as the
sum of interval I and II and is 587 ka.
Sub-Milanković cycles over the past 75 ka
After identifying Milanković cycles in the U record and estimating the sedimentation rates
and the age of the bottom sediments, the data were investigated for higher-frequency
signals (sub-Milanković). The NGRIP record (North Greenland Ice Core Project
members, 2004), which includes numerous GIS that are most pronounced over the past
75 ka, was used for correlation.
Using the determined sedimentation rate of 33 cm/ka and the time span of interval II, the
U data were plotted versus age for the last 80 ka as:
Concise features of the NGRIP record (GIS) can be visually correlated with the U data
between 13 – 75 ka (Fig. 3.2.5) based on trends and patterns of both datasets, as
indicated by red lines and labels. The correlation of some GIS (1, 3 – 5, 8 and 11) are
questionable and are marked by dotted lines. The U data was depth matched according
to the correlation to compensate for minor shifts (up to 1 ka) on the time scale. After
subjective visual correlation of these both independent datasets, a spectral analysis was
run on the correlated time interval (13 – 75 ka) to objectively identify cyclicities in the
δ18O and U data (Fig. 3.2.6a,b). The periodicity of 1.5 ka occurs in the NGRIP and the U
data and is labeled in both datasets.

Results
61
Figure 3.2.5 Correlation of the NGRIP δ18
O record (North Greenland Ice Core Project members, 2004) and
the U data for the last 80 ka. The NGRIP data were smoothed with a non-recursive filter for easier visual
correlation. Several Greenland Interstadials could be matched with peaks in Ures data, in particular between
13 and 75 ka. Age control points (~ 30 ka (9.9 mblf), ~ 60 ka (19.8 mblf) and ~ 80 ka (26.4 mblf)) in the
correlated interval from 40
Ar / 39
AR (Litt et al., 2014; Stockhecke et al., 2014b) are marked by blue circles.
Ures – residuals of U data after detrending.
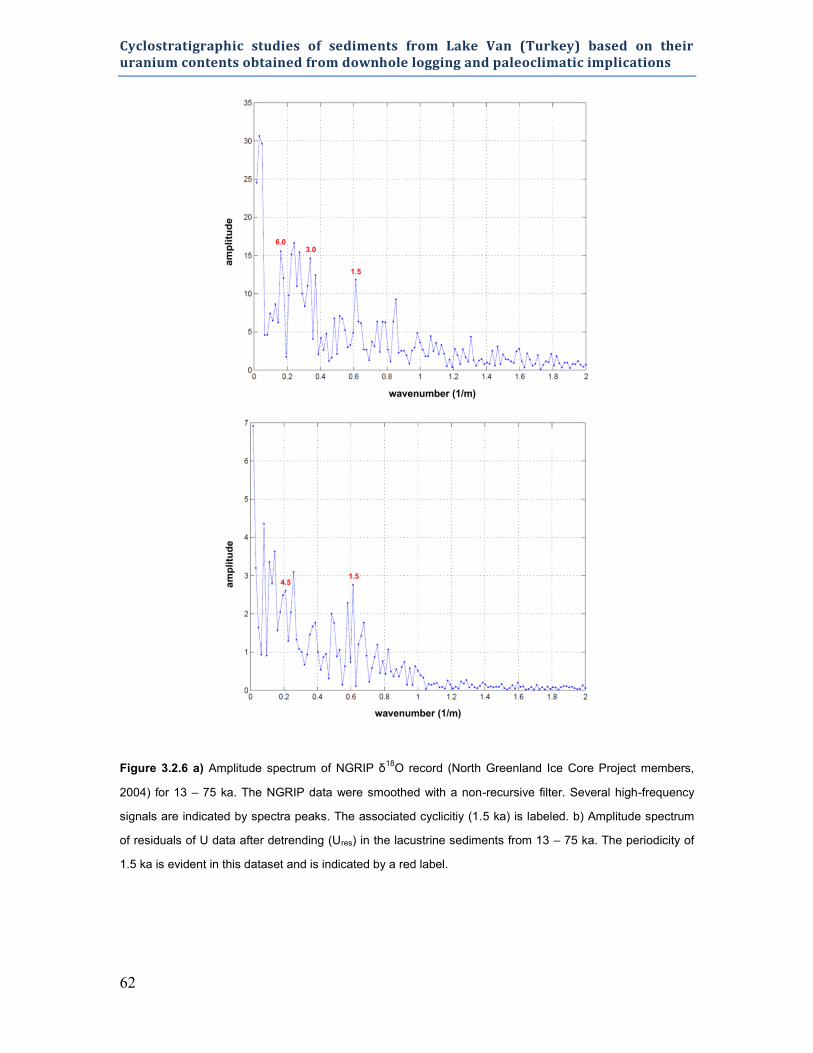
Cyclostratigraphic studies of sediments from Lake Van (Turkey) based on their uranium contents obtained from downhole logging and paleoclimatic implications
62
Figure 3.2.6 a) Amplitude spectrum of NGRIP δ18
O record (North Greenland Ice Core Project members,
2004) for 13 – 75 ka. The NGRIP data were smoothed with a non-recursive filter. Several high-frequency
signals are indicated by spectra peaks. The associated cyclicitiy (1.5 ka) is labeled. b) Amplitude spectrum
of residuals of U data after detrending (Ures) in the lacustrine sediments from 13 – 75 ka. The periodicity of
1.5 ka is evident in this dataset and is indicated by a red label.
Results
63
3.2.5 Discussion
Evolution of sedimentation rates
The interpretation of the sliding window plot based on the U data (see Fig. 3.2.5) shows
that the intensities and positions of the correlated Milanković cycles are not constant in
the Lake Van record. Our correlations suggest a gradual evolution in interval I from
being dominated by the E cycle in conjunction with weak obliquity to an increase of O at
140.3 mblf. In the lower part of interval II, the E cycle appears diffuse, and the energy
begins to increase significantly at 64.9 mblf. E is strong in both intervals, but it is even
more distinct in the upper interval II. The precession cycle appears to be of minor
importance because it was not detected. However, the additional high amplitudes at the
bottom of interval I (λ = 16.5 m ≡ 75 ka cycle) may have been caused by precession (75
ka: multiple of the 19 ka-long P1 cycle).
As mentioned in the “Cyclostratigraphic analysis” section, paleoclimate studies of the
Quaternary have shown that the E signal is the dominant Milanković cycle and is
particularly pronounced from 900 ka to the present (Berger and Loutre, 2010). However,
higher-frequency cycles (O and P) have been interpreted in several records from
Quaternary terrestrial archives (Berger and Loutre, 2010; Bogota-A et al., 2011;
Kashiwaya et al., 2010; Prokopenko et al., 2006).
The results for interval I (up to 340 ka) and the recovery of E starting at 225 ka (interval
II) confirm that the 100 ka cycle has a strong influence in the Lake Van record. The
amplitude of the E cycle prevails over the other signals for the older part (interval I).
However, the O cycle appears to be equivalent to the E cycle for the youngest 215 ka.
In general, when fewer waves are contained in a time series, the likelihood for detection
of the signal is lower. For interval II (sedimentation rate of 33 cm/ka), the low frequency
100 ka cycle (λ = 33 m) could only be recorded with a maximum of three times in the
sediment section (interval length: 93 m). The O signal appears to have a strong effect as
well, particularly in the shallower part of the section. In contrast to E, a maximum of eight
O cycles (λ = 13.2 m) can be present in interval II, which could contribute to the higher
spectral energy and the equal energy level compared to E.
A disturbed unit was recognized at 185 – 168 mcblf (the reference depth of the
composite profile) and is likely associated with discontinuities in the sedimentary record
(Stockhecke et al., 2014a). This might cause the less well defined spectral peaks in
interval I compared to the younger section.
Cyclostratigraphic studies of sediments from Lake Van (Turkey) based on their uranium contents obtained from downhole logging and paleoclimatic implications
64
Our evaluation showed that the sedimentation rates increased significantly from
22 cm/ka in interval I to 33 cm/ka in interval II; the change occurred at approximately
120 mblf. The exact depth cannot be determined because the spectral analysis was
calculated for a 66 m-long window. The results at a specific depth are therefore affected
by the 33 m above and 33 m below the center of the window. However, our results
suggest that a change occurred in the sedimentary system and that the intervals can be
divided at 120 mblf (282 ka).
The sedimentation rates were used to calculate the time span of the system, though we
are aware that ages are needed to determine an absolute chronology. Several aspects
of the data preparation process (Fig. 3.2.3a) might produce artifacts that affect the
calculated sedimentation rates and time span:
(1) The procedure was based on a cluster analysis. Tephra layers that are thinner than
the minimum bed resolution (< 15 – 20 cm) cannot be resolved. Hence, we cannot
preclude the occurrence of thin tephra layers that might affect the spectral analysis and
their interpretation. An incomplete removal of the event stratification would lead to an
overestimation of the thickness of the lacustrine sediments and hence to an
overestimation of the sedimentation rates.
(2) Minor portions of the intercalated lacustrine sediments could also be cut out of the
record, which might introduce small gaps that would result in a loss of the original
sediment thickness and hence an underestimation of the sedimentation rates.
All of the available data should be used to generate a robust age model. Litt et al. (2009)
proposed a sedimentation rate of 50 cm/ka for the AR site. Because that estimate was
based on short cores (3 – 9 m overall length), it does not contradict our results of
33 cm/ka for the interval from 120 mblf to the lake floor (interval II). Stockhecke et al.
(2014b) determined that the Lake Van record covers a time span of approximately
600 ka. These estimates are based on correlations of TOC trends with Marine Isotope
Stages (MIS) and nine 40Ar/39Ar-ages (Litt et al., 2014) and thus are based mainly on
proxy data, the interpretation of which is ambiguous. The estimated sedimentation rates
must be verified with dating methods. A chronology from radiometric dating (e.g.,
40Ar/39Ar-dating of the tephra) is pending, and the few preliminary ages from below
130 mblf provide only a rough estimate. The tephra deposits on the land surrounding
Lake Van are well dated, but the correlation with the tephra layers in the lake’s
stratigraphy is pending (Sumita and Schmincke, 2013b). Therefore, further dating is of
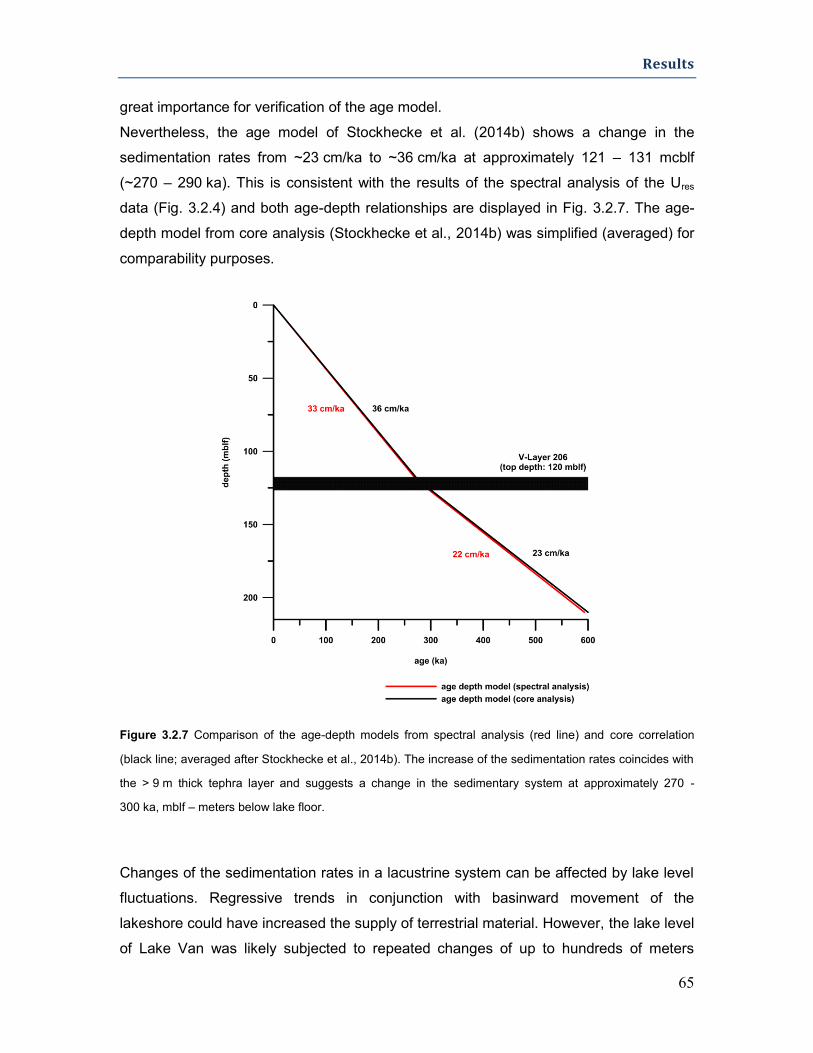
Results
65
great importance for verification of the age model.
Nevertheless, the age model of Stockhecke et al. (2014b) shows a change in the
sedimentation rates from ~23 cm/ka to ~36 cm/ka at approximately 121 – 131 mcblf
(~270 – 290 ka). This is consistent with the results of the spectral analysis of the Ures
data (Fig. 3.2.4) and both age-depth relationships are displayed in Fig. 3.2.7. The age-
depth model from core analysis (Stockhecke et al., 2014b) was simplified (averaged) for
comparability purposes.
Figure 3.2.7 Comparison of the age-depth models from spectral analysis (red line) and core correlation
(black line; averaged after Stockhecke et al., 2014b). The increase of the sedimentation rates coincides with
the > 9 m thick tephra layer and suggests a change in the sedimentary system at approximately 270 -
300 ka, mblf – meters below lake floor.
Changes of the sedimentation rates in a lacustrine system can be affected by lake level
fluctuations. Regressive trends in conjunction with basinward movement of the
lakeshore could have increased the supply of terrestrial material. However, the lake level
of Lake Van was likely subjected to repeated changes of up to hundreds of meters
Cyclostratigraphic studies of sediments from Lake Van (Turkey) based on their uranium contents obtained from downhole logging and paleoclimatic implications
66
(Cukur et al., 2013). Therefore, we do not consider this process as a possible
explanation for the distinct change at approximately 282 ka, whereas the average
sedimentation rate remained approximately constant during the deposition of interval I
(305 ka) and interval II (282 ka).
The change in the sedimentation rates indicates a change in the sedimentary system.
It’s occurrence coincides with the > 9 m-thick tephra layer (V-206; Stockhecke et al.,
2014a) with a top depth of 120 mblf (Baumgarten et al., 2014), which suggests a period
of very strong volcanic activity. The large amount of tephra deposited in the lake
sediments suggests large scale subaerial deposits in the catchment. This additional
terrestrial material could have contributed to an increase in erosion and deposition into
the lake by surface runoff.
The cyclic signal with a wavelength of ~ 4 m (136.7 – 62.9 mblf; see (Fig. 3.2.4) could
not be correlated with an orbital signal, and we can only speculate about the cause. The
SGR tool was run though the casing, so an attenuation effect caused by joint
connections, which have a greater wall thickness, could have caused the signal.
However, the drillpipes are approximately 6.24 m long and their connectors are > 6 m
apart; thus, we can preclude their influence. For this depth section (136.7 – 62.9 mblf),
the removed tephra layers tend to occur at intervals of 4 m and 2 m. We propose that
the high amplitude (λ = 4 m) might be caused by the data preparation process that was
performed on the record, whereas the removal of frequent tephra layers at intervals of
4 m and 2 m (multiples that may contribute to the 4 m signal) could have generated this
artificial signal. Further, it might have been generated by boundary effects at the
transition from tephra to lacustrine deposits. At these boundaries, parts of the tephra
layers may still be present and the GR would be increased at their vicinity.
The role of compaction
The compaction and associated reduction of sediment thickness need to be taken into
account to estimate the sedimentation rates and perform further calculations. However,
the role of compaction of the Lake Van sediments, which were likely influenced by the
deposition of thick tephra layers, is difficult to determine. The compaction is expected to
differ from “normal” compaction in lake systems, which are controlled by the overburden
pressure of pelagic sedimentation. The deposition of large amounts of tephra (e.g., the >
9 m-thick tephra layer at 120 mblf) had an impact on the compaction of the underlying
Results
67
sediments. Further, large-scale lake level changes and associated changes in water
depth and hydrostatic pressure have probably influenced the compaction as well.
To estimate the effect of compaction of sediments and calculate the original thickness
(decompacted), several parameters are required. Essential are the initial porosity
(surface porosity) and the compaction coefficient (Brunet, 1998), the latter can be
determined by evolution of porosity with increasing depth (Eq. (3.2.1). The porosity
reduction with greater depth depends strongly on sediment characteristics (texture, grain
size, grain shape and sorting (Serra and Serra, 2003)).
Porosity can be achieved by core analysis, e.g. the Archimedean method or by Nuclear
Magnetic Resonance (NMR) or derivated indirectly from other physical properties as
bulk density. The cores from Lake Van were measured before processing (splitting and
sampling) by a Multi Sensor Core Logger (MSCL) to estimate bulk density but the data
was not usable because of poor data quality. In general, the disadvantage of physical
properties from core analysis, are the non in-situ conditions due to relief of pressure,
disturbance during drilling and core handling in particular for unconsolidated sediment
cores. Therefore, no further approaches to estimate density or porosity were made
subsequently.
In-situ porosity can be achieved by downhole logging, either by direct measurements of
neutron porosity or deviated from other parameters, e.g. bulk density. However, the
employment of the density and neutron porosity logging tools from LIAG was not
possible because these radioactive tools were not authorized for import into Turkey.
After Erickson & Jarrard (1998) porosity can be derived from sonic data (vp). However,
because of malfunctions of the sonic tool, vp data could only be recorded partly (section
of 80 m; see Baumgarten et al. (2014)).
Another approach for estimation of compaction would be the use of standard curves
(Athy, 1930; Brunet, 1998) that provide values for, e.g. silts, which could be used as an
approximate for compaction of the lacustrine clayey silts in Lake Van. However, no
compaction curves are available for the tephra layers, which are in Lake Van additionally
heterogeneous and differ strongly in sorting (fine ash to coarse pumice).
The effect of compaction seems not very strong in Lake Van as indicated by: 1)
evaluation of the effect on the physical properties (see “Compaction”) and 2) the section
of vp data (30 – 110 mblf; published in Baumgarten et al. (2014), which has mean values
of 1550 m/s and only a minor trend of increasing velocity with depth (approx. 100 m/s
per 100 m) was observed.
Cyclostratigraphic studies of sediments from Lake Van (Turkey) based on their uranium contents obtained from downhole logging and paleoclimatic implications
68
The correlated orbital cycles (expressed as distinct wavelengths in the spectral analysis)
are expected to be affected by compaction. If the effect of compaction was not
compensated completely by the exponential regression, additional compaction would
have reduced the sediment thickness, the wavelengths in the succession would also
have undergone compression, and the sedimentation rates would be underestimated.
Thus, the calculated sedimentation rates for interval I and II of 22 cm/ka and 33 cm/ka,
respectively, must be considered as minimum values.
(Sub-) Milanković cycles and small-scale fluctuations in the sedimentation rate
After the correlation of several Milanković cycles and the match between the U data and
GIS from NGRIP, which was performed by visual correlation (Fig. 3.2.5) as well as
objective spectral analysis (Fig. 3.2.6), we suggest that a climate signal is present in the
U concentration data. The correlation of higher TOC during interglacial and interstadial
periods (Stockhecke et al., 2014a) suggests the adsorption of U on organic matter and
preservation under anoxic conditions. The current properties of the water column in Lake
Van were investigated by Stockhecke et al. (2012), and the bottom water conditions in
the deep Tatvan Basin (and AR) are characterized as anoxic.
The detection of Milanković cycles in the U data suggests a strong response of these
sediments to glacial vs. interglacial conditions. In addition, the U concentration appears
to react to the higher-frequency interstadials (Dansgaard-Oeschger events; DO), which
suggests strong sensitivity and response of the sedimentary system to changing climate
conditions.
Even though sub-Milanković cycles were detected by visual correlation and spectral
analysis between NGRIP and U for the time period of 13 – 75 ka, no indication of higher-
frequency signals could be determined by the sliding window method (see Fig. 3.2.4).
With the selected window size of 66 m, the first spectrum is allocated at a depth of 33 m
(≡ 38.9 mblf; see “Cyclostratigraphic analysis”). However, a good visual correlation was
determined only for the upper part of the record (< 75 ka / 24.8 m). The lack of higher-
frequency signals in the sliding window plot (Fig. 3.2.4) supports the observation that
these signals are most pronounced in the last 75 ka of the record and that either the
signals are absent in the older part or their energy level is too low to be detected by
spectral analysis.
The potential of a possible climate signal for all spectral components was suggested
Results
69
(see “The role of spectral gamma ray data for cyclostratigraphic studies”), but the Th and
K data do not appear to be suitable for cyclostratigraphic analysis in this case.
The tephra deposits from the area surrounding Lake Van are likely a major source of K,
Th and U-rich particles into the sediments by surface runoff, which could have masked a
(slight) climate signal in the lacustrine sediments. Therefore, we suggest that
background sedimentation of volcanic material overprinted the signal from Th and K.
However, the spectral analysis results indicate that climate signals were recorded by the
U data. The strong mobility of U makes post-depositional relocation likely. Periods of
higher production and preservation of organic matter might therefore be indicated by
higher concentrations of U. Further investigation of the processes of U enrichment
during interglacial/interstadial periods and the apparent lack of climate signals in the Th
and K contents could not be performed with our methods.
A reasonable approach to verify the observed cycles would be to directly compare the
sedimentary record and the spectra. A repeated sediment succession, which is
expressed as a cyclic signal in the spectral analysis, should be evident in the sediments
(e.g., cyclic development of clay or carbonate content). However, the sedimentation
rates calculated from core data and cyclostratigraphic analysis of downhole data are
difficult to compare in the Lake Van sediments. The insufficient core recovery and the
use of core material for destructible methods (e.g., pore water analysis) prevents directly
linking the cores from hole D at AR to the downhole logs. In addition, the cycles are
difficult to detect visually because of the frequent abundance of tephra layers that
intersect the lacustrine facies.
The good agreement between the results from the spectral analysis and the
interpretation of the cores is promising. Thus, we assume that possible discontinuities
(hiatuses, event stratification) in the Lake Van record are of minor significance. As the
data shows, the major signals can be detected and used for cyclostratigraphic studies.
The minor vertical shifts on the time scale, which were identified by visually matching the
NGRIP and the U data, indicate possible fluctuations in the sedimentation rate. Short
term increases or decreases would affect the applied time scale, which is based on an
average sedimentation rate of 33 cm/ka. However, the vertical and thus temporal
resolution of the downhole data itself and the estimated sedimentation rates, which were
calculated using a 66 m-long window (selected by testing), prevent a consideration at
greater levels of detail.
Furthermore, the tephra deposits that are up to tens of meters thick (Baumgarten et al.,
Cyclostratigraphic studies of sediments from Lake Van (Turkey) based on their uranium contents obtained from downhole logging and paleoclimatic implications
70
2014) must have compacted the underlying sediments more than pelagic sedimentation
alone. The detected shifts between the U data and δ18O records might also be due to
non-linear compaction, which could have affected the sediment thickness and therefore
produced shifts in the time scale.
However, even if the compaction was non-linear due to irregular compaction caused by
the settling of tephra on top of the sediments or strong lake-level changes, it appears to
have had little impact on the sediment characteristics because the U record generally
correlates well with the NGRIP.
3.2.6 Conclusions
Are cyclostratigraphic methods still applicable even if the boundary conditions are that
challenging as in the Lake Van record?
Even though the lacustrine facies of Lake Van are intersected by numerous tephra
layers, construction of a 160 m-long synthetic log of only the lacustrine sediments
allowed orbital cycles (eccentricity and obliquity) to be detected by spectral analysis. The
correlated high amplitudes can be used to calculate sedimentation rates and their
evolution from 22 cm/ka in an early stage of Lake Van to 33 cm/ka at approximately
282 ka using the sliding window method. The time span of the sediment record from 0 to
210 mblf was calculated as 587 ka. The good agreement between the results of the
spectral analysis of the U data and the core interpretations supports our hypothesis that
orbital signals can be detected and used for cyclostratigraphic studies.
Additional detection of sub-Milanković cycles by visual correlation between the NGRIP
and U data and objective spectral analysis of both records indicates a strong response
not only to low frequency glacial vs. interglacial climate changes but also to short term
fluctuations (Dansgaard–Oeschger events) during the last glacial period. The role of
compaction appears to be of minor importance for this dataset because several GIS are
well correlated. This is consistent with our results; the compaction can be calculated
using an exponential regression and results in only a slight difference between the
residuals (Ures) and the original data (Uedit).
The sedimentological data from cores and the uranium signals from downhole logging
should be compared in detail for an increased understanding of the sedimentary
processes that generate such climate signals in lacustrine sediments.
71
3.3 Age depth-model of the past 630 ka for
Lake Ohrid (Macedonia/Albania) based on
cyclostratigraphic analysis of downhole
gamma ray data
Baumgarten, H., Wonik, T., Tanner, D.C., Francke, A. Wagner, B., Zanchetta, G.,
Sulpizio, R., Giaccio, B., Nomade, S.
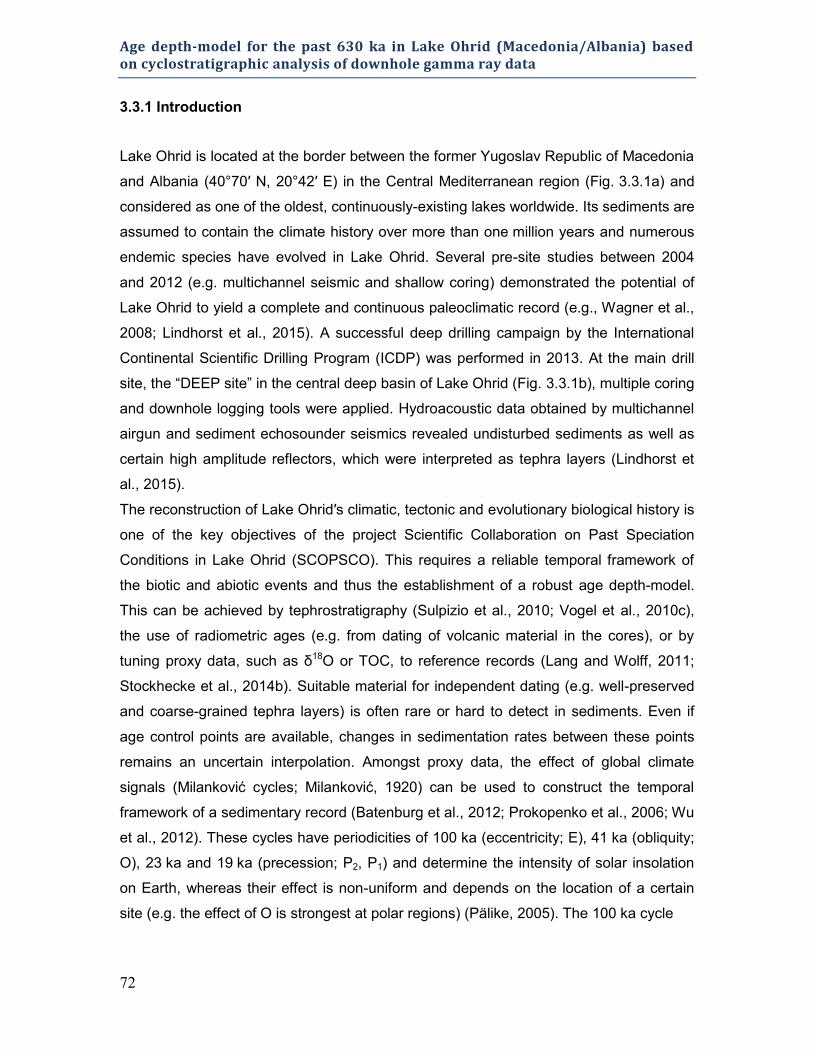
Age depth-model for the past 630 ka in Lake Ohrid (Macedonia/Albania) based on cyclostratigraphic analysis of downhole gamma ray data
72
3.3.1 Introduction
Lake Ohrid is located at the border between the former Yugoslav Republic of Macedonia
and Albania (40°70′ N, 20°42′ E) in the Central Mediterranean region (Fig. 3.3.1a) and
considered as one of the oldest, continuously-existing lakes worldwide. Its sediments are
assumed to contain the climate history over more than one million years and numerous
endemic species have evolved in Lake Ohrid. Several pre-site studies between 2004
and 2012 (e.g. multichannel seismic and shallow coring) demonstrated the potential of
Lake Ohrid to yield a complete and continuous paleoclimatic record (e.g., Wagner et al.,
2008; Lindhorst et al., 2015). A successful deep drilling campaign by the International
Continental Scientific Drilling Program (ICDP) was performed in 2013. At the main drill
site, the “DEEP site” in the central deep basin of Lake Ohrid (Fig. 3.3.1b), multiple coring
and downhole logging tools were applied. Hydroacoustic data obtained by multichannel
airgun and sediment echosounder seismics revealed undisturbed sediments as well as
certain high amplitude reflectors, which were interpreted as tephra layers (Lindhorst et
al., 2015).
The reconstruction of Lake Ohrid′s climatic, tectonic and evolutionary biological history is
one of the key objectives of the project Scientific Collaboration on Past Speciation
Conditions in Lake Ohrid (SCOPSCO). This requires a reliable temporal framework of
the biotic and abiotic events and thus the establishment of a robust age depth-model.
This can be achieved by tephrostratigraphy (Sulpizio et al., 2010; Vogel et al., 2010c),
the use of radiometric ages (e.g. from dating of volcanic material in the cores), or by
tuning proxy data, such as δ18O or TOC, to reference records (Lang and Wolff, 2011;
Stockhecke et al., 2014b). Suitable material for independent dating (e.g. well-preserved
and coarse-grained tephra layers) is often rare or hard to detect in sediments. Even if
age control points are available, changes in sedimentation rates between these points
remains an uncertain interpolation. Amongst proxy data, the effect of global climate
signals (Milanković cycles; Milanković, 1920) can be used to construct the temporal
framework of a sedimentary record (Batenburg et al., 2012; Prokopenko et al., 2006; Wu
et al., 2012). These cycles have periodicities of 100 ka (eccentricity; E), 41 ka (obliquity;
O), 23 ka and 19 ka (precession; P2, P1) and determine the intensity of solar insolation
on Earth, whereas their effect is non-uniform and depends on the location of a certain
site (e.g. the effect of O is strongest at polar regions) (Pälike, 2005). The 100 ka cycle
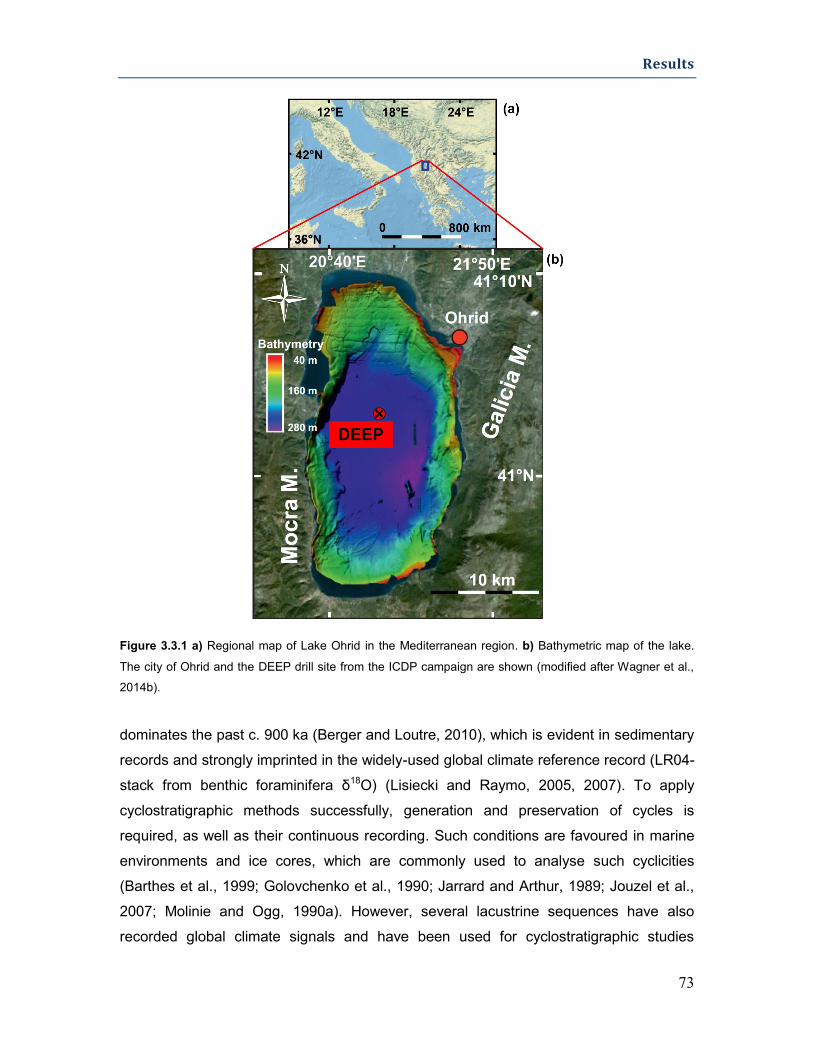
Results
73
Figure 3.3.1 a) Regional map of Lake Ohrid in the Mediterranean region. b) Bathymetric map of the lake.
The city of Ohrid and the DEEP drill site from the ICDP campaign are shown (modified after Wagner et al.,
2014b).
dominates the past c. 900 ka (Berger and Loutre, 2010), which is evident in sedimentary
records and strongly imprinted in the widely-used global climate reference record (LR04-
stack from benthic foraminifera δ18O) (Lisiecki and Raymo, 2005, 2007). To apply
cyclostratigraphic methods successfully, generation and preservation of cycles is
required, as well as their continuous recording. Such conditions are favoured in marine
environments and ice cores, which are commonly used to analyse such cyclicities
(Barthes et al., 1999; Golovchenko et al., 1990; Jarrard and Arthur, 1989; Jouzel et al.,
2007; Molinie and Ogg, 1990a). However, several lacustrine sequences have also
recorded global climate signals and have been used for cyclostratigraphic studies
Age depth-model for the past 630 ka in Lake Ohrid (Macedonia/Albania) based on cyclostratigraphic analysis of downhole gamma ray data
74
(Baumgarten and Wonik, 2014; Bogota-A et al., 2011; Nowaczyk et al., 2013;
Prokopenko et al., 2006). Whereas the majority of studies was performed on proxies
from sediment cores (e.g. δ18O, organic matter or pollen), analysis of physical properties
from downhole logging have also been successful (Barthes et al., 1999; Golovchenko et
al., 1990; Jarrard and Arthur, 1989; Molinie and Ogg, 1990b; Wonik, 2001).
Physical in-situ properties (e.g. seismic velocity or spectral gamma ray) can only be
achieved by downhole logging methods and provide a first data set that is available
within hours after the tools were run in hole. Contrasting physical properties and
therefore changes in sediment characteristics (e.g. sedimentological composition, grain
size) can trigger cyclic changes of the logging data (Baumgarten and Wonik, 2014;
Kashiwaya et al., 1999; Paulissen and Luthi, 2011; Scholz et al., 2011). Such cyclic
changes can potentially be revealed by applying cyclostratigraphic methods. The aim of
this study is the generation of a robust age depth-model down to 240 m below lake floor
(mblf) by an integrated study of downhole data with tephrostratigraphic age control from
the sediment cores. Special emphasis is given to the effect of compaction and its
subsequent impact on estimates of sedimentation rates. Furthermore, the response of
the physical in-situ properties from spectral gamma ray (contents of potassium, thorium
and uranium) and their application as a proxy for changing environmental conditions in
the catchment area is investigated.
3.3.2 Setting and sediment dynamics of Lake Ohrid
Lake Ohrid is located on the Balkan Peninsula at an altitude of 693 m above sea level in
a northwest-trending active tectonic graben. It is considered to have formed within a 1st
stage (Late Miocene) as a pull-apart basin and during a 2nd stage (Pliocene) of
extensional movement (E-W extension) which caused the recent geometry (Lindhorst et
al., 2015). The lake is considered to be the oldest continuously-existing lake in Europe,
as supported by molecular clock analysis that estimate the onset of lake formation to 1.5
to 3 million years (Ma) (Trajanovski et al., 2010; Wagner et al., 2014a). It houses an
extraordinary number of endemic species (>200, e.g. ostracodes) and it is therefore
considered to be a hotspot to study the evolution of the various species (Albrecht and
Wilke, 2008).
Oligotrophic Lake Ohrid has a surface area of 360 km² and a water depth of up to

Results
75
290 m. The water originates mainly from karst inflows (50%), precipitation (25%), and
surface runoff (25%). The karst springs are primarily fed by the “sister lake” Prespa, 150
m higher in elevation (Wagner et al., 2014b). The recent local climate is characterized by
warm dry summers (mean temperature 26°C) and cold winters (-1°C). The annual
precipitation is about 750 mm and winds are prevailing southerly or northerly, which is
topographically controlled by the shape of the lake basin (Vogel et al., 2010a).
Due to its downwind location of most of the Quaternary volcanoes of central-southern
Italy, Lake Ohrid’s sediments can provide a record of the volcanic history of the northern
Mediterranean region (Sulpizio et al., 2010). The catchment area southeast and
northwest of the lake mostly consists of Triassic carbonates and clastics, whereas
ophiolites (nickel, iron and chromium-bearing) are exposed on the western and
southwestern shore (Vogel et al., 2010b).
The sediment dynamics for the past 150 ka have been investigated by up to 15 m long
sediment cores from different marginal parts of the lake basin (e.g. Wagner et al. 2009,
Belmecheri et al., 2009, Vogel et al., 2010a). Two major lithofacies are distinguished: A)
sediments with high detrital clastic with no or very low carbonate content, together with
low total organic matter and few diatoms, and B) sediments with high content of
carbonates, abundant ostracodes, minor amounts of clastics and high contents of
organic matter. Lithofacies A is associated with glacial conditions (Marine Isotope
Stages; MIS 2, 4, 6), high clastic supply and low lake productivity, whereas lithofacies B
formed during interglacial conditions (mainly during MIS 1 and 5), with high lake
productivity and formation of authigenic carbonates. Age control of the last glacial cycle
was obtained by radiocarbon dating and tephrochronology.
3.3.3 Methods and background
Downhole logging data acquisition and processing
The multiple-cored DEEP site has six parallel and overlapping boreholes (A to F), of
which holes A and E only cover the uppermost few meters of the sediment succession.
Each of the deeper holes was drilled with a diameter of 149 mm and water-based mud
was used to clean the holes from cuttings and to stabilize the side walls during the
coring process. Hole C was logged immediately after drilling down to 470 mblf, and
amongst other probes, such as resistivity and borehole televiewer, spectral gamma ray
(SGR) and sonic were used. To prevent the unconsolidated sediments from caving in,

Age depth-model for the past 630 ka in Lake Ohrid (Macedonia/Albania) based on cyclostratigraphic analysis of downhole gamma ray data
76
the SGR probe was run through the drillpipe and a continuous record of the sediments
down to 470 mblf was achieved. The SGR data was acquired using the SGR 70-slimhole
tool of the LIAG, which records the total gamma radiation (GR), as well as the spectral
components (potassium; K, thorium; Th and uranium; U) and their contribution to the
GR. The tool was run with a logging speed of 3 m/min and a sampling rate of 10 cm. The
achievable minimum bed resolution is controlled by the size of the Bismuth germinate
(BGO) crystal (5 x 15 cm) and the characteristics of the target formation (e.g. the
absolute value range and contrast of values between neighbouring beds) (Theys, 1991).
The vertical resolution can be estimated to 15 - 20 cm. The sonic tool, which measures
the seismic velocity (Vp), was applied afterwards at a speed of 4 m/min and a depth
increment of 10 cm. To allow open hole logging by sonic, the drillpipes were
successively pulled upwards until open hole sections of c. 50 m were accessible. The
uppermost 30 mblf were not logged by the sonic tool, because some drillpipes were kept
in hole to allow other probes to enter. The measuring principles are described by Rider
and Kennedy (2011) and the tools are specified in Buecker et al. (2000) and Barrett et
al. (2000). The data was acquired, preprocessed and processed with the software
GeoBase® (Antares, Germany) and WellCAD® (Advanced Logging Technology,
Luxembourg).
Sliding window method
Sedimentary cycles in lake records can be studied by cyclostratigraphic methods for a
potentially orbital driven origin (Lenz et al., 2011; Prokopenko et al., 2001; Weedon,
2003). To investigate wavelengths and amplitudes of the contained signals, fast Fourier
transform (Weedon, 2003) can be applied. The sliding window method (≡ windowed
Fourier transform) (Baumgarten and Wonik, 2014; Molinie and Ogg, 1990b; Torrence
and Compo, 1998; Weedon, 2003) can be applied to identify the distribution of cycles
within a series and their evolution over the dataset: the spectral analysis is calculated for
a depth interval of specific length (window size) and the resulting spectrum is allocated
to the centre of the window. Subsequently, the window is moved downwards by a certain
step size and the analysis is repeated at consecutive depth positions until the window
border reaches the end of the dataset. The results are presented in a three-dimensional
spectrogram with colour-coding of the relative power of the different frequency
components. Generally, a small window size is favourable to maximize the length of the
Results
77
resulting plot. However, the contained cycle needs to be covered and cannot be
determined if the window size was chosen too short, e.g. only half the signal’s
wavelength. The optimal window size is determined by empirical testing. Spectral
analysis for identification of characteristic periodicities (Jenkins and Watts, 1969;
Priestley, 1981) was performed on normalized SGR data using fast Fourier Transform
within MATLAB (MathWorks®).
The detection of cycles by SGR logging is limited by the Nyquist Frequency (twice the
sampling rate) (Molinie and Ogg, 1990a). The temporal resolution can be estimated by
the vertical resolution of the applied tools (minimum bed resolution of the SGR tool of 15
– 20 cm; see “Downhole logging data acquisition and processing”) and the averaged
sedimentation rate. For a mean sedimentation rate of e.g. 38 cm/ka, cycles in the range
of 0.8 to 1.1 ka are resolvable by SGR logging data.
Depth matching of downhole logging and core data
In this study, downhole logging data, in conjunction with age control points from tephra
layers, are used to construct an age depth-model. Therefore, matching of core and
logging depth is required. To provide age control by distinct tephra layers, they need to
be identified in the cores by visual description or by their physical properties, such as
susceptibility from core logging, in contrast to the background sediments. Artifacts in the
coring process as incorrect depth allocation of coring tools or gas extension of
sediments after cores are on deck and pressure release produce erroneous depths.
Furthermore, depth shifts between core and logging depth are generated because the
downhole data originates from one hole (C; down to 470 mblf) and the composite record
(see Francke et al., 2015) is composed of four different holes (see “Downhole logging
data acquisition and processing”) which are tens of metres apart. The depth of a distinct
sediment layer may differ up to 3 to 4 m between these holes. The matching of borehole
logging data and sediment core is described in detail by Francke et al. (2015) and based
on a correlation of K contents from SGR with K intensities from XRF scanning, and using
magnetic susceptibility from downhole logging and from Multi Sensor Core Logging
(MSCL) on sediment cores. Trends and patterns were compared and matched; the
larger features were preferred over correlation of small-scaled features in the data.
Cross correlation was used to prevent systematic depth shifts of these data sets and for
quality control.
Age depth-model for the past 630 ka in Lake Ohrid (Macedonia/Albania) based on cyclostratigraphic analysis of downhole gamma ray data
78
Compaction
To perform cyclostratigraphic studies and to estimate an age depth-relationship
(sedimentation rates), compaction and associated reduction of sediment thickness due
to overburden pressure must be considered. The original (decompacted) thickness of
the sediments can be calculated if the initial (surface) porosity and the compaction
coefficient (Brunet, 1998) can be determined. The amount of porosity decrease with
greater depth depends on sediment properties, such as grain size and sorting (Serra
and Serra, 2003), and can be expressed as:
Eq. (3.3.1)
where the porosity (Φ) at a specific depth (z) is to be estimated; Φ0 is the initial porosity
and c is the compaction coefficient (Athy, 1930; Brunet, 1998).
Porosity can be measured directly on the sediment cores, e.g. by Archimedean
weighing. Whereas the physical properties, in particular from (unconsolidated) sediment
cores are typically disturbed due to drilling, release of pressure, and core handling.
Therefore, measurements by downhole logging are more suitable; in-situ porosity can be
gained by neutron porosity logging or derived e.g. from bulk density. These tools operate
with radioactive methods and the import procedure into foreign countries is usually
extremely complicated and seldom successful. Therefore, the radioactive tools from the
LIAG were not used at Lake Ohrid. However, porosity was derived by an empirical
relationship from sonic data (Vp) (Erickson and Jarrard, 1998), which were recorded
continuously from below 30 mblf. The software 2DMove® (Midland Valley Exploration
Ltd.) was used to decompact the sediments and calculate the original sediment
thickness.
3.3.4 Results
Selection of SGR data
The output curves from SGR were compared to estimate the contribution of the spectral
components to the total gamma ray. GR is mainly controlled by K and Th, which develop
uniformly (R > 0.9). GR and K were used for further investigations. K was chosen over
Th, because it is also available from XRF core scanning and the interpretation can be
reviewed easily.
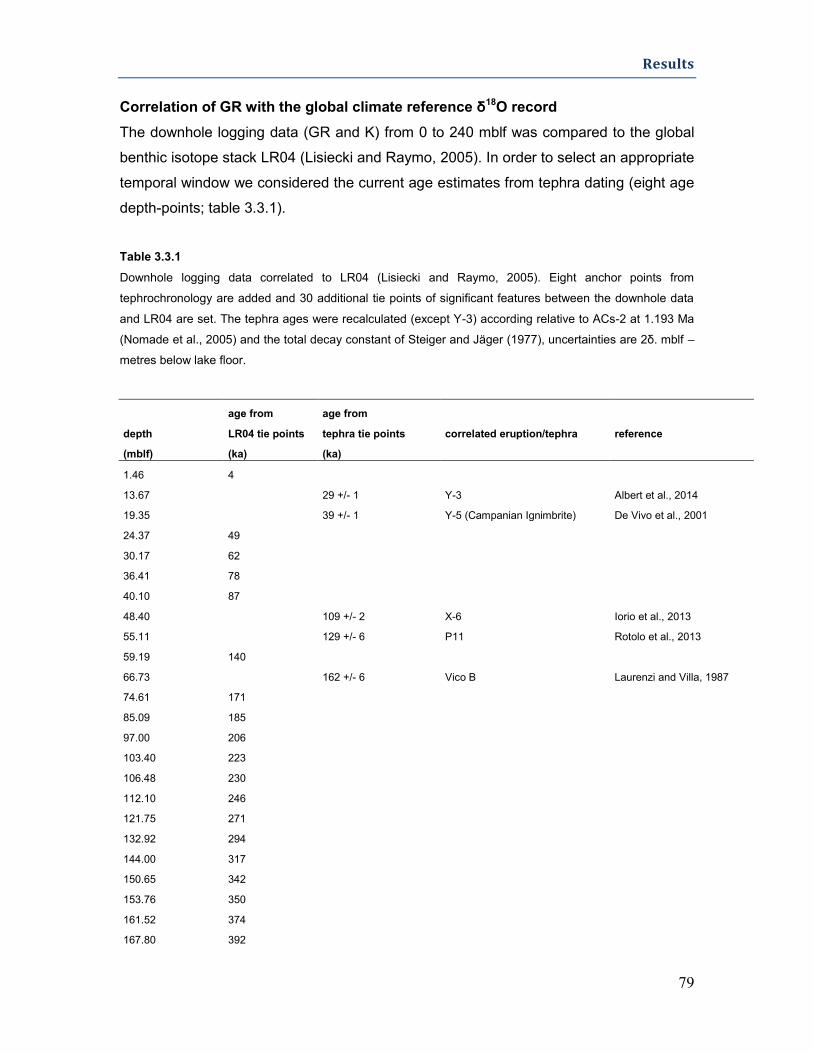
Results
79
Correlation of GR with the global climate reference δ18O record
The downhole logging data (GR and K) from 0 to 240 mblf was compared to the global
benthic isotope stack LR04 (Lisiecki and Raymo, 2005). In order to select an appropriate
temporal window we considered the current age estimates from tephra dating (eight age
depth-points; table 3.3.1).
Table 3.3.1
Downhole logging data correlated to LR04 (Lisiecki and Raymo, 2005). Eight anchor points from
tephrochronology are added and 30 additional tie points of significant features between the downhole data
and LR04 are set. The tephra ages were recalculated (except Y-3) according relative to ACs-2 at 1.193 Ma
(Nomade et al., 2005) and the total decay constant of Steiger and Jäger (1977), uncertainties are 2δ. mblf –
metres below lake floor.
depth
age from
LR04 tie points
age from
tephra tie points correlated eruption/tephra reference
(mblf) (ka) (ka)
1.46 4
13.67
29 +/- 1 Y-3 Albert et al., 2014
19.35
39 +/- 1 Y-5 (Campanian Ignimbrite) De Vivo et al., 2001
24.37 49
30.17 62
36.41 78
40.10 87
48.40
109 +/- 2 X-6 Iorio et al., 2013
55.11
129 +/- 6 P11 Rotolo et al., 2013
59.19 140
66.73
162 +/- 6 Vico B Laurenzi and Villa, 1987
74.61 171
85.09 185
97.00 206
103.40 223
106.48 230
112.10 246
121.75 271
132.92 294
144.00 317
150.65 342
153.76 350
161.52 374
167.80 392
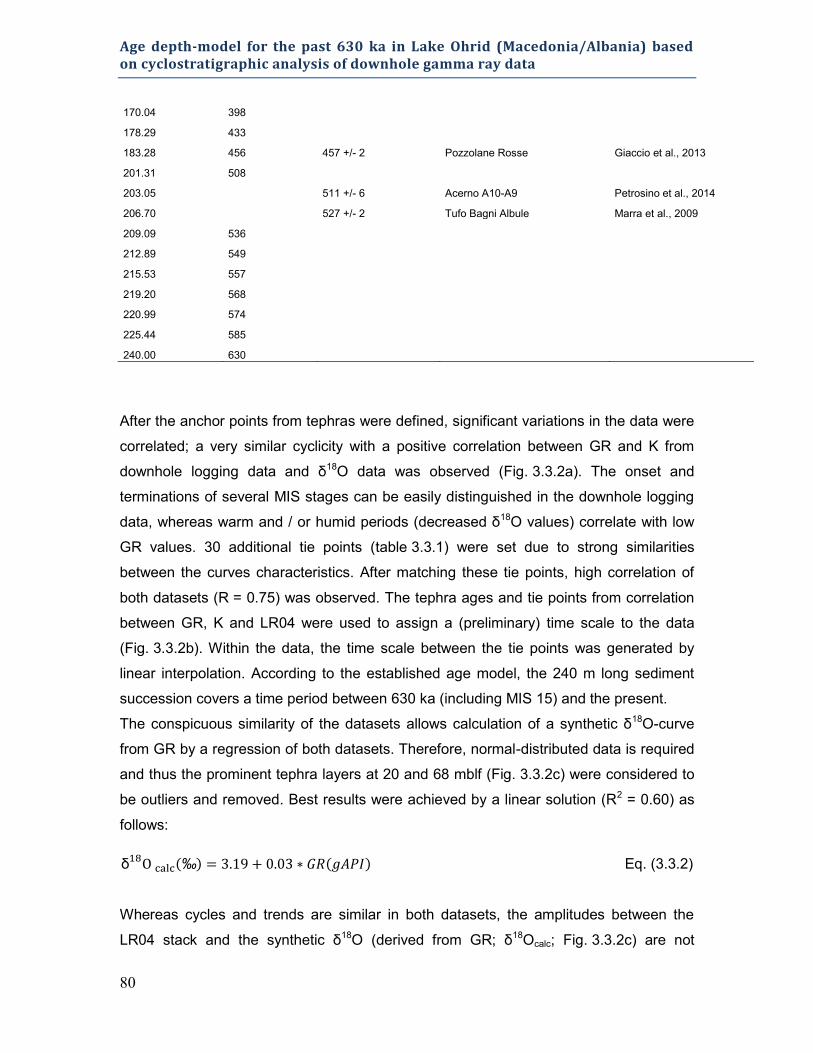
Age depth-model for the past 630 ka in Lake Ohrid (Macedonia/Albania) based on cyclostratigraphic analysis of downhole gamma ray data
80
170.04 398
178.29 433
183.28 456 457 +/- 2 Pozzolane Rosse Giaccio et al., 2013
201.31 508
203.05
511 +/- 6 Acerno A10-A9 Petrosino et al., 2014
206.70
527 +/- 2 Tufo Bagni Albule Marra et al., 2009
209.09 536
212.89 549
215.53 557
219.20 568
220.99 574
225.44 585
240.00 630
After the anchor points from tephras were defined, significant variations in the data were
correlated; a very similar cyclicity with a positive correlation between GR and K from
downhole logging data and δ18O data was observed (Fig. 3.3.2a). The onset and
terminations of several MIS stages can be easily distinguished in the downhole logging
data, whereas warm and / or humid periods (decreased δ18O values) correlate with low
GR values. 30 additional tie points (table 3.3.1) were set due to strong similarities
between the curves characteristics. After matching these tie points, high correlation of
both datasets (R = 0.75) was observed. The tephra ages and tie points from correlation
between GR, K and LR04 were used to assign a (preliminary) time scale to the data
(Fig. 3.3.2b). Within the data, the time scale between the tie points was generated by
linear interpolation. According to the established age model, the 240 m long sediment
succession covers a time period between 630 ka (including MIS 15) and the present.
The conspicuous similarity of the datasets allows calculation of a synthetic δ18O-curve
from GR by a regression of both datasets. Therefore, normal-distributed data is required
and thus the prominent tephra layers at 20 and 68 mblf (Fig. 3.3.2c) were considered to
be outliers and removed. Best results were achieved by a linear solution (R2 = 0.60) as
follows:
δ Eq. (3.3.2)
Whereas cycles and trends are similar in both datasets, the amplitudes between the
LR04 stack and the synthetic δ18O (derived from GR; δ18Ocalc; Fig. 3.3.2c) are not
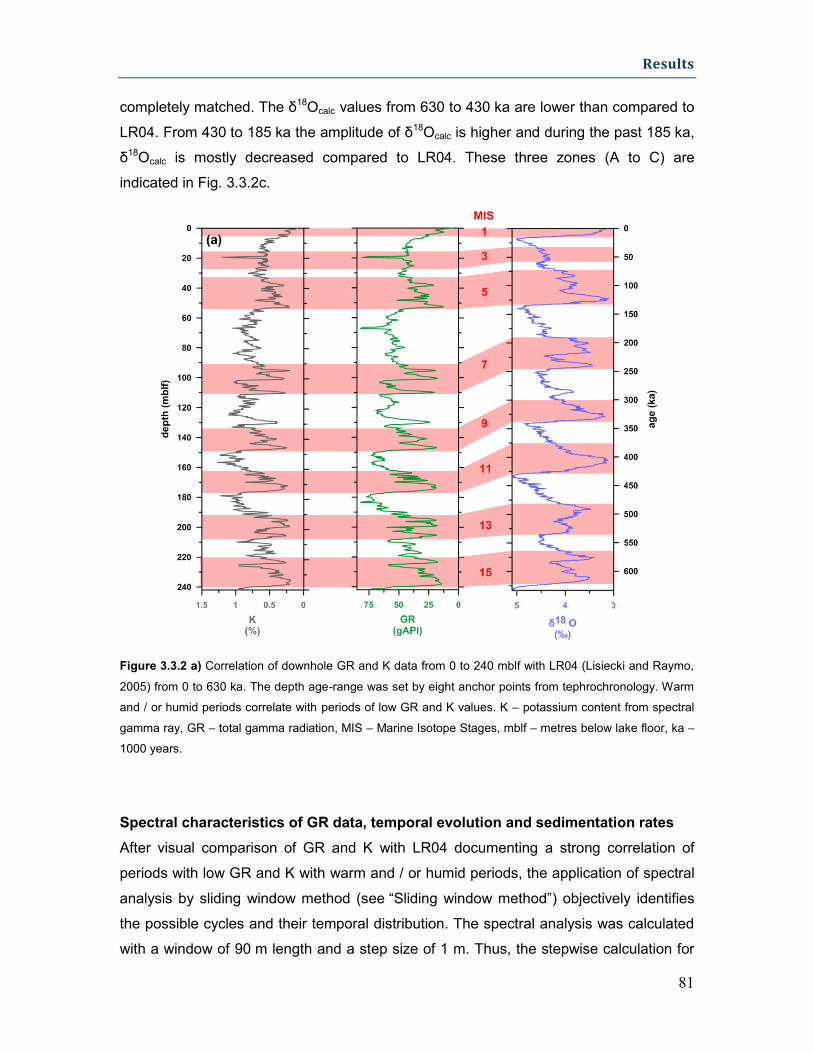
Results
81
completely matched. The δ18Ocalc values from 630 to 430 ka are lower than compared to
LR04. From 430 to 185 ka the amplitude of δ18Ocalc is higher and during the past 185 ka,
δ18Ocalc is mostly decreased compared to LR04. These three zones (A to C) are
indicated in Fig. 3.3.2c.
Figure 3.3.2 a) Correlation of downhole GR and K data from 0 to 240 mblf with LR04 (Lisiecki and Raymo,
2005) from 0 to 630 ka. The depth age-range was set by eight anchor points from tephrochronology. Warm
and / or humid periods correlate with periods of low GR and K values. K – potassium content from spectral
gamma ray, GR – total gamma radiation, MIS – Marine Isotope Stages, mblf – metres below lake floor, ka –
1000 years.
Spectral characteristics of GR data, temporal evolution and sedimentation rates
After visual comparison of GR and K with LR04 documenting a strong correlation of
periods with low GR and K with warm and / or humid periods, the application of spectral
analysis by sliding window method (see “Sliding window method”) objectively identifies
the possible cycles and their temporal distribution. The spectral analysis was calculated
with a window of 90 m length and a step size of 1 m. Thus, the stepwise calculation for
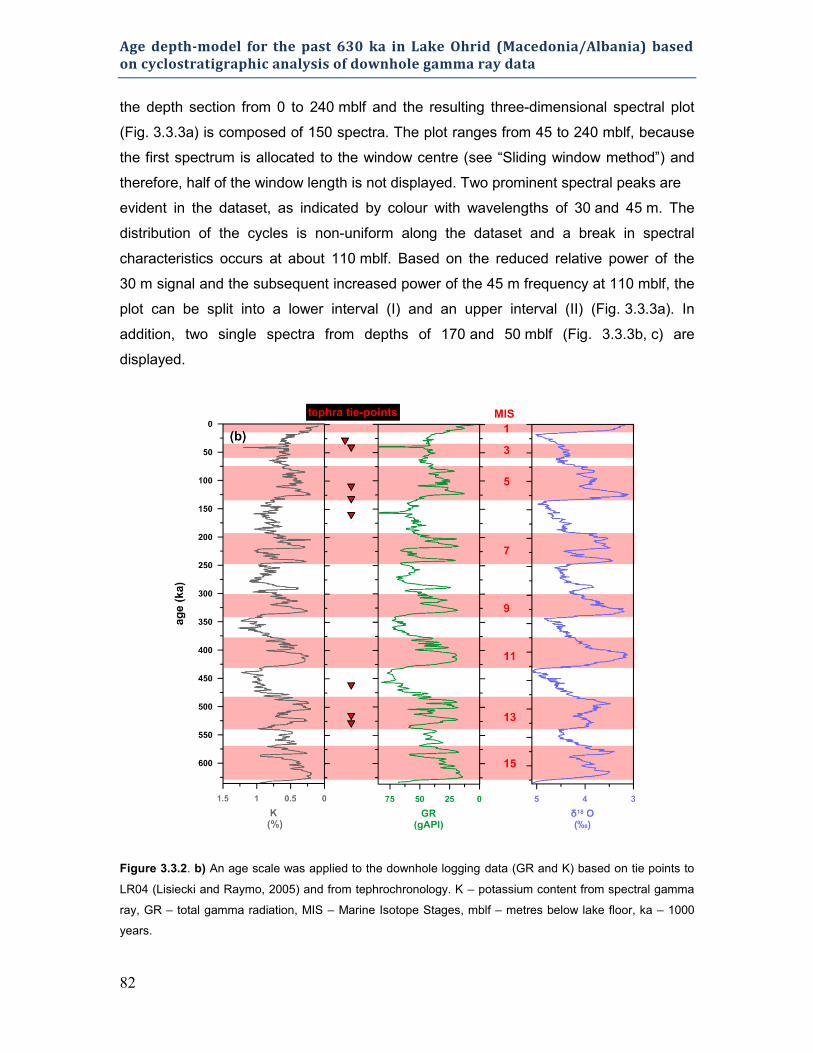
Age depth-model for the past 630 ka in Lake Ohrid (Macedonia/Albania) based on cyclostratigraphic analysis of downhole gamma ray data
82
the depth section from 0 to 240 mblf and the resulting three-dimensional spectral plot
(Fig. 3.3.3a) is composed of 150 spectra. The plot ranges from 45 to 240 mblf, because
the first spectrum is allocated to the window centre (see “Sliding window method”) and
therefore, half of the window length is not displayed. Two prominent spectral peaks are
evident in the dataset, as indicated by colour with wavelengths of 30 and 45 m. The
distribution of the cycles is non-uniform along the dataset and a break in spectral
characteristics occurs at about 110 mblf. Based on the reduced relative power of the
30 m signal and the subsequent increased power of the 45 m frequency at 110 mblf, the
plot can be split into a lower interval (I) and an upper interval (II) (Fig. 3.3.3a). In
addition, two single spectra from depths of 170 and 50 mblf (Fig. 3.3.3b, c) are
displayed.
Figure 3.3.2. b) An age scale was applied to the downhole logging data (GR and K) based on tie points to
LR04 (Lisiecki and Raymo, 2005) and from tephrochronology. K – potassium content from spectral gamma
ray, GR – total gamma radiation, MIS – Marine Isotope Stages, mblf – metres below lake floor, ka – 1000
years.
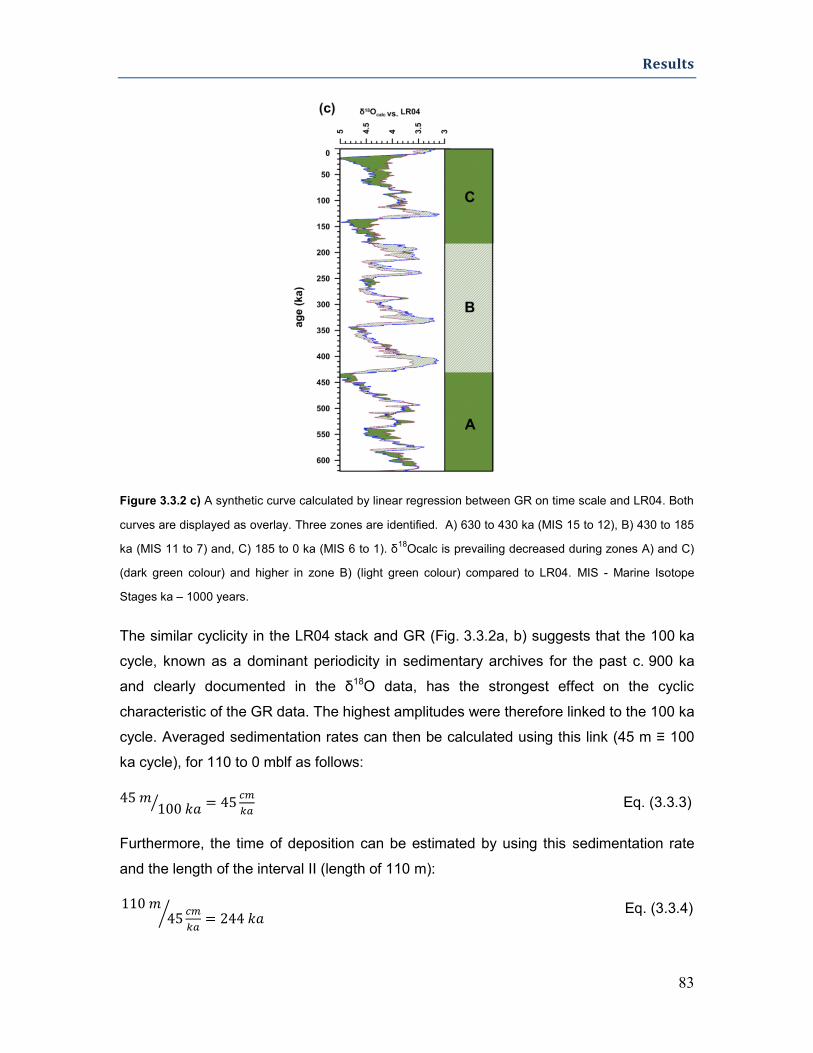
Results
83
Figure 3.3.2 c) A synthetic curve calculated by linear regression between GR on time scale and LR04. Both
curves are displayed as overlay. Three zones are identified. A) 630 to 430 ka (MIS 15 to 12), B) 430 to 185
ka (MIS 11 to 7) and, C) 185 to 0 ka (MIS 6 to 1). δ18
Ocalc is prevailing decreased during zones A) and C)
(dark green colour) and higher in zone B) (light green colour) compared to LR04. MIS - Marine Isotope
Stages ka – 1000 years.
The similar cyclicity in the LR04 stack and GR (Fig. 3.3.2a, b) suggests that the 100 ka
cycle, known as a dominant periodicity in sedimentary archives for the past c. 900 ka
and clearly documented in the δ18O data, has the strongest effect on the cyclic
characteristic of the GR data. The highest amplitudes were therefore linked to the 100 ka
cycle. Averaged sedimentation rates can then be calculated using this link (45 m ≡ 100
ka cycle), for 110 to 0 mblf as follows:
Eq. (3.3.3)
Furthermore, the time of deposition can be estimated by using this sedimentation rate
and the length of the interval II (length of 110 m):
Eq. (3.3.4)
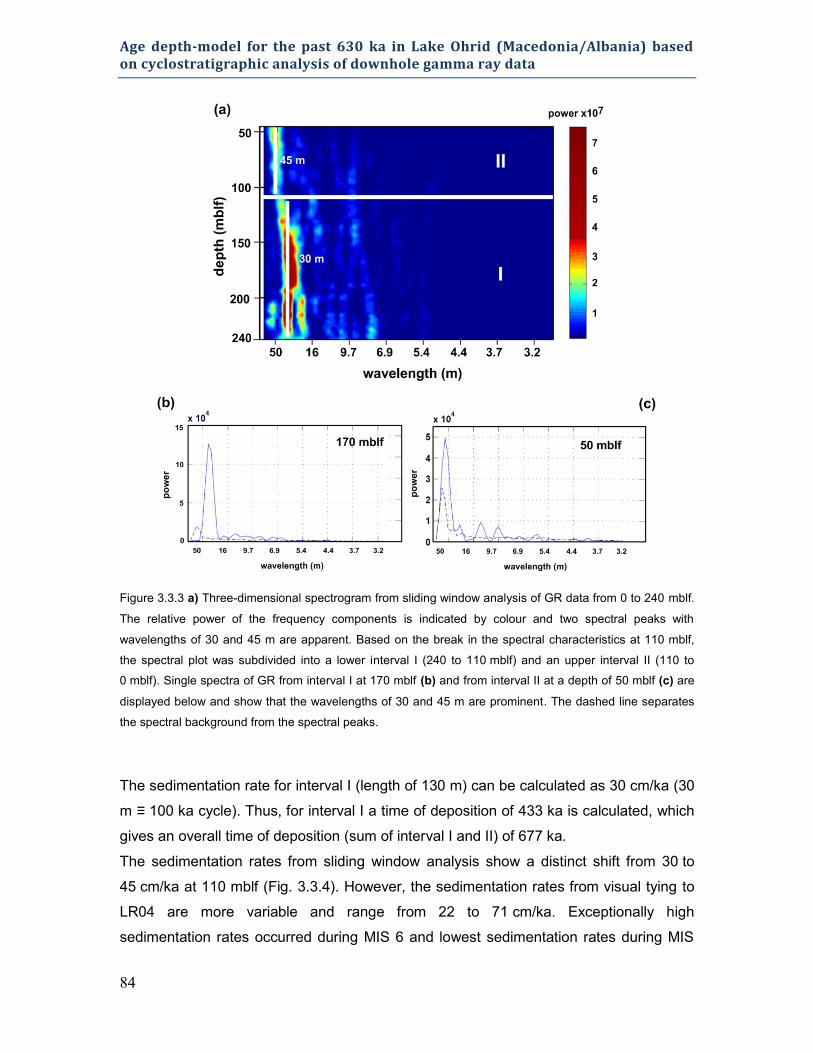
Age depth-model for the past 630 ka in Lake Ohrid (Macedonia/Albania) based on cyclostratigraphic analysis of downhole gamma ray data
84
Figure 3.3.3 a) Three-dimensional spectrogram from sliding window analysis of GR data from 0 to 240 mblf.
The relative power of the frequency components is indicated by colour and two spectral peaks with
wavelengths of 30 and 45 m are apparent. Based on the break in the spectral characteristics at 110 mblf,
the spectral plot was subdivided into a lower interval I (240 to 110 mblf) and an upper interval II (110 to
0 mblf). Single spectra of GR from interval I at 170 mblf (b) and from interval II at a depth of 50 mblf (c) are
displayed below and show that the wavelengths of 30 and 45 m are prominent. The dashed line separates
the spectral background from the spectral peaks.
The sedimentation rate for interval I (length of 130 m) can be calculated as 30 cm/ka (30
m ≡ 100 ka cycle). Thus, for interval I a time of deposition of 433 ka is calculated, which
gives an overall time of deposition (sum of interval I and II) of 677 ka.
The sedimentation rates from sliding window analysis show a distinct shift from 30 to
45 cm/ka at 110 mblf (Fig. 3.3.4). However, the sedimentation rates from visual tying to
LR04 are more variable and range from 22 to 71 cm/ka. Exceptionally high
sedimentation rates occurred during MIS 6 and lowest sedimentation rates during MIS
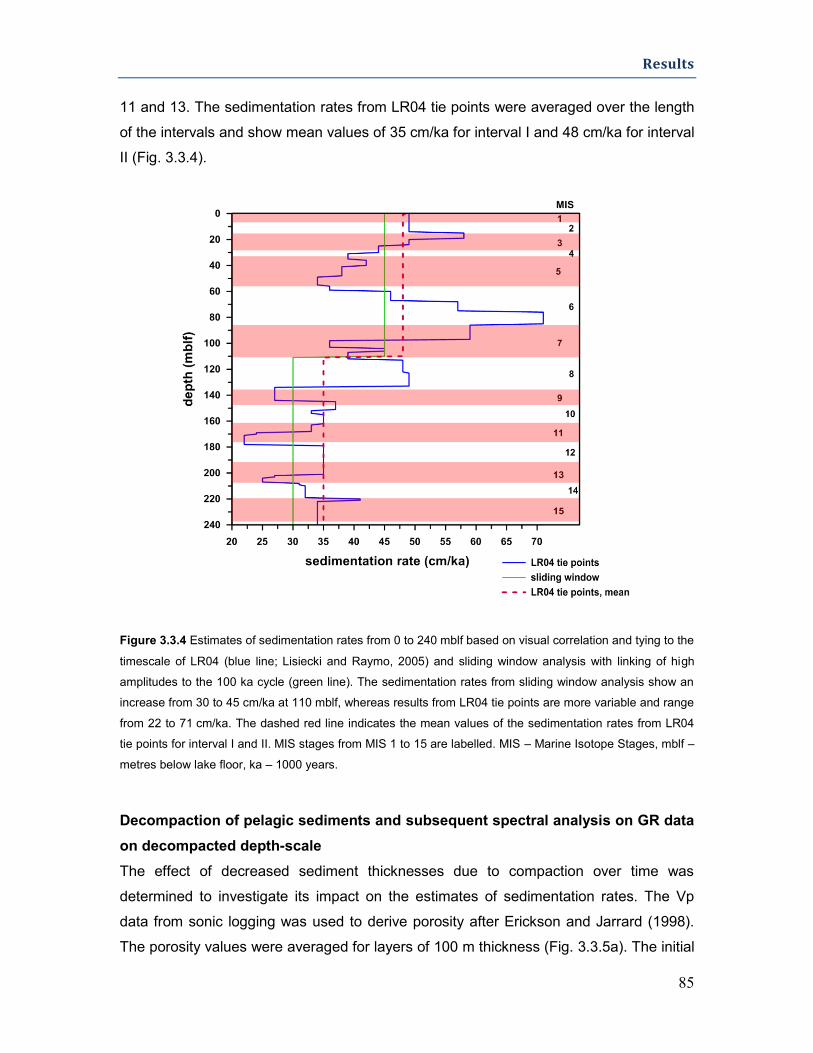
Results
85
11 and 13. The sedimentation rates from LR04 tie points were averaged over the length
of the intervals and show mean values of 35 cm/ka for interval I and 48 cm/ka for interval
II (Fig. 3.3.4).
Figure 3.3.4 Estimates of sedimentation rates from 0 to 240 mblf based on visual correlation and tying to the
timescale of LR04 (blue line; Lisiecki and Raymo, 2005) and sliding window analysis with linking of high
amplitudes to the 100 ka cycle (green line). The sedimentation rates from sliding window analysis show an
increase from 30 to 45 cm/ka at 110 mblf, whereas results from LR04 tie points are more variable and range
from 22 to 71 cm/ka. The dashed red line indicates the mean values of the sedimentation rates from LR04
tie points for interval I and II. MIS stages from MIS 1 to 15 are labelled. MIS – Marine Isotope Stages, mblf –
metres below lake floor, ka – 1000 years.
Decompaction of pelagic sediments and subsequent spectral analysis on GR data
on decompacted depth-scale
The effect of decreased sediment thicknesses due to compaction over time was
determined to investigate its impact on the estimates of sedimentation rates. The Vp
data from sonic logging was used to derive porosity after Erickson and Jarrard (1998).
The porosity values were averaged for layers of 100 m thickness (Fig. 3.3.5a). The initial
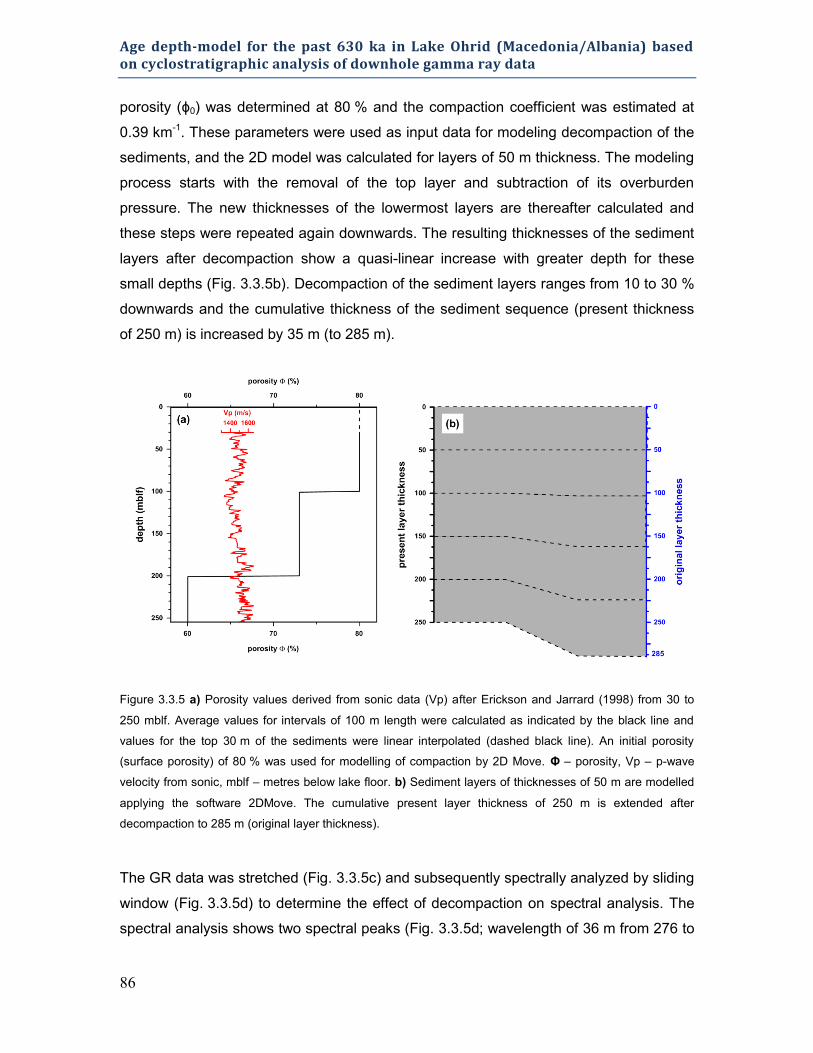
Age depth-model for the past 630 ka in Lake Ohrid (Macedonia/Albania) based on cyclostratigraphic analysis of downhole gamma ray data
86
porosity (ϕ0) was determined at 80 % and the compaction coefficient was estimated at
0.39 km-1. These parameters were used as input data for modeling decompaction of the
sediments, and the 2D model was calculated for layers of 50 m thickness. The modeling
process starts with the removal of the top layer and subtraction of its overburden
pressure. The new thicknesses of the lowermost layers are thereafter calculated and
these steps were repeated again downwards. The resulting thicknesses of the sediment
layers after decompaction show a quasi-linear increase with greater depth for these
small depths (Fig. 3.3.5b). Decompaction of the sediment layers ranges from 10 to 30 %
downwards and the cumulative thickness of the sediment sequence (present thickness
of 250 m) is increased by 35 m (to 285 m).
Figure 3.3.5 a) Porosity values derived from sonic data (Vp) after Erickson and Jarrard (1998) from 30 to
250 mblf. Average values for intervals of 100 m length were calculated as indicated by the black line and
values for the top 30 m of the sediments were linear interpolated (dashed black line). An initial porosity
(surface porosity) of 80 % was used for modelling of compaction by 2D Move. Φ – porosity, Vp – p-wave
velocity from sonic, mblf – metres below lake floor. b) Sediment layers of thicknesses of 50 m are modelled
applying the software 2DMove. The cumulative present layer thickness of 250 m is extended after
decompaction to 285 m (original layer thickness).
The GR data was stretched (Fig. 3.3.5c) and subsequently spectrally analyzed by sliding
window (Fig. 3.3.5d) to determine the effect of decompaction on spectral analysis. The
spectral analysis shows two spectral peaks (Fig. 3.3.5d; wavelength of 36 m from 276 to
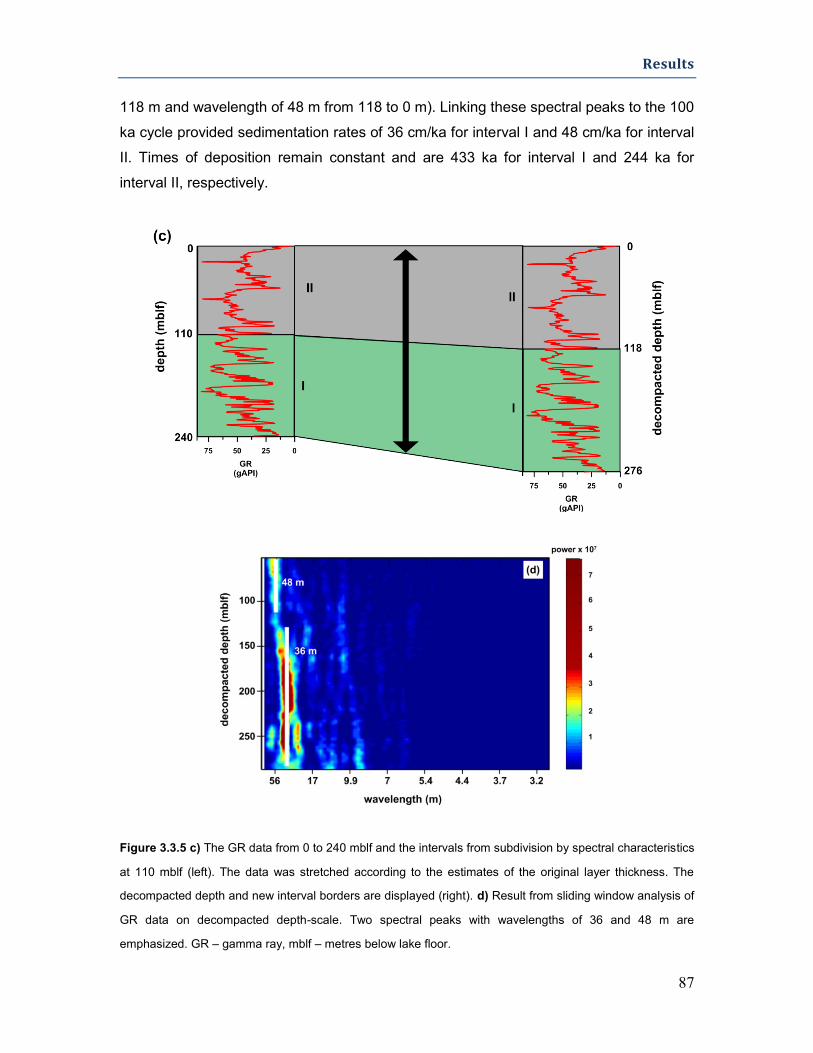
Results
87
118 m and wavelength of 48 m from 118 to 0 m). Linking these spectral peaks to the 100
ka cycle provided sedimentation rates of 36 cm/ka for interval I and 48 cm/ka for interval
II. Times of deposition remain constant and are 433 ka for interval I and 244 ka for
interval II, respectively.
Figure 3.3.5 c) The GR data from 0 to 240 mblf and the intervals from subdivision by spectral characteristics
at 110 mblf (left). The data was stretched according to the estimates of the original layer thickness. The
decompacted depth and new interval borders are displayed (right). d) Result from sliding window analysis of
GR data on decompacted depth-scale. Two spectral peaks with wavelengths of 36 and 48 m are
emphasized. GR – gamma ray, mblf – metres below lake floor.
Age depth-model for the past 630 ka in Lake Ohrid (Macedonia/Albania) based on cyclostratigraphic analysis of downhole gamma ray data
88
3.3.5 Discussion
Climate response of GR over the past 630 ka
The strong correlation of GR and K with LR04 (low GR and K during warm and / or
humid periods, high in cold and / or drier periods) suggest a response of the sedimentary
system to the temperature and hydrological changes related to global ice-volume
fluctuations during the glacial-interglacial cycles. The fluctuations are likely to be
controlled by the input and deposition of clastics (K and Th sources), which are
suggested to have been increased during the past c. 136 ka, when glacial conditions
prevailed (except MIS 1 and 5e) at Lake Ohrid (Vogel et al., 2010a). In particular, the
reduced input of organic matter and calcium carbonate during cold and /or drier periods
seems to amplify the enhanced input of clastic material. During warm and / or humid
periods, carbonate production and preservation is increased (Vogel et al., 2010a). In
combination with higher organic matter flux, the clastic content of the sediments is
reduced and GR and K data are lower. Either the total content of clastics is lower during
warm-humid periods or the amount is decreased relatively (diluted) to carbonates and
organic matter. However, as discussed by Vogel et al. (2010a), less vegetation cover
during cold-drier periods is likely and also suggests increased erosion in the catchment
and subsequent higher input of clastic material. Based on our interpretation, these cyclic
changes from carbonate-rich to clastic-rich sedimentation were constant at least for the
past 630 ka.
Three zones were observed, based on amplitude differences between the synthetic δ18O
curve from GR (δ18Ocalc) and the referenced record: A) 630 to 430 ka (MIS 15 to MIS 12),
B) 430 to 185 ka (MIS 11 to MIS 7) and, C) 185 to 0 ka (MIS 6 to MIS 1). Comparison of
the synthetic δ18Ocalc to LR04 revealed systematically lower values in zones A) and C)
and higher values in zone B). Under the assumption that our data reflects prevailing
climate-driven fluctuations in the sediments, the differences between the δ18Ocalc and
LR04 could indicate deviations from a linear response to global ice-volume fluctuations.
Therefore, the suggested climate signal would not completely be in line with global
climate variations and be more variable even on a glacial-interglacial scale. Furthermore,
local environmental processes, such as variations in the catchment area due to
topographic changes and subsequent supply of clastics, might have additionally affected
the sediment properties. The (few) tephra layers have contributed to the characteristics
of the data as well; and are recognized in the K data which they shaped in addition to
Results
89
climate-dependent deposition of clastics.
Matching of GR and K data with the global climate reference record (LR04) equates the
timing of climate dynamics recorded in the oceans to Lake Ohrid. This means that if the
downhole logging data is tied to this time scale, differences between the response times
of Lake Ohrid and the global climate trend (e.g., lead or lag effects of the onset of
terminations) are lost. However, even if the comparably small system was likely to be
subject to a faster climate response compared to records from the marine realm,
correlation with the global signal and the resulting age depth-model is verified in large
parts (down to 206 mblf) by tephrochronology. Further interpretation of the complete
dataset was postponed to allow integrated investigation of cyclostratigraphic analysis
with age control from cores.
Sedimentation rates: major trends, small-scale fluctuations and the effect of
compaction
The relative power of spectral peaks from the sliding window analysis seems to be
higher in interval I (wavelength of 30 m) in comparison to interval II (wavelength of
45 m). The strength of the signal depends on the number of cycles that are detected by
spectral analysis. The 45 m long cycle can be contained up to 2.4 times in the 110 m
long interval II, whereas the cycle of the 30 m wavelength might be recorded more
frequently (4.3 times) in the 130 m long interval I. This might contribute to the higher
intensity of the 30 m amplitude and thus we cannot interpret a stronger cyclicity for the
lower part.
Based on sliding window analysis the sedimentation rates are constant (30 cm/ka) for a
long period of time (433 ka), apart from a shift to increased rates at about 110 mblf to 45
cm/ka. However, small-scale variations cannot be resolved due to averaging and the
used window of 90 m length. More variable and realistic results are indicated by tying of
GR and K to LR04. The lowest rates (minimum of 22 cm/ka) occur during MIS 13, 11
and 9. Strongly increased sedimentation rates (up to 71 cm/ka) occur during MIS 8 and
in particular during MIS 6. Therefore, a tendency of decreased sedimentation rates
during interglacials and increased rates during glacial periods can be derived. Even if
these fluctuations do not correlate with all MIS, they seem to be largely coupled to
glacial-interglacial dynamics. This trend suggests higher accumulation of clastic-rich
glacial deposits compared to calcium carbonate-rich deposition during interglacials.
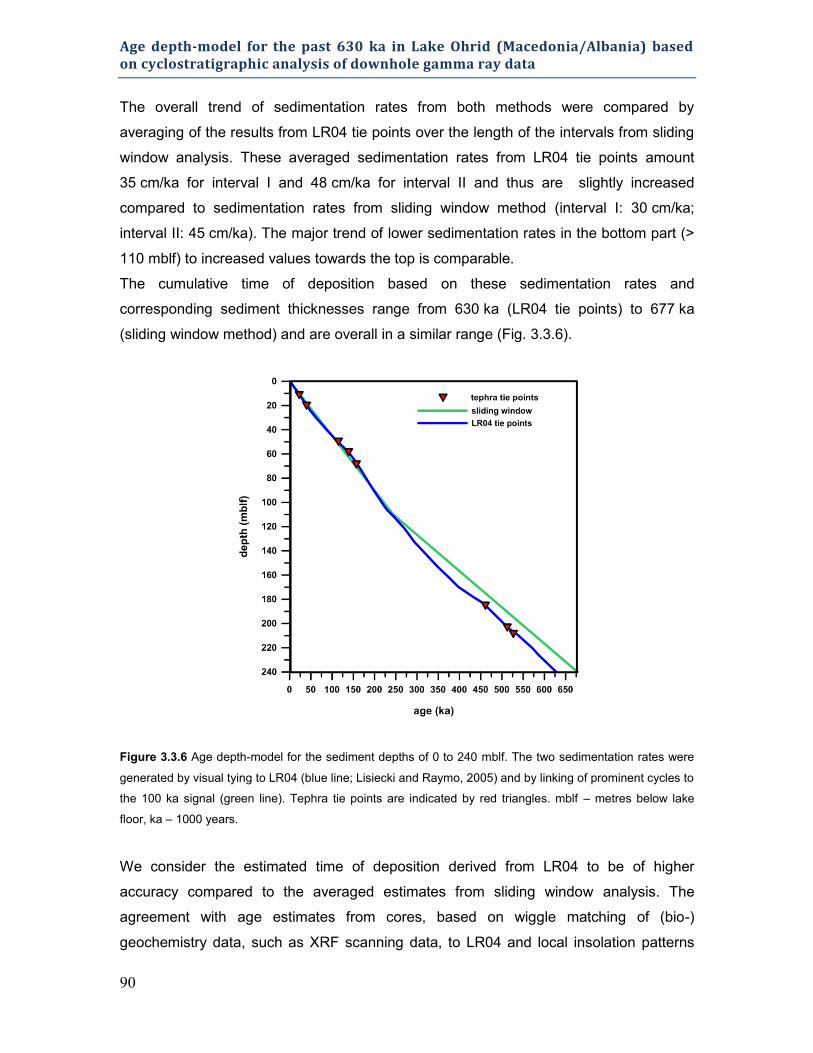
Age depth-model for the past 630 ka in Lake Ohrid (Macedonia/Albania) based on cyclostratigraphic analysis of downhole gamma ray data
90
The overall trend of sedimentation rates from both methods were compared by
averaging of the results from LR04 tie points over the length of the intervals from sliding
window analysis. These averaged sedimentation rates from LR04 tie points amount
35 cm/ka for interval I and 48 cm/ka for interval II and thus are slightly increased
compared to sedimentation rates from sliding window method (interval I: 30 cm/ka;
interval II: 45 cm/ka). The major trend of lower sedimentation rates in the bottom part (>
110 mblf) to increased values towards the top is comparable.
The cumulative time of deposition based on these sedimentation rates and
corresponding sediment thicknesses range from 630 ka (LR04 tie points) to 677 ka
(sliding window method) and are overall in a similar range (Fig. 3.3.6).
Figure 3.3.6 Age depth-model for the sediment depths of 0 to 240 mblf. The two sedimentation rates were
generated by visual tying to LR04 (blue line; Lisiecki and Raymo, 2005) and by linking of prominent cycles to
the 100 ka signal (green line). Tephra tie points are indicated by red triangles. mblf – metres below lake
floor, ka – 1000 years.
We consider the estimated time of deposition derived from LR04 to be of higher
accuracy compared to the averaged estimates from sliding window analysis. The
agreement with age estimates from cores, based on wiggle matching of (bio-)
geochemistry data, such as XRF scanning data, to LR04 and local insolation patterns
Results
91
(Francke et al., 2015), supports the age depth-model. Nonetheless, the sliding window
method is useful to estimate averaged sedimentation rates and to provide
complementary cyclic characteristics of the data. Whereas age control from
tephrochronology is only available down to 206 mblf, our interpretation was extended
down to 240 mblf based on the constant cyclic characteristics.
The required initial porosity for modeling of the effect of compaction was derived from
sonic logging (ϕ0 = 80 %) and is commonly lower (at c. 65 %) for sedimentary basins.
Studies of physical properties of marine sediment cores have shown comparable values
for seafloor deposits (ϕ = 80 %, Vp = 1540 m/s; Kim and Kim, 2001) and even higher
porosity values (> 80 %; Kominz et al., 2011) for unconsolidated sediments. The
compaction coefficient c was estimated at 0.39 km-1 and lies in the range between c
used for sands (0.20 km-1) and carbonates (0.50 km-1) and thus is considered as
reasonable. The overall trend of a quasi-linear evolution of decompaction with increasing
depth was observed, although Eq. (3.3.1) describes an exponential curve, it can be
approximated to be a line over short (< 500 m) lengths. This is in accordance with the
average linear increase of Vp with greater depth. The tephra layers, with only few cm
thicknesses, are considered to have little impact on compaction of these sediments.
Spectral analysis of the GR data on decompacted depth-scale (Fig. 3.3.5 c) revealed
very similar spectral characteristics compared to the sliding window plot of the
compacted data. However, the two spectral peaks (wavelengths of 30 and 45 m) are
shifted to higher wavelengths and increased to wavelengths of 36 m (interval I) and 48 m
(interval II). Therefore, the sedimentation rates are increased accordingly to 36 cm/ka for
interval I and 48 cm/ka for interval II and would be underestimated by 7 to 20 %, if they
are not corrected for the effect of compaction. Underestimation of sedimentation rates
from sliding window method is supported by comparison of results from LR04 tie points;
the latter indicate generally higher sedimentation rates (35 cm/ka; interval I and
48 cm/ka; interval II) and show very good agreement with the estimates of the effect of
compaction.
To determine the time of deposition, two input quantities were used: 1) sedimentation
rates and, 2) the thickness of the sediment layer for which they apply. Due to stretching
of the dataset, the resulting sedimentation rates, as well as the length of the intervals are
increased and thus the time of deposition remains unchanged. Therefore, the effect of
compaction on this calculation is neglectable.

Age depth-model for the past 630 ka in Lake Ohrid (Macedonia/Albania) based on cyclostratigraphic analysis of downhole gamma ray data
92
3.3.6 Conclusions
Can climatic indicators be derived from downhole logging, despite its limited vertical (and
temporal) resolution and can these proxies be used to reconstruct a robust age depth-
model?
The strong response to the global climate signal (LR04) suggests that the K (and Th)
contents reflect a cyclic change of undisturbed and continuous sedimentation.
Conditions were constant over a long period of time and prevailing in balance with the
global climate. To investigate the response of our data to the global climate trend, a
synthetic δ18O-curve was generated that reveals minor deviations compared to LR04.
The deviations could indicate either that the local climatic conditions were not fully in line
with the global climate or, that local processes in the sedimentary system changed over
time.
With two independent attempts, visual tying to the global reference LR04 record as well
as spectral analysis by the sliding window method and linking of high amplitudes to
orbital cycles, a similar result was achieved. To derive sedimentation rates from spectral
analysis, the effect of compaction must be taken into account. Our results show that the
use of the present thicknesses of sediment layers underestimates sedimentation rates
by an average of 14% which needs to be corrected for by decompaction. In conjunction
with tephrochronology from the same core material, a robust age depth-relationship can
be established.
This data set will play a crucial role for other working groups and will complement the
age depth-model from core analysis (Francke et al., 2015). Their combination will
provide the temporal framework, e.g. for refining of the seismo-stratigraphical model by
Lindhorst et al. (2015) and contribute to the reconstruction of Lake Ohrid’s climatic,
tectonic and evolutionary biological history to answer the main research questions of the
SCOPSCO project.
Due to the successful construction of an age depth-model based on the GR and K data
down to 240 mblf, we are optimistic that the complete lacustrine sediment succession
(down to 433 mblf) has high potential for cyclostratigraphic analysis and will provide a
key component to determine Lake Ohrid’s temporal framework.

98
4. Discussion and conclusions
4.1 Key points of Lake Van
4.1.1 Sediment facies of Lake Van and its properties
The sediment properties of Lake Van were investigated to characterize sediments from
different environmental states and to analyze a possible climate signal. However, the
clayey silts have very similar physical properties nonetheless Lake Van experienced
strong environmental changes in temperature and humidity during its period of
existence. The local background noise from excessive deposition of tephra layers in
between the lacustrine facies covered possible different properties in between the
interglacial (warm-wet) vs. glacial (cold-dry) deposits. In particular their great number of
more than 200 layers and their contrasting properties could have masked part of the
climate signal (background sedimentation of fine-grained volcanic particles).
Thus, the identification and removal of the tephra layers was required to decipher the
environmental signal in these sediments. A preliminary step, the reconstruction of the
lithological log by cluster analysis to separate the volcanic deposits from the lacustrine
succession, allowed it to detangle a climate signal from the downhole logging data. In
addition, the volcanic deposits in Lake Van’s sediments were characterized and a
compositional evolution from prevailing basaltic in the bottom part towards dacitic and
rhyolitic/trachytic deposits in the uppermost 127 mblf were observed. These tephra
layers were partly linked to the volcanic sources and the knowledge of their individual
environmental effects could be improved by our results. Tephra deposits at a depth of
120 mblf were characterized by downhole logging data only because no cores were
recovered for this depth section, even though multiple coring was used.
4.1.2 Environmental reconstructions
A synthetic log without event stratification of Lake Van was used to investigate climate
Discussion and conclusions
99
signals in low frequency (orbital scale) and high frequency (millennial scale) ranges. The
uranium data from SGR shows cycles of 100 ka and 41 ka, whereas the former
periodicity is most pronounced. For the past 75 ka, periodicities of 1.5 ka were
determined by matching with the North Greenland δ18O (NGRIP) record (Andersen et al.,
2004). We conclude that, from the acquired downhole logging parameters, Lake Van’s U
data is most sensitive for climate driven changes in sediment composition. Amongst
Milanković cycles, even high frequent oscillations (sub-Milanković cycles) are imprinted
in these sediments. The cycles were used to estimate sedimentation rates and, in
conjunction with radiometric dating (40Ar/39Ar-dating of tephra layers), to determine the
time of deposition of 587 ka. The results agree with the age depth-model from core
analysis; Stockhecke et al. (2014b) estimated that Lake Van’s sediments cover a time
span of 600 ka.
However, Lake Van’s sediments turned out to be unsuitable to construct the compaction
history due to the deposition of numerous thick (range of meters) tephra layers and due
to the lack of porosity estimates. There from, the impact of compaction on our
calculations of sedimentation rates and the time of deposition could not be estimated at
this point.
The occurrence of an over 9 m thick tephra layer at a depth of 120 mblf coincides with a
break in the spectral characteristics and a jump in the sedimentation rates from 22 to 33
cm/ka from bottom to top. Our results suggest that the huge tephra layer (deposited at
about 282 ka ago) has strongly affected the environmental conditions and thus the
sedimentary system of the lake.
4.2 Highlights of Lake Ohrid
4.2.1 Sediment dynamics and climate proxies
Strong cyclicity of a periodicity of 100 ka was revealed by visual comparison of the SGR
data with δ18O values from the global benthic isotope stack LR04 and subsequent
sliding window analysis. These cycles in Lake Ohrid’s sediments are generated by an
alternation of clastic-rich deposits (high K and GR) and carbonate-rich sediments (low K
and GR); the former are interpreted as a result of cold and / or drier climate conditions
100
and the latter as deposited during a warm and / or humid state. Therefore, the glacial-
interglacial dynamic of Lake Ohrid’s sediments is most pronounced in the GR and K
content from downhole logging. The remarkable well correlation to LR04 and strong
cyclicity suggest that undisturbed and continuous sedimentation was preserved and that
these sedimentary conditions were constant over a long period of time.
Sedimentation rates were estimated by the results from sliding window analysis (three-
dimensional spectral plot) and show constant rates of 30 cm/ka from 240 mblf to
110 mblf and increased rates of 45 cm/ka up to the lake floor. Special emphasis was put
on the effect of compaction on these calculations; the compaction of Lake Ohrid could
be estimated by trends of porosity in the sedimentary sequence. The impact on the
calculations of sedimentation rates was afterwards determined as average increase of
14 % and the estimates were corrected accordingly.
The results were compared to sedimentation rates from visual correlation to LR04 which
depict a more complex picture of the sediment accumulation but support the major trend
of increased sedimentation rates towards the lake floor. The investigation of these rates
in detail showed, that the accumulation of clastic-rich deposits during cold-drier
conditions tend to occur at higher sedimentation rates compared to sediments with high
calcium carbonate content during warm-humid conditions.
An age depth-model was constructed from the lake floor to 240 mblf based on analysis
of the K and GR data, together with tephrochronology from cores and the cumulative
time of deposition was estimated at 630 ka.
4.3 Final conclusions
4.3.1 New insights into the environmental past of Lake Van and Lake Ohrid
Climatic reconstructions from deep marine (pelagic) settings or from ice core records are
generally considered most valuable. However, the interpretation of downhole logging
data from Lake Van and Lake Ohrid has revealed important new insights into the
environmental history of these lakes and their associated areas. In this study, the
following aspects of the research questions were answered:
Discussion and conclusions
101
(1) Sediment characteristics of different environmental states
Both lakes have exhibited major climatic and environmental changes in temperature and
humidity during the past c. 600 ka and there from different sedimentary conditions
according to, e.g. input of terrigenous material, volcanic products or calcium carbonate
precipitation.
However, the lacustrine facies of Lake Van could not be differentiated by cluster analysis
on the used data in between glacial (banded and their intercalations) and interglacial
(laminated and their intercalations) deposits. Therefore, the sediments of different
environmental states are not characterized by a certain set of physical and chemical
properties even though a cyclic change of U concentration in between the glacial and the
interglacial deposits (periodicity of 100 ka) were revealed by spectral analysis.
The sediments of Lake Ohrid show alternating stratifications of calcium carbonate-rich
(warm and / or humid periods) and silicilastic-rich (cold and /or drier periods) deposits.
The continuous sedimentation of this simplified, “two-component system” generates
strong contrasts in the physical and chemical properties. Thus, the different
environmental states of Lake Ohrid can be read easily from the used data.
(2) Environmental proxies and their transferability
Climate proxies were derived from downhole logging for both lacustrine records. The U
data has proven most useful for the sediments of Lake Van and K for the Lake Ohrid
record. The simple sedimentary system of Lake Ohrid makes the identification and
analysis of climate proxies much easier compared to the complex and heterogeneous
sediments of Lake Van with its frequent intercalations of tephra layers. Due to the
differences in between the local sedimentary system of both lakes, the most suitable
proxies differ and are not interchangeable from one system to the other.
(3), (4), (5) Cyclostratigraphic analysis and age depth-models
The glacial-interglacial dynamic of a periodicity of 100 ka has played an important role in
the sediments of both lakes and is recorded as sedimentary cycles of different
compositional characteristics in the sediments.
The cycles of Lake Ohrid’s sediments are clearly identifiable in the SGR data and can be
already seen with the bare eye. Even if orbital cycles were observed in other ancient
102
lakes (e.g. Lake Baikal), it was not known up to know that Lake Ohrid’s sediments mirror
the climate dynamic imprinted in marine sediments in such manner. These particular
conditions makes Lake Ohrid an outstanding terrestrial record and the site seems well
suited to build a bridge towards closely located marine archives, e.g. the “Shackleton
site” drilled within IODP (site U1385) at the Iberian margin (Hodell et al., 2013).
The lacustrine sediments of Lake Van are particularly challenging due to environmental
effects (excessive tephra deposition) and intensive preparation was required to reveal
the cyclicity of Lake Van. However, the more complex sedimentary system of Lake Van
has recorded even millennial scale oscillations.
The downhole logging data from both lakes could be used to construct an age depth-
model by cyclostratigraphic analysis and to estimate sedimentation rates.
4.3.2 Potential of logging data for environmental studies
In this study, different physical and chemical in situ properties were analysed. Even if
several parameters have the potential to detect lithological changes and to record
sedimentary cycles, the SGR has proven most useful for environmental studies. Many of
the other parameters, such as RES and Vp, depend strongly on the consolidation /
compaction state of the sediments whereas SGR reflects prevailing changes in the
sediment composition and is less dependent on the sediment texture.
Amongst its sensitivity to lithological changes, another great advantage is the ability to
acquire the data through the drillpipe; therefore it is the only dataset from downhole
logging that was recorded for the complete sediments. The acquisition of all other
parameters reached its limits (drillpipes were kept in the uppermost tens of metres of the
sediments) due to low borehole stability and the associated risk of caving in. There from,
we conclude that SGR has the greatest potential to perform environmental and
cyclostratigraphic studies in lake drilling projects by the use of wireline logging methods.
In general, simple sedimentary systems with few lithological units as well as quiet and
continuous sedimentary conditions seem to be most suitable for these studies.
The depth matching of core and downhole data is an essential element to verify an age
depth-model from cyclostratigraphic analysis of downhole logging data and to evaluate
multi parameter approaches by integration of all available proxies. The availability of SZ
from downhole measurements as well as from core logging makes it of high value for
Discussion and conclusions
103
core-log correlations even though the poor data quality of MSCL from Lake Van has
prevented its use. Furthermore, SZ has contributed to identify tephra layers in the lake
records to construct their temporal framework as well as to the differentiation of volcanic
products in Lake Van’s sediments.
The cluster analysis has proven useful to differentiate lithologies with contrasting
physical and chemical properties, such as the lacustrine facies and the different volcanic
deposits of Lake Van. Here within the use of all data which might contribute to the
lithological characterisation is recommended because lithological changes can be
revealed by several different downhole logging tools (Fig. 1.2.1).
The application of the sliding window method was successfully deployed to analyse the
cyclic characteristic of the data as well as their spatial evolution. Averaged
sedimentation rates and the time of deposition were calculated successful, whereas the
ranges of the results were confirmed by dating methods and comparison to proxies from
cores. However, detailed investigations of minor fluctuations in the sedimentation rates
(extreme highs and lows) are hampered by the associated window size and its averaged
results. Due to the effect of compaction on estimates of sedimentation rates, they need
to be considered as minimum values.
The zoning of datasets into intervals based on the spectral characteristics need to be
interpreted as model-based description; we consider transition zones from the different
sedimentary states as much more likely compared to abrupt changes.
4.4 Perspectives
In this study, the valuable applications and additional benefit of downhole logging data
were demonstrated. These datasets can contribute strongly to important scientific
questions of paleoclimate-focused drilling projects. In conjunction with core analysis, a
complex study of multiple parameters can be achieved to characterize the sediments
and interpret their environmental triggers. Therefore, it shall be regularly included in the
environmental reconstructions of sediments. Here within, the following aspects shall be
taken into account:
1) Depth matching of core and downhole logging data is a critical point to integrate these
datasets. The acquisition of the same / closely related parameters is recommended to
depth match the data, e.g. SZ from downhole logging and MSCL or K from SGR and
104
XRF scanning. Furthermore a common reference depth needs to be assigned to allow
the combined evaluation. The error rate of the depth allocation of cores due to gas
extension, core gaps as well as construction of a composite profile from several different
holes is higher compared to depth from downhole logging and the latter shall be used as
reference depth.
2) The investigation of climate signals from downhole logging data to reconstruct the
environmental past of lake sediments require a detailed study of the nature of the
sediments. The sedimentary response to different climate states shall be analyzed on
cores (e.g. short cores from pre-site studies) to understand and interpret sedimentary
cycles and the associated lithological changes.
3) The interpretation of potential proxy data to construct an age depth-model needs to be
verified by dating methods.
4) The effect of compaction shall be considered and, in particular if compaction plays an
important role, calculations of sedimentation rates need to be corrected thereafter which
requires porosity estimates of the sediments. There from, the acquisition of porosity data
or, if radioactive tools cannot be used, e.g. sonic data to derive porosity values is
essential.
A comparative study of several ancient lakes should be carried out at some point to
summarize the results from former investigations on lake sediments from ICDP
campaigns. However, our investigations on two different ancient lakes have shown that
both are individual cases and the lithological characteristics depend strongly from the
local catchment. Therefore, the environmental interpretation of our data is not
transferable from one lake system to the other and the local differences make an
integrated interpretation and comparison difficult by downhole logging data alone.
In addition the comparison of some projects is not feasible by our methods such as
Laguna Potrok Aike (Zolitschka et al., 2009); virtually no downhole logging data was
acquired due to bad weather conditions. The closely located ICDP project at the Dead
Sea Basin (Dead Sea Deep Drilling Project; Fig. 1.1.1) is difficult to compare to the
records from Lake Van and Lake Ohrid because the deposits cover only about half the
time of deposition (220 to 240 ka; Neugebauer et al., 2014). Furthermore the lacustrine
facies of the hypersaline lake is intersected by huge evaporates; to apply

Discussion and conclusions
105
cyclostratigraphic methods and analyse potential environmental proxies from the
remaining sediments, these evaporates must be removed. However, we strongly
encourage the analysis of the available downhole logging data from several sites to
extend the database and to compare different settings.
The results of this study are limited on tools which operate without radioactive sources
and, thus other tools (e.g. geochemical logging / photo electric effect (PE) log) might be
well suited for environmental studies as well. However, we consider the analyzed
parameters as of highest importance due to the poor future prospects of import of
radioactive tools into foreign countries. Furthermore, no radioactive tools were used in
the past projects for which the interpretation of downhole logging data is overdue.
106
5. References
Aghib, F., Alberti, M., Armienti, P., Askin, R., Atkins, C., Bannister, S., Barrett, P.J., Bohaty, S., Brink,
J., Bryce, S., Buecker, C., Butler, E., Claps, M., Cooper, P., Curren, M., Davey, F., Divine, R.,
Ehrmann, W., Fielding, C., Florindo, F., Grobe, H., Hannah, M., Henrys, S., Jackson, N., Janecek, T.,
Kettler, R., Kopsch, C., Krissek, L., Lavelle, M., McLeod, B., van der Meer, J., Naish, T., Niessen, F.,
Passchier, S., Paulsen, T., Plankell, E., Polozek, K., Powell, R., Pyne, A., Rafat, G., Raine, I., Roberts,
A., Sagnotti, L., Sandroni, S., Scherer, R., Scholz, E., Simes, J., Smellie, J., Strong, P., Tabecki, M.,
Talarico, F., Taviani, M., Thomson, M., Trummel, E., Verosub, K., Villa, G., Watkins, D., Webb, P.,
Wilson, G., Wilson, G., Wilson, T., Wonik, T., Woolfe, K., 1999. Studies from the Cape Roberts
Project; initial report on CRP-2/2A, Ross Sea, Antarctica. Universita di Siena. Dipartimento di Scienze
della Terra: Siena, Italy.
Akcar, N., Schlüchter, C., 2005. Paleoglaciations in Anatolia: A Schematic Review and First Results.
Eiszeitalter und Gegenwart 55, 102-121.
Albert, P.G., Hardiman, M., Keller, J., Tomlinson, E.L., Smith, V.C., Bourne, A.J., Wulf, S., Zanchetta,
G., Sulpizio, R., Müller, U.C., Pross, J., Ottolini, L., Matthews, I.P., Blockley, S.P.E., Menzies, M.A.,
2014. Revisiting the Y-3 tephrostratigraphic marker: a new diagnostic glass geochemistry, age
estimate, and details on its climatostratigraphical context. Quaternary Science Reviews, in press
10.1016/j.quascirev.2014.04.002.
Albrecht, C., Wilke, T., 2008. Ancient Lake Ohrid: Biodiversity and evolution. Hydrobiologia 615, 103-
140.
Alley, R.B., Anandakrishnan, S., Jung, P., 2001. Stochastic resonance in the North Atlantic.
Paleoceanography 16, 190-198.
Andersen, K.K., Azuma, N., Barnola, J.M., Bigler, M., Biscaye, P., Caillon, N., Chappellaz, J., Clausen,
H.B., Dahl-Jensen, D., Fischer, H., Flueckiger, J., Fritzsche, D., Fujii, Y., Goto-Azuma, K., Gronvold,
K., Gundestrup, N.S., Hansson, M., Huber, C., Hvidberg, C.S., Johnsen, S.J., Jonsell, U., Jouzel, J.,
Kipfstuhl, S., Landais, A., Leuenberger, M., Lorrain, R., Masson-Delmotte, V., Miller, H., Motoyama,
H., Narita, H., Popp, T., Rasmussen, S.O., Raynaud, D., Roethlisberger, R., Ruth, U., Samyn, D.,
Schwander, J., Shoji, H., Siggaard-Andersen, M.L., Steffensen, J.P., Stocker, T., Sveinbjornsdottir,
A.E., Svensson, A., Takata, M., Tison, J.L., Thorsteinsson, T., Watanabe, O., Wilhelms, F., White,
J.W.C., 2004. High-resolution record of Northern Hemisphere climate extending into the last
interglacial period. Nature 431, 147-151.
Athy, L.F., 1930. Density, porosity, and compaction of sedimentary rocks. Bulletin of American
Association of Petroleum Geologists 14, 1, 1-24.
Backhaus, K., Erichson, B., Plinke, W., Weiber, R., 2008. Multivariate Analysemethoden; eine
anwendungsorientierte Einführung. Springer: Berlin u.a., Germany.
Barrett, P.J., Sarti, M., Wise, S., 2000. Studies from the Cape Roberts Project Ross Sea, Antarctica
Initial Report on CRP-3. Terra Antartica 7, 19-56.
Barthes, V., Pozzi, J.P., Vibert-Charbonnel, P., Thibal, J., Melieres, M.A., 1999. High-resolution
chronostratigraphy from downhole susceptibility logging tuned by palaeoclimatic orbital frequencies.
Earth and Planetary Science Letters 165, 97-116.
References
107
Batenburg, S.J., Sprovieri, M., Gale, A.S., Hilgen, F.J., Hüsing, S., Laskar, J., Liebrand, D., Lirer, F.,
Orue-Etxebarria, X., Pelosi, N., Smit, J., 2012. Cyclostratigraphy and astronomical tuning of the Late
Maastrichtian at Zumaia (Basque country, Northern Spain). Earth and Planetary Science Letters 359–
360, 264-278.
Baumgarten, H., Wonik, T., 2014. Cyclostratigraphic studies of sediments from Lake Van (Turkey)
based on their uranium contents obtained from downhole logging and paleoclimatic implications.
International Journal of Earth Sciences, 1-16.
Baumgarten, H., Wonik, T., Kwiecien, O., 2014. Facies characterization based on physical properties
from downhole logging for the sediment record of Lake Van, Turkey. Quaternary Science Reviews
104, 85-96.
Belmecheri, S., von Grafenstein, U., Namiotko, T., Robert, C.M., Andersen, N., Danielopol, D.L.,
Caron, B., Bordon, A., Regnier, D., Mazaud, A., Sulpizio, R., Zanchetta, G., Grenier, C., Tiercelin, J.J.,
Fouache, E., Lezine, A.M., 2009. Potential of Lake Ohrid for long palaeoclimatic and
palaeoenvironmental records; the last glacial-interglacial cycle (140 ka). Eos, Transactions, American
Geophysical Union 90, @AbstractPP14A-03.
Berger, A., Loutre, M.F., 2010. Modeling the 100-kyr glacial-interglacial cycles. Global and Planetary
Change 72, 275-281.
Bogota-A, R.G., Groot, M.H.M., Hooghiemstra, H., Lourens, L.J., van der Linden, M., Berrio, J.C.,
2011. Rapid climate change from north Andean Lake Fuquene pollen records driven by obliquity;
implications for a basin-wide biostratigraphic zonation for the last 284 ka. Quaternary Science Reviews
30, 3321-3337.
Brunet, M.-F., 1998. Method of quantitative study of subsidence. Oxford & IBH Publishing Company
Pvt.: New Delhi, India, 79-88.
Buecker, C.J., Jarrard, R.D., Wonik, T., Brink, J.D., 2000. Analysis of downhole logging data from
CRP-2/2A, Victoria Land Basin, Antarctica; a multivariate statistical approach. Terra Antartica 7, 299-
310.
Butler, R.F., 1992. Paleomagnetism: Magnetic Domains to Geological Terranes. Blackwell Scientific,
Boston, United States.
Chavaillaz, Y., Codron, F., Kageyama, M., 2013. Southern westerlies in LGM and future (RCP4.5)
climates. Climate of the Past 9, 517-524.
Cox, K.G., Bell, J.D., Pankhurst, R.J., 1979. The interpretation of igneous rocks. George Allen &
Unwin: London, United Kingdom.
Cukur, D., Krastel, S., Demirel-Schlueter, F., Demirbag, E., Imren, C., Niessen, F., Toker, M., 2013.
Sedimentary evolution of Lake Van (eastern Turkey) reconstructed from high-resolution seismic
investigations. International Journal of Earth Sciences 102, 571-585.
Dansgaard, W., Johnsen, S.J., Clausen, H.B., Dahl-Jensen, D., Gundestrup, N.S., Hammer, C.U.,
Hvidberg, C.S., Steffensen, J.P., Sveinbjornsdottir, A.E., Jouzel, J., Bond, G., 1993. Evidence for
general instability of past climate from a 250-kyr ice-core record. Nature 364, 218-220.
108
Davis, J.C., 1986. Statistics and Data Analysis in Geology. John Wiley & Sons, United States.
Degens, E.T., Wong, H.K., Kempe, S., Kurtman, F., 1984. A geological study of Lake Van, eastern
Turkey. International Journal of Earth Sciences 73, 701-734.
Delius, H., 2000. Charakterisierung und Bilanzierung vulkanischer Sedimente im Schuttfaecher Gran
Canarias mit Hilfe petrophysikalischer Bohrloch- und Kernmessungen, Germany, Ph.D. thesis.
De Vivo, B., Rolandi, G., Gans, P.B., Calvert, A., Bohrson, W.A., Spera, F.J., Belkin, H.E., 2001. New
constraints on the pyroclastic eruptive history of the Campanian volcanic Plain (Italy). Min. Pet. 73, 47-
65.
Erickson, S.N., Jarrard, R.D., 1998. Velocity-porosity relationships for water-saturated siliciclastic
sediments. Journal of Geophysical Research 30,385 - 30,406.
Francke, A., Wagner, B., Sulpizio, R., Zanchetta, G., Leicher, N., Gromig, R., Krastel, S., Lindhorst, K.,
Wilke, T., SCOPSCO science team, 2014. Initial geochemistry data of the Lake Ohrid (Macedonia,
Albania) “DEEP” site sediment record: The ICDP SCOPSCO drilling project. Abstract PP31A-1117
presented at 2014 Fall Meeting, AGU, San Francisco, Calif., 15-19 Dec.
Francke, A., Wagner, B., Leicher, N., Gromig, R., Just, J., Vogel, H., Baumgarten, H., Lacey, J.,
Zanchetta, G., Sulpizio, R., Giacco, B., Wonik, T., Leng, M., under review. Sedimentological processes
and environmental variability at Lake Ohrid (Macedonia, Albania) between 640 ka and modern days.
Biogeosciences.
Fricke, S., Schoen, J., 1999. Praktische Bohrlochgeophysik; 31 Tabellen. Enke: Stuttgart u.a.,
Germany.
Giaccio, B., Arienzo, I., Sottili, G., Castorina, F., Gaeta, M., Nomade, S., Galli, P., Messina, P., 2013.
Isotopic (Sr-Nd) and major element fingerprinting of distal tephras: an application to the Middle-Late
Pleistocene markers from the Colli Albani volcano, central Italy. Quaternary Science Reviews 67, 190-
206.
Golovchenko, X., O'Connell, S.B., Jarrard, R.D., 1990. Sedimentary response to paleoclimate from
downhole logs at Site 693, Antarctic continental margin. Proceedings of the Ocean Drilling Program,
Scientific Results 113, 239-251.
Grabowski, J., Schnyder, J., Sobien, K., Koptikova, L., Krzeminski, L., Pszczolkowski, A., Hejnar, J.,
Schnabl, P., 2013. Magnetic susceptibility and spectral gamma logs in the Tithonian-Berriasian pelagic
carbonates in the Tatra Mts (Western Carpathians, Poland); palaeoenvironmental changes at the
Jurassic/Cretaceous boundary. Cretaceous Research 43, 1-17.
Hodell, D.A., Lourens, L., Stow, D.A.V., Hernández-Molina, J., Alvarez Zarikian, C.A., the Shackleton
Site Project, M., 2013. The "Shackleton Site" (IODP Site U1385) on the Iberian Margin. Scientific
Drilling 16, 13-19.
Iorio, M., Liddicoat, J., Budillon, F., Incoronato, A., Coe, R.S., Donatella, D., Insinga, D., Cassata, W.,
Lubritto, C., Angelino, A., Tamburrino, S., 2013. Combined palaeomagnetic secular variation and
petrophysical records to time constrain geological and hazardous events: an example from the eastern
Tyrrhenian Sea over the last 120 ka. Global and Planetary Changes 113, 91-109.
Jarrard, R.D., Arthur, M.A., 1989. Milankovitch paleoceanographic cycles in geophysical logs from
ODP Leg 105, Labrador Sea and Baffin Bay. Proceedings of the Ocean Drilling Program, Scientific
Results 105, 757-772.
References
109
Jenkins, G.M., Watts, D.G., 1969. Spectral analysis and its applications. San Francisco: Holden Day,
San Francisco, United States.
Jouzel, J., Masson-Delmotte, V., Cattani, O., Dreyfus, G., Falourd, S., Hoffmann, G., Minster, B.,
Nouet, J., Barnola, J.M., Chappellaz, J., Fischer, H., Gallet, J.C., Johnsen, S., Leuenberger, M.,
Loulergue, L., Luethi, D., Oerter, H., Parrenin, F., Raisbeck, G., Raynaud, D., Schilt, A., Schwander,
J., Selmo, E., Souchez, R., Spahni, R., Stauffer, B., Steffensen, J.P., Stenni, B., Stocker, T.F., Tison,
J.L., Werner, M., Wolff, E.W., 2007. Orbital and Millennial Antarctic Climate Variability over the Past
800,000 Years. Science 317, 793-796.
Kashiwaya, K., Ryugo, M., Horii, M., Sakai, H., Nakamura, T., Kawai, T., 1999. Climato-limnological
signals during the past 260,000 years in physical properties of bottom sediments from Lake Baikal.
Journal of Paleolimnology 21, 143-150.
Kashiwaya, K., Ochiai, S., Sumino, G., Tsukamoto, T., Szyniszewska, A., Yamamoto, M., Sakaguchi,
A., Hasebe, N., Sakai, H., Watanabe, T., Kawai, T., 2010. Climato-hydrological fluctuations printed in
long lacustrine records in Lake Hovsgol, Mongolia. Quaternary International 219, 178-187.
Keskin, M., 2003. Magma generation by slab steepening and breakoff beneath a subduction-accretion
complex; an alternative model for collision-related volcanism in eastern Anatolia, Turkey. Geophysical
Research Letters 30, 24, 9-1 – 9-4.
Keskin, M., 2005. Domal uplift and volcanism in a collision zone without a mantle plume: Evidence
from Eastern Anatolia. www.MantlePlumes.org, accessed Jan 30 2013.
Kim, G.Y., Kim, D.C., 2001. Comparison and correlation of physical properties from the plain and
slope sediments in the Ulleung Basin, East Sea (Sea of Japan). Journal of Asian Earth Sciences 19,
669-681.
Kominz, M.A., Patterson, K., Odette, D., 2011. Lithology dependence of porosity in slope and deep
marine sediments. Journal of Sedimentary Research 81, 730-742.
Lamont-Doherty Earth Observatory Borehole Research Group, 2001. ODP Logging Services
Electronic Manual, Version 2.0 [Online], accessed Feb 10 2014.
Landmann, G., Reimer, A., Kempe, S., 1996. Climatically induced lake level changes at Lake Van,
Turkey, during the Pleistocene-Holocene transition. Global Biogeochemical Cycles 10, 797-808.
Lang, N., Wolff, E.W., 2011. Interglacial and glacial variability from the last 800 ka in marine, ice and
terrestrial archives. Climate of the Past 7, 361-380.
Laurenzi, M.A., Villa, I.M., 1987. 40
Ar/39
Ar chronostratigraphy of Vico ignimbrites. Periodico di
Mineralogia, 56, 285 – 293.
Le Bas, M.J., Le Maitre, R.W., Streckeisen, A., Zanettin, B.A., 1986. Chemical classification of
volcanic rocks based on the total alkali-silica diagram. Journal of Petrology 27, 745-750.
Lehmann, K., 2010. Environmental corrections to gamma-ray log data: Strategies for geophysical
logging with geological and technical drilling. Journal of Applied Geophysics 70, 17-26.
110
Lenz, O.K., Wilde, V., Riegel, W., 2011. Short-term fluctuations in vegetation and phytoplankton during
the middle Eocene greenhouse climate; a 640-kyr record from the Messel oil shale (Germany).
International Journal of Earth Sciences, 1851-1874.
Lezine, A.-M., von Grafenstein, U., Andersen, N., Belmecheri, S., Bordon, A., Caron, B., Cazet, J.P.,
Erlenkeuser, H., Fouache, E., Grenier, C., Huntsman-Mapila, P., Hureau-Mazaudier, D., Manelli, D.,
Mazaud, A., Robert, C., Sulpizio, R., Tiercelin, J.J., Zanchetta, G., Zeqollari, Z., 2010. Lake Ohrid,
Albania, provides an exceptional multi-proxy record of environmental changes during the last glacial-
interglacial cycle. Palaeogeography, Palaeoclimatology, Palaeoecology 287, 116-127.
Lindhorst, K., Vogel, H., Krastel-Gudegast, S., Wagner, B., Hilgers, A., Zander, A., Schwenk, T.,
Wessels, M., Daut, G., 2010. Stratigraphic analysis of lake level fluctuations in Lake Ohrid; an
integration of high resolution hydro-acoustic data and sediment cores. Biogeosciences 7, 3531-3548.
Lindhorst, K., Krastel, S., Reicherter, K., Stipp, M., Wagner, B., Schwenk, T., 2015. Sedimentary and
tectonic evolution of Lake Ohrid (Macedonia/Albania). Basin Research 27, 84-101.
Lisiecki, L.E., Raymo, M.E., 2005. A Pliocene-Pleistocene stack of 57 globally disturbed benthic δ18O
records. Paleoceanography 20, PA1003.
Lisiecki, L.E., Raymo, M.E., 2007. Plio-Pleistocene climate evolution; trends and transitions in glacial
cycle dynamics. Quaternary Science Reviews 26, 56-69.
Litt, T., Krastel, S., Sturm, M., Kipfer, R., Orcen, S., Heumann, G., Franz, S.O., Ulgen, U.B., Niessen,
F., 2009. 'PALEOVAN', International Continental Scientific Drilling Program (ICDP); site survey results
and perspectives. Quaternary Science Reviews 28, 1555-1567.
Litt, T., Anselmetti, F.S., Cagatay, M.N., Kipfer, R., Krastel, S., Schmincke, H.-U., Sturm, M., 2011. A
500,000-year-long sediment archive drilled in eastern Anatolia. Eos, Transactions, American
Geophysical Union 92, 477-479.
Litt, T., Anselmetti, F.S., Baumgarten, H., Beer, J., Cagatay, N., Cukur, D., Damci, E., Glombitza, C.,
Haug, G., Heumann, G., Kallmeyer, J., Kipfer, R., Krastel, S., Kwiecien, O., Meydan, A.F., Orcen, S.,
Pickarski, N., Randlett, M.-E., Schmincke, H.-U., Schubert, C.J., Sturm, M., Sumita, M., Stockhecke,
M., Tomonaga, Y., Vigliotti, L., Wonik, T., 2012. 500,000 years of environmental history in eastern
Anatolia; the PALEOVAN Drilling Project. Scientific Drilling 14, 18-29.
Litt, T., Pickarski, N., Heumann, G., Stockhecke, M., Tzedakis, P.C., 2014. A 600,000 year long
continental pollen record from Lake Van, eastern Anatolia (Turkey). Quaternary Science Reviews 104,
30-41.
Lorch, S., 1985. Korrektur von Bohrlocheinflüssen bei der Messung der natürlichen Gammastrahlung
in einer Bohrung. Geologisches Jahrbuch Heft 32.
Marra, F., Karner, D.B., Freda, C., Gaeta, M., Renne, P.R. 2009. Large mafic eruptions at the Alban
Hills volcanic district (Central Italy): chronostratigraphy, petrography and eruptive behaviour. Journal of
Volcanology and Geothermal Research 179, 217–232.
Melles, M., Brigham-Grette, J., Minyuk, P.S., Nowaczyk, N.R., Wennrich, V., DeConto, R.M.,
Anderson, P.M., Andreev, A.A., Coletti, A., Cook, T.L., Haltia-Hovi, E., Kukkonen, M., Lozhkin, A.V.,
Rosen, P., Tarasov, P., Vogel, H., Wagner, B., 2012. 2.8 million years of Arctic climate change from
Lake El'gygytgyn, NE Russia. Science 337, 315-320.
References
111
Milanković, M., 1920. Théorie mathématique des phénomènes thermiques produits par la radiation
solaire. Gauthier-Villars et Cie, Paris, France.
Molinie, A.J., Ogg, J.G., 1990a. Milankovitch cycles in Upper Jurassic and Lower Cretaceous
radiolarites of the Equatorial Pacific; spectral analysis and sedimentation rate curves. Proceedings of
the Ocean Drilling Program, Scientific Results 129, 529-547.
Molinie, A.J., Ogg, J.G., 1990b. Sedimentation-rate curves and discontinuities from sliding-window
spectral analysis of logs. Log Analyst 31, 370-374.
Mueller, U.C., Pross, J., Tzedakis, P.C., Gamble, C., Kotthoff, U., Schmiedl, G., Wulf, S., Christanis,
K., 2011. The role of climate in the spread of modern humans into Europe. Quaternary Science
Reviews 30, 273-279.
Neugebauer, I., Brauer, A., Schwab, M.J., Waldmann, N.D., Enzel, Y., Kitagawa, H., Torfstein, A.,
Frank, U., Dulski, P., Agnon, A., Ariztegui, D., Ben-Avraham, Z., Goldstein, S.L., Stein, M., DSDDP
Scientific Party, 2014. Lithology of the long sediment record recovered by the ICDP Dead Sea Deep
Drilling Project (DSDDP). Quaternary Science Reviews 102, 149-165.
Nomade, S., Knight, K.B., Beutel, E., Renne, P.R., Verati, C., Feraud, G., Marzoli, A., 2005. Duration
and eruptive chronology of CAMP; implications for central Atlantic rifting and the Triassic-Jurassic
boundary. Eos, Transactions, American Geophysical Union 86, @AbstractV13A-0519.
North Greenland Ice Core Project members. 2004. North Greenland Ice Core Project Oxygen Isotope
Data. IGBP PAGES/World Data Center for Paleoclimatology. Data Contribution Series # 2004-059.
NOAA/NGDC Paleoclimatology Program, Boulder CO, USA.
Nowaczyk, N.R., Haltia, E.M., Ulbricht, D., Wennrich, V., Sauerbrey, M.A., Rosén, P., Vogel, H.,
Francke, A., Meyer-Jacob, C., Andreev, A.A., Lozhkin, A.V., 2013. Chronology of Lake El’gygytgyn
sediments – a combined magnetostratigraphic, palaeoclimatic and orbital tuning study based on multi-
parameter analyses. Climate of the Past 9, 2413-2432.
Pälike, H., 2005. Earth; orbital variation (including Milankovitch cycles). Elsevier Academic Press:
Oxford, United Kingdom, 410-421.
Paulissen, W.E., Luthi, S.M., 2011. High-frequency cyclicity in a Miocene sequence of the Vienna
Basin established from high-resolution logs and robust chronostratigraphic tuning. Palaeogeography,
Palaeoclimatology, Palaeoecology 307, 313-323.
Petrosino, P., Jicha, B.R., Mazzeo, F.C., Russo Ermolli, E., 2014. A high resolution
tephrochronological record of MIS 14-12 in the Southern Apennines (Acerno basin, Italy). Journal of
Volcanology and Geothermal Research 274, 34-50.
Priestley, M.B., 1981. Spectral analysis and time series. New York: Academic Press, New York,
United States.
Prokopenko, A.A., Williams, D.F., Karabanov, E.B., Khursevich, G.K., 2001. Continental response to
Heinrich events and Bond cycles in sedimentary record of Lake Baikal, Siberia. Global and Planetary
Change 28, 217-226.
112
Prokopenko, A.A., Hinnov, L.A., Williams, D.F., Kuzmin, M.I., 2006. Orbital forcing of continental
climate during the Pleistocene; a complete astronomically tuned climatic record from Lake Baikal, SE
Siberia. Quaternary Science Reviews 25, 3431-3457.
Rachold, V., Brumsack, H.-J., 2001. Inorganic geochemistry of Albian sediments from the Lower
Saxony Basin NW Germany; palaeoenvironmental constraints and orbital cycles. Palaeogeography,
Palaeoclimatology, Palaeoecology 174, 121-143.
Rahmstorf, S., 2002. Ocean circulation and climate during the past 120,000 years. Nature 419, 207-
214.
Rider, M.H., Kennedy, M., 2011. The Geological Interpretation of Well Logs. Rider-French Consulting
Limited, 3r
d edition: Glasgow, Scotland.
Roehl, U., Abrams, L.J., 2000. High-resolution, downhole, and nondestructive core measurements
from sites 999 and 1001 in the Caribbean Sea; application to the late Paleocene thermal maximum.
Proceedings of the Ocean Drilling Program, Scientific Results 165, 191-203.
Roeser, P.A., Franz, S.O., Litt, T., Uelgen, U.B., Hilgers, A., Wulf, S., Wennrich, V., Rotolo, S.G.,
Scaillet, S., La Felice, S., Vita-Scaillet, G., 2013. A revision of the structure and stratigraphy of pre-
Green Tuff ingimbrites at Pantelleria (Strait of Sicily). Journal of Volcanology and Geothermal
Research, 250, 61-74.
Ruffell, A., Worden, R., 2000. Palaeoclimate analysis using spectral gamma-ray data from the Aptian
(Cretaceous) of southern England and southern France. Palaeogeography, Palaeoclimatology,
Palaeoecology 155, 265-283.
Schmincke, H.-U., 2004. Volcanism. Springer-Verlag, Berlin, Germany.
Schmincke, H.-U., Sumita, M., Cukur, D., 2013. Impact of volcanism on the evolution of Lake Van III:
İncekaya - an exceptionally large magnitude (DRE > 1 km³) subaqueous/subaerial explosive basaltic
eruption. IODP/ICDP Kolloquium 2013, 181-182.
Schnyder, J., Ruffell, A., Deconinck, J.-F., Baudin, F., 2006. Conjunctive use of spectral gamma-ray
logs and clay mineralogy in defining Late Jurassic-Early Cretaceous palaeoclimate change (Dorset,
U.K.). Palaeogeography, Palaeoclimatology, Palaeoecology 229, 303-320.
Scholz, C.A., Talbot, M.R., Brown, E.T., Lyons, R.P., 2011. Lithostratigraphy, physical properties and
organic matter variability in Lake Malawi drillcore sediments over the past 145,000 years.
Palaeogeography, Palaeoclimatology, Palaeoecology 303, 38-50.
Schwarzacher, W., 2000. Repetitions and cycles in stratigraphy. Earth-Science Reviews 50, 51-75.
Serra, O., 1986. Fundamentals of well-log interpretation; 2, The interpretation of logging data. Elsevier:
Amsterdam, The Netherlands.
Serra, O., Serra, L., 2003. Well Logging and Geology. Serralog 2003, Méry-Corbon, France.
Shanahan, T.M., Beck, J.W., Overpeck, J.T., McKay, N.P., Pigati, J.S., Peck, J.A., Scholz, C.A., Heil,
C.W., Jr., King, J., 2012. Late Quaternary sedimentological and climate changes at Lake Bosumtwi
Ghana; new constraints from laminae analysis and radiocarbon age modeling. Palaeogeography,
Palaeoclimatology, Palaeoecology 361-362, 49-60.
References
113
Solotchina, E.P., Prokopenko, A.A., Kuzmin, M.I., Solotchin, P.A., Zhdanova, A.N., 2009. Climate
signals in sediment mineralogy of Lake Baikal and Lake Hovsgol during the LGM-Holocene transition
and the 1-Ma carbonate record from the HDP-04 drill core. Quaternary International 205, 38-52.
Stage, M., 1999. Signal analysis of cyclicity in Maastrichtian pelagic chalks from the Danish North Sea.
Earth and Planetary Science Letters 173, 75-90.
Steiger, R.H., Jäger, E., 1977. Subcommission on geochronology: Convention on the use of decay
constants in geo- and cosmochronology. Earth and Planetary Science Letters 36, 359-362.
Stockhecke, M., Anselmetti, F.S., Meydan, A.F., Odermatt, D., Sturm, M., 2012. The annual particle
cycle in Lake Van (Turkey). Palaeogeography, Palaeoclimatology, Palaeoecology 333-334, 148-159.
Stockhecke, M., Kwiecien, O., Vigliotti, L., Anselmetti, F.S., Beer, J., Çağatay, M.N., Channell, J.E.T.,
Kipfer, R., Lachner, J., Litt, T., Pickarski, N., Sturm, M., 2014b. Chronostratigraphy of the 600,000 year
old continental record of Lake Van (Turkey). Quaternary Science Reviews 104, 8-17.
Stockhecke, M., Sturm, M., Brunner, I., Schmincke, H.-U., Sumita, M., Kipfer, R., Cukur, D., Kwiecien,
O., Anselmetti, F.S., 2014a. Sedimentary evolution and environmental history of Lake Van (Turkey)
over the past 600 000 years. Sedimentology 61, 1830-1861.
Sulpizio, R., Zanchetta, G., D'Orazio, M., Vogel, H., Wagner, B., 2010. Tephrostratigraphy and
tephrochronology of lakes Ohrid and Prespa, Balkans. Biogeosciences 7, 3273-3288.
Sumita, M., Schmincke, H.-U., 2012. The climatic, volcanic and geodynamic evolution of the Lake
Van-Nemrut-Süphan system (Anatolia) over the past ca. 550-600 000 years. A progress report based
on a study of the products of explosive volcanism on land and in the lake. IODP/ICDP Kolloquium
2012, 157-162.
Sumita, M., Schmincke, H.-U., 2013a. Impact of volcanism on the evolution of Lake Van I: evolution of
explosive volcanism of Nemrut Volcano (eastern Anatolia) during the past >400,000 years. Bulletin of
Volcanology 75, 714.
Sumita, M., Schmincke, H.-U., 2013b. Impact of volcanism on the evolution of Lake Van II: Temporal
evolution of explosive volcanism of Nemrut Volcano (eastern Anatolia) during the past ca. 0.4 Ma.
Journal of Volcanology and Geothermal Research 253, 15-34.
Theys, P.P., 1991. Log data acquisition and quality control. Editions Technip: Paris, France.
Torrence, C., Compo, G.P., 1998. A Practical Guide to Wavelet Analysis. Bulletin of the American
Meteorological Society 79, 61-78.
Trajanovski, S., Albrecht, C., Schreiber, K., Schultheiß, R., Stadler, T., Benke, M., Wilke, T., 2010.
Testing the spatial and temporal framework of speciation in an ancient lake species flock: The leech
genus Dina (Hirudinea: Erpobdellidae) in Lake Ohrid. Biogeosciences 7, 3387-3402.
Vogel, H., Wagner, B., Zanchetta, G., Sulpizio, R., Rosen, P., 2010a. A paleoclimate record with
tephrochronological age control for the last glacial-interglacial cycle from Lake Ohrid, Albania and
Macedonia. Journal of Paleolimnology 44, 295-310.
114
Vogel, H., Wessels, M., Albrecht, C., Stich, H.-B., Wagner, B., 2010b. Spatial variability of recent
sedimentation in Lake Ohrid (Albania/Macedonia). Biogeosciences 7, 3333-3342.
Vogel, H., Zanchetta, G., Sulpizio, R., Wagner, B., Nowaczyk, N., 2010c. A tephrostratigraphic record
for the last glacial-interglacial cycle from Lake Ohrid, Albania and Macedonia. Journal of Quaternary
Science 25, 320-338.
Wagner, B., Reicherter, K., Daut, G., Wessels, M., Matzinger, A., Schwalb, A., Spirkovski, Z.,
Sanxhaku, M., 2008. The potential of Lake Ohrid for long-term palaeoenvironmental reconstructions.
Palaeogeography, Palaeoclimatology, Palaeoecology 259, 341-356.
Wagner, B., Wilke, T., Grazhdani, A., Kostoski, G., Krastel, S., Reicherter, K.R., Zanchetta, G., 2009.
SCOPSCO; Scientific Collaboration On Past Speciation Conditions in Lake Ohrid. Eos, Transactions,
American Geophysical Union 90, @AbstractPP14A-02.
Wagner, B., Vogel, H., Zanchetta, G., Sulpizio, R., 2010. Environmental change within the Balkan
region during the past ca. 50 ka recorded in the sediments from lakes Prespa and Ohrid.
Biogeosciences 7, 3187-3198.
Wagner, B., Wilke, T., Krastel, S., Zanchetta, G., Sulpizio, R., Reicherter, K., Leng, M., Grazhdani, A.,
Trajanovski, S., Levkov, Z., Reed, J., Wonik, T., 2014a. More Than One Million Years of History in
Lake Ohrid Cores. EOS, Transactions, American Geophysical Union 95, 25-32.
Wagner, B., Wilke, T., Krastel, S., Zanchetta, G., Sulpizio, R., Reicherter, K., Leng, M.J., Grazhdani,
A., Trajanovski, S., Francke, A., Lindhorst, K., Levkov, Z., Cvetkoska, A., Reed, J.M., Zhang, X.,
Lacey, J.H., Wonik, T., Baumgarten, H., Vogel, H., 2014b. The SCOPSCO drilling project recovers
more than 1.2 million years of history from Lake Ohrid. Scientific Drilling 17, 19-29.
Weedon, G., 2003. Time-series analysis and cyclostratigraphy; examining stratigraphic records of
environmental cycles. Cambridge University Press: Cambridge, United Kingdom.
Wilson, R.C.L., Drury, S.A., Chapman, J.L., 2000. The Great Ice Age: Climate Change and Life.
Routledge, New York, United States.
Wonik, T., 2001. Gamma-ray measurements in the Kirchrode I and II boreholes. Palaeogeography,
Palaeoclimatology, Palaeoecology 174, 97-105.
Wu, H., Zhang, S., Feng, Q., Jiang, G., Li, H., Yang, T., 2012. Milankovitch and sub-Milankovitch
cycles of the early Triassic Daye Formation, South China and their geochronological and paleoclimatic
implications. Gondwana Research 22, 748-759.
Wyllie, M.R.J., Gregory, A.R., Gardner, L.W., 1956. Elastic Wave Velocities In Heterogeneous And
Porous Media. Geophysics 21, 41-70.
Zolitschka, B., Negendank, J.F.W., 1999. High resolution records from European lakes. Quaternary
Science Reviews 18, 885-888.
Zolitschka, B., Anselmetti, F., Ariztegui, D., Corbella, H., Francus, P., Ohlendorf, C., Schäbitz, F., the,
P.S.D.T., 2009. The Laguna Potrok Aike Scientific Drilling Project PASADO (ICDP Expedition 5022).
Scientific Drilling 8, 29-34.

References
115
Zolitschka, B., F. Anselmetti, D. Ariztegui, H. Corbella, P. Francus, A. Lücke, N.I. Maidana, C.
Ohlendorf, F. Schäbitz, S. Wastegard, 2013. Environment and climate of the last 51,000 years – new
insights from the Potrok Aike maar lake sediment archive drilling project (PASADO). Quaternary
Science Reviews, 71, 1-12.
116
6. Erklärung
Hiermit erkläre ich, dass die Dissertation “Climate implications and lithological
characteristics of sediments from Lake Van (Turkey) and Lake Ohrid (Macedonia / Albania)
obtained from downhole logging data” ohne unerlaubte Hilfe angefertigt wurde. Es wurden
keine weiteren, als die angegebenen Quellen und Hilfsmittel, benutzt. Alle wörtlich oder
inhaltlich entnommenen Stellen wurden als solche kenntlich gemacht.
Hannover, 07.05.2015