Dioxide Reduction A Stable Covalent Organic Framework for ... › suppdata › c9 › sc ›...
51
A Stable Covalent Organic Framework for Photocatalytic Carbon Dioxide Reduction Zhiwei Fu, 1 Xiaoyan Wang, 1 Adrian M. Gardner, 2 Xue Wang, 1,3 Samantha Y. Chong, 1 Gaia Neri, 2 Alexander J. Cowan, 2 Lunjie Liu, 1 Xiaobo Li, 1 Anastasia Vogel, 1 Rob Clowes, 1 Matthew Bilton, 4 Linjiang Chen, 1,3* Reiner Sebastian Sprick, 1* and Andrew I. Cooper 1,3* 1 Department of Chemistry and Materials Innovation Factory, University of Liverpool, 51 Oxford Street, Liverpool, L7 3NY, U.K. 2 Stephenson Institute for Renewable Energy, University of Liverpool, Chadwick Building, Peach Street, Liverpool, L69 7ZF, U.K. 3 Leverhulme Research Centre for Functional Materials Design, Materials Innovation Factory and Department of Chemistry, University of Liverpool, Oxford Street, Liverpool L7 3NY, U.K. 4 Imaging Centre at Liverpool, University of Liverpool, Liverpool L69 3GL, U.K. *Corresponding author. Emails: [email protected], [email protected], [email protected] Electronic Supplementary Material (ESI) for Chemical Science. This journal is © The Royal Society of Chemistry 2019
Transcript of Dioxide Reduction A Stable Covalent Organic Framework for ... › suppdata › c9 › sc ›...

A Stable Covalent Organic Framework for Photocatalytic Carbon
Dioxide Reduction
Zhiwei Fu,1 Xiaoyan Wang,1 Adrian M. Gardner,2 Xue Wang,1,3 Samantha Y. Chong,1 Gaia Neri,2 Alexander J. Cowan,2 Lunjie Liu,1 Xiaobo Li,1 Anastasia Vogel,1 Rob Clowes,1 Matthew Bilton,4 Linjiang Chen,1,3* Reiner Sebastian Sprick,1* and Andrew I. Cooper1,3*
1 Department of Chemistry and Materials Innovation Factory, University of Liverpool, 51
Oxford Street, Liverpool, L7 3NY, U.K.
2 Stephenson Institute for Renewable Energy, University of Liverpool, Chadwick Building,
Peach Street, Liverpool, L69 7ZF, U.K.
3 Leverhulme Research Centre for Functional Materials Design, Materials Innovation Factory
and Department of Chemistry, University of Liverpool, Oxford Street, Liverpool L7 3NY, U.K.
4 Imaging Centre at Liverpool, University of Liverpool, Liverpool L69 3GL, U.K.
*Corresponding author. Emails: [email protected], [email protected],
Electronic Supplementary Material (ESI) for Chemical Science.This journal is © The Royal Society of Chemistry 2019

Table of Contents
1. Materials and methods..............................................................................................................................4
1.3 Thermogravimetric analysis ...................................................................................................................4
1.4 Gas sorption analysis ..............................................................................................................................4
1.5 Fourier-transform infrared spectroscopy ................................................................................................4
1.6 UV-Visible absorption spectra ...............................................................................................................4
1.8 Scanning transmission electron microscopy...........................................................................................5
1.9 Isotopic labelling experiments................................................................................................................5
1.10 Photoelectrochemical measurements......................................................................................................5
1.11 Inductively coupled plasma - optical emission spectrometry (ICP-OES) analysis ................................5
1.12 Transmission and backscattering experiments .......................................................................................6
1.13 Time-correlated single photon counting (TCSPC) measurements .........................................................6
1.14 Determination of apparent quantum yield (AQY) for CO production ...................................................6
1.15 Photocatalytic CO2 reduction experiments.............................................................................................6
1.16 X-ray photoelectron spectroscopy (XPS) measurements .......................................................................7
1.17 Transient absorption (TA) spectroscopic ...............................................................................................7
2. Synthetic procedures.................................................................................................................................8
3. NMR Spectra ..........................................................................................................................................10
4. Fourier-transform infrared spectroscopy ................................................................................................12
5. Powder X-ray diffraction........................................................................................................................14
6. UV-visible spectra ..................................................................................................................................17
7. Photocatalytic CO2 reduction experiments.............................................................................................19
8. Scanning electron microscopy................................................................................................................20
9. Thermogravimetric analysis ...................................................................................................................21
10. CO2 uptake..............................................................................................................................................22
11. Time-correlated single photon counting experiments ............................................................................23
12. Energy-dispersive X-ray spectroscopy ...................................................................................................33
13. Wavelength-dependent CO2 reduction experiments...............................................................................34
14. Transmission and backscattering experiments .......................................................................................35
15. Gas sorption isotherms ...........................................................................................................................36
16. X-Ray photoelectron spectroscopy.........................................................................................................37
17. Photoelectrochemical measurements......................................................................................................38
18. Control experiments and previously reported data.................................................................................42
19. Density functional theory (DFT) and time-dependent DFT (TD-DFT) calculations .............................44

1. Materials and methodsAll reagents were obtained from Sigma-Aldrich, TCI Europe or Fluorochem Ltd. Anhydrous solvents
were purchased from Acros Organics or Fisher Scientific. All chemicals were used as received and
without further purification. 5,5’-Bis(cyanomethyl)-2,2’-bipyridine and 1,3,6,8-tetrakis(4-
formylphenyl)pyrene (TFPPy) were synthesized based on previous literature procedures.1,2
1.1 Solution nuclear magnetic resonance1H and 13C{1H} NMR spectra were recorded on a Bruker Avance 400 NMR spectrometer, operating at
frequencies of 400 MHz and 100 MHz, respectively.
1.2 Powder X-ray diffractionPowder X-ray diffraction (PXRD) measurements were carried out on a Panalytical Empyrean
diffractometer, equipped with a Cu X-ray source (λ = 1.5418 Å, Cu Kα), PIXcel3D detector and X-ray
focusing mirror. The loose powdered sample was held on Mylar film in aluminium well plates and
screened in high throughput transmission mode. Powder diffraction analysis was performed using
TOPAS-Academic.3
1.3 Thermogravimetric analysis
Thermogravimetric analysis (TGA) was measured on an EXSTAR6000 with an automated vertical
overhead thermobalance under nitrogen flow, ramping heating at 10 °C min-1 from 25 °C to 600 °C.
1.4 Gas sorption analysis
Nitrogen adsorption and desorption were measured at 77.3 K using a Micromeritics ASAP
2020 volumetric adsorption analyzer. Powder samples were degassed offline at 393 K for 12
hours under dynamic vacuum (10-5 bar) before analysis. BET surface areas were fitted over
relative pressure (p/p°) from 0.1 to 0.2. Pore size distributions of COFs were obtained from the
adsorption data by fitting a nonlocal density functional theory (NL-DFT) model with method
of N2-cylindrical pores-oxide surface. CO2 isotherms were collected up to a pressure of 1200
mbar on a Micromeritics ASAP 2020 at 273 K and 298 K.
1.5 Fourier-transform infrared spectroscopy
FT-IR spectra were collected on a Bruker Tensor 27 FT-IR spectrometer. Samples were prepared as
KBr disks before analyzing for 16 scans with a resolution of 4 cm-1.
1.6 UV-Visible absorption spectra
UV-Visible absorption spectra were measured on an Agilent Cary 5000 UV-Vis-NIR Spectrometer by
measuring the reflectance of powders in the solid-state.

1.7 Scanning electron microscopy
The morphology of the materials was studied using a Hitachi S-4800 cold field emission scanning
electron microscope (FE-SEM). Samples were prepared by depositing the powders with an adhesive
high-purity carbon tab on Hitachi M4 aluminium stubs.
1.8 Scanning transmission electron microscopy
STEM and EDX images were obtained on a JEOL 2100F Cs-corrected analytical FEG S/TEM operating
at 200 kV, and fitted with an EDAX Octane T Optima windowless 60 mm2 SDD EDX detector. The
samples were prepared by drop-casting sonicated ethanol suspensions of the materials onto a copper
grid.
1.9 Isotopic labelling experiments13CO2 Labelling experiments were carried on a Bruker Vertex 70V Fourier-transform infrared
spectrometer with an argon-purged custom-made gas IR cell. A vial containing COF powders,
acetonitrile and triethanolamine was purged with 13CO2 (Sigma-Aldrich, 99 atom % 13C, <3 atom
% 18O) for 3 minutes, then it was illuminated for 4 hours using a 300 W Xe light source equipped with
λ > 420 nm filter. Gas from the headspace of the vial (500 μL) was injected into the gas IR cell and a
spectrum was measured (32 scans with a resolution of 0.5 cm-1).
1.10 Photoelectrochemical measurements1 mg of the photocatalyst was dispersed in 0.1 mL acetonitrile and ultrassonicated for 10 minutes giving
a homogenous suspension. Fluoride-tin oxide (FTO) glass slides were covered with a copper mask
giving an area of 0.28 cm2. 10 μL of the suspension was drop-casted on the FTO glass and dried
overnight at room temperature. The photocurrent response was measured using a three-electrode setup
with a working electrode (COF on FTO glass), counter electrode (Pt wire), and reference electrode
(Ag/AgCl). An Oriel Instruments LSH-7320 Solar Simulator (IEC ABA certified) with 1 Sun output
was used to illuminate the sample. A 0.1 M Na2SO4 (pH = 7) solution with a bias voltage of -0.1 V was
used for the measurement. The EIS spectra were recorded by applying a 10 mV AC signal in the
frequency range from 100 kHz to 0.01 Hz. The potential converted to reversible hydrogen electrode
(RHE) using the following equation4:
1.11 Inductively coupled plasma - optical emission spectrometry (ICP-OES) analysis Samples were digested in nitric acid (67–69%, trace metal analysis grade) with a microwave using an
in-house procedure. The obtained solutions were diluted with water before the measurement by Spectro
Ciros ICP-OES and the instrument was calibrated with standards in aqueous solution.

1.12 Transmission and backscattering experimentsSamples were tested on a Formulaction S.A.S. Turbiscan AGS with an 880 nm NIR diode and a detector
at 180° or 45° (relative to the light source) in a cylindrical glass cell. Before the measurements, samples
were dispersed in 20 mL acetonitrile and sonicated for 15 minutes. Then, the transmission and
backscattering of the suspensions were measured in cylindrical glass cells from 5000 to 30,000 μm
every 40 μm.
1.13 Time-correlated single photon counting (TCSPC) measurements
TCSPC experiments were performed on an Edinburgh Instruments LS980-D2S2-STM spectrometer
equipped with picosecond pulsed LED excitation sources and a R928 detector, with a stop count rate
below 3%. An EPL-375 diode (λ = 370.5 nm, instrument response 100 ps, fwhm) with a 450 nm high
pass filter for emission detection was used. Suspensions were prepared by ultrasonicating the materials
in acetonitrile or acetonitrile with triethanolamine (30/1) purged with N2 and CO2. The instrument
response was measured with colloidal silica (LUDOX® HS-40, Sigma-Aldrich) at the excitation
wavelength without filter. Decay times were fitted in the FAST software using suggested lifetime
estimates.
1.14 Determination of apparent quantum yield (AQY) for CO production
The apparent quantum yield of CO production was determined using monochromatic LED light (λ =
420 nm). The reactions were conducted on the same photochemical experimental setup under the
optimized reaction conditions. For the experiments, COFs (1 mg) was suspended in acetonitrile and
triethanolamine (30:1 vol. mixture, 5 mL). The illuminated area was 8 cm2 and the light intensity was
measured by a ThorLabs PM100D Power and Energy Meter Console with a ThorLabs S120VC
photodiode power sensor. The AQY was calculated as follow:
AQY% = 2 × [(n CO) × NA × ħ × c)] × 100% / (I × S × t × λ)
Where, NA is Avogadro constant (6.022 × 10²³ mol-1), ħ is the Planck constant (6.626 × 10⁻³⁴ J s), c is
the speed of light (3 × 10⁸ m s-1), S is the irradiation area (cm2), I is the intensity of irradiation light
(W cm-2), t is the photoreaction time (s), λ is the wavelength of the monochromatic light (m).
1.15 Photocatalytic CO2 reduction experimentsA quartz flask was charged with the COF powder (1 mg), acetonitrile (MeCN) and triethanolamine
(TEOA) (30:1 vol. mixture, 5 mL) and sealed with a septum. The resulting suspension was
ultrasonicated for 5 minutes and then purged with CO2 for 15 minutes. The reaction mixture was
illuminated with a 300 W Newport Xe light source (model: 6258, Ozone free) equipped with a
λ > 420 nm cut-off filter. Gaseous products were taken with a gas-tight syringe and run on a Shimadzu
GC-2014 gas chromatograph equipped with a ShinCarbon ST micropacked column (Restek 80-
100 mesh, 2 m length, 0.53 mm inner diameter) and a thermal conductivity detector.

1.16 X-ray photoelectron spectroscopy (XPS) measurements
X-ray photoelectron spectroscopy (XPS) measurements were performed using a Kratos AXIS Ultra
DLD instrument. The chamber pressure during the measurements was 5 × 10⁻⁹ Torr. Wide energy range
survey scans were collected at pass energy of 80 eV in hybrid slot lens mode and a step size of 0.5 eV.
Wide scan and high-resolution data on the C 1s, O 1s, Cl 2p, Re 4f and Co 2p photoelectron peaks was
collected at pass energy 20 eV over energy ranges suitable for each peak, and collection times of 5 min,
step sizes of 0.1 eV. The charge neutraliser filament was used to prevent the sample charging over the
irradiated area. The X-ray source was a monochromated Al Kα emission, run at 10 mA and 12 kV (120
W). The energy range for each ‘pass energy’ (resolution) was calibrated using the Kratos Cu 2p3/2, Ag
3d5/2 and Au 4f7/2 three-point calibration method. The transmission function was calibrated using a clean
gold sample method for all lens modes and the Kratos transmission generator software within Vision
II.
1.17 Transient absorption (TA) spectroscopic
The apparatus employed to obtain transient absorption, TA, spectra of the COFs of interest consists of
an Ytterbium laser system (PHAROS Short-Pulse 10 W, PH1-SP-10W, Light Conversion) with an
output power of 10 W, wavelength of 1028 nm, repetition rate of 10 kHz and pulse duration of ~180 fs.
Of this, ~1 W is used to drive an Optical Parametric Amplifier, OPA (ORPHEUS, Light Conversion)
in tandem with a second harmonic generation module (LYRA, Light Conversion) in order to generate
radiation centred at 400 nm with a bandwidth (FWHM) of 3 nm.
This 400 nm output was used as the pump source for subsequent TA measurements which employed a
commercial TA spectrometer (HARPIA, Light Conversion). The probe light was visible white light
super continuum generated by focusing < 0.1 W of 1028 nm radiation onto a sapphire window. Variable
delay times between the pump and probe beams were obtained by passing the pump beam through a
multi-pass mechanical delay stage allowing pump-probe delays up to 3.6 ns to be achieved. The pump
and probe beams were focused to 600 and 400 μm spots at the sample. The pump laser beam was
chopped, allowing, or blocking several pump pulses, resulting in an effective pumping repetition rate
of 5 kHz to be obtained; the state of pumping of the sample (i.e. pumped/unpumped), along with
stability of the pump laser power, is monitored using a photodiode. The power of the chopped beam
incident on the sample was 0.8 mW. The samples were suspensions of the COF of interest, in either
pure acetonitrile, or a 30:1 mixture of acetonitrile and TEOA, held within a quartz cuvette with a 2 mm
path length.
The white light supercontinuum was collimated and routed to the detector. Here the white light was
spectrally dispersed by a spectrograph (Kymera 193i, Andor), employing a grating of 150 lines/mm,
blazed at 800 nm, and detected using an NMOS detector (S3901, Hamamatsu).

2. Synthetic procedures
Figure S1. Scheme of the synthesis of Bpy-sp2c-COF.
Synthesis of Bpy-sp2c-COF: A Pyrex tube (10 mL) was charged with TFPPy (14.8 mg, 0.024 mmol)
and 5,5’-bis(cyanomethyl)-2,2’-bipyridine (11.5 mg, 0.048 mmol), 1,2-dichlorobenze (0.5 mL), 1-
butanol (0.5 mL) and aqueous KOH solution (0.1 mL, 4 M). The mixture was ultrasonicated for two
minutes and then flash frozen at 77 K (liquid N2 bath) and degassed through three freeze-pump-thaw
cycles and sealed under vacuum using a Schlenk line and oil pump. The tube was heated at 120 °C for
3 days. After cooling to room temperature, the precipitated was washed with HCl (aq. 1 M), water, THF
and methanol three times, respectively. The resulting powder was subjected to Soxhlet extraction with
THF for two days. The powder was collected and dried at 120 °C under vacuum overnight to afford
yellow crystallites in 82% yield. Anal. Calcd for (C72H42N8)n: C, 84.85; H, 4.15; N, 10.99. Found: C,
70.09; H, 4.09; N, 6.99. Note: The yields and microanalysis data were calculated for an infinite structure
and also ignoring the presence of end-groups whose nature is unclear. The predicted theoretical surface
areas of Bpy-sp2c-COF is 2041.21 m2 g-1.
Synthesis of Bpy-sp2c-P: A flask (250 mL) was charged with TFPPy (148 mg, 0.24 mmol) and 5,5’-
bis(cyanomethyl)-2,2’-bipyridine (115 mg, 0.48 mmol), 1,4-dioxane (100 mL) and aqueous KOH
solution (8 mL, 4 M). The mixture was ultrasonicated for two minutes and then heated at 120 °C for 3
days. After cooling to room temperature, the precipitated was washed with HCl (aq. 1 M), water, THF
and methanol for three times, respectively. The resulting powder was subjected to Soxhlet extraction
with THF for two days. The powder was collected and dried at 120 °C under vacuum overnight to afford
yellow crystallites in 81.50% isolated yield. Anal. Calcd for (C72H42N8)n : C,84.85; H, 4.15; N, 10.99.
C, 70.05; H, 3.52; N, 6.34. Note: The yields and microanalysis data were calculated for an infinite
structure and also ignoring the presence of end-groups whose nature is unclear.
Synthesis of Re-Bpy-sp2c-COF and Re-Bpy-sp2c-P: Re-Bpy-sp2c-COF and Re-Bpy-sp2c-P were
prepared according a modified literature method.5 COF or amorphous materials (10 mg) and

[Re(CO)5Cl] (10 mg, 0.028 mmol) were dispersed and refluxed in 10 mL toluene for 40 min. The dark
red product was filtered and washed with methanol for 3 times. The resulting powders was dried under
vacuum overnight. ICP-OES analysis shows a Re content in Re-Bpy-sp2c-COF of 18.1 wt. % (0.97
mmol g-1) and Re-Bpy-sp2c-P of 9.4 wt. %. The predicted theoretical surface areas of Re-Bpy-sp2c-
COF is 1835.57 m2 g-1.
Synthesis of Re(bpy)(CO)3Cl: Re(bpy)(CO)3Cl was prepared according a modified literature method.6
In a 50 mL round-bottom flask, Re(CO)5Cl (0.251g, 0.68 mmol), 2,2′-bipyridine (0.106g, 0.68 mmol),
and toluene (20 mL) were added together, and the resultant reaction mixture was refluxed under N2 for
1 h. Upon cooling, the product was vacuum filtered, and rinsed with cold toluene. 1H NMR (δ,
400 MHz, DMSO-d6): 9.02 (d, 1H), 8.77 (d, 1H), 8.34(t, 1H), 7.76(t, 1H).

3. NMR Spectra
Figure S2. 1H NMR spectrum of 5,5’-bis(cyanomethyl)-2,2’-bipyridine in DMSO-d6.
Figure S3. 13C{1H} NMR spectrum of 5,5’-bis(cyanomethyl)-2,2’-bipyridine in DMSO-d6.

Figure S4. 1H NMR spectrum of 1,3,6,8-tetrakis(4-formylphenyl)pyrene CDCl3.

4. Fourier-transform infrared spectroscopy
Figure S5. FT-IR spectra of 5,5’-bis(cyanomethyl)-2,2’-bipyridine, TFPPy and Bpy-sp2c-COF.
Figure S6. FT-IR spectra of Bpy-sp2c-COF and after loading with [Re(CO)5Cl] (Re-Bpy-sp2c-COF).

Figure S7. FT-IR spectra of Re-Bpy-sp2c-COF before and after 17.5 hours of visible light irradiation
(300 W Xe light source, λ > 420 nm).
Figure S8. FT-IR spectra of Bpy-sp2c-P and after loading with [Re(CO)5Cl] (Re-Bpy-sp2c-P).

5. Powder X-ray diffraction
(c)
(a)
(b)

Figure S9. (a) Experimentally observed powder X-ray diffraction pattern of Bpy-sp2c-COF (blue) and
simulated profiles for AA and AB stacking modes (red and black); (b) Structural models for Bpy-sp2c-
COF with ideal eclipsed AA and AB stacking patterns, shown parallel to the pore channel along the
crystallographic c axis (top) and parallel to the hexagonal layers (bottom); (c) final observed (red
circles), calculated (black line) and difference profiles for Le Bail refinement (Rwp = 2.55 %, Rp = 1.98
%, 2 = 1.49) for Bpy-sp2c-COF (a = 39.45(2), b = 40.97(2), c = 3.684(2) Å, = 91.42(4)°, = 89.5(2),
= 90.5(2), V = 5953(5) Å3, triclinic). Reflection positions are indicated by tick marks.
Figure S10. (a) Experimentally observed powder X-ray diffraction pattern of Bpy-sp2c-COF (blue),
Re-Bpy-sp2c-COF (pink); (b) final observed (red circles), calculated (black line) and difference profiles
for Le Bail refinement (Rwp = 2.49 %, Rp = 1.93 %, 2 = 1.24) for Re-Bpy-sp2c-COF (a = 38.52(2), b
= 40.91(2), c = 7.37(1) Å, = 91.3(8)°, = 91.6(5)°, = 89.18(5)°, V = 11608(23) Å3, triclinic).
Reflection positions are indicated by tick marks.
(b)
(a)

Figure S11. Experimentally observed powder X-ray diffraction pattern of Re-Bpy-sp2c-COF before
and after 17.5 hours irradiation.
Figure S12. Experimentally observed powder X-ray diffraction pattern of Bpy-sp2c-P (blue) and Re-
Bpy-sp2c-P (black).

6. UV-visible spectra
Figure S13. UV-Vis absorption spectra of 5,5’-bis(cyanomethyl)-2,2’-bipyridine and 1,3,6,8-
tetrakis(4-formylphenyl)pyrene in the solid-state.
Figure S14. UV-Vis absorption spectra of Bpy-sp2c-COF and after loading with [Re(CO)5Cl] (Re-Bpy-
sp2c-COF) measured in the solid-state.

Figure S15. UV-Vis absorption spectra of Bpy-sp2c-P and after loading with [Re(CO)5Cl] (Re-Bpy-
sp2c-P) measured in the solid-state.

7. Photocatalytic CO2 reduction experiments
Figure S16. CO2 reduction experiments of Re-Bpy-sp2c-COF (1 mg) (a) and Re(bpy)(CO)3Cl (0.45 mg,
0.97 μmol) (b) from MeCN and TEOA (5 mL, 30/1) under visible light irradiation (λ > 420 nm, 300 W
Xe light source). The TONs are 18.7 and 10.3 for Re-Bpy-sp2c-COF and Re(bpy)(CO)3Cl, respectively.

8. Scanning electron microscopy
Figure S17. SEM images of Bpy-sp2c-COF (a, b), Re-Bpy-sp2c-COF (c, d), Bpy-sp2c-P (e, f) and Re-
Bpy-sp2c-P (g, h).

9. Thermogravimetric analysis
Figure S18. TGA traces of Bpy-sp2c-COF and after loading with [Re(CO)5Cl] (Re-Bpy-sp2c-COF)
measured under nitrogen.

10. CO2 uptake
Figure S19. CO2 sorption isotherms and CO2 isosteric heat of adsorption calculated from 273 K and
298 K of Re-Bpy-sp2c-COF (a, b), Bpy-sp2c-COF (c, d) and Bpy-sp2c-P (e, f).

11. Time-correlated single photon counting experiments
Figure S20. Fluorescence emission and excitation spectra of Bpy-sp2c-COF in acetonitrile.
Figure S21. Fluorescence emission and excitation spectra of Bpy-sp2c-COF in acetonitrile and
triethanolamine (30/1) mixture.
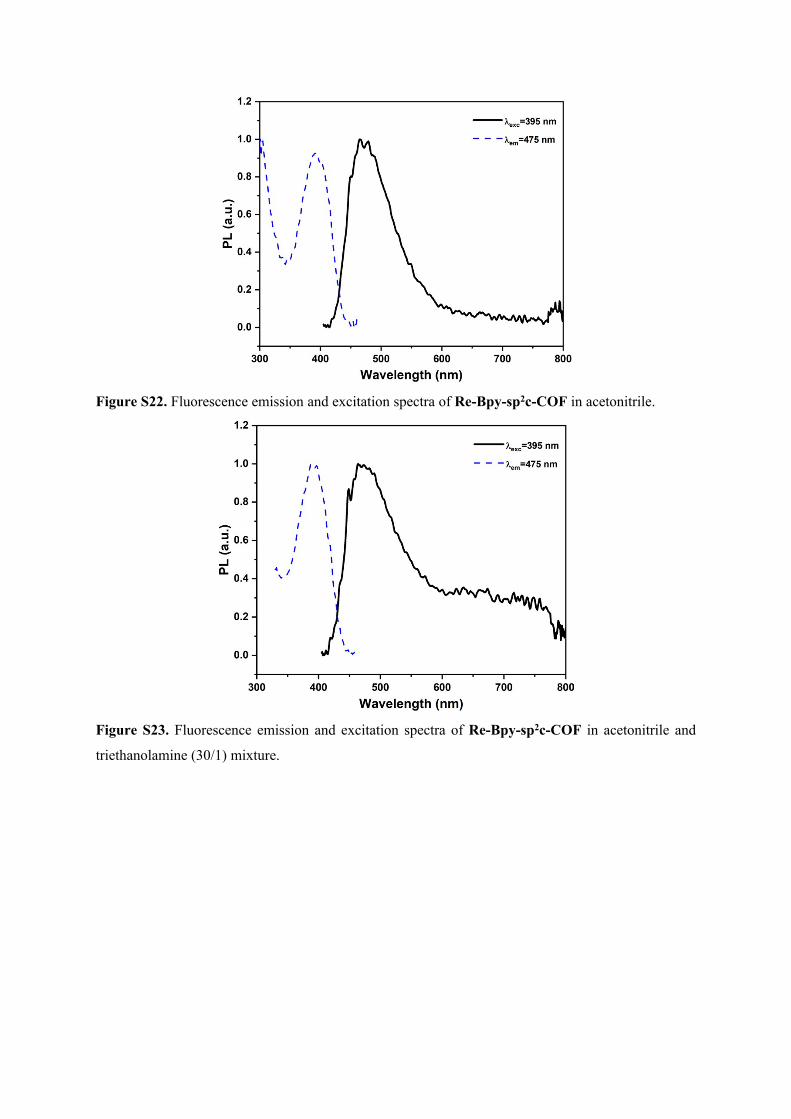
Figure S22. Fluorescence emission and excitation spectra of Re-Bpy-sp2c-COF in acetonitrile.
Figure S23. Fluorescence emission and excitation spectra of Re-Bpy-sp2c-COF in acetonitrile and
triethanolamine (30/1) mixture.

Figure S24. Fluorescence emission and excitation spectra of Bpy-sp2c-P in MeCN (a) and
MeCN/TEOA (30/1) (b) and Re-Bpy-sp2c-P in MeCN (c) and MeCN/TEOA (30/1) (d).

Figure S25. Fluorescence life-time decays of Bpy-sp2c-COF in acetonitrile purged with CO2 (λexc =
405 nm, λem = 475 nm).
Figure S26. Fluorescence life-time decays of Bpy-sp2c-COF in acetonitrile purged with CO2 (λexc =
405 nm, λem = 640 nm).

Figure S27. Fluorescence life-time decays of Bpy-sp2c-COF in acetonitrile and triethanolamine (30/1)
mixture purged with CO2 (λexc = 405 nm, λem = 620 nm).
Figure S28. Fluorescence life-time decays of Re-Bpy-sp2c-COF in acetonitrile purged with CO2 (λexc
= 405 nm, λem = 475 nm).
Figure S29. Fluorescence life-time decays of Re-Bpy-sp2c-COF in acetonitrile and triethanolamine
(30/1) mixture purged with CO2 (λexc = 405 nm, λem = 475 nm).

Figure S30. Fluorescence life-time decays of Bpy-sp2c-P in MeCN (a, b) and MeCN/TEOA (30/1) (c,
d) mixture purged with CO2 (λexc = 405 nm, λem = 475 or 620 nm) and Re-Bpy-sp2c-P in MeCN (d) and
MeCN/TEOA (e) purged with CO2 (λexc = 405 nm, λem = 475).

Table S1. Fluorescence life-time measurements.
Materials λem / nm τ1 / ns B1 / % τ2 / ns B2 / % τ3 / ns B3 / % χ2 τAVG
Bpy-sp2c-COF[a] 475 0.56 5.11 2.55 84.22 4.16 10.66 1.18 2.62
Bpy-sp2c-COF[b] 475 0.06 9.16 1.95 31.27 3.13 59.57 1.25 2.48
Bpy-sp2c-COF[a] 640 0.64 34.16 2.56 46.82 7.5 19.02 1.19 2.84
Bpy-sp2c-COF[b] 640 0.66 38.23 2.48 42.59 7.34 19.18 1.19 2.72
Bpy-sp2c-COF[c] 475 0.15 16.42 0.55 60.10 1.19 18.48 1.20 0.60
Bpy-sp2c-COF[d] 475 0.08 6.14 0.66 87.52 2.20 6.34 1.02 0.72
Bpy-sp2c-COF[c] 620 0.79 35.05 2.74 46.03 7.94 18.93 1.19 3.04
Bpy-sp2c-COF[d] 620 0.72 33.59 2.57 46.47 7.54 19.94 1.16 2.94
Re-Bpy-sp2c-COF[a] 475 0.14 5.90 1.98 44.30 3.09 49.80 1.39 2.42
Re-Bpy-sp2c-COF[b] 475 0.25 4.89 2.57 78.73 4.26 16.38 1.25 2.73
Re-Bpy-sp2c-COF[c] 475 0.22 28.82 0.75 67.21 3.96 3.97 1.29 0.72
Re-Bpy-sp2c-COF[d] 475 0.23 26.95 0.77 68.78 3.83 4.27 1.33 0.76
Bpy-sp2c-P[a] 475 0.33 7.65 2.24 55.04 3.23 37.31 1.31 2.47
Bpy-sp2c-P[b] 475 0.41 4.94 2.57 65.68 3.67 29.37 1.11 2.79
Bpy-sp2c-P[a] 620 0.36 41.04 1.42 43.42 4.39 15.55 1.37 1.44
Bpy-sp2c-P[b] 620 0.37 40.39 1.45 42.51 4.52 17.11 1.41 1.54
Bpy-sp2c-P[c] 620 0.52 30.22 1.94 50.57 6.24 19.22 1.31 2.34
Bpy-sp2c-P[d] 620 0.52 30.50 1.92 50.19 6.18 19.31 1.24 2.32
Re-Bpy-sp2c-P[a] 475 0.37 27.92 1.91 30.20 3.14 41.88 1.13 1.99
Re-Bpy-sp2c-P[b] 475 0.39 23.77 2.43 50.10 3.60 26.12 1.19 2.25
Re-Bpy-sp2c-P[c] 475 0.38 66.06 0.99 31.10 5.25 2.85 1.01 0.71
Re-Bpy-sp2c-P[d] 475 0.38 57.86 0.98 38.00 6.13 4.15 1.13 0.85
[a] Acetonitrile purged with N2.
[b] Acetonitrile purged with CO2.
[c] Acetonitrile and triethanolamine (30/1) purged with N2.
[d] Acetonitrile and triethanolamine (30/1) purged with CO2.
[e] Fluorescence life-times obtained upon excitation at λexc = 405 nm with a laser and observed at λem = 475, 640
nm. Fluorescence life-times in water suspension obtained from fitting time-correlated single photon counting
decays to a sum of three exponentials, which yield τ1, τ2, and τ3 according to . τAVG is the
𝑛
∑𝑖= 1
(𝐴+ 𝐵𝑖exp ( ‒𝑡𝜏𝑖))
weighted average lifetime calculated as . Note that the poor χ2 values are due to ultrafast decays for these
𝑛
∑𝑖= 1
𝐵𝑖𝜏𝑖

materials which were very similar to the instrument response.7, 8
Figure S31. Fluorescence emission and excitation spectra of (Ir[dF(CF3)ppy]2(dtbpy))PF6 in
acetonitrile.
Figure S32. Fluorescence emission spectra (λexc = 440 nm) of (Ir[dF(CF3)ppy]2(dtbpy))PF6 in
acetonitrile (3 mL) and (Ir[dF(CF3)ppy]2(dtbpy))PF6 with different amounts of Re-Bpy-sp2c-COF and
acetonitrile (1 mg in 5 mL) mixture.

Figure S33. Stern-Volmer plots F0/F versus Re-Bpy-sp2c-COFs concentration, [Q], in acetonitrile.
Stern-Volmer plots based on fluorescence quenching intensity ratios F0/F of dye and Re-Bpy-sp2c-COF
solutions are plotted in Figure S33. F0 is the fluorescence intensity of the dye without quencher (Re-
Bpy-sp2c-COF) and fluorescence intensity F is for the dye with Re-Bpy-sp2c-COF added in various
concentrations. As shown in Figure S33, the Stern-Volmer plots show an upward (positive deviation)
from a linear trend for F0/F ratios with increasing quencher concentration, which suggesting the
simultaneous presence of dynamic and static quenching.9, 10

12. Energy-dispersive X-ray spectroscopy
Figure S34. EDX spectrum of Re-Bpy-sp2c-COF.

13. Wavelength-dependent CO2 reduction experiments
Figure S35. Wavelength dependent CO evolution experiments of Re-Bpy-sp2c-COF (1 mg) from 5
mL MeCN/TEOA (30/1) solution under monochromatic light (± 10 nm, fwhm) in a photoreactor with
path length of 5 cm at 420 nm (blue), 435 nm (deep green), 490 nm (green), and 515 nm (orange).

14. Transmission and backscattering experiments
Figure S36. Transmission experiments of photocatalysts suspended in MeCN. The transmittance of the
suspensions was measured with a laser scanning the height of the measurement reactor at 180° relative
to the light source. The suspensions appear to be stable for the duration of the measurement as the
transmission values are similar for the entire height of the measurement reactor, with in both cases low
transmission values showing that the material disperses well in MeCN.
Figure S37. Backscattering experiments of photocatalysts suspended in MeCN. The backscattering of
the suspensions was measured with a laser scanning the height of the measurement reactor at 45°
relative to the light source. The suspensions appear to be stable for the duration of the measurement as
the backscattering values are similar for the entire height of the measurement reactor.

15. Gas sorption isotherms
Figure S38. N2 isotherm of Re-Bpy-sp2c-COF measured at 77 K (Adsorption (filled dots) and
desorption (open dots)). The inset shows the calculated pore size distribution.
Figure S39. N2 isotherm of Bpy-sp2c-P measured at 77 K (Adsorption (filled dots) and desorption
(open dots)). The inset shows the calculated pore size distribution.

16. X-Ray photoelectron spectroscopy
Figure S40. HR XPS analysis of Re 4f (a), Cl 2p (b) and N 2s (s) signals of Re-Bpy-sp2c-COF and
Re 4f (d), Cl 2p (e) and N 2s (f) signals of Re(bpy)(CO)3Cl

17.Photoelectrochemical measurements
Figure S41. Transient photocurrent response at different potentials in acetonitrile vs RHE under
intermittent light irradiation for Bpy-sp2c-COF and Re-Bpy-sp2c-COF.
Figure S42. Transient photocurrent response at different potentials in aqueous solution vs RHE under
intermittent light irradiation for Re-Bpy-sp2c-COF.

Figure S43. Stability and reusability test using Re-Bpy-sp2c-COF (1mg) (a) and Re(Bpy)(CO)3Cl
(0.97 umol) (b) as a photocatalyst under visible light irradiation (λ > 420 nm) in 5 mL MeCN/TEOA
(30/1) solvent for 50 h and 10 h.
Figure S44. Experimentally observed powder X-ray diffraction pattern of Re-Bpy-sp2c-COF before and after 50 hours irradiation

Figure S45. Transient absorption spectra of (a) Re-Bpy-sp2c-COF and (c) Bpy-sp2c-COF in pure
acetonitrile; and (e) Re-Bpy-sp2c-COF and (g) Bpy-sp2c-COF in a 30:1 mixture of acetonitrile and
TEOA at pump-probe time delays chosen to highlight the changing nature of the excited electronic
states probed. Complete transient absorption surface probed (b) Re-Bpy-sp2c-COF and (d) Bpy-sp2c-
COF in pure acetonitrile and (f) Re-Bpy-sp2c-COF and (h) Bpy-sp2c-COF in a 30:1 mixture of
acetonitrile and TEOA. In the presence of TEOA we again find that the TA signals are significantly
weaker with Re-Bpy-sp2c-COF, figure S44. The ground state bleach of Re-Bpy-sp2c-COF centred at
ca. 540 nm is significantly (ca. 85%, 1 ps) diminished in the presence of TEOA even at the earliest
timescales studied indicating that the TEOA is able to act as an electron-donor. Interestingly the addition
of TEOA to Bpy-sp2c-COF leads to only weak signals being recorded in the TA spectrum indicating
that TEOA is able to reductively quench the excited states probed by with wavelengths employed in the
TA experiment – in contrast to results of the TCSPC experiments.

Figure S46. Transient absorption kinetics recorded at 550 nm following 400 nm excitation of the
samples indicated in CH3CN.

18. Control experiments and previously reported data
Table S2. Photocatalytic CO2 reduction using different experimental conditions.
Entry Photocatalyst CO (μmol) H2 (μmol)
Re
content
(μmol)
TON
(CO)
CO selectivity
(%)
1[a] Re-Bpy-sp2c-COF 12.48 2.99 0.97 12.9 80.7
2[a]Re-Bpy-sp2c-COF +
dye16.80 2.64 0.97 17.3 86.4
3[a] Bpy-sp2c-COF 0.21 n.d. 0 / /
4[b] Re-Bpy-sp2c-COF 0.18 3.42 0.97 0.2 5.0
5[c] Re-Bpy-sp2c-COF n.d. n.d. 0.97 / /
6[d] Re-Bpy-sp2c-COF n.d. n.d. 0.97 / /
7[e] Re-Bpy-sp2c-COF 2.32 0.76 0.97 2.4 75.2
8[b]Re-Bpy-sp2c-COF +
dye0.22 6.14 0.97 0.2 3.4
9[f]Bpy-sp2c-COF +
dye0.19 n.d. 0 / /
10[f] dye n.d. n.d. 0 / /
11[f] Re-Bpy-sp2c-P 1.15 0.07 0.50 2.3 94.5
12[f]Re-Bpy-sp2c-P +
dye3.45 0.74 0.50 6.9 82.4
13 Bpy-sp2c-P - 0.18 0 / -
14 Bpy-sp2c-P + dye 0.19 0.18 0 / 70.4
15[g] Re(bpy)(CO)3Cl 10.03 0.67 0.97 10.3 93.8
[a] Reaction conditions: Photocatalyst (1 mg), solvent (5 mL, acetonitrile/TEOA = 30 : 1), CO2 (1 atm.), 300 W
Xe light source equipped with λ > 420 nm cut-off filter, 12 hours; [b]Ar atmosphere instead of CO2; [c]In the dark; [d]Without TEOA; [e] Acetonitrile was replaced with dimethylformamide; [f]Solvent (5 mL, acetonitrile/TEOA =
30 : 1), CO2 (1 atm.), 300 W Xe light source equipped with λ > 420 nm cut-off filter, 12 hours; [g]Photocatalyst
(0.45 mg, 0.97 μmol), Solvent (5 mL, acetonitrile/TEOA = 30 : 1), CO2 (1 atm.), 300 W Xe light source equipped
with λ > 420 nm cutoff filter, 12 hours; Dye: (Ir[dF(CF3)ppy]2(dtbpy))PF6; n.d.: none detected.

Table S3. Previously reported photocatalytic CO2 reduction using COFs.
Photocatalyst
Main products and highest yield (μmol h-1 g-1)
TON Selectivity Reaction solvent
Irradiation condition Reference
Re-bpy-sp2c-COF 1040 (CO) 18.7 (17.5 h) 80.7% (CO)
MeCN / TEOA (30/1)
λ > 420 nm (300 W Xe
light source)This work
Re-Bpy-sp2c-COF(Ir[dF(CF3)ppy]2(dtb
py))PF6
1400 (CO) 7.2 (5 h) 86.4% (CO)MeCN / TEOA (30/1)
λ > 420 nm (300 W Xe
light source)This work
Re-COF~15 mmol
CO/g>20h
48 98%(CO)
MeCN / TEOA(3:0.2)
λ > 420 nm (225 W Xe
light source)5
Ni-TpBpy-COF[Ru(bpy)3]Cl2
966 (CO) 13.6 96%(CO)
MeCN / H2O / TEOA(3/1/1)
λ ≥ 420 nm (300 W Xe
light source)11
Re-TpBpy-COF 270 (CO) - -
MeCN / H2O (10/1.8 mL), 0.1 M
TEOA
λ > 390 nm (200 W Xe
light source)12
DQTP-COF-Co[Ru(bpy)3]Cl2
1020 (CO) 2.18 59.4%(CO)
MeCN / TEOA (4/1)
λ ≥ 420 nm (300 W Xe
light source)13
ACOF-1 0.36 (CH3OH) - -
CO2 and H2O (0.4
MPa, 80 °C)
800 nm ≥ λ ≥ 420 nm
(500 W Xe light source)
14
N3-COF 0.57 (CH3OH) - -
CO2 and H2O (0.4
MPa, 80 °C)
800 nm ≥ λ ≥ 420 nm
(500 W Xe light source)
14
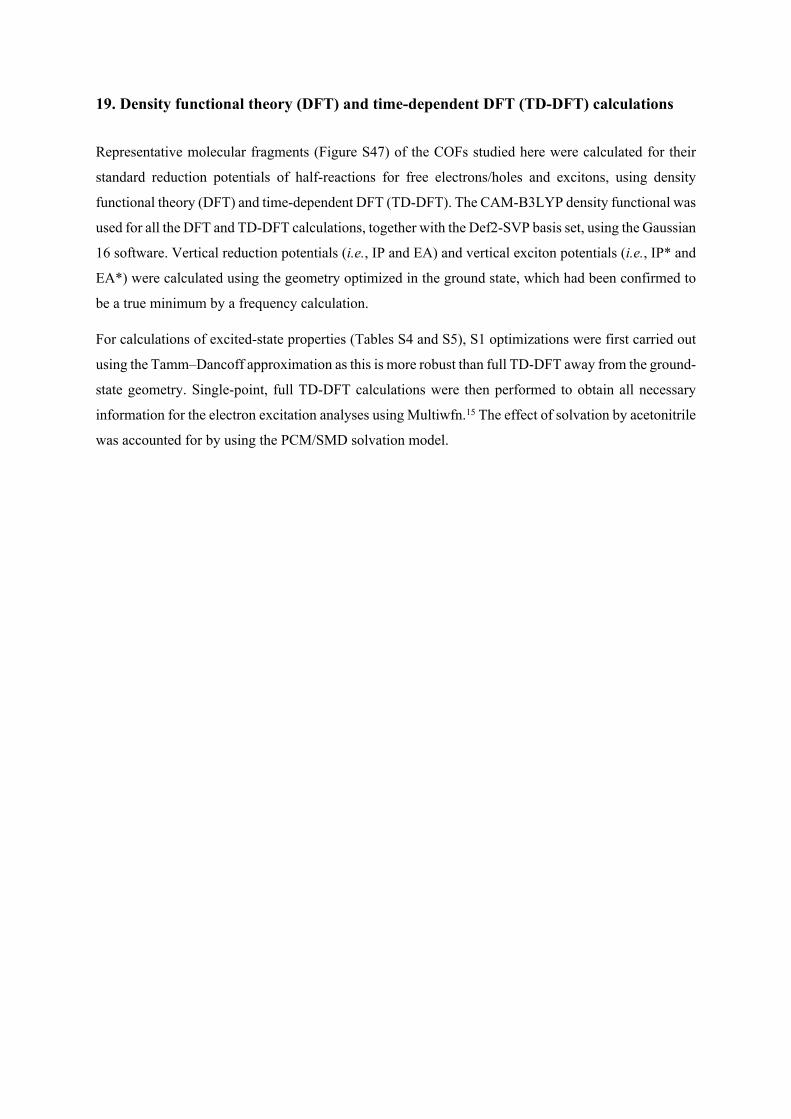
19. Density functional theory (DFT) and time-dependent DFT (TD-DFT) calculations
Representative molecular fragments (Figure S47) of the COFs studied here were calculated for their
standard reduction potentials of half-reactions for free electrons/holes and excitons, using density
functional theory (DFT) and time-dependent DFT (TD-DFT). The CAM-B3LYP density functional was
used for all the DFT and TD-DFT calculations, together with the Def2-SVP basis set, using the Gaussian
16 software. Vertical reduction potentials (i.e., IP and EA) and vertical exciton potentials (i.e., IP* and
EA*) were calculated using the geometry optimized in the ground state, which had been confirmed to
be a true minimum by a frequency calculation.
For calculations of excited-state properties (Tables S4 and S5), S1 optimizations were first carried out
using the Tamm–Dancoff approximation as this is more robust than full TD-DFT away from the ground-
state geometry. Single-point, full TD-DFT calculations were then performed to obtain all necessary
information for the electron excitation analyses using Multiwfn.15 The effect of solvation by acetonitrile
was accounted for by using the PCM/SMD solvation model.

Figure S47. Representative molecular models (a) Bpy-sp2c(L) and (b) Re-Bpy-sp2c(L) of Bpy-sp2c-
COF and Re-Bpy-sp2c-COF, respectively, together with fragment definition for inter-fragment charge
transfer calculations.
Figure S48. (TD-)CAM-B3LYP calculated IP, EA, and IP* potentials of (Ir[dF(CF3)ppy]2(dtbpy))-
(dey), Bpy-sp2c(L) and Re-Bpy-sp2c(L). Dashed coloured lines indicate the potentials for CO2 reduction
to CO, proton reduction, and TEOA oxidation, respectively.

Table S4. Calculated TD-DFT (TD-CAM-B3LYP) excitation energies for the lowest transition (E),
oscillator strengths (f), and composition in terms of molecular orbital contributions. ∆r is state-specific
charge-transfer length.
State Composition a E (eV, nm) f ∆r (Å) 16
Bpy-sp2c(L) S1 84.8% H → L 2.4537 (505.29) 2.52 5.49S2 35.1% H-2 → L;
13.9% H-1 → L+1; 12.0% H → L+2
3.2197 (385.08) 1.50 8.72
S3 32.8% H-1 → L+1; 17.7% H-1 → L+2; 11.0% H-2 → L
3.3683 (368.09) 1.09 10.45
Re-Bpy-sp2c(L) S1 76.0% H → L; 10.2% H → L+1
2.3880 (519.19) 2.64 7.61
S2 49.8% H-2 → L 3.1047 (399.34) 0.47 6.80S3 30.0% H-4 → L;
16.7% H-2 → L3.1889 (388.80) 0.80 6.29
a H = HOMO, L = LUMO

Table S5. Calculated inter-fragment charge transfer (in number of electrons) in the excited state (TD-
CAM-B3LYP), with fragment definitions shown in Figure S47. Arrows indicate the electron transfer
direction between the fragments; a negative value for the net transfer means that the electrons are
transferred in the opposite direction to the one indicated by the arrow.
Bpy-sp2c(L)1st Excited state
1 → 2: 0.00 1 ← 2: 0.00 Net 1 → 2: 0.001 → 3: 0.12 1 ← 3: 0.25 Net 1 → 3: -0.142 → 3: 0.00 2 ← 3: 0.00 Net 2 → 3: 0.00
2nd Excited state1 → 2: 0.08 1 ← 2: 0.11 Net 1 → 2: -0.031 → 3: 0.13 1 ← 3: 0.16 Net 1 → 3: -0.022 → 3: 0.10 2 ← 3: 0.08 Net 2 → 3: 0.01
3rd Excited state1 → 2: 0.07 1 ← 2: 0.13 Net 1 → 2: -0.061 → 3: 0.03 1 ← 3: 0.05 Net 1 → 3: -0.022 → 3: 0.13 2 ← 3: 0.13 Net 2 → 3: 0.00
Re-Bpy-sp2c(L)1st Excited state
1 → 2: 0.00 1 ← 2: 0.00 Net 1 → 2: 0.001 → 3: 0.11 1 ← 3: 0.31 Net 1 → 3: -0.202 → 3: 0.00 2 ← 3: 0.00 Net 2 → 3: 0.00
2nd Excited state1 → 2: 0.05 1 ← 2: 0.07 Net 1 → 2: -0.011 → 3: 0.15 1 ← 3: 0.13 Net 1 → 3: 0.022 → 3: 0.02 2 ← 3: 0.01 Net 2 → 3: 0.01
3rd Excited state1 → 2: 0.09 1 ← 2: 0.13 Net 1 → 2: -0.031 → 3: 0.12 1 ← 3: 0.12 Net 1 → 3: 0.012 → 3: 0.04 2 ← 3: 0.03 Net 2 → 3: 0.01

Figure S49. The frontier orbitals of Bpy-sp2c(L) in the excited state (TD-CAM-B3LYP/Def2SVP);
isodensity = 0.03 a.u. The major contribution to each of the first three electronic excitations is indicated
by the arrow, together with the state, excitation energy (eV, nm), oscillator strength and percentage of
the transition.
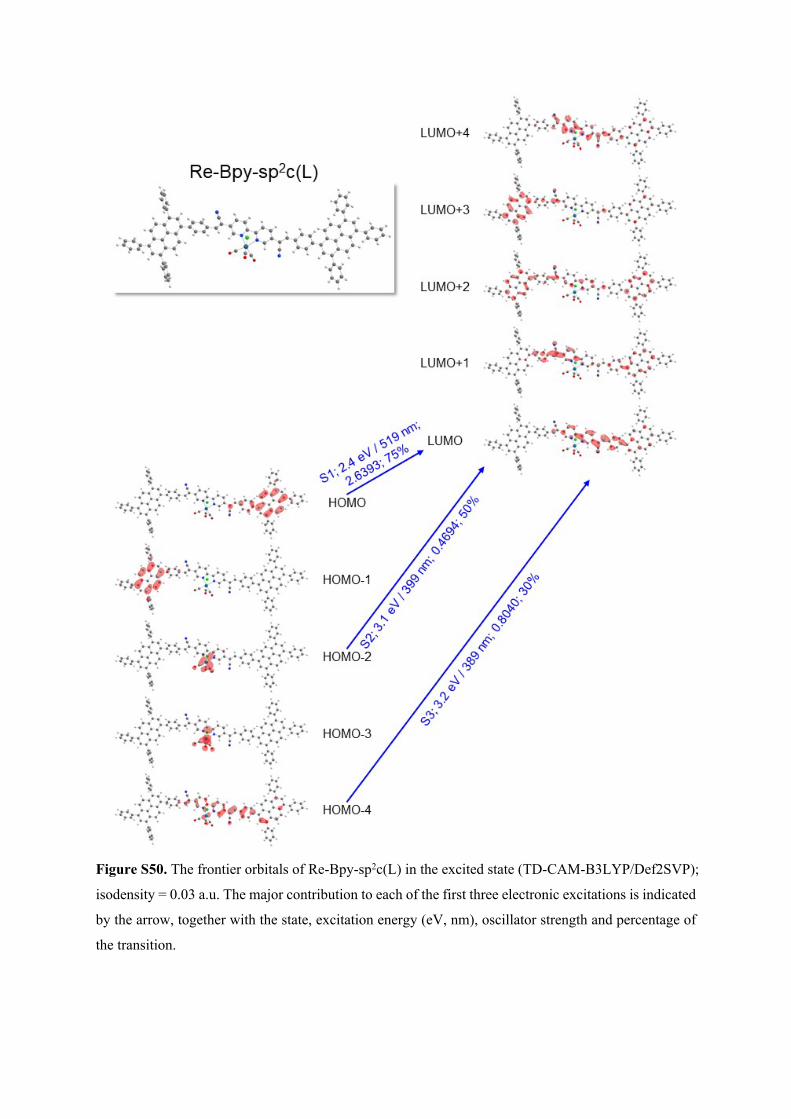
Figure S50. The frontier orbitals of Re-Bpy-sp2c(L) in the excited state (TD-CAM-B3LYP/Def2SVP);
isodensity = 0.03 a.u. The major contribution to each of the first three electronic excitations is indicated
by the arrow, together with the state, excitation energy (eV, nm), oscillator strength and percentage of
the transition.

Figure S51. Figure showing simulated positioning of the (Ir[dF(CF3)ppy]2(dtbpy))+ dye inside the Re-
Bpy-sp2c-COF crystal structure, viewed parallel to the pore channel along the crystallographic c-axis
(a) and perpendicular to the layers (b). This model shows just one possible low-energy adsorption site
in the COF pore channel, mostly to highlight the relative size of the dye molecule with respect to the
channels of the COF (the channel is large enough to accommodate multiple dye molecules).
References
1. Liao, L. Y.; Kong, X. R.; Duan, X. F. Reductive Couplings of 2-Halopyridines without External
Ligand: Phosphine-Free Nickel-Catalyzed Synthesis of Symmetrical and Unsymmetrical 2,2’-
Bipyridines. J. Org. Chem. 2014, 79 (2), 777-782.
2. Rabbani, M. G.; Sekizkardes, A. K.; El-Kadri, O. M.; Kaafarani, B. R.; El-Kaderi, H. M. Pyrene-
Directed Growth of Nanoporous Benzimidazole-Linked Nanofibers and Their Application to
Selective CO2 Capture and Separation. J. Mater. Chem. 2012, 22 (48), 25409-25417.
3. Coelho, A. A. TOPAS and TOPAS-Academic: an optimization program integrating computer
algebra and crystallographic objects written in C++. J. Appl. Crystallogr. 2018, 51 (1), 210–218.
4. Zhang, T.; Hou, Y.; Dzhagan, V.; Liao, Z.; Chai, G.; Löffler, M.; Olianas, D.; Milani, A.; Xu, S.;
Tommasini, M.; Zahn, D.; Zheng, Z.; Zschech, E.; Jordan, R.; Feng, X. Copper-surface-mediated
synthesis of acetylenic carbon-rich nanofibers for active metal-free photocathodes. Nature
communications, 2018, 9(1), 1140.
5. Yang, S.; Hu, W.; Zhang, X.; He, P.; Pattengale, B.; Liu, C.; Cendejas, M.; Hermans, I.; Zhang, X.;
Zhang, J.; Huang, J. 2D Covalent Organic Frameworks as Intrinsic Photocatalysts for Visible Light-
Driven CO2 Reduction. J. Am. Chem. Soc. 2018, 140 (44), 14614-14618.
6. Schneider, T. W.; Ertem, M. Z.; Muckerman, J. T.; Angeles-Boza, A. M. Mechanism of
Photocatalytic Reduction of CO2 by Re(Bpy)(CO)3Cl from Differences in Carbon Isotope
Discrimination. ACS Catal. 2016, 6 (8), 5473-5481.
7. Wang, X.; Chen, L.; Chong, S. Y.; Little, M. A.; Wu, Y.; Zhu, W. H.; Clowes, R.; Yan, Y.;
Zwijnenburg, M. A.; Sprick, R. S.; Cooper, A. I. Sulfone-Containing Covalent Organic Frameworks
for Photocatalytic Hydrogen Evolution from Water. Nat. Chem. 2018, 10 (12), 1180–1189.
8. Sprick, R. S.; Bai, Y.; Guilbert, A. A. Y.; Zbiri, M.; Aitchison, C. M.; Wilbraham, L.; Yan, Y.;
Woods, D. J.; Zwijnenburg, M. A.; Cooper, A. I. Photocatalytic Hydrogen Evolution from Water
Using Fluorene and Dibenzothiophene Sulfone-Conjugated Microporous and Linear Polymers.
Chem. Mater. 2019, 31 (2), 305-313.
9. Gao, C.; Chen, S.; Wang, Y.; Wang, J.; Zheng, X.; Zhu, J.; Song, L.; Zhang, W., Xiong, Y.
Heterogeneous single‐atom catalyst for visible‐light‐driven high‐turnover CO2 reduction: the role
of electron transfer. Advanced Materials, 2018, 30 (13), 1704624.
10. Chen, J. K.; Yang, S. M.; Li, B. H.; Lin, C. H.; Lee, S. Fluorescence quenching investigation of
methyl red adsorption on aluminum-based metal–organic frameworks. Langmuir, 2018, 34(4),
1441-1446.
11. Zhong, W.; Sa, R.; Li, L.; He, Y.; Li, L.; Bi, J.; Zhuang, Z.; Yu, Y.; Zou, Z. A Covalent Organic
Framework Bearing Single Ni Sites as a Synergistic Photocatalyst for Selective Photoreduction of
CO2 to CO. J. Am. Chem. Soc. 2019, 141, 7615–7621.
12. Li, S. Y.; Meng, S.; Zou, X.; El-Roz, M.; Telegeev, I.; Thili, O.; Liu, T. X.; Zhu, G. Rhenium-

Functionalized Covalent Organic Framework Photocatalyst for Efficient CO2 Reduction under
Visible Light. Microporous Mesoporous Mater. 2019, 285, 195–201.
13. Lu, M.; Li, Q.; Liu, J.; Zhang, F. M.; Zhang, L.; Wang, J. L.; Kang, Z. H.; Lan, Y. Q. Installing
Earth-Abundant Metal Active Centers to Covalent Organic Frameworks for Efficient
Heterogeneous Photocatalytic CO2 Reduction. Appl. Catal. B Environ. 2019, 254, 624–633.
14. Fu, Y.; Zhu, X.; Huang, L.; Zhang, X.; Zhang, F.; Zhu, W. Azine-Based Covalent Organic
Frameworks as Metal-Free Visible Light Photocatalysts for CO2 Reduction with H2O. Appl. Catal.
B Environ. 2018, 239, 46–51.
15. Lu, T.; Chen, F. Multiwfn: a multifunctional wavefunction analyzer. Journal of computational
chemistry, 2012, 33(5), 580-592.
16. Guido, C. A.; Cortona, P.; Mennucci, B.; Adamo, C. On the metric of charge transfer molecular excitations: a simple chemical descriptor. Journal of chemical theory and computation, 2013, 9(7), 3118-3126.