DIOCESAN SOCIAL PROFILE - National Centre for Pastoral ... · This social profile, produced for...
32
DIOCESAN SOCIAL PROFILE Based on the 2016 Australian Census Archdiocese of Melbourne
Transcript of DIOCESAN SOCIAL PROFILE - National Centre for Pastoral ... · This social profile, produced for...
DIOCESAN SOCIAL PROFILE Based on the 2016 Australian Census
Archdiocese of Melbourne

Date of report: September 2019
Report prepared by: National Centre for Pastoral Research
Australian Catholic Bishops Conference
GPO Box 368
Canberra ACT 2601
Australia
Telephone: +61 (02) 6201 9812
Email: [email protected]
Web: www.ncpr.catholic.org.au
IMPORTANT COPYRIGHT INFORMATION
Most statistics in this profile have been derived by the National Centre for Pastoral Research of the Australian Catholic Bishops
Conference from customised Census tables purchased from the Australian Bureau of Statistics as part of the National Catholic Census
Project 1991-2016.
All Census data is copyright © Commonwealth of Australia.
You are free to reproduce this document or any part of it. If any tables, graphs or individual items of data are extracted from this
document for use in reports or presentations or in any other way, please attribute the source of the material as follows:
'This material was prepared by the National Centre for Pastoral Research of the Australian Catholic Bishops Conference from Census
data obtained from the Australian Bureau of Statistics.' A shorter form is also acceptable: 'Prepared by the ACBC National Centre for
Pastoral Research from ABS data.'
DIOCESAN SOCIAL PROFILE Based on the 2016 Australian Census
Archdiocese of Melbourne

AUSTRALIAN CATHOLIC BISHOPS CONFERENCE Australian Catholic Council for Pastoral Research
September 2019
Dear readers,
The Australian Catholic Bishops Conference is pleased to make available to you this profile of the Catholic
population of your diocese.
I hope that you will find it to be a valuable tool for your diocese’s pastoral planning by helping you understand
the local Catholic community and assess its needs. Diocesan pastoral councils and diocesan agencies in
particular will find it a useful resource.
The data in this profile have been sourced from the Australian Census, which is carried out every five years by
the Australian Bureau of Statistics. Most of the data comes from the 2016 Census, but some comparisons are
provided with 2011 and earlier years.
It is important to remember that most of the data in this profile applies to all those people living within the
boundaries of your diocese who identified themselves as Catholic in the Census. Census data inform us about
a population's demographic characteristics, but not about their religious practice.
This social profile, produced for every Catholic parish and diocese in Australia, is an outcome of the National
Catholic Census Project established by the Bishops Conference at the time of the 1991 Census. This project is
managed by the ACBC National Centre for Pastoral Research. The Australian Catholic Council for Pastoral
Research is most grateful to the Centre’s staff for the work that they do in providing demographic resources
for parishes and dioceses, including this social profile.
This profile is provided to you free of charge by the Bishops Conference as part of its commitment to the
support of parish and diocesan life. I trust that you find it informative, useful and thought-provoking.
Yours sincerely,
(Professor) Gabrielle McMullen AM
Chair, Australian Catholic Council for Pastoral Research
Diocesan Social Profile
Page
Diocesan snapshot .................................................... 2 What has changed since 1996? ................................ 3
Overview Tables Page
1. Population ........................................................... 4 2. Disability .............................................................. 4 3. Occupation and employment .............................. 5
4. Birthplace, Indigenous status and language ....... 5 5. Education ............................................................. 6 6. Marital status ...................................................... 7
7. Families ................................................................ 7
8. Households .......................................................... 7
Detailed Topics Page
Religious affiliation ................................................... 9 Age and sex ............................................................. 10
Disability ................................................................. 12 Marital status ......................................................... 13 Families ................................................................... 14 Households ............................................................. 16 Birthplace ............................................................... 17
Language ................................................................ 18 Attendance at educational institutions .................. 20 Educational qualifications ...................................... 22 Employment ........................................................... 23 Occupation ............................................................. 24
At a Glance (pages 2 and 3)
Provides a brief glance at some key demographic indicators for the diocese.
Diocesan Overview (pages 4-7)
Provides a clear overview of the Catholic community of the diocese, how it is changing and how it compares to other dioceses.
Diocesan Details (pages 9-25)
Provides much more detail about the Catholics of the diocese, allowing for deeper analysis of the nature of the Catholic community.

2
Archdiocese of Melbourne National Catholic Census Project 1991-2016
Principal source of data: Australian Bureau of Statistics – 2016 Census of Population and Housing
Know the diocesan community
Pastoral planning is the process of a Catholic community organising itself to carry out the mission of the Church in its own locality.
It is a process built upon a diocese’s knowledge in three areas:
• Knowing its vision—its aspiration for itself.
• Knowing what sort of people make up the Catholic community and the general community.
• Knowing the resources (strengths, gifts and circumstances) available to the diocese to realise the vision.
This Diocesan Social Profile has been developed as a resource for pastoral planning, and it focuses on the second two of these
three areas of knowledge.
The Church strongly encourages pastoral planning. As Pope John Paul II said:
“I earnestly exhort the Pastors of the particular Churches, with the help of all sectors of God's People, confidently to
plan the stages of the journey ahead, harmonising the choices of each diocesan community with those of
neighbouring Churches and of the universal Church ... It is not a matter of inventing a 'new program'. The program
already exists: it is the plan found in the Gospel and in the living Tradition.”
Novo Millennio Ineunte #29
By giving a clear picture of the diocese’s demographic reality, this profile helps the diocesan leaders name its strengths and
shortcomings and better understand how it might use the resources it has to pursue the mission of the Church.
A SNAPSHOT OF THE DIOCESE (2016)
Total Population: 4,554,459
Catholic Population: 1,067,030
Catholics make up 23.4 per cent of the total population
Median age of Catholics is 40 years
Total Catholic families: 388,837
94,162 Catholics live alone
320,197 Catholics were born overseas
42,538 Catholics do not speak English well
66,436 Catholics need assistance with core activities
292,814 Catholics have changed address since 2011
3
Archdiocese of Melbourne National Catholic Census Project 1991-2016 Principal source of data: Australian Bureau of Statistics – 2016 Census of Population and Housing
What has changed in the
diocesan community since 1996?
Diocese in
2016
Diocese in
2001
Diocese in
2006
Diocese in
2011
Diocese in
1996
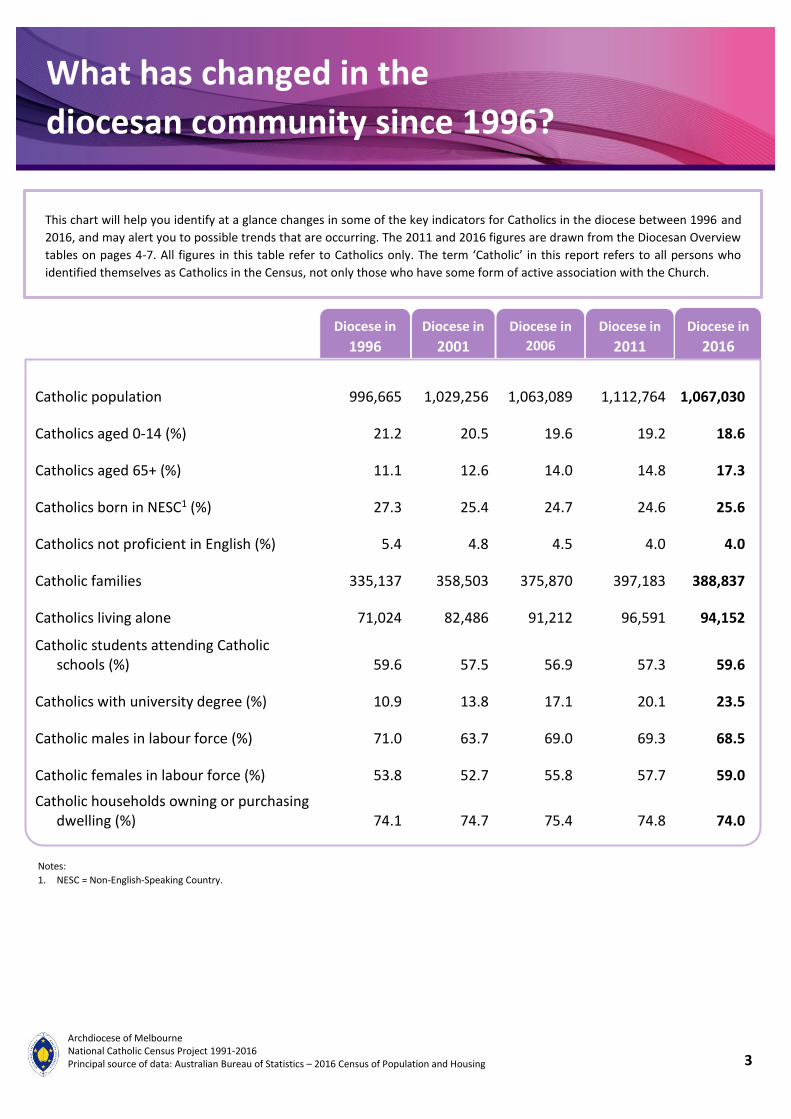
Catholic population 996,665 1,029,256 1,063,089 1,112,764 1,067,030
Catholics aged 0-14 (%) 21.2 20.5 19.6 19.2 18.6
Catholics aged 65+ (%) 11.1 12.6 14.0 14.8 17.3
Catholics born in NESC1 (%) 27.3 25.4 24.7 24.6 25.6
Catholics not proficient in English (%) 5.4 4.8 4.5 4.0 4.0
Catholic families 335,137 358,503 375,870 397,183 388,837
Catholics living alone 71,024 82,486 91,212 96,591 94,152
Catholic students attending Catholic schools (%) 59.6 57.5 56.9 57.3 59.6
Catholics with university degree (%) 10.9 13.8 17.1 20.1 23.5
Catholic males in labour force (%) 71.0 63.7 69.0 69.3 68.5
Catholic females in labour force (%) 53.8 52.7 55.8 57.7 59.0
Catholic households owning or purchasing dwelling (%) 74.1 74.7 75.4 74.8 74.0
This chart will help you identify at a glance changes in some of the key indicators for Catholics in the diocese between 1996 and
2016, and may alert you to possible trends that are occurring. The 2011 and 2016 figures are drawn from the Diocesan Overview
tables on pages 4-7. All figures in this table refer to Catholics only. The term ‘Catholic’ in this report refers to all persons who
identified themselves as Catholics in the Census, not only those who have some form of active association with the Church.
Notes:
1. NESC = Non-English-Speaking Country.
4
Archdiocese of Melbourne National Catholic Census Project 1991-2016
Principal source of data: Australian Bureau of Statistics – 2016 Census of Population and Housing
Overview
Diocese
2016 Rank
Diocese
2011 Rank
Australia
2016
Australia
2011
Diocese
2011
Diocese
2016
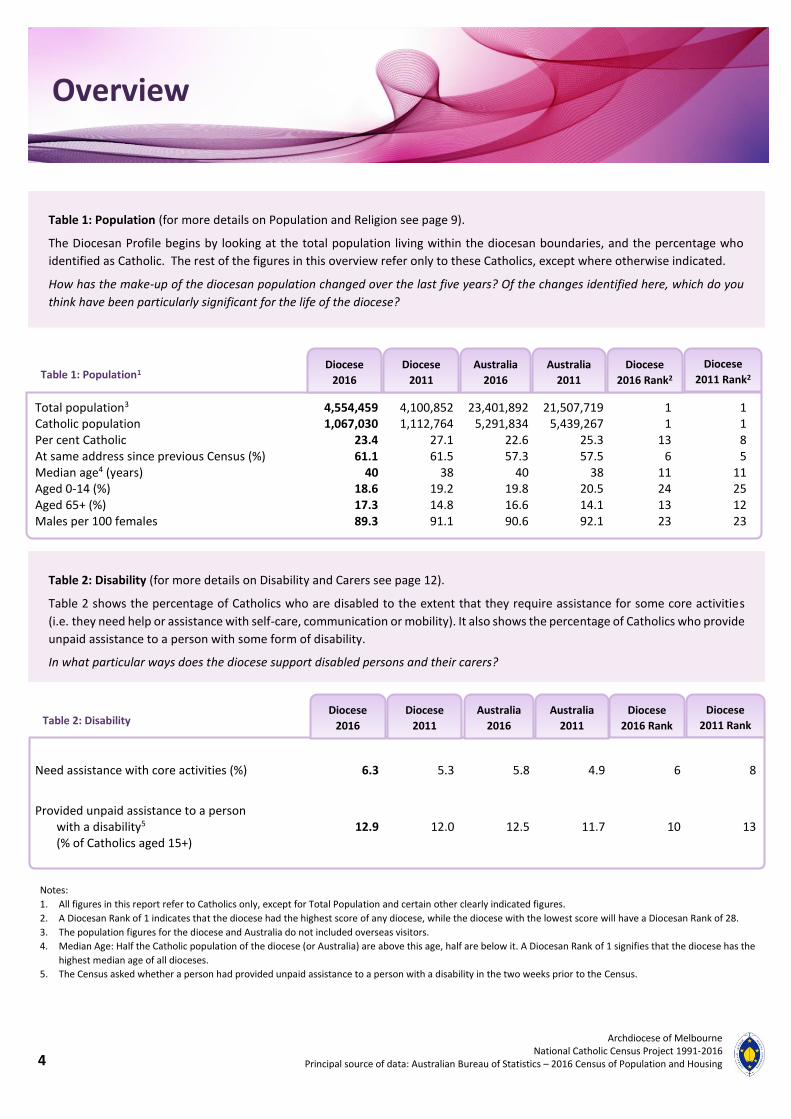
Need assistance with core activities (%) 6.3 5.3 5.8 4.9 6 8
Provided unpaid assistance to a person with a disability5 (% of Catholics aged 15+)
12.9 12.0 12.5 11.7 10 13
Total population3 4,554,459 4,100,852 23,401,892 21,507,719 1 1 Catholic population 1,067,030 1,112,764 5,291,834 5,439,267 1 1 Per cent Catholic 23.4 27.1 22.6 25.3 13 8 At same address since previous Census (%) 61.1 61.5 57.3 57.5 6 5 Median age4 (years) 40 38 40 38 11 11 Aged 0-14 (%) 18.6 19.2 19.8 20.5 24 25 Aged 65+ (%) 17.3 14.8 16.6 14.1 13 12 Males per 100 females 89.3 91.1 90.6 92.1 23 23
Table 1: Population (for more details on Population and Religion see page 9).
The Diocesan Profile begins by looking at the total population living within the diocesan boundaries, and the percentage who
identified as Catholic. The rest of the figures in this overview refer only to these Catholics, except where otherwise indicated.
How has the make-up of the diocesan population changed over the last five years? Of the changes identified here, which do you
think have been particularly significant for the life of the diocese?
Australia
2016
Australia
2011
Diocese
2016 Rank2
Diocese
2011 Rank2
Diocese
2011
Diocese
2016 Table 1: Population1
Table 2: Disability (for more details on Disability and Carers see page 12).
Table 2 shows the percentage of Catholics who are disabled to the extent that they require assistance for some core activities
(i.e. they need help or assistance with self-care, communication or mobility). It also shows the percentage of Catholics who provide
unpaid assistance to a person with some form of disability.
In what particular ways does the diocese support disabled persons and their carers?
Table 2: Disability
Notes:
1. All figures in this report refer to Catholics only, except for Total Population and certain other clearly indicated figures.
2. A Diocesan Rank of 1 indicates that the diocese had the highest score of any diocese, while the diocese with the lowest score will have a Diocesan Rank of 28.
3. The population figures for the diocese and Australia do not included overseas visitors.
4. Median Age: Half the Catholic population of the diocese (or Australia) are above this age, half are below it. A Diocesan Rank of 1 signifies that the diocese has the
highest median age of all dioceses.
5. The Census asked whether a person had provided unpaid assistance to a person with a disability in the two weeks prior to the Census.

5
Archdiocese of Melbourne National Catholic Census Project 1991-2016 Principal source of data: Australian Bureau of Statistics – 2016 Census of Population and Housing
Overview
Australia
2016
Australia
2011
Diocese
2011
Diocese
2016 Rank
Diocese
2011 Rank Diocese
2016
Managers and Professionals1
(% of those recording an occupation) 36.0 34.4 34.1 33.0 4 4
Workers in ‘blue collar’ occupations2
(% of those recording an occupation) 27.2 28.7 29.6 30.6 25 25
Men, employed or seeking work3 (%) 68.5 69.3 69.7 69.6 15 13 Women, employed or seeking work3 (%) 59.0 57.7 60.6 58.5 16 14 Unemployed at time of Census4 (%) 5.6 4.7 5.8 5.0 16 16 Youth unemployed at time of Census5 (%) 12.8 10.2 12.2 10.2 11 14
Born overseas in English-speaking country6 4.4 4.5 5.6 5.7 11 13 Born overseas in non-English-speaking country (%) 25.6 24.6 19.1 17.9 3 3 Immigrants from non-English-speaking countries
arriving in Census year or previous 3 years 25,297 23,936 106,428 98,723 1 1
Indigenous Australians 4,990 4,252 133,528 124,610 13 15 Speak language other than English at home (%) 28.1 27.1 20.4 19.0 4 4 Not proficient in English7 (%) 4.0 4.0 2.6 2.6 2 3
Table 3: Employment (for more details on Occupation and Employment see pages 23-25).
The extent to which people are involved in the labour force, and the type of work they are doing, influences and shapes many
aspects of the community’s life.
How might the changes in the employment status of Catholics over the last five years have affected the diocese?
Australia
2016
Australia
2011
Diocese
2016 Rank
Diocese
2011 Rank
Diocese
2011
Diocese
2016 Table 3: Employment
Table 4: Birthplace and Language (for more details on Birthplace and Language see pages 17-19).
This table begins to explore the ethnic balance of the diocese’s Catholic community, which in itself may raise issues of
communication and inclusiveness.
Is there a need for the diocese to review the way it addresses the needs of recently arrived Catholic migrants? How does the cultural
mix of the diocese compare to that in the rest of Australia?
Table 4: Birthplace, Indigenous Status &
Language
Notes:
1. This group includes, for example, farmers and farm managers, sales, marketing and production managers, education and health service managers, retail managers,
school principals and school teachers, medical practitioners, nurses, scientists, arts and media professionals, accountants, engineers and IT professionals.
2. This group includes, for example, toolmakers, technicians, electricians, carpenters, plumbers, bakers and chefs, veterinary nurses, hairdressers, machinery
operators, drivers, cleaners and labourers.
3. The percentage of Catholics aged 15+ who are in the labour force (i.e. employed or seeking employment).
4. The percentage of Catholics aged 15+ who are in the labour force and were unemployed at the time of the Census.
5. The percentage of Catholics aged 15-24 who are in the labour force and were unemployed at the time of the Census.
6. New Zealand, United Kingdom, Ireland, United States, Canada and South Africa.
7. Percentage of all Catholics who reported that they spoke English not well, or not at all.
6
Archdiocese of Melbourne National Catholic Census Project 1991-2016
Principal source of data: Australian Bureau of Statistics – 2016 Census of Population and Housing
Overview
Australia
2016
Australia
2011
Diocese
2016 Rank
Diocese
2011 Rank
Diocese
2011
Diocese
2016
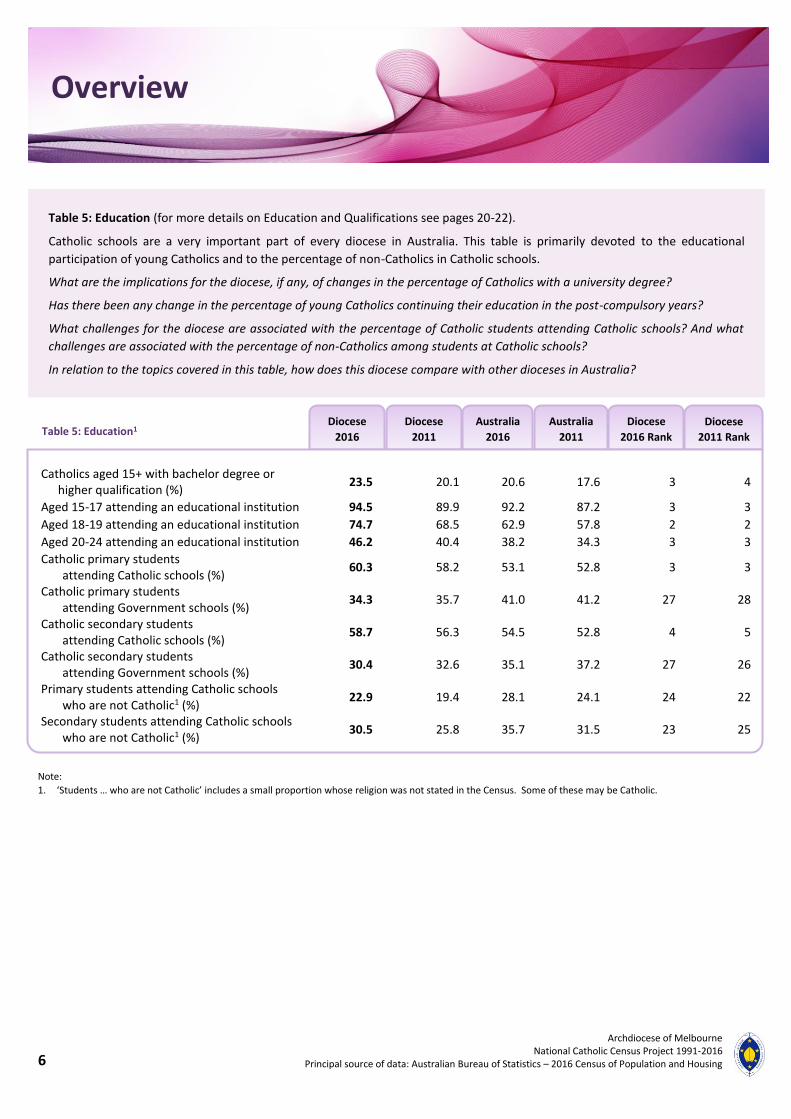
Catholics aged 15+ with bachelor degree or higher qualification (%)
23.5 20.1 20.6 17.6 3 4
Aged 15-17 attending an educational institution 94.5 89.9 92.2 87.2 3 3
Aged 18-19 attending an educational institution 74.7 68.5 62.9 57.8 2 2
Aged 20-24 attending an educational institution 46.2 40.4 38.2 34.3 3 3
Catholic primary students attending Catholic schools (%)
60.3 58.2 53.1 52.8 3 3
Catholic primary students attending Government schools (%)
34.3 35.7 41.0 41.2 27 28
Catholic secondary students attending Catholic schools (%)
58.7 56.3 54.5 52.8 4 5
Catholic secondary students attending Government schools (%)
30.4 32.6 35.1 37.2 27 26
Primary students attending Catholic schools who are not Catholic1 (%)
22.9 19.4 28.1 24.1 24 22
Secondary students attending Catholic schools who are not Catholic1 (%)
30.5 25.8 35.7 31.5 23 25
Table 5: Education (for more details on Education and Qualifications see pages 20-22).
Catholic schools are a very important part of every diocese in Australia. This table is primarily devoted to the educational
participation of young Catholics and to the percentage of non-Catholics in Catholic schools.
What are the implications for the diocese, if any, of changes in the percentage of Catholics with a university degree?
Has there been any change in the percentage of young Catholics continuing their education in the post-compulsory years?
What challenges for the diocese are associated with the percentage of Catholic students attending Catholic schools? And what
challenges are associated with the percentage of non-Catholics among students at Catholic schools?
In relation to the topics covered in this table, how does this diocese compare with other dioceses in Australia?
Table 5: Education1
Note:
1. ‘Students … who are not Catholic’ includes a small proportion whose religion was not stated in the Census. Some of these may be Catholic.

7
Archdiocese of Melbourne National Catholic Census Project 1991-2016 Principal source of data: Australian Bureau of Statistics – 2016 Census of Population and Housing
Overview
Australia
2016
Australia
2011
Diocese
2016 Rank
Diocese
2011 Rank
Diocese
2011
Diocese
2016
Australia
2016
Australia
2011
Diocese
2016 Rank
Diocese
2011 Rank
Diocese
2011
Diocese
2016
Australia
2016
Australia
2011
Diocese
2016 Rank
Diocese
2011 Rank
Diocese
2011
Diocese
2016
Never married (%) 33.4 33.9 33.3 33.9 12 13 Married (%) 50.1 50.2 49.7 49.6 12 10 Divorced or Separated (%) 10.3 9.9 11.2 10.8 24 26 Widowed (%) 6.1 6.0 5.8 5.7 12 13
Families 388,817 397,183 1,997,833 2,019,556 1 1 One-parent families 45,853 48,145 231,370 239,340 1 1 One-parent families (% of all families) 11.8 12.1 11.6 11.9 13 10 Couples of mixed religions2 (%) 50.0 49.6 55.9 55.1 26 26 De facto couples (%) 15.6 14.3 17.7 16.2 26 25 Median annual family income3 ($) 102,912 88,486 100,270 86,401 8 10
Households 500,423 514,214 2,548,354 2,594,239 1 1 Persons living alone (aged under 35) 11,479 14,477 53,499 68,455 1 1 Persons living alone (aged 35+) 82,673 82,114 407,684 402,158 1 1 Persons living alone (total) 94,152 96,591 461,183 470,613 1 1 Persons living alone (% of all persons) 8.8 8.7 8.7 8.7 16 17 Dwellings owned or being purchased (%) 74.0 74.8 71.2 71.4 10 2 Median monthly housing loan repayment5 ($) 1,860 1,832 1,873 1,861 11 11
Table 8: Households4
in which at least one person is Catholic
Tables 6, 7 and 8: Marital status, Families and Households (for more details see pages 13-16).
In 2016, 82 per cent of Australia’s Catholics lived in a family setting, with a further nine per cent living alone. The most common
type of Catholic family was a couple family with children (45 per cent of all families where at least one person was a Catholic),
followed by couple families without children (35%) and one-parent families (parent Catholic, 12%).
Have you observed changes to marriage and family life in recent years? Do you think these changes are common to Australia as a
whole, or are they particularly prevalent in this diocese?
What programs and strategies does the diocese have in place to support families with children? One-parent families? Catholics
living alone? Catholics who are separated or divorced?
Table 6: Marital status of Catholics aged 15+
Table 7: Families1
in which at least one person is Catholic
Notes: 1. A family is defined by the Australian Bureau of Statistics as two or more persons, one of whom is at least 15 years of age, who are related by blood, marriage (registered or de facto), adoption, step or fostering, and who are usually resident in the same household. Family members who live elsewhere are not included in the Census definition. 2. Married or de facto couples where only one partner is Catholic as a percentage of all couples where at least one partner is Catholic. 3. Fifty per cent of families have a higher income, fifty per cent a lower income. Family income is the sum of the incomes of all family members aged 15 and over. 4. A household can consist of one or more families, non-family groups or persons living alone. 5. Fifty per cent of households with a housing loan pay a higher repayment, fifty per cent a lower figure.

8
Archdiocese of Melbourne National Catholic Census Project 1991-2016
Principal source of data: Australian Bureau of Statistics – 2016 Census of Population and Housing
Diocesan Details
CONTENTS OF THE DETAILED PROFILE
Tables Page
9: Religious affiliation by age .................................................................................................................. 9
10: Age by sex .........................................................................................................................................10
11a: Need for assistance with core activities by age .............................................................................12
11b: Provision of unpaid assistance by age ............................................................................................12
12: Registered marital status by sex and age .........................................................................................13
13: Religious affiliation of couple by social marital status .....................................................................13
14: Family composition by weekly family income..................................................................................14
15: Weekly family income by number of dependent children ...............................................................15
16: Social marital status by number of dependent children ..................................................................15
17: Household composition by tenure type ...........................................................................................16
18: Household composition by monthly housing loan repayment ........................................................16
19: Birthplace .........................................................................................................................................17
20: Language spoken at home by religious affiliation ............................................................................18
21: Language spoken at home by age ....................................................................................................19
22: Type of educational institution attending by religious affiliation ....................................................20
23: Type of educational institution attending by weekly income of student's family ...........................21
24: Highest qualification attained by age and sex .................................................................................22
25: Labour force status by age and sex ..................................................................................................23
26: Occupation by age and sex ...............................................................................................................24
27: Occupation by religious affiliation ...................................................................................................25
Graphs Page
Religious affiliation ................................................................................................................................... 9
Age profile of the Catholic population, 2011 & 2016.............................................................................11
Age-sex profile of the Catholic population, 2016 ...................................................................................11
Core need for assistance and provision of unpaid assistance by age ....................................................12
Change of address since 2011 by marital status ....................................................................................13
Weekly family income ............................................................................................................................15
Top 5 birthplaces of Catholics born overseas ........................................................................................17
Top 5 birthplaces with highest proportions of recent arrivals ...............................................................17
Language background of all students attending Catholic schools .........................................................20
Education participation rate...................................................................................................................20
Type of school being attended by Catholic students .............................................................................21
Labour force status by age .....................................................................................................................23
Occupation .............................................................................................................................................25

9
Archdiocese of Melbourne National Catholic Census Project 1991-2016 Principal source of data: Australian Bureau of Statistics – 2016 Census of Population and Housing
Religious affiliation
0-9 10-19 20-29 30-39 40-49 50-59 60-69 70-79 80+ Total
Western (Latin Rite) Catholic
126,432 136,745 126,524 132,773 151,412 142,121 111,409 77,035 52,700 1,057,151
Maronite Catholic 327 317 324 357 356 255 197 127 54 2,314 Melkite Catholic 48 64 80 44 65 85 68 40 19 513 Ukrainian Catholic 126 109 105 113 133 167 269 117 138 1,277 Chaldean Catholic 710 683 590 521 490 345 205 98 32 3,674 Syro-Malabar Catholic 618 332 103 511 406 86 27 7 - 2,090 Total Catholic 128,261 138,250 127,726 134,319 152,862 143,059 112,175 77,424 52,943 1,067,019 Per cent Catholic
(of total population in age group)
22.8 26.3 18.3 19.4 24.4 26.0 25.4 28.1 28.9 23.4
Anglican 23,809 30,703 25,530 30,468 49,400 56,429 58,312 45,046 33,013 352,710 Orthodox 22,855 25,307 20,449 23,791 36,501 27,210 20,892 21,445 12,753 211,203 Other Christian 47,145 51,362 53,395 56,852 62,709 67,854 64,908 46,081 32,699 483,005 Non-Christian 88,131 62,632 111,172 127,749 69,505 49,804 34,066 13,920 7,706 564,685 No Religion 203,113 174,444 289,997 251,600 201,304 155,932 109,565 46,210 23,312 1,455,477 Not Stated 48,936 42,469 69,751 66,272 55,495 50,172 41,035 25,593 20,629 420,352 Total Population 562,250 525,167 698,020 691,051 627,776 550,460 440,953 275,719 183,055 4,554,451
The Census question about religion is optional,
and just under ten per cent of people across
Australia chose not to answer it. Note that the
question is about religious identification rather
than religious practice or belief. For the 2016
Census, the ABS moved the ‘No Religion’
response category to be the first response
category in the religion question. Prior to 2016,
it was the last response category.
How does the number of Catholics in the 0-9
age group compare with the number of
children baptised in the diocese in the period
2007-2016?
What are the largest non-Catholic religious
groups? What involvement does the diocese
have in ecumenical and interfaith activities and
programs?
What challenges to the diocese are associated
with the increase in the number of people who
report that they have no religion?
Table 9: Religious
affiliation by age
Note: Since the 1996 Census, following consultation with the Eastern Catholic Bishops, Eastern Catholics have been counted separately from Western (or Latin
Rite) Catholics. Catholics belonging to the Chaldean, Maronite, Melkite, Syro-Malabar or Ukrainian Catholic Churches have been requested by their Bishops NOT to
tick the box marked 'Catholic' on the Census form, but rather to write, for example, 'Maronite Catholic' in the space provided. Those Eastern Catholics who were
unaware of this request and who ticked the 'Catholic' box are counted as Western Catholics.
Note: No Religion also includes Secular Beliefs and Other Spiritual Beliefs and No Religious
Affiliation
Not Stated also includes Inadequately Described.
0.0 5.0 10.0 15.0 20.0 25.0 30.0 35.0
Catholic
Anglican
Orthodox
Other Christian
Non-Christian
No Religion
Not stated
Per cent of population
Religious Affiliation(All persons)
10
Archdiocese of Melbourne National Catholic Census Project 1991-2016
Principal source of data: Australian Bureau of Statistics – 2016 Census of Population and Housing
DIOCESAN DETAILS Age and sex
Males
2016
Females
2016
Total
2016
Total
2011
0 5,122 4,811 9,933 11,696
1 5,749 5,515 11,264 13,333
2 5,974 5,858 11,832 13,465
3 6,345 6,051 12,396 14,046
4 6,590 6,275 12,865 14,511
5 6,699 6,384 13,083 14,700
6 6,951 6,854 13,805 14,606
7 7,040 6,899 13,939 14,402
8 7,325 7,020 14,345 14,353
9 7,496 7,305 14,801 14,588
10 7,316 7,110 14,426 14,761
11 7,286 6,919 14,205 14,613
12 7,243 6,937 14,180 14,893
13 7,092 6,894 13,986 14,898
14 6,930 6,859 13,789 14,797
15 6,947 6,750 13,697 14,979
16 6,764 6,909 13,673 15,072
17 6,886 6,706 13,592 14,978
18 6,858 6,647 13,505 14,818
19 6,552 6,640 13,192 14,766
20-24 31,729 32,671 64,400 71,469
25-29 29,669 33,659 63,328 70,494
30-34 30,780 35,898 66,678 71,821
35-39 31,577 36,071 67,648 79,126
40-44 34,631 39,460 74,091 85,021
45-49 36,791 41,978 78,769 82,500
50-54 35,416 39,914 75,330 75,056
55-59 31,367 36,364 67,731 63,716
60-64 26,103 31,685 57,788 59,950
65-69 24,388 30,006 54,394 46,399
70-74 19,127 23,060 42,187 39,928
75-79 15,750 19,490 35,240 33,160
80+ 20,989 31,954 52,943 45,754
Total 503,482 563,553 1,067,035 1,112,669
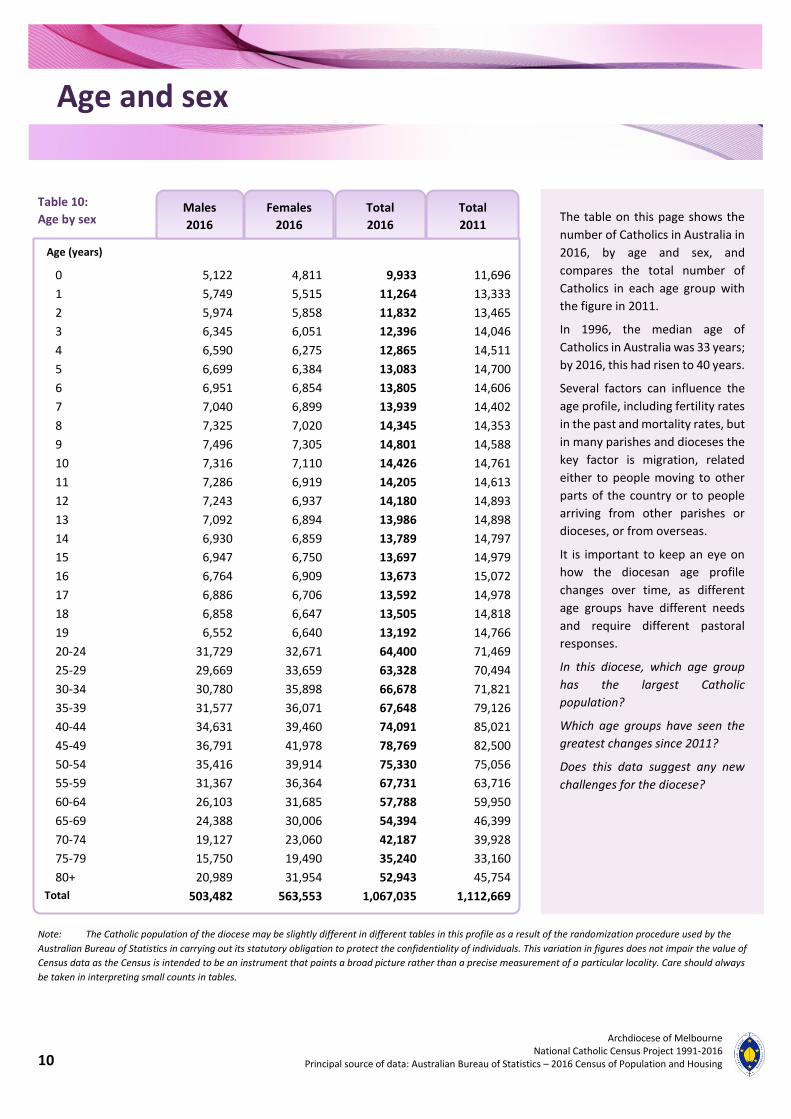
The table on this page shows the
number of Catholics in Australia in
2016, by age and sex, and
compares the total number of
Catholics in each age group with
the figure in 2011.
In 1996, the median age of
Catholics in Australia was 33 years;
by 2016, this had risen to 40 years.
Several factors can influence the
age profile, including fertility rates
in the past and mortality rates, but
in many parishes and dioceses the
key factor is migration, related
either to people moving to other
parts of the country or to people
arriving from other parishes or
dioceses, or from overseas.
It is important to keep an eye on
how the diocesan age profile
changes over time, as different
age groups have different needs
and require different pastoral
responses.
In this diocese, which age group
has the largest Catholic
population?
Which age groups have seen the
greatest changes since 2011?
Does this data suggest any new
challenges for the diocese?
Table 10:
Age by sex
Note: The Catholic population of the diocese may be slightly different in different tables in this profile as a result of the randomization procedure used by the
Australian Bureau of Statistics in carrying out its statutory obligation to protect the confidentiality of individuals. This variation in figures does not impair the value of
Census data as the Census is intended to be an instrument that paints a broad picture rather than a precise measurement of a particular locality. Care should always
be taken in interpreting small counts in tables.
Age (years)

11
Archdiocese of Melbourne National Catholic Census Project 1991-2016 Principal source of data: Australian Bureau of Statistics – 2016 Census of Population and Housing
Age and sex
0123456789
10111213141516
0 - 9 10-19 20 - 29 30 - 39 40 - 49 50 - 59 60 - 69 70 - 79 80+
%
Age (years)
Age profile of the Catholic population, 2011 & 2016
Diocese in 2016 Diocese in 2011 Australia in 2016
50,000 40,000 30,000 20,000 10,000 0 10,000 20,000 30,000 40,000 50,000
0 - 4
5 - 9
10 - 14
15 - 19
20 - 24
25 - 29
30 - 34
35 - 39
40 - 44
45 - 49
50 - 54
55 - 59
60 - 64
65 - 69
70 - 74
75 - 79
80+
Number of Catholics
Age-sex profile of the Catholic population, 2016
Male Female

12
Archdiocese of Melbourne National Catholic Census Project 1991-2016
Principal source of data: Australian Bureau of Statistics – 2016 Census of Population and Housing
Disability
Notes: 1. Australian Bureau of Statistics 2006. Census Dictionary Australia 2006. Catalogue No. 2901.0. 2. Australian Bureau of Statistics 2004. Australian Social Trends 2004. Catalogue No. 4102.0. 3. Among people aged 75 and over, being in hospital or a nursing home is a major reason for not being in a household on Census night. 4. The Census question asked whether the respondent had provided unpaid assistance to a person with a disability in the two weeks prior to the Census. The question is
not applicable to persons aged 0-14.
Catholics who provide unpaid assistance to a person with a disability 4 Males 2,870 3,585 6,432 10,132 8,849 9,678 41,546 Females 3,740 6,200 11,703 18,194 16,562 14,273 70,672
Catholics who have need for assistance with core activities
Family members:
Males 3,482 4,176 5,465 4,563 6,151 4,576 28,413 Females 1,615 3,610 6,704 5,479 10,485 10,149 38,042
Lone Persons: Males - 260 812 528 751 743 3,094 Females - 211 893 905 2,786 2,824 7,619
Other non-family members or persons not present in a household on Census night 3
Males 46 260 457 229 239 139 1,370 Females 25 255 478 291 497 395 1,941
Total Males 3,528 4,696 6,734 5,320 7,141 5,458 32,877 Females 1,640 4,076 8,075 6,675 13,768 13,368 47,602
The 2006 Census was the first to include the variable Core Activity Need for Assistance. The variable was developed to measure
the number of people with a profound or severe disability. ABS defines the profound or severe disability population as: “those
people needing help or assistance in one or more of the three core activity areas of self-care, mobility and communication, because
of a long-term health condition (lasting six months or more), a disability (lasting six months or more), or old age”.1 Most people
who need assistance with core activities live either in a family or in a place such as a nursing home, where the care they need is
provided. But many live alone. Often people with a disability have fewer opportunities for social interaction.2
How does the diocese support people who need assistance with core activities? How well are Catholic schools in the diocese
equipped to meet the needs of students with a disability?
How does the diocese support and encourage Catholics who provide unpaid assistance to people with a disability?
0-14 85 and over
Total 75-84 65-74 45-64 15-44 Table 11a: Need for assistance
with core activities by age
65 and
over Total 55-64 45-54 35-44 25-34 15-24 Table 11b: Provision of unpaid
assistance by age
0
20,000
40,000
60,000
0 - 14 15 - 24 25 - 34 35 - 44 45 - 54 55 - 64 65+Age (years)
Core need for assistance and provision of unpaid assistance by age
Core need forassistanceProvided unpaidassistance
13
Archdiocese of Melbourne National Catholic Census Project 1991-2016 Principal source of data: Australian Bureau of Statistics – 2016 Census of Population and Housing
Marital Status
15-24 25-34 35-44 45-54 55-64 75 and
over Total 65-74
Catholics aged 15 and over Males
Never married 65,228 39,772 17,732 12,583 6,571 3,047 1,838 146,771 Married 436 19,304 42,994 48,634 40,091 32,182 25,639 209,280 Separated/Divorced 56 1,336 5,338 10,540 9,837 6,284 2,836 36,227 Widowed 18 42 135 450 962 1,991 6,428 10,026 Total 65,738 60,454 66,199 72,207 57,461 43,504 36,741 402,304
Females Never married 64,955 38,725 17,035 11,422 5,993 2,680 2,189 142,999 Married 1,210 28,104 49,565 53,381 43,768 32,499 17,430 225,957 Separated/Divorced 132 2,630 8,532 15,688 14,257 8,767 3,594 53,600 Widowed 35 93 414 1,405 4,034 9,115 28,230 43,326 Total 66,332 69,552 75,546 81,896 68,052 53,061 51,443 465,882
Both persons Catholic 136,907 15,065 151,972 9.9 One person Catholic, the other non-Catholic Christian 67,383 12,408 79,791 15.6 One Catholic, the other not Christian or Not stated 60,795 21,562 82,357 26.2 Total 265,085 49,035 314,120 15.6
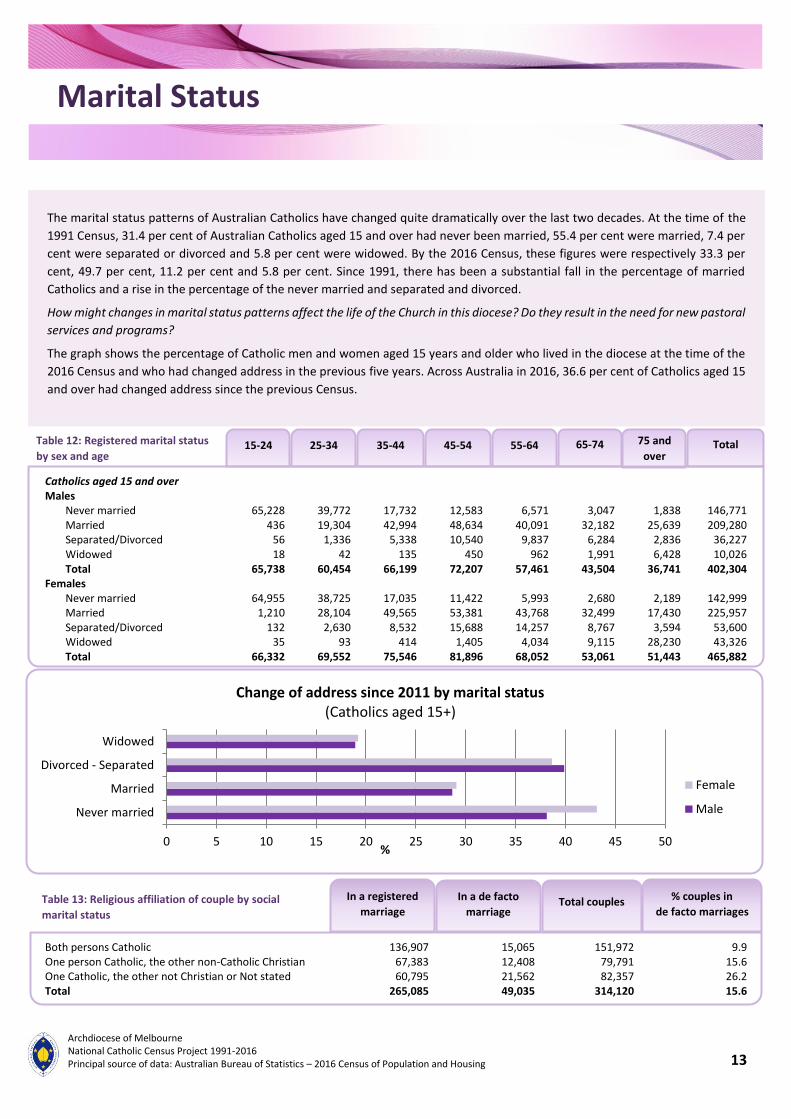
The marital status patterns of Australian Catholics have changed quite dramatically over the last two decades. At the time of the
1991 Census, 31.4 per cent of Australian Catholics aged 15 and over had never been married, 55.4 per cent were married, 7.4 per
cent were separated or divorced and 5.8 per cent were widowed. By the 2016 Census, these figures were respectively 33.3 per
cent, 49.7 per cent, 11.2 per cent and 5.8 per cent. Since 1991, there has been a substantial fall in the percentage of married
Catholics and a rise in the percentage of the never married and separated and divorced.
How might changes in marital status patterns affect the life of the Church in this diocese? Do they result in the need for new pastoral
services and programs?
The graph shows the percentage of Catholic men and women aged 15 years and older who lived in the diocese at the time of the
2016 Census and who had changed address in the previous five years. Across Australia in 2016, 36.6 per cent of Catholics aged 15
and over had changed address since the previous Census.
Table 12: Registered marital status
by sex and age
In a registered
marriage
In a de facto
marriage Total couples % couples in
de facto marriages Table 13: Religious affiliation of couple by social
marital status
0 5 10 15 20 25 30 35 40 45 50
Never married
Married
Divorced - Separated
Widowed
%
Change of address since 2011 by marital status(Catholics aged 15+)
Female
Male
14
Archdiocese of Melbourne National Catholic Census Project 1991-2016
Principal source of data: Australian Bureau of Statistics – 2016 Census of Population and Housing
Families
Less
than
$500
$500 - 799
$800 -
$1,249
$1,250 -
$1,999
$2,000 -
$2,999
$3,000 -
$3,999
$4,000
or more
Income
not fully
stated
Total
families
Median
Family
Income2 ($)
Two-parent families with children at home: Both parents Catholic 1,799 2,754 7,986 19,458 25,070 12,737 12,502 8,371 90,677 2,365 One parent Catholic, the other
Christian, but not Catholic 489 920 3,122 8,653 13,172 7,608 8,710 4,201 46,875 2,618
One parent Catholic, the other Non-Christian, No Religion or Not stated
676 1,028 3,449 9,611 14,178 7,891 8,649 3,639 49,121 2,562
Couple with no children living at home: Both Catholic 7,321 12,261 10,188 10,666 10,586 4,120 2,977 3,168 61,287 1,265 One person Catholic, the other
Christian, but not Catholic 2,132 4,582 5,678 6,673 7,037 2,999 2,556 1,256 32,913 1,636
One person Catholic, the other Non-Christian, No Religion or Not stated
1,479 2,374 3,783 6,713 9,970 4,367 3,512 1,045 33,243 2,175
One-parent families: Parent is Catholic
5,770 7,593 9,850 9,875 5,153 1,304 754 5,556 45,855 1,144
Other families where at least one person is Catholic
1,652 2,051 3,386 4,319 3,536 1,412 1,183 1,454 18,993 1,541
Other: Reference person Catholic but spouse temporarily absent3
- - - - - - - 9,853 9,853 -
Total 21,318 33,563 47,442 75,968 88,702 42,438 40,843 38,543 388,817 1,968
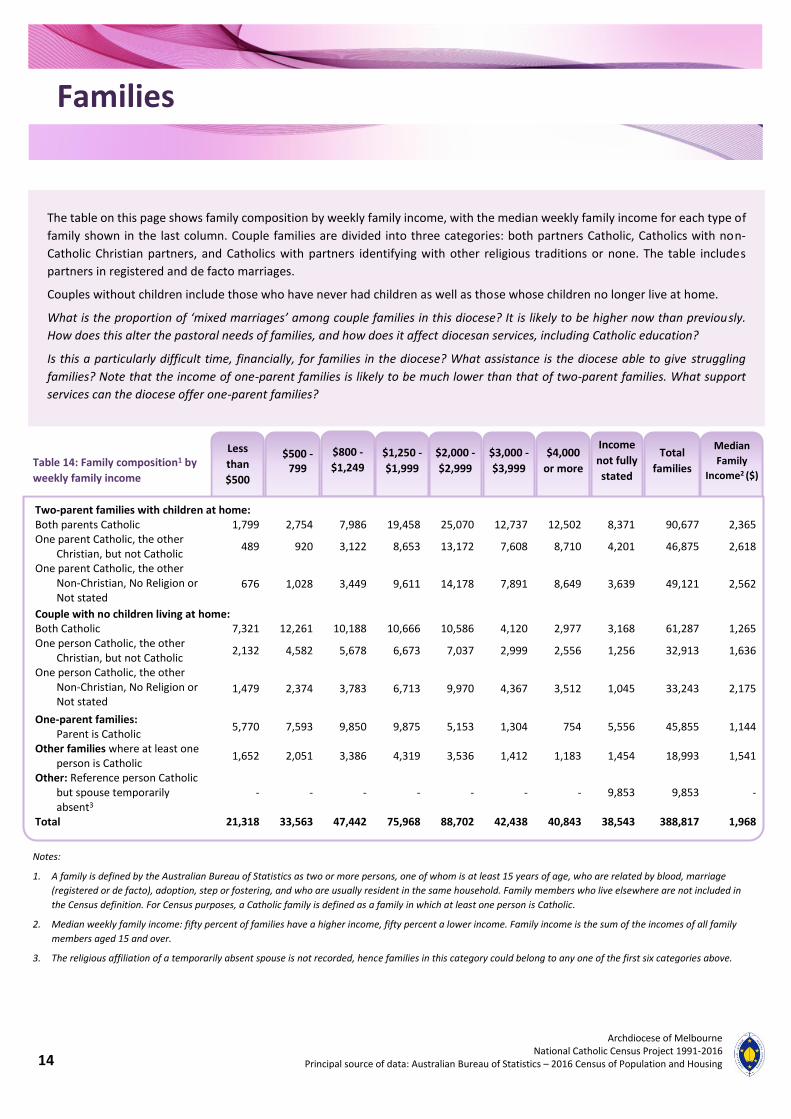
The table on this page shows family composition by weekly family income, with the median weekly family income for each type of
family shown in the last column. Couple families are divided into three categories: both partners Catholic, Catholics with non-
Catholic Christian partners, and Catholics with partners identifying with other religious traditions or none. The table includes
partners in registered and de facto marriages.
Couples without children include those who have never had children as well as those whose children no longer live at home.
What is the proportion of ‘mixed marriages’ among couple families in this diocese? It is likely to be higher now than previously.
How does this alter the pastoral needs of families, and how does it affect diocesan services, including Catholic education?
Is this a particularly difficult time, financially, for families in the diocese? What assistance is the diocese able to give struggling
families? Note that the income of one-parent families is likely to be much lower than that of two-parent families. What support
services can the diocese offer one-parent families?
Table 14: Family composition1 by
weekly family income
Notes:
1. A family is defined by the Australian Bureau of Statistics as two or more persons, one of whom is at least 15 years of age, who are related by blood, marriage
(registered or de facto), adoption, step or fostering, and who are usually resident in the same household. Family members who live elsewhere are not included in
the Census definition. For Census purposes, a Catholic family is defined as a family in which at least one person is Catholic.
2. Median weekly family income: fifty percent of families have a higher income, fifty percent a lower income. Family income is the sum of the incomes of all family
members aged 15 and over.
3. The religious affiliation of a temporarily absent spouse is not recorded, hence families in this category could belong to any one of the first six categories above.

15
Archdiocese of Melbourne National Catholic Census Project 1991-2016 Principal source of data: Australian Bureau of Statistics – 2016 Census of Population and Housing
Families
0 dependent
children
1 dependent
child
2 dependent
children
3 dependent
children 4 or more Total
Note: Table population is Catholic families. Dependent children include all children aged 0-14 and dependent students aged 15-24.
0 dependent
children
1 dependent
child
2 dependent
children
3 dependent
children 4 or more Total
Less than $500 13,346 3,727 2,781 997 459 21,310
$500-$799 23,170 4,457 3,867 1,503 565 33,562
$800-$1,249 29,017 7,373 7,441 2,707 913 47,451
$1,250-$1,999 38,107 13,639 16,753 5,973 1,506 75,978
$2,000-$2,999 41,750 16,411 21,783 7,305 1,446 88,695
$3,000-$3,999 18,550 8,423 11,117 3,699 643 42,432
$4,000 or more 15,572 7,745 11,856 4,787 884 40,844
Income not fully stated 21,061 6,948 6,895 2,747 914 38,565
Total Families 200,573 68,723 82,493 29,718 7,330 388,837
Median Family Income ($) $1,726 $2,103 $2,319 $2,315 $1,882 $1,968
Family Composition: Married couple family (at least one partner
Catholic) 136,874 43,828 63,458 23,497 5,374 273,031
De facto couple family (at least one partner Catholic)
33,385 8,124 6,619 2,204 632 50,964
One parent family, parent Catholic 20,460 13,127 8,611 2,744 914 45,856 Other families where at least one person is
Catholic 9,883 3,637 3,802 1,267 401 18,990
Total families 200,602 68,716 82,490 29,712 7,321 388,841
Table 15: Weekly family income by number of
dependent children
Table 16: Social marital status by number of
dependent children
0 2 4 6 8 10 12 14 16 18 20 22
Income not fully stated
Less than $500
$500-$799
$800-$1249
$1,250-$1,999
$2000-$2,999
$3,000-$3,999
$4,000 or more
Per cent of Catholic families
Weekly Family Income(Catholic families)
Diocese in 2016
Australia in 2016
16
Archdiocese of Melbourne National Catholic Census Project 1991-2016
Principal source of data: Australian Bureau of Statistics – 2016 Census of Population and Housing
Households
Family households 303,136 4,734 69,272 9,618 386,760 78.4 Lone person aged under 35 years 4,926 201 5,582 770 11,479 42.9 Lone person aged 35 years or over 56,921 4,427 15,694 5,631 82,673 68.9 Group households 5,572 409 12,471 1,059 19,511 28.6 Total households 370,555 9,771 103,019 17,078 500,423 74.0
Family households 9,394 12,470 35,467 45,816 22,607 34,252 1,896 Lone person aged under 35 years 90 196 1,042 1,422 396 387 1,785 Lone person aged 35 years or over 1,588 1,929 4,236 3,326 1,152 1,342 1,463 Group households 211 304 757 821 328 360 1,686 Total households 11,283 14,899 41,502 51,385 24,483 36,341 1,860
$1-$599
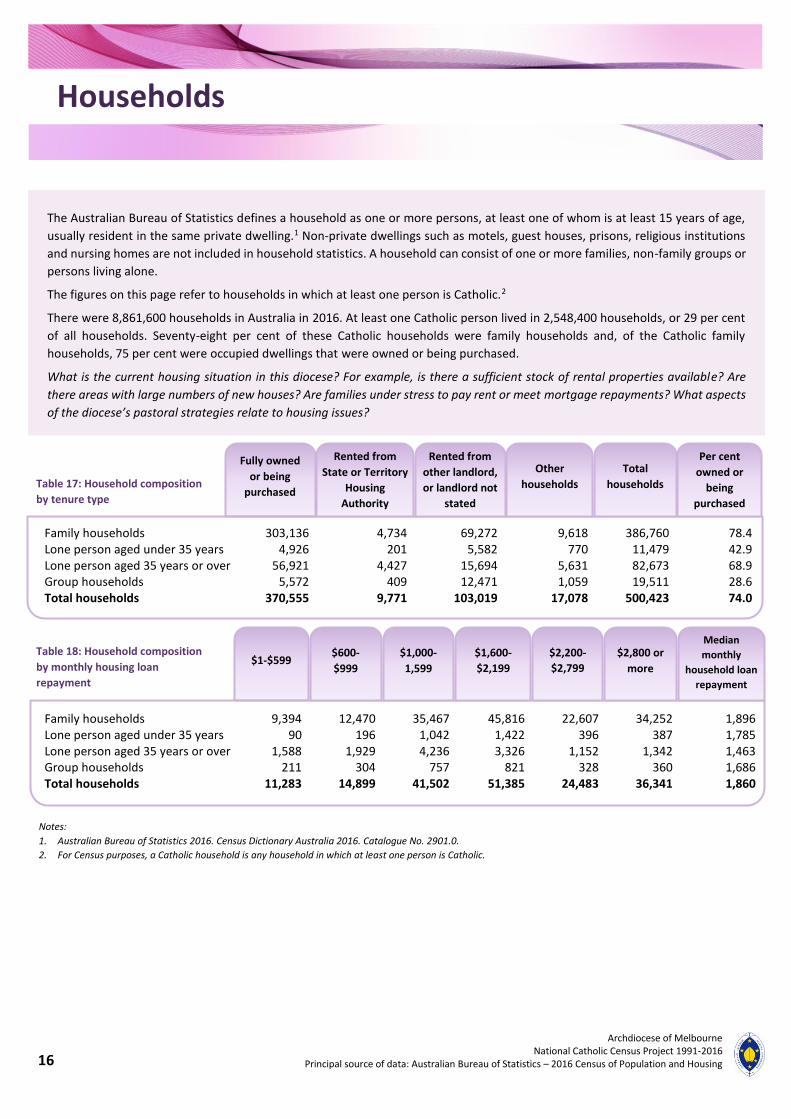
The Australian Bureau of Statistics defines a household as one or more persons, at least one of whom is at least 15 years of age,
usually resident in the same private dwelling.1 Non-private dwellings such as motels, guest houses, prisons, religious institutions
and nursing homes are not included in household statistics. A household can consist of one or more families, non-family groups or
persons living alone.
The figures on this page refer to households in which at least one person is Catholic.2
There were 8,861,600 households in Australia in 2016. At least one Catholic person lived in 2,548,400 households, or 29 per cent
of all households. Seventy-eight per cent of these Catholic households were family households and, of the Catholic family
households, 75 per cent were occupied dwellings that were owned or being purchased.
What is the current housing situation in this diocese? For example, is there a sufficient stock of rental properties available? Are
there areas with large numbers of new houses? Are families under stress to pay rent or meet mortgage repayments? What aspects
of the diocese’s pastoral strategies relate to housing issues?
Fully owned
or being
purchased
Rented from
State or Territory
Housing
Authority
Rented from
other landlord,
or landlord not
stated
Other
households
Total
households
Per cent
owned or
being
purchased
Table 17: Household composition
by tenure type
$600-
$999
$1,000-
1,599
$1,600-
$2,199
$2,200-
$2,799
$2,800 or
more
Median
monthly
household loan
repayment
Table 18: Household composition
by monthly housing loan
repayment
Notes:
1. Australian Bureau of Statistics 2016. Census Dictionary Australia 2016. Catalogue No. 2901.0.
2. For Census purposes, a Catholic household is any household in which at least one person is Catholic.

17
Archdiocese of Melbourne National Catholic Census Project 1991-2016 Principal source of data: Australian Bureau of Statistics – 2016 Census of Population and Housing
Birthplace
All
Catholics
% recent
arrivals1
% of
Catholics
Australia 727,546 68.2 - New Zealand 9,785 0.9 14.5 Other Oceania 2,741 0.3 14.7 United Kingdom (except Northern Ireland) 20,089 1.9 6.8 Ireland (including Northern Ireland) 10,367 1.0 12.2 Italy 56,353 5.3 2.8 Malta 14,938 1.4 0.4 Spain and Portugal 3,714 0.3 6.7 France 2,259 0.2 19.7 Netherlands 4,375 0.4 1.3 Germany 5,560 0.5 4.3 Austria 1,703 0.2 1.4 Croatia and other Former Yugoslavia 14,633 1.4 1.1 Poland 8,783 0.8 3.2 Hungary 2,155 0.2 3.2 Other Eastern Europe, Russian Federation
and Baltic States 5,139 0.5 3.5
Other Europe NEC 1,342 0.1 12.1 Vietnam 15,518 1.5 8.9 Philippines 32,147 3.0 17.3 Indonesia 4,178 0.4 21.0 Malaysia 4,855 0.5 15.0 Singapore 2,346 0.2 19.5 South East Asia NEC 3,481 0.3 8.4 India 19,396 1.8 12.4 Sri Lanka 10,740 1.0 10.2 China (except Hong Kong and Taiwan) 3,023 0.3 17.5 Hong Kong (SAR of China) 2,267 0.2 9.1 Korea, Republic of (South) 2,360 0.2 17.6 Egypt 2,453 0.2 1.1 Lebanon 3,788 0.4 2.3 Iraq 9,531 0.9 22.9 Sudan (including South Sudan) 2,383 0.2 4.0 Middle East and North Africa NEC 3,740 0.4 18.5 South Africa 2,759 0.3 7.4 Mauritius 5,903 0.6 4.3 United States of America 2,862 0.3 19.3 Canada 1,341 0.1 18.9 Argentina 2,097 0.2 9.3 Brazil 1,568 0.1 40.8 Colombia 3,505 0.3 42.4 Chile 3,639 0.3 7.3 Central America and South America NEC 5,438 0.5 15.9 Other countries 4,943 0.5 14.0 Inadequately described/Not stated 19,280 1.8 0.1 Total 1,067,023 100.0 2.8
Catholics born overseas, especially those born in
non-English-speaking countries, are likely to have
different approaches to faith and spirituality, and
different experiences and expectations of Church
life, from those of Catholics born in Australia.
How does the diocese support Catholics born in
non-English-speaking countries in matters such
as chaplaincy, education, pastoral care and so
on?
Is there a need for the diocese to review the way
it addresses the needs of Catholics who have
arrived in Australia in recent years?
Table 19: Birthplace
Notes:
1. % recent arrivals = the percentage of Catholics who were born in the named country and who arrived in Australia between 2013 and 2016 inclusive.
NEC = Not Elsewhere Classified
0 1 2 3 4 5
Top 5 birthplaces of Catholics born overseas(% of all Catholics)
ItalyPhilippinesUnited Kingdom (except Northern Ireland)IndiaVietnam
0 5 10 15 20 25 30 35 40 45 50
Top 5 birthplaces with highest proportions of recent arrivals
(% of all Catholics from that birthplace)
Colombia Brazil Iraq Indonesia France

18
Archdiocese of Melbourne National Catholic Census Project 1991-2016
Principal source of data: Australian Bureau of Statistics – 2016 Census of Population and Housing
Language
English 755,736 2,127,236 2,882,972 26.2
Italian 89,262 13,308 102,570 87.0
Maltese 14,919 1,147 16,066 92.9
Spanish 18,420 13,562 31,982 57.6
Croatian 16,574 2,223 18,797 88.2
Polish 10,225 3,515 13,740 74.4
Dutch 1,950 4,531 6,481 30.1
French 6,861 9,875 16,736 41.0
German 4,097 12,686 16,783 24.4
Portuguese 4,006 2,764 6,770 59.2
Hungarian 3,170 2,306 5,476 57.9
Ukrainian 1,589 1,052 2,641 60.2
Vietnamese 24,670 76,587 101,257 24.4
Filipino languages 27,657 8,410 36,067 76.7
Chinese languages 12,844 264,547 277,391 4.6
Malayalam 6,125 6,971 13,096 46.8
Sinhalese 5,211 24,545 29,756 17.5
Korean 2,555 12,016 14,571 17.5
Indonesian and Malay 4,502 15,542 20,044 22.5
Arabic 12,025 62,024 74,049 16.2
Assyrian and Chaldean 10,793 4,401 15,194 71.0
Oceanic and Papuan languages 2,812 13,298 16,110 17.5
Australian Indigenous Languages 40 270 310 12.9
Other European languages NEC 6,892 196,200 203,092 3.4
Other Asian languages NEC 7,625 241,967 249,592 3.1
Other languages NEC 5,513 96,908 102,421 5.4
Inadequately described/Non-Verbal/Not stated 10,972 269,533 280,505 3.9
Total 1,067,045 3,487,424 4,554,469 23.4
In 2016, 20 per cent of Australia’s Catholics spoke a language other than English at home, and three per cent were not profic ient
in English. People who do not speak English well can face practical problems in education, employment and access to services. On
the other hand, it is important to many people from a non-English-speaking background to maintain and promote, for reasons of
cultural continuity and identity, the use of their home language.1
What provisions does this diocese make for people who do not speak English well in terms of availability of Masses in languages
other than English, interpreters at diocesan events, translation of written material, access to priests and other pastoral ministers
who speak their language and so on?
Is there a need for current services to be reviewed in the light of recent changes to the non-English-speaking Catholic population?
Catholic Not Catholic
(or not stated) All persons
% Catholics
among
speakers2
Table 20: Language spoken at home by religious
affiliation
Notes: 1. Australian Bureau of Statistics 1999. Australian Social Trends 1999. Catalogue No. 4102.0, p.11. 2. The percentage of Catholics among the speakers of these languages in Australia. NEC = Not Elsewhere Classified
19
Archdiocese of Melbourne National Catholic Census Project 1991-2016 Principal source of data: Australian Bureau of Statistics – 2016 Census of Population and Housing
Language
English 46,521 82,270 89,937 95,724 91,941 208,043 141,309 755,745 -
Italian 1,006 1,874 2,489 4,114 6,511 27,670 45,601 89,265 15.2
Maltese 122 158 230 555 1,153 3,686 9,014 14,918 7.7
Spanish 808 911 876 2,940 4,101 4,575 4,210 18,421 12.8
Croatian 424 640 759 1,146 1,716 4,745 7,149 16,579 14.5
Polish 234 341 397 827 1,181 2,702 4,547 10,229 13.4
Dutch 39 86 50 47 117 403 1,207 1,949 2.0
French 237 376 410 798 1,038 1,731 2,269 6,859 3.5
German 120 195 179 211 398 865 2,129 4,097 2.3
Portuguese 168 199 172 605 925 1,137 797 4,003 13.1
Hungarian 50 101 74 126 236 766 1,810 3,163 11.6
Ukrainian 48 57 70 110 126 367 814 1,592 10.8
Vietnamese 1,304 2,367 3,280 4,184 3,531 7,263 2,743 24,672 27.0
Filipino languages 647 1,226 2,190 3,863 5,828 10,048 3,848 27,650 2.8
Chinese languages 593 976 1,246 2,072 2,040 3,386 2,540 12,853 15.8
Malayalam 745 961 518 619 1,818 1,306 162 6,129 8.4
Sinhalese 224 307 392 924 1,169 1,555 639 5,210 4.5
Korean 163 225 210 484 670 642 153 2,547 26.3
Indonesian and Malay 259 289 496 1,044 1,198 846 379 4,511 5.3
Arabic 442 722 1,117 1,758 1,929 3,648 2,401 12,017 16.7
Assyrian and Chaldean 935 1,646 1,638 1,615 1,636 2,400 912 10,782 29.2
Oceanic and Papuan languages 133 256 304 504 494 863 253 2,807 5.8
Australian Indigenous Languages - - 17 7 5 13 4 46 -
Other European languages NEC 279 415 322 561 842 1,744 2,723 6,886 8.8
Other Asian languages NEC 391 616 617 1,131 1,733 2,232 906 7,626 11.2
Other languages NEC 390 658 809 820 1,134 1,167 537 5,515 12.4
Inadequately described/Non-Verbal/ Not stated
1,998 734 816 944 854 2,124 3,491 10,961 15.0
Total 58,280 98,606 109,615 127,733 134,324 295,927 242,547 1,067,032 4.0
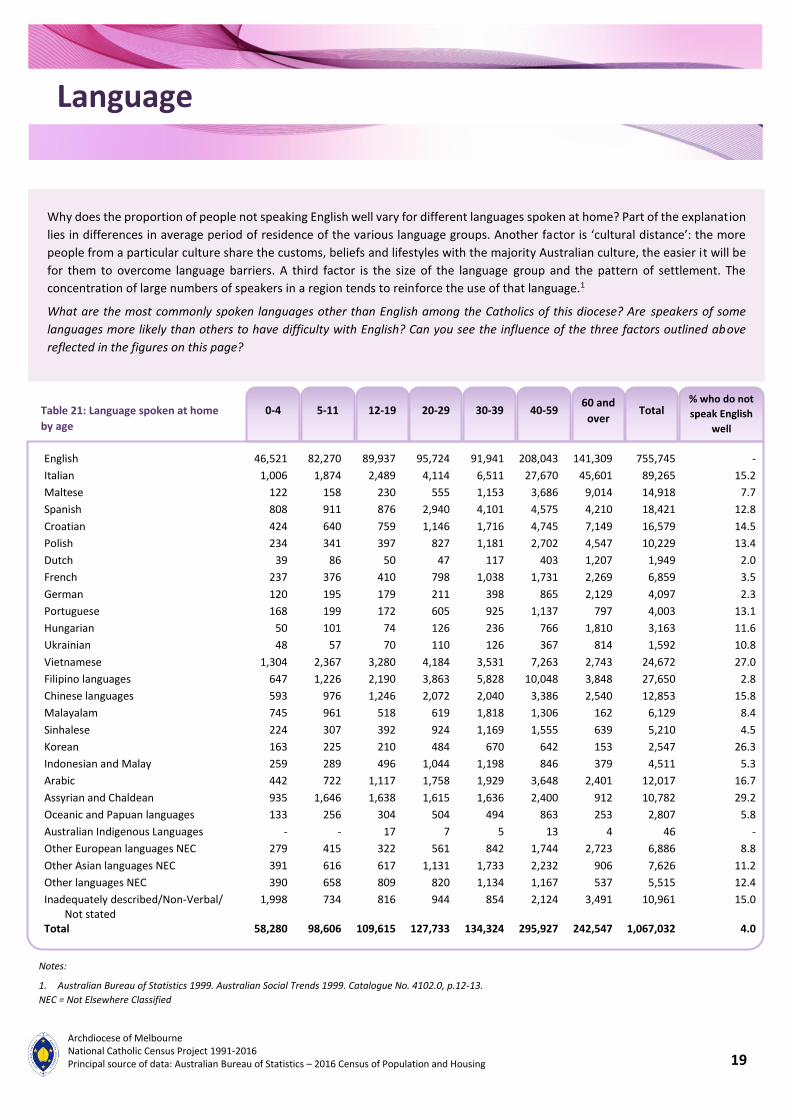
Why does the proportion of people not speaking English well vary for different languages spoken at home? Part of the explanation
lies in differences in average period of residence of the various language groups. Another factor is ‘cultural distance’: the more
people from a particular culture share the customs, beliefs and lifestyles with the majority Australian culture, the easier it will be
for them to overcome language barriers. A third factor is the size of the language group and the pattern of settlement. The
concentration of large numbers of speakers in a region tends to reinforce the use of that language.1
What are the most commonly spoken languages other than English among the Catholics of this diocese? Are speakers of some
languages more likely than others to have difficulty with English? Can you see the influence of the three factors outlined above
reflected in the figures on this page?
0-4 5-11 12-19 20-29 30-39 40-59 60 and
over Total
% who do not
speak English
well
Notes:
1. Australian Bureau of Statistics 1999. Australian Social Trends 1999. Catalogue No. 4102.0, p.12-13.
NEC = Not Elsewhere Classified
Table 21: Language spoken at home
by age

20
Archdiocese of Melbourne National Catholic Census Project 1991-2016
Principal source of data: Australian Bureau of Statistics – 2016 Census of Population and Housing
Attendance at Educational Institutions
Note: 1. This table includes the total population of the diocese and so there are high numbers for categories where the question about type of educational
institutions being attended is not applicable.
Infants/Primary – Government 33,185 203,624 236,809 14.0 Infants/Primary – Catholic 58,391 17,312 75,703 77.1 Infants/Primary – Other Non-Government 5,245 35,329 40,574 12.9 Secondary – Government 23,604 125,267 148,871 15.9 Secondary – Catholic 45,614 19,982 65,596 69.5 Secondary – Other Non-Government 8,489 52,263 60,752 14.0 Technical or Further Educational Institution (including TAFE Colleges)
16,782 63,800 80,582 20.8
University or other Tertiary Institutions 52,149 238,613 290,762 17.9 Other (including pre-school) 27,180 95,904 123,084 22.1 Not stated/Not applicable1 796,391 2,635,335 3,431,726 23.2 Total 1,067,030 3,487,429 4,554,459 23.4
According to the 2016 Census, more than 719,000 Australians attended Catholic schools, accounting for almost 21 per cent of all
school students in Australia.
In 2016, there were 915,100 Catholic students—almost one in six of all Catholics—attending Government, Catholic, and other non-
Government schools. They constitute a very large sub-group of Australian Catholics, considerably larger than the 623,400 or so
who attend Mass every Sunday. A further 317,600 Catholics were involved in some form of post-secondary education. The Church
of today, not just of tomorrow, is being shaped by the attitudes, beliefs and lifestyles of these young people.
How does the diocese connect with Catholic students at primary, secondary and tertiary levels, especially those not attending
Catholic schools?
Catholic Not Catholic or
not stated All persons % Catholic Table 22: Type of educational institution attending by
religious affiliation
41%
12%
37%
10%
Language background of all students attending Catholic schools
Primary school students who speak English only at home Primary school students who speak a language other than English at home Secondary school students who speak English only at home Secondary school students who speak a language other than English at home
0 50 100 150
15-17
18-19
20-24
%
Education participation rate(Catholics aged 15-24)
Female Male

21
Archdiocese of Melbourne National Catholic Census Project 1991-2016 Principal source of data: Australian Bureau of Statistics – 2016 Census of Population and Housing
Attendance at Educational Institutions
Infants/Primary - Government 1,799 2,574 3,912 7,394 7,797 3,297 3,279 32,263 101,082
Infants/Primary – Catholic 2,216 2,934 5,213 11,462 15,486 7,522 8,583 57,326 121,032
Infants/Primary – Other Non-Government
131 165 284 615 1,003 886 1,491 4,949 162,113
Secondary – Government 1,321 1,923 3,145 5,164 4,739 1,770 1,337 22,018 90,470
Secondary – Catholic 1,334 1,892 3,741 8,060 11,010 6,216 6,713 44,254 125,707
Secondary – Other Non-Government 205 251 431 911 1,439 1,140 2,507 7,951 166,233
TAFE, University or other tertiary institution
570 905 2,044 4,307 5,868 3,833 4,715 25,616 133,905
Other (including pre-school) 298 381 575 1,238 1,457 686 756 5,812 111,848
Not stated/Not applicable 695 639 876 1,283 1,142 459 429 6,663 82,187
Total 8,569 11,664 20,221 40,434 49,941 25,809 29,810 206,852 117,460
Table 23: Type of educational
institution attending by weekly
income of student’s family1
Less
than
$500
$500-
$799
$800-
$1,249
$1,250-
$1,999
$2,000-
$2,999
$3,000-
$3,999
$4,000
or more Total2
Median
annual family
income3 ($)
Notes: 1. Because the population of this table is dependent children aged 5-14 and dependent students aged 15-24, the figures in the table refer to individuals, not families.
The table shows, for example, the number of Catholic students attending Catholic primary schools whose families have a weekly income in the range $1,250-$1,999. A brother and sister at the same school would account for TWO of the cases in this category.
2. A column of figures for “Family income not fully stated, or not stated at all” has been omitted from the table, but the missing figures are included in the Total column.
3. Family income is the sum of the incomes of all family members aged 15 and over.
0 5 10 15 20 25 30 35 40 45 50 55 60 65
Secondary
Primary
%
Type of school being attended by Catholic students
Catholic Government Other Non-Government

22
Archdiocese of Melbourne National Catholic Census Project 1991-2016
Principal source of data: Australian Bureau of Statistics – 2016 Census of Population and Housing
Educational Qualifications
Catholics aged 15+ Males
Postgraduate degree 251 3,473 4,436 4,078 2,691 1,931 16,860 Graduate diploma / bachelor
degree 4,426 16,912 16,879 13,311 9,238 6,625 67,391
Advanced diploma or diploma level
2,224 5,972 7,379 7,289 5,237 4,776 32,877
Certificate level 8,045 17,397 17,864 21,235 16,048 18,242 98,831 Inadequately described/Not
stated/Not applicable 50,791 16,704 19,649 26,284 24,255 48,672 186,355
Total 65,737 60,458 66,207 72,197 57,469 80,246 402,314 Per cent with degree or higher 7.1 33.7 32.2 24.1 20.8 10.7 20.9
Females Postgraduate degree 465 5,421 5,561 4,014 2,556 1,403 19,420 Graduate diploma / bachelor
degree 7,250 28,041 26,709 19,183 11,696 7,888 100,767
Advanced diploma or diploma level
3,759 9,820 11,071 11,007 7,515 6,207 49,379
Certificate level 5,957 10,546 11,127 13,072 9,045 6,594 56,341 Inadequately described/Not
stated/Not applicable 48,889 15,723 21,060 34,621 37,244 82,415 239,952
Total 66,320 69,551 75,528 81,897 68,056 104,507 465,859 Per cent with degree or higher 11.6 48.1 42.7 28.3 20.9 8.9 25.8
All Catholics Postgraduate degree 716 8,894 9,997 8,092 5,247 3,334 36,280 Graduate diploma / bachelor
degree 11,676 44,953 43,588 32,494 20,934 14,513 168,158
Advanced diploma or diploma level
5,983 15,792 18,450 18,296 12,752 10,983 82,256
Certificate level 14,002 27,943 28,991 34,307 25,093 24,836 155,172 Inadequately described/Not
stated/Not applicable 99,680 32,427 40,709 60,905 61,499 131,087 426,307
Total 132,057 130,009 141,735 154,094 125,525 184,753 868,173 Per cent with degree or higher 9.4 41.4 37.8 26.3 20.9 9.7 23.5
Both the percentage of Catholics with university degrees and the gender balance of Catholics with degrees have changed
dramatically in recent decades due to the upsurge in young people, especially women, undertaking tertiary study and the
upgrading of courses such as nursing to degree status. In 1991, less than seven per cent of Australian Catholics aged 15 or over
had a degree; by 2016, that figure had reached 21 per cent. Among Catholics aged 15 to 34 years in 2016, 25.8 per cent of women
had a degree compared to 15.6 per cent of men. In contrast, among Catholics aged 55 and over, 13.8 per cent of men and 13.6 per
cent of women had degrees.
To what extent has participation in higher education in theology and related fields kept pace in this diocese with participation in
higher education in general? What new challenges and opportunities are presented to the diocese as a result of the increase in the
number of Catholics with a university education?
The increased level of participation in higher education by women is a reflection of significant changes in women’s roles and
responsibilities in society.1 How have women’s roles and responsibilities in the diocese changed in the last two decades?
Note:
1. Australian Bureau of Statistics 1999. Australian Social Trends 1999. Catalogue No. 4102.0, p.83.
Table 24: Highest qualification
attained by age and sex 65 and over 15-24 25-34 35-44 45-54 Total 55-64

23
Archdiocese of Melbourne National Catholic Census Project 1991-2016 Principal source of data: Australian Bureau of Statistics – 2016 Census of Population and Housing
Employment
15-24 25-44 45-64 65 and over Total
Catholics aged 15+ Males
Employer 1089 17,283 25,671 4,647 48,690
Employee 34,514 92,567 76,388 7,493 210,962
Unemployed 5,756 5,029 4,592 380 15,757
Not in the labour force 23,636 10,090 21,029 65,155 119,910
Other/Not stated/Not applicable 742 1,685 1,997 2,586 7,010
Total 65,737 126,654 129,677 80,261 402,329
Per cent in labour force2 62.9 90.7 82.2 15.6 68.5
Per cent unemployed3 13.9 4.4 4.3 3.0 5.7
Females
Employer 459 8,315 10,918 1570 21,262
Employee 38,701 102,149 90,818 6,894 238,562
Unemployed 5,319 5,364 4,234 192 15,109
Not in the labour force 21,224 27,865 42,166 92,287 183,542
Other/Not stated/Not applicable 616 1,404 1,810 3,568 7,398
Total 66,319 145,097 149,946 104,511 465,873
Per cent in labour force2 67.1 79.8 70.7 8.3 59.0
Per cent unemployed3 12.0 4.6 4.0 2.2 5.5
Notes: 1. Australian Bureau of Statistics 2004. Australian Social Trends 2004. Catalogue No. 4102.0, p.115. 2. The percentage of Catholics in each age group who are in the labour force (i.e. employed or seeking employment). 3. The percentage of Catholics in each age group who were in the labour force and were unemployed at the time of the Census.
In recent years there have been many changes in society and the workplace that have affected Australian workers. One major
change has been the increase in the percentages of workers, especially young people and women, in part-time jobs. Another has
been the rise in participation in the labour force by women. A third major change has been the rise in participation in the labour
force by older workers, following the removal of incentives to early retirement and resulting in the continuing availability of their
skills, experience and maturity in the workplace.1 Changes in labour force participation also influence the availability and size of
the volunteer workforce, and can both reduce and change the pattern of workers’ leisure time.
Have any of the changes described above had a noticeable impact on Catholic life in this diocese?
Table 25: Labour force status by age
and sex
0
20
40
60
80
100
15-24 25-34 35-44 45-54 55-64 65-74 75+
Pe
rce
nta
ge
Labour force status by age (percentage of all Catholics aged 15+)
Employer
Employee
Unemployed
Not in Labour force

24
Archdiocese of Melbourne National Catholic Census Project 1991-2016
Principal source of data: Australian Bureau of Statistics – 2016 Census of Population and Housing
Occupation
15-24 25-34 35-44 45-54 55-64 65 and over Total
Catholics aged 15+ Males
Managers 1,175 6,230 12,178 13,634 7,733 2,298 43,248 Professionals 2,654 11,908 12,514 10,555 7,238 2,672 47,541 Technicians & Trade Workers 9,109 13,931 12,507 12,766 8,021 1,901 58,235 Community & Personal Service
Workers 4,415 3,286 2,690 3,003 1,939 507 15,840
Clerical & Administrative Workers 2,016 4,024 4,206 4,599 3,376 938 19,159 Sales Workers 7,040 3,530 3,345 3,512 2,261 864 20,552 Machinery operators & Drivers 1,903 3,705 5,114 6,988 5,602 1,382 24,694 Labourers 7,118 5,061 4,846 5,739 4,517 1,556 28,837 ID / NS / NA1 30,318 8,776 8,800 11,404 16,774 68,128 144,200 Total 65,748 60,451 66,200 72,200 57,461 80,246 402,306 Per cent Managers & Professionals2 10.8 35.1 43.0 39.8 36.8 41.0 35.2 Per cent ‘blue collar workers’2 51.2 43.9 39.1 41.9 44.6 39.9 43.3
Females Managers 1,263 5,468 7,493 7,020 3,421 792 25,457 Professionals 4,233 20,464 18,518 15,381 9,242 1,834 69,672 Technicians & Trade Workers 1,570 2,475 2,261 2,339 1,365 321 10,331 Community & Personal Service
Workers 8,974 7,321 6,786 8,876 5,603 1,173 38,733
Clerical & Administrative Workers 5,081 10,791 13,482 17,726 11,324 2,571 60,975 Sales Workers 15,279 4,924 4,631 5,719 3,763 833 35,149 Machinery operators & Drivers 321 446 673 1,173 850 102 3,565 Labourers 2,316 1,848 2,254 4,027 3,568 838 14,851 ID / NS / NA1 27,289 15,823 19,435 19,638 28,924 96,052 207,161 Total 66,326 69,560 75,533 81,899 68,060 104,516 465,894 Per cent Managers & Professionals2 14.1 48.3 46.4 36.0 32.4 31.0 36.8 Per cent ‘blue collar workers’2 10.8 8.9 9.2 12.1 14.8 14.9 11.1
All Catholics Managers 2,438 11,698 19,671 20,654 11,154 3,090 68,705 Professionals 6,887 32,372 31,032 25,936 16,480 4,506 117,213 Technicians & Trade Workers 10,679 16,406 14,768 15,105 9,386 2,222 68,566 Community & Personal Service
Workers 13,389 10,607 9,476 11,879 7,542 1,680 54,573
Clerical & Administrative Workers 7,097 14,815 17,688 22,325 14,700 3,509 80,134 Sales Workers 22,319 8,454 7,976 9,231 6,024 1,697 55,701 Machinery operators & Drivers 2,224 4,151 5,787 8,161 6,452 1,484 28,259 Labourers 9,434 6,909 7,100 9,766 8,085 2,394 43,688 ID / NS / NA1 57,607 24,599 28,235 31,042 45,698 164,180 351,361 Total 132,074 130,011 141,733 154,099 125,521 184,762 868,200 Per cent Managers & Professionals2 12.5 41.8 44.7 37.9 34.6 36.9 36.0 Per cent ‘blue collar workers’2 30.0 26.1 24.4 26.8 30.0 29.6 27.2
Catholic women are more likely to be employed as managers or professionals; 35 per cent of Catholic women and 33 per cent of
Catholic men who reported their occupation in the 2016 Census worked as managers or professionals. But men were much more
likely than women—47 per cent compared to 12 per cent—to have a ‘blue collar’ occupation. The largest occupational category
for Catholic men in Australia is Technicians and Trades Workers. For women, it is Professionals.
Table 26: Occupation by age and sex
Notes: 1. ID = Inadequately described; NS = Not stated; NA = Not applicable. 2. See Notes 1 and 2 on page 5 for the type of occupations covered by the terms ‘Managers and Professionals’ and ‘blue collar’.

25
Archdiocese of Melbourne National Catholic Census Project 1991-2016 Principal source of data: Australian Bureau of Statistics – 2016 Census of Population and Housing
Occupation
All persons aged 15+ with an occupation
Managers 13.3 13.6
Professionals 22.7 26.7
Technicians & Trade Workers 13.3 12.6
Community & Personal Service Workers 10.6 10.5
Clerical & Administrative Workers 15.5 13.4
Sales Workers 10.8 9.5
Machinery operators & Drivers 5.5 5.6
Labourers 8.5 8.2
Total 100.0 100.0
Occupation is one indicator of socioeconomic status. The table on this page shows the occupation of all persons aged 15 years and
over by religious affiliation.
Does the following table suggest that the socioeconomic status of Catholics in this diocese is different from that of non-Catholics?
If there are differences, how might they have arisen?
Table 27: Occupation by religious affiliation1 (%) Catholic Non-Catholic
Note: 1. In this table, ‘Not Catholic’ includes those who did not answer the question about religious affiliation.
0 2 4 6 8 10 12 14 16 18 20 22 24 26 28
Labourers
Machinery Operators and Drivers
Sales Workers
Clerical and Administrative Workers
Community and Personal Service Workers
Technicians and Trade Workers
Professionals
Managers
Occupation(Catholics aged 15+ with an occupation)
Diocese in 2016 Australia in 2016

This page is intentionally left blank

This page is intentionally left blank

This profile has been created by the staff of the ACBC
National Centre for Pastoral Research as part of the National
Catholic Census Project 1991-2016.
National Centre for Pastoral Research Staff:
Trudy Dantis (Director), Stephen Reid, Leith Dudfield,
Marilyn Chee and Paul Bowell.
www.ncpr.catholic.org.au
The National Centre for Pastoral Research website allows you to view the Social
Profiles online.
Visit the website to obtain:
• Social Profiles for any diocese or parish in Australia
• A Social Profile for the Catholic population of Australia
• Helpful hints on using the Census data
• Reports on the National Count of Attendance
• Results from the 2016 National Church Life Survey
• Results of other research projects conducted by the National Centre for Pastoral Research
Australian Catholic Bishops Conference
National Centre for Pastoral Research
GPO Box 368 Canberra ACT 2601
Phone: +61 2 6201 9812
Email: [email protected]