Dinesh paper bags
61
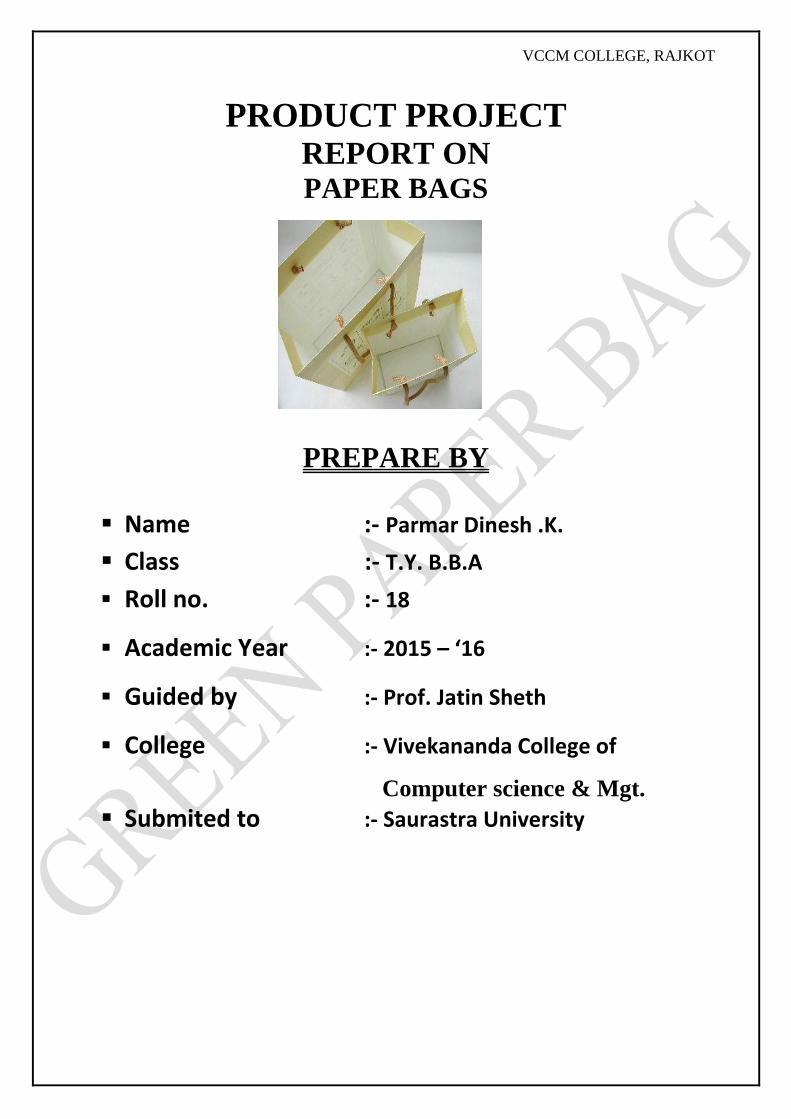
VCCM COLLEGE, RAJKOT PRODUCT PROJECT REPORT ON PAPER BAGS PREPARE BY Name :- Parmar Dinesh .K. Class :- T.Y. B.B.A Roll no. :- 18 Academic Year :- 2015 – ‘16 Guided by :- Prof. Jatin Sheth College :- Vivekananda College of Computer science & Mgt. Submited to :- Saurastra University
-
Upload
dinesh-parmar -
Category
Business
-
view
67 -
download
1
Transcript of Dinesh paper bags
VCCM COLLEGE, RAJKOT
PRODUCT PROJECT REPORT ON PAPER BAGS
PREPARE BY
Name :- Parmar Dinesh .K.
Class :- T.Y. B.B.A
Roll no. :- 18
Academic Year :- 2015 – ‘16
Guided by :- Prof. Jatin Sheth
College :- Vivekananda College of
Computer science & Mgt.
Submited to :- Saurastra University

2
DECLARATION
I undersigned MR. DINESH K. PARMAR, a student of
T.Y.B.B.A. here by declare that the project work presented in
this report is my own work and has been carried out under the
supervision of Prof. Jatin Sheth Vivekananda college, Rajkot.
This report has not been submitted previously to another
university for another examination.
Date:
Place: Rajkot. - - -
- - - - - - - - - -
(Dinesh Parmar )
3
PREFACE
B.B.A. course is a special course, which prepares young
entrepreneurs, & it’s very essential that they should have the
basic knowledge about how the small-scale business can be
started or which type of project is to be submitted to the banks
and other financial institution for the purpose of loan.
One of the subjects namely Entrepreneurship and
Management of Small Scale Business has covered this aspect
with a view to create and develop entrepreneurial skill among
the students.
Today in the growth rate of Indian Economy, S.S.I. plays a
vital role by contribution of 40%, to the total national income.
Hence, university has included preparation of such project
within the preview of its syllabus.
4
ACKNOWLEDGEMENT
It is really a matter of great pleasure for me to present their
creative and practical work. At this stage product every
entrepreneur prepares report of learning and it before starting of
actual production.
I would like to express my deep gratitude to Prof. Jatin
Sheth for his co-operation and guidance. Without his support my
report would have been very difficult to complete.
I am also thankful to all those who consisted me in
preparation of the manuscript. I would like to thank my friends
and family member who helped me in this project.
Date
Place: Rajkot
-------------
( Dinesh Parmar )
5
INDEX
SR. NO.
PARTICULAR PAGE NO.
1. Introduction 07
2. Project at a glance 08
3. Implementation Schedule 09
4. Management Setup 10
5. Organisation Structure 11
6. Justification of Location 12
7. Product Detail 15
8. Market potential 17
9. Raw Materials 18
10. Machines 19
11. Manufacturing Process 20
11. Photos 21
12. Production Capacity Schedule 23
13. Staff & Labour 23
14. Financial Details 24
15. Cost of Production 27
16. Total Working Capital Requirement 28
17. Total Project Fund 29
18. Sources of Finance “
19. Interest on Capital “
20. Depreciation 30
21. Annual Cost of Production “
22. Sales Forecast (5 years) “
23. Fixed & Variable Cost Schedule 31
24. Break-Even Analysis 33
25. Term Loan Repayment 35
26. Cost of Capital 36
27. Return on Investment “
28. Profitability 37
29. Tax Schedule “
30. Projected Operating Statement 38
31. Projected Trading A/c 39
32. Projected Profit & Loss A/c 42
33. Projected Balance Sheet 45
34. Projected Cost Sheet 48
35. Schedule of Raw Material Consumed 50
6
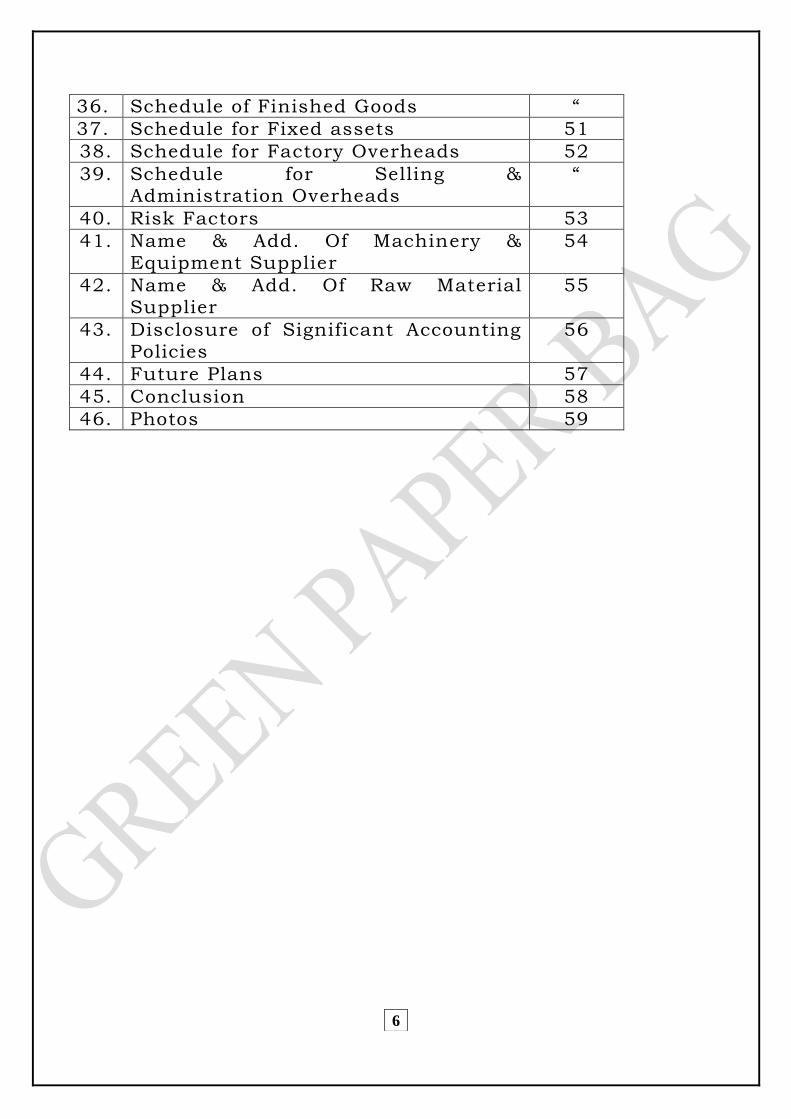
36. Schedule of Finished Goods “
37. Schedule for Fixed assets 51
38. Schedule for Factory Overheads 52
39. Schedule for Selling & Administration Overheads
“
40. Risk Factors 53
41. Name & Add. Of Machinery & Equipment Supplier
54
42. Name & Add. Of Raw Material Supplier
55
43. Disclosure of Significant Accounting Policies
56
44. Future Plans 57
45. Conclusion 58
46. Photos 59
7
INTRODUCTION
Paper Bags find extensive use in day-to-day life
for packing of bakery products, grocery, medicine,
cosmetics and stationery items. Of late, the use has
increased due to ban of certain type of plastic carry
bags that create environmental pollution.
8
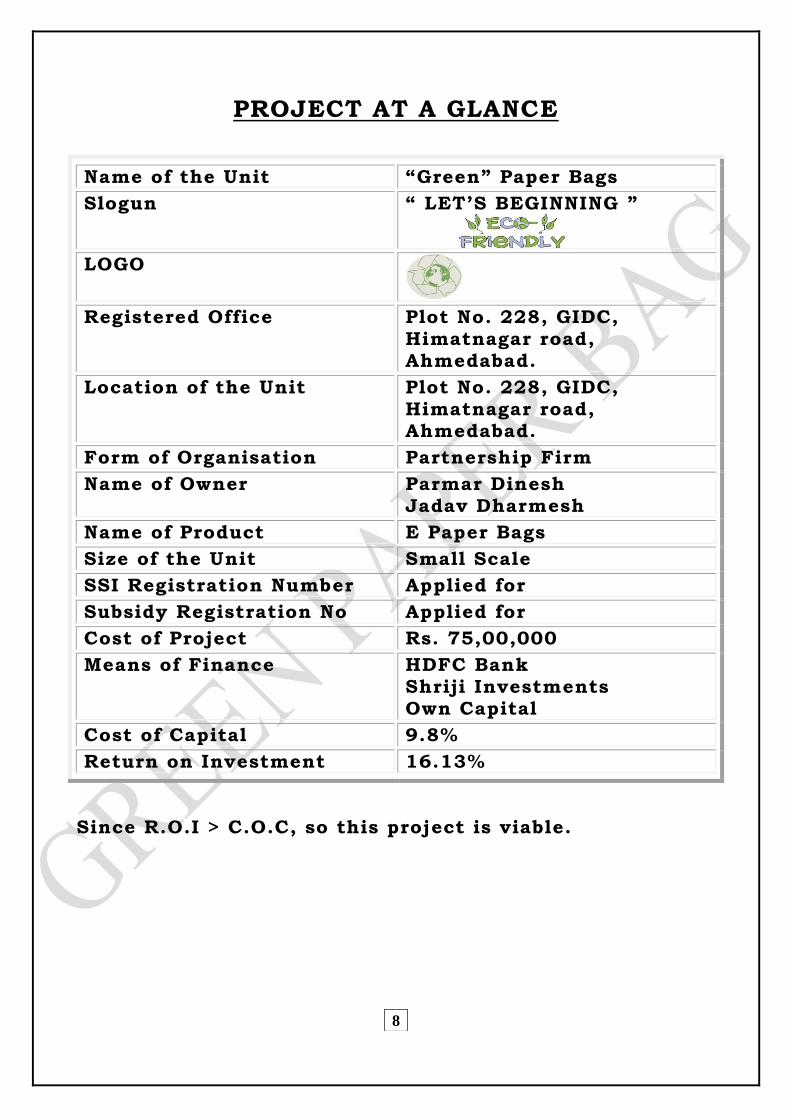
PROJECT AT A GLANCE
Name of the Unit “Green” Paper Bags
Slogun “ LET’S BEGINNING ”
LOGO
Registered Office Plot No. 228, GIDC, Himatnagar road, Ahmedabad.
Location of the Unit Plot No. 228, GIDC, Himatnagar road, Ahmedabad.
Form of Organisation Partnership Firm
Name of Owner Parmar Dinesh Jadav Dharmesh
Name of Product E Paper Bags
Size of the Unit Small Scale
SSI Registration Number Applied for
Subsidy Registration No Applied for
Cost of Project Rs. 75,00,000
Means of Finance HDFC Bank Shriji Investments Own Capital
Cost of Capital 9.8%
Return on Investment 16.13%
Since R.O.I > C.O.C, so this project is viable.
9
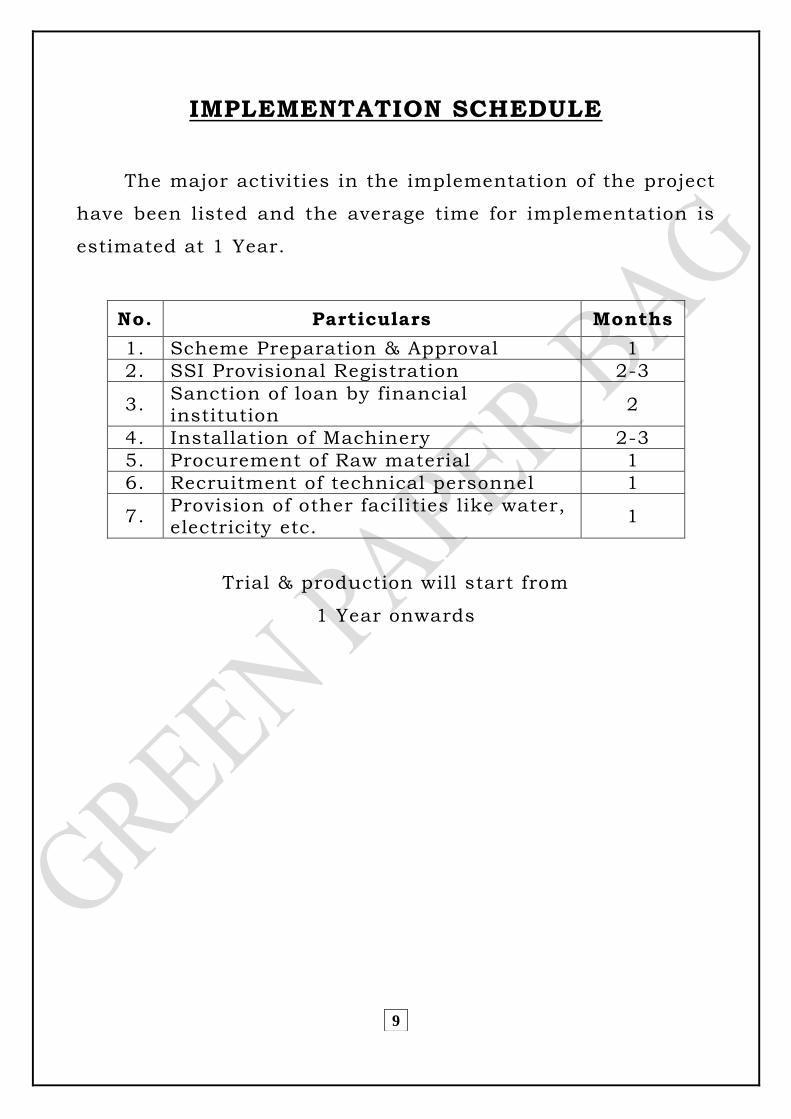
IMPLEMENTATION SCHEDULE
The major activities in the implementation of the project
have been listed and the average time for implementation is
estimated at 1 Year.
No. Particulars Months
1. Scheme Preparation & Approval 1
2. SSI Provisional Registration 2-3
3. Sanction of loan by financial institution
2
4. Installation of Machinery 2-3
5. Procurement of Raw material 1
6. Recruitment of technical personnel 1
7. Provision of other facilities like water, electricity etc.
1
Trial & production will start from
1 Year onwards
10
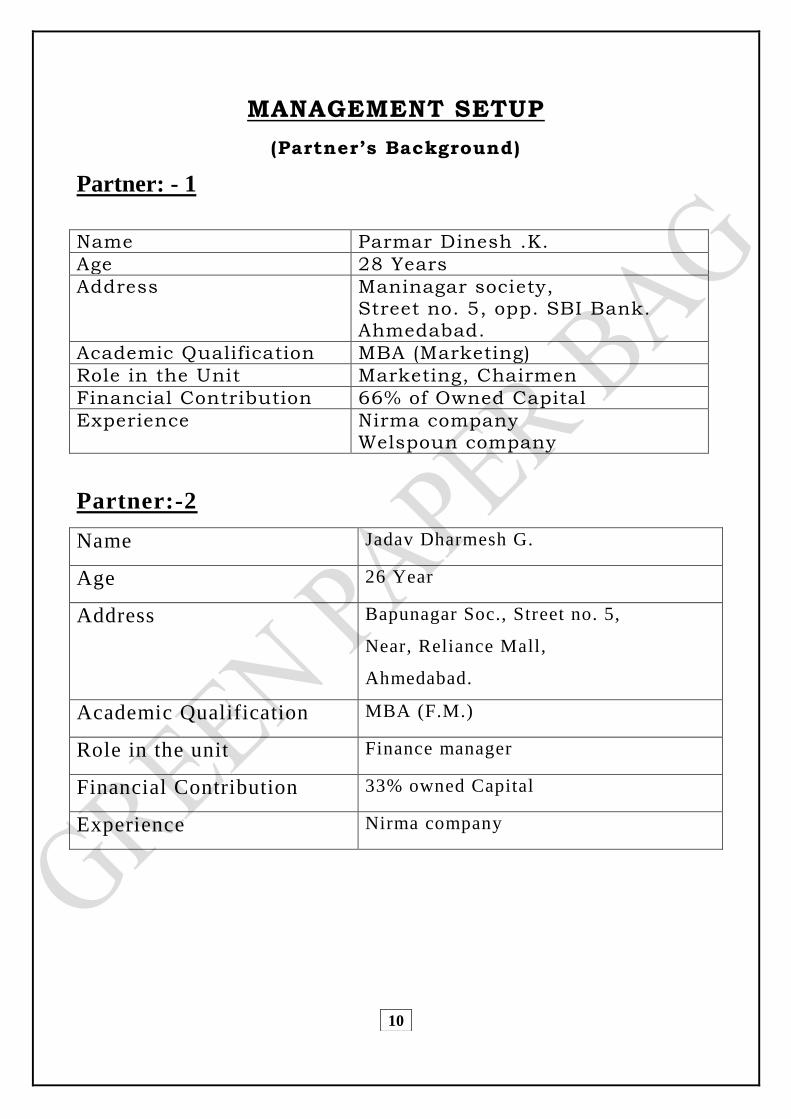
MANAGEMENT SETUP
(Partner’s Background)
Partner: - 1
Name Parmar Dinesh .K.
Age 28 Years
Address Maninagar society, Street no. 5, opp. SBI Bank. Ahmedabad.
Academic Qualification MBA (Marketing)
Role in the Unit Marketing, Chairmen
Financial Contribution 66% of Owned Capital
Experience Nirma company Welspoun company
Partner:-2
Name Jadav Dharmesh G.
Age 26 Year
Address Bapunagar Soc., Street no. 5,
Near, Reliance Mall,
Ahmedabad.
Academic Qualification MBA (F.M.)
Role in the unit Finance manager
Financial Contribution 33% owned Capital
Experience Nirma company
11
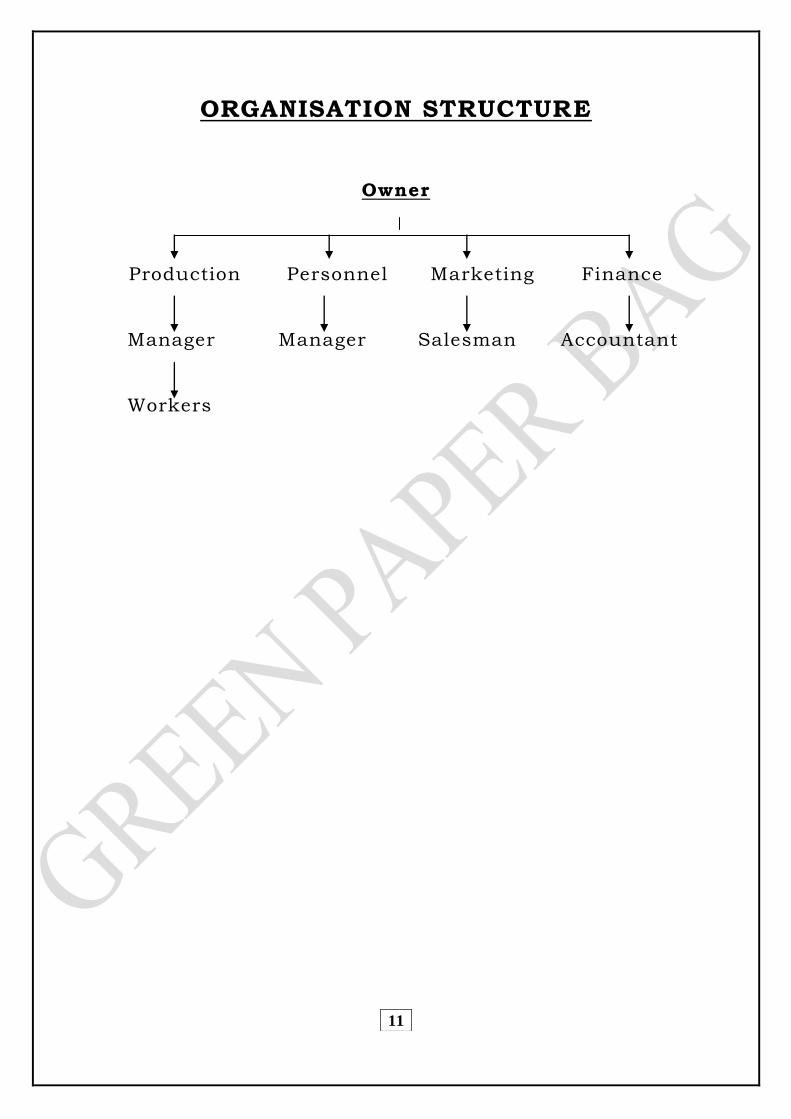
ORGANISATION STRUCTURE
Owner
Production Personnel Marketing Finance
Manager Manager Salesman Accountant
Workers
12
JUSTIFICATION OF LOCATION
Location plays an important role in starting industry.
Before starting any industry entrepreneurs have to take a
decision about the location of industry. They have to select
that location where all the facilities must be available. They
have to take right decision about the selection of location
because once a location selected it cannot be changed in the
near future. The following should be taken into
consideration.
1. Availability of market: -
Market plays an important role in the selection of
location. Market should be near to the industry so; the
immediate sale of product is possible. It also help in
reduction of cost by reducing storing of finished good,
avoid the cost of transportation etc.
2. Availability of Labour: -
Without manpower no one can start his or her industry.
If you have a machine but not manpower you cannot
start your industry. So, Labour should be available at
cheap rate.
13
3. Availability of transport: -
It is required for assembling of raw material &
distribution of finished product. So, all type of
transportation facility should be available.
4. Availability of power & water: -
Power & water is pre-requirement of an industry. So,
the facility of power & water must be sufficiently
available.
Thus, all the above factors justify the selection of the
location. So, the selection would definitely contribute to the
profitability.
14
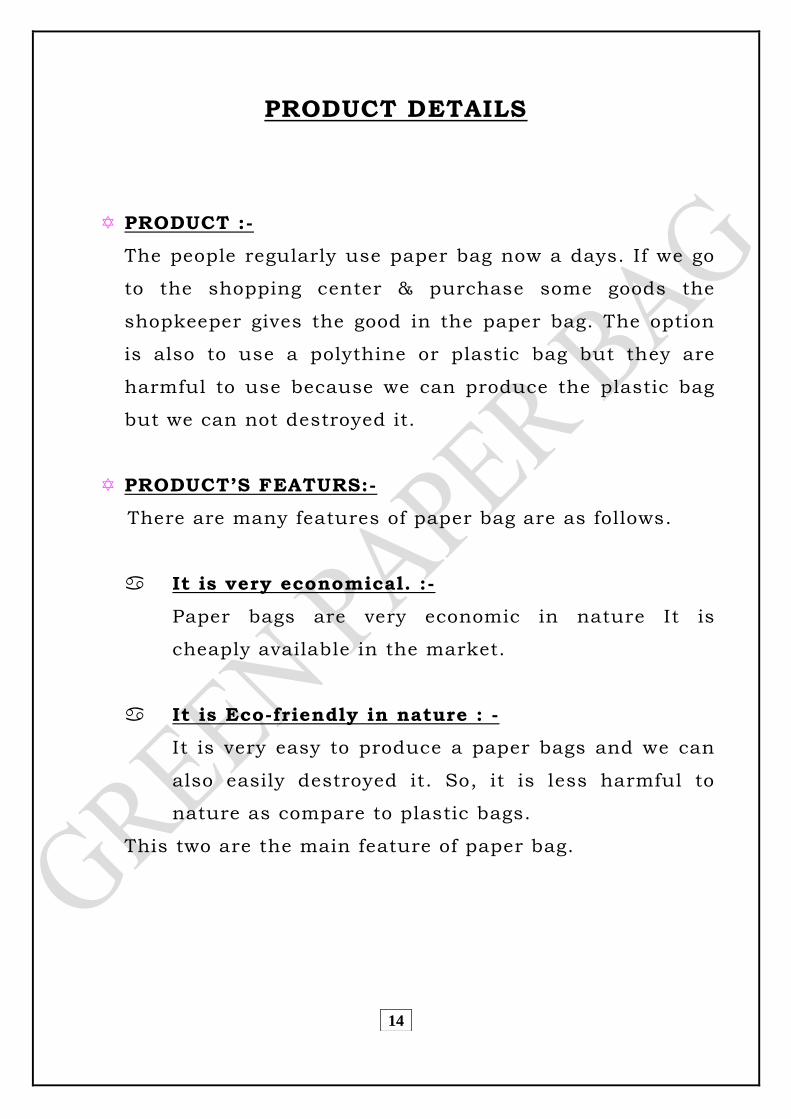
PRODUCT DETAILS
PRODUCT :-
The people regularly use paper bag now a days. If we go
to the shopping center & purchase some goods the
shopkeeper gives the good in the paper bag. The option
is also to use a polythine or plastic bag but they are
harmful to use because we can produce the plastic bag
but we can not destroyed it.
PRODUCT’S FEATURS:-
There are many features of paper bag are as follows.
It is very economical. :-
Paper bags are very economic in nature It is
cheaply available in the market.
It is Eco-friendly in nature : -
It is very easy to produce a paper bags and we can
also easily destroyed it. So, it is less harmful to
nature as compare to plastic bags.
This two are the main feature of paper bag.
15
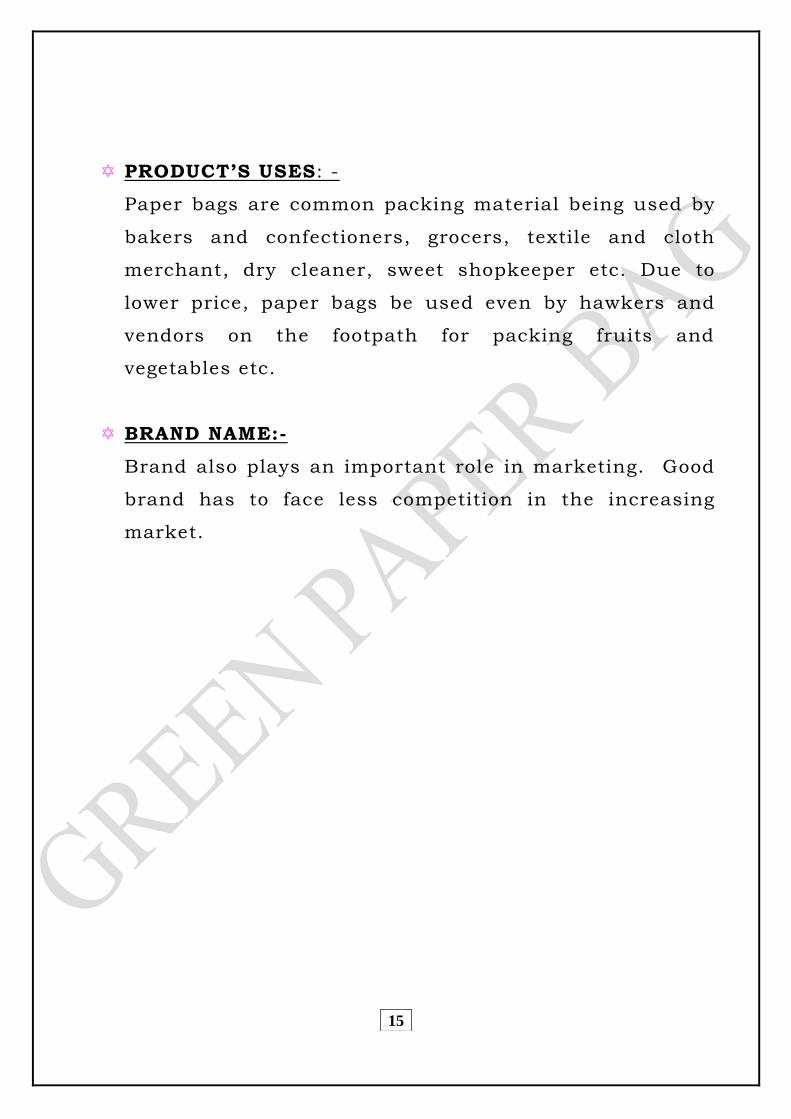
PRODUCT’S USES: -
Paper bags are common packing material being used by
bakers and confectioners, grocers, textile and cloth
merchant, dry cleaner, sweet shopkeeper etc. Due to
lower price, paper bags be used even by hawkers and
vendors on the footpath for packing fruits and
vegetables etc.
BRAND NAME:-
Brand also plays an important role in marketing. Good
brand has to face less competition in the increasing
market.
16
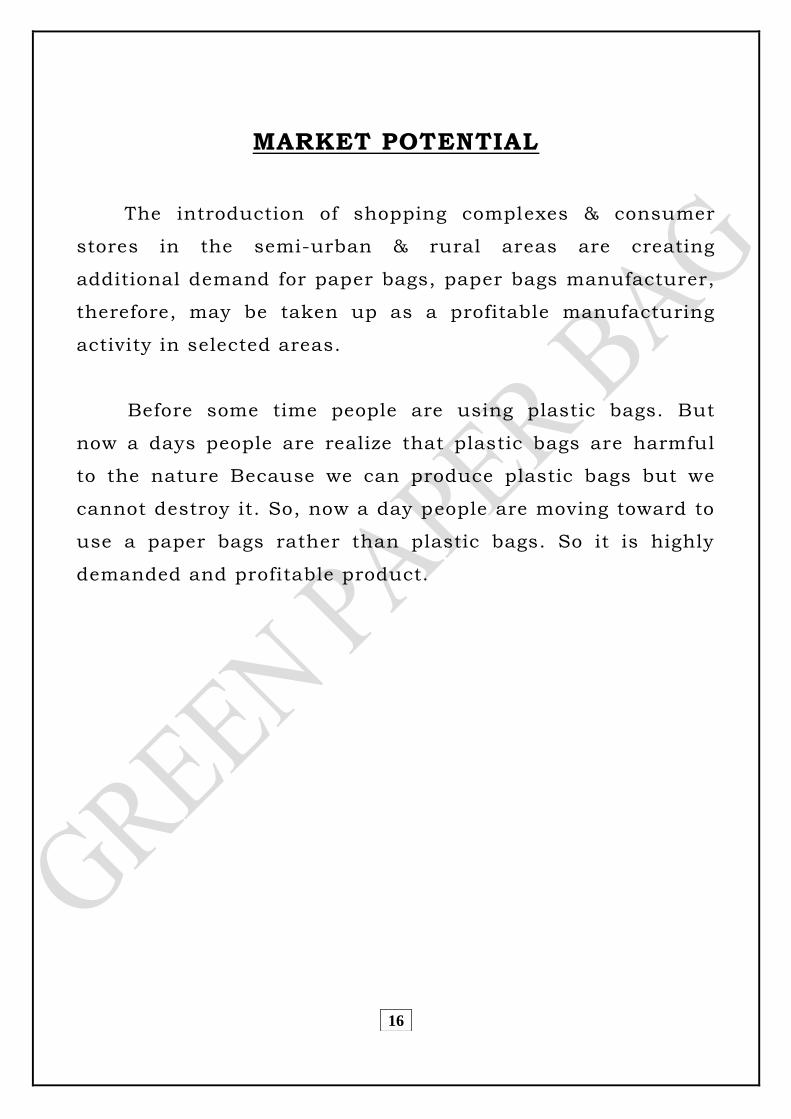
MARKET POTENTIAL
The introduction of shopping complexes & consumer
stores in the semi-urban & rural areas are creating
additional demand for paper bags, paper bags manufacturer,
therefore, may be taken up as a profitable manufacturing
activity in selected areas.
Before some time people are using plastic bags. But
now a days people are realize that plastic bags are harmful
to the nature Because we can produce plastic bags but we
cannot destroy it. So, now a day people are moving toward to
use a paper bags rather than plastic bags. So it is highly
demanded and profitable product.
17
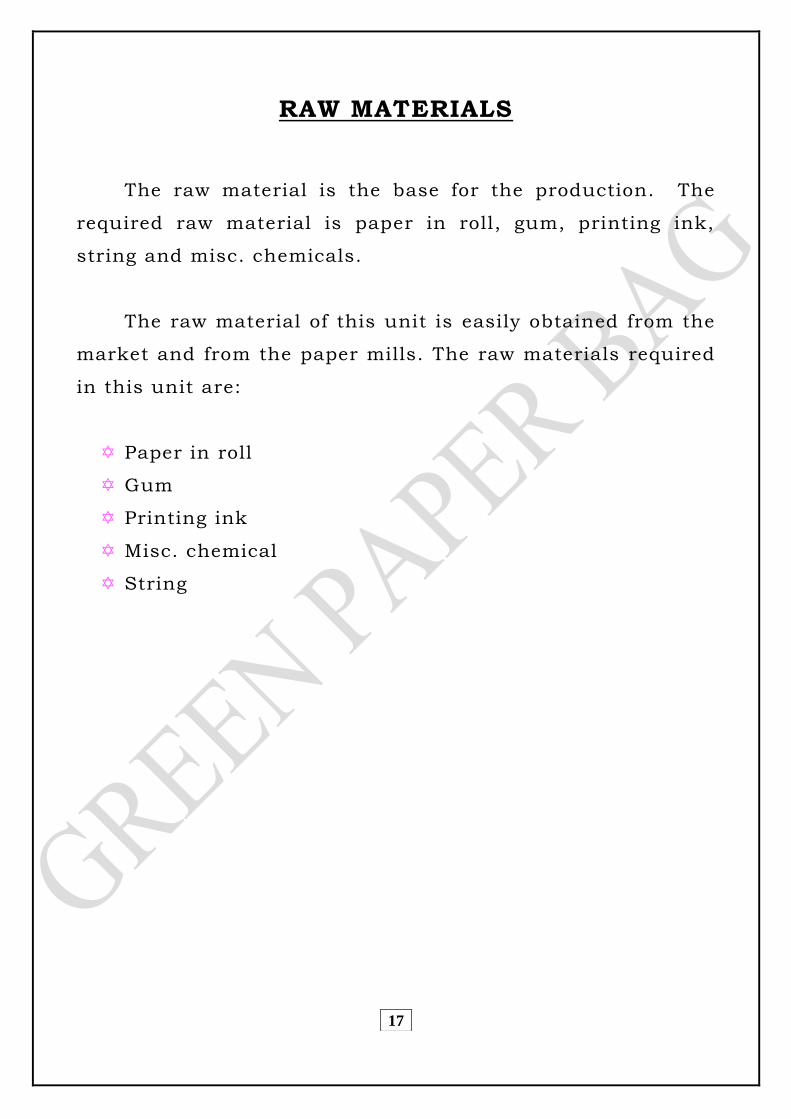
RAW MATERIALS
The raw material is the base for the production. The
required raw material is paper in roll, gum, printing ink,
string and misc. chemicals.
The raw material of this unit is easily obtained from the
market and from the paper mills. The raw materials required
in this unit are:
Paper in roll
Gum
Printing ink
Misc. chemical
String
18
MACHINES
Automatic paper bag machine - 3 Nos.
Stereo Press - 2 Nos.
Stereo Grinder - 2 Nos.
Roll Slitter motorized with 2 HP packing machine - 2
Nos.
Testing equipment - 1 No.
Punching Machine - 1 No.
19
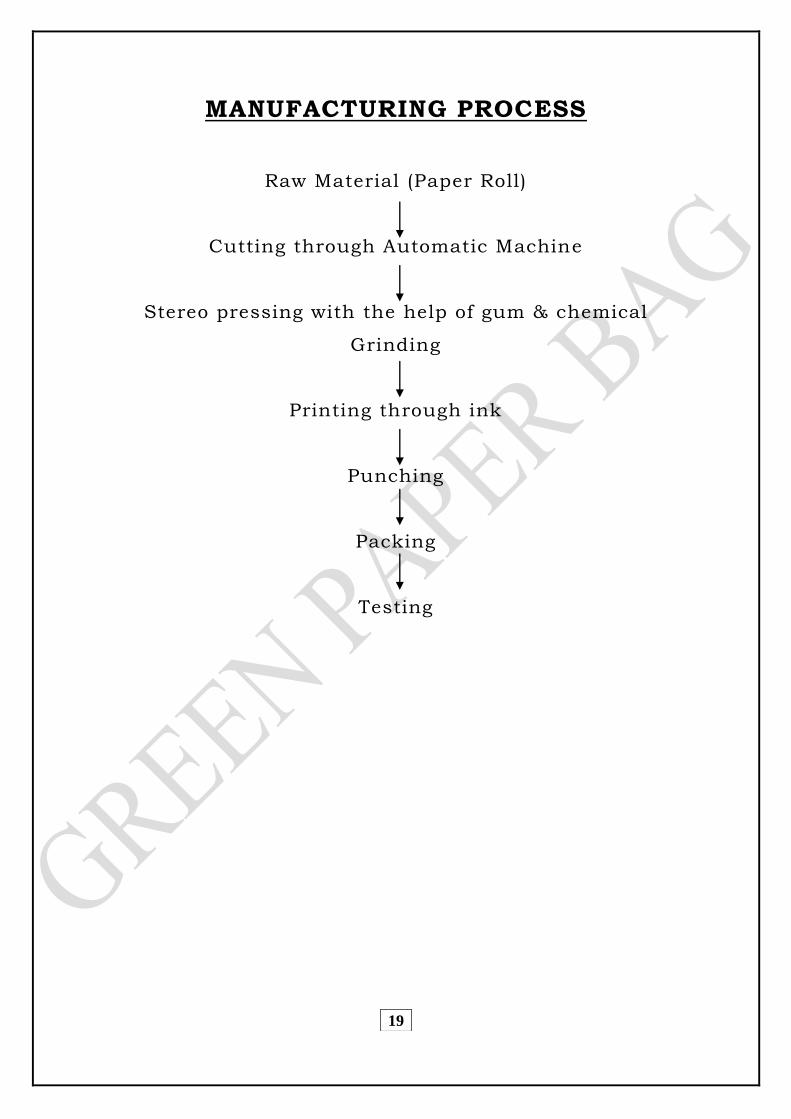
MANUFACTURING PROCESS
Raw Material (Paper Roll)
Cutting through Automatic Machine
Stereo pressing with the help of gum & chemical
Grinding
Printing through ink
Punching
Packing
Testing
20
MANUFACTURING PROCESS IN DETAIL
The required raw material is in the form of roll, the
cutting of roll is done through the automatic paper bag
machine according to the size, and then pressing of required
size is done through stereo pressing machine with the help
of gum & chemical. Then side grinding of paper bag is done.
Then the process of printing is done and after that punching
is done and after this string is tied in these holes and at last
they are tested for bursting pressure and packing is done.

21
22
23
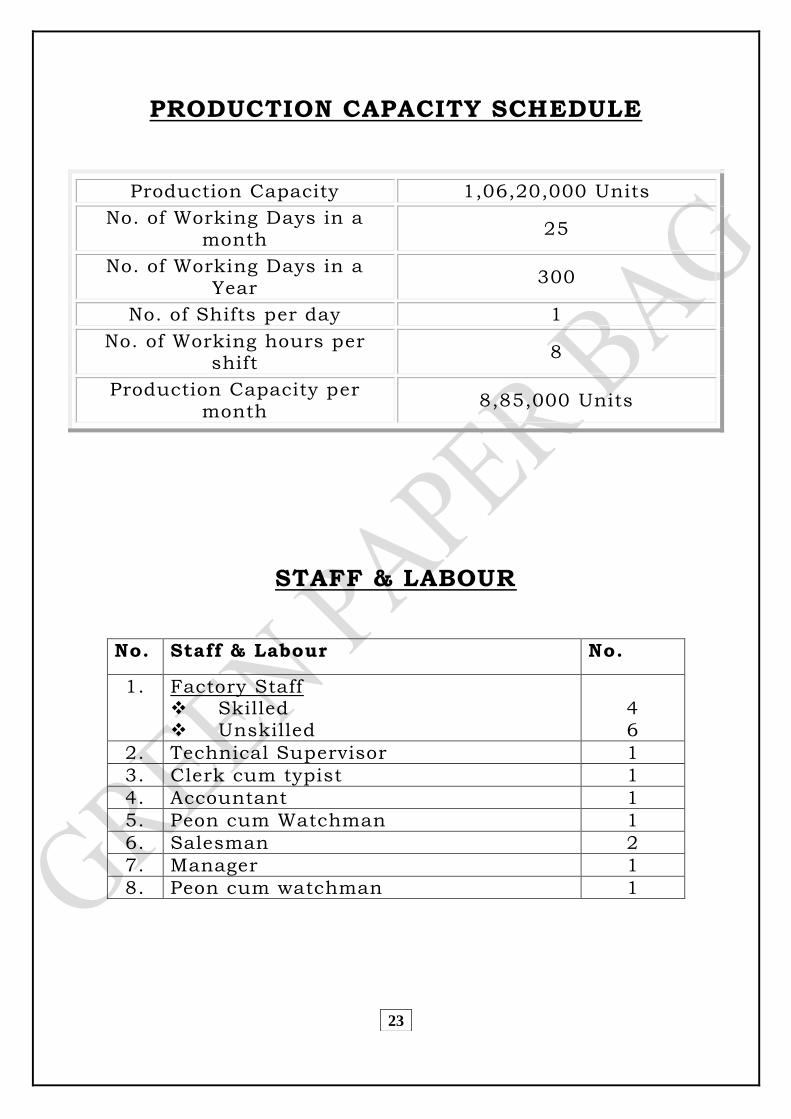
PRODUCTION CAPACITY SCHEDULE
Production Capacity 1,06,20,000 Units
No. of Working Days in a month
25
No. of Working Days in a Year
300
No. of Shifts per day 1
No. of Working hours per shift
8
Production Capacity per month
8,85,000 Units
STAFF & LABOUR
No. Staff & Labour No.
1. Factory Staff Skilled Unskilled
4 6
2. Technical Supervisor 1
3. Clerk cum typist 1
4. Accountant 1
5. Peon cum Watchman 1
6. Salesman 2
7. Manager 1
8. Peon cum watchman 1
24
25
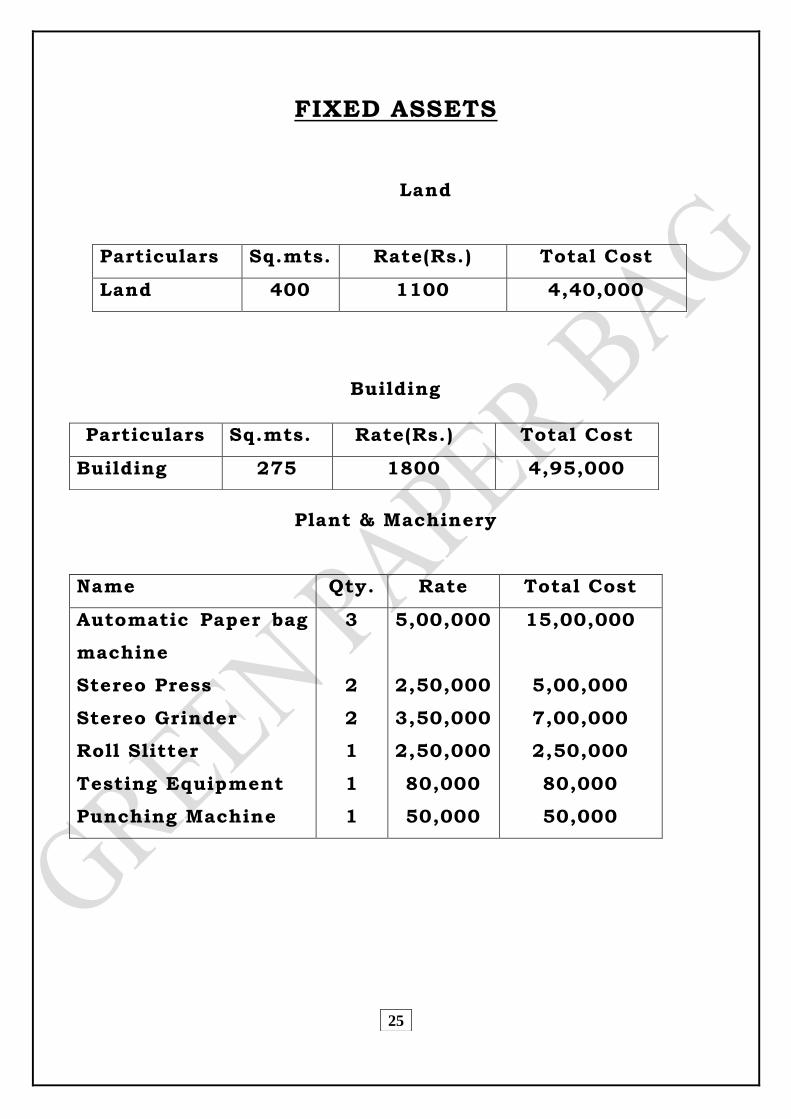
FIXED ASSETS
Land
Particulars Sq.mts. Rate(Rs.) Total Cost
Land 400 1100 4,40,000
Building
Plant & Machinery
Name Qty. Rate Total Cost
Automatic Paper bag
machine
Stereo Press
Stereo Grinder
Roll Slitter
Testing Equipment
Punching Machine
3
2
2
1
1
1
5,00,000
2,50,000
3,50,000
2,50,000
80,000
50,000
15,00,000
5,00,000
7,00,000
2,50,000
80,000
50,000
Particulars Sq.mts. Rate(Rs.) Total Cost
Building 275 1800 4,95,000
26
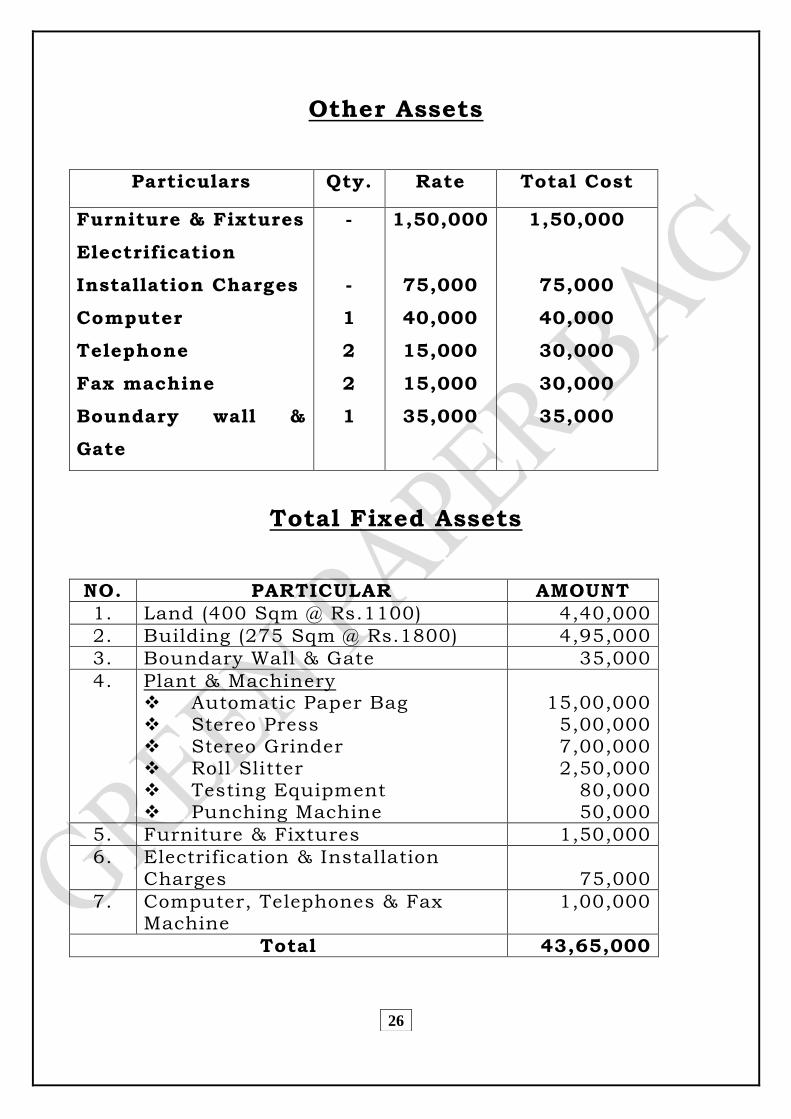
Other Assets
Particulars Qty. Rate Total Cost
Furniture & Fixtures
Electrification
Installation Charges
Computer
Telephone
Fax machine
Boundary wall &
Gate
-
-
1
2
2
1
1,50,000
75,000
40,000
15,000
15,000
35,000
1,50,000
75,000
40,000
30,000
30,000
35,000
Total Fixed Assets
NO. PARTICULAR AMOUNT
1. Land (400 Sqm @ Rs.1100) 4,40,000
2. Building (275 Sqm @ Rs.1800) 4,95,000
3. Boundary Wall & Gate 35,000
4. Plant & Machinery Automatic Paper Bag Stereo Press Stereo Grinder Roll Slitter Testing Equipment Punching Machine
15,00,000
5,00,000 7,00,000 2,50,000
80,000 50,000
5. Furniture & Fixtures 1,50,000
6. Electrification & Installation Charges
75,000
7. Computer, Telephones & Fax Machine
1,00,000
Total 43,65,000
27
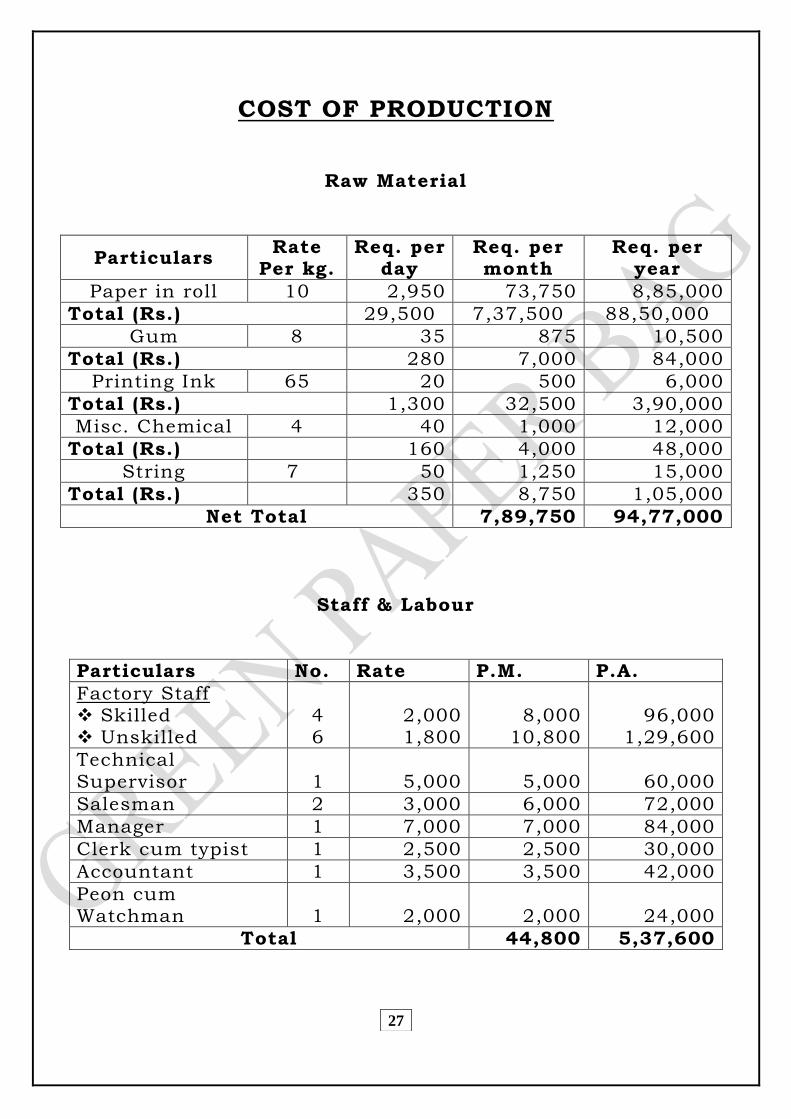
COST OF PRODUCTION
Raw Material
Particulars Rate
Per kg. Req. per
day Req. per month
Req. per year
Paper in roll 10 2,950 73,750 8,85,000
Total (Rs.) 29,500 7,37,500 88,50,000
Gum 8 35 875 10,500
Total (Rs.) 280 7,000 84,000
Printing Ink 65 20 500 6,000
Total (Rs.) 1,300 32,500 3,90,000
Misc. Chemical 4 40 1,000 12,000
Total (Rs.) 160 4,000 48,000
String 7 50 1,250 15,000
Total (Rs.) 350 8,750 1,05,000
Net Total 7,89,750 94,77,000
Staff & Labour
Particulars No. Rate P.M. P.A.
Factory Staff Skilled Unskilled
4 6
2,000 1,800
8,000
10,800
96,000
1,29,600
Technical Supervisor
1
5,000
5,000
60,000
Salesman 2 3,000 6,000 72,000
Manager 1 7,000 7,000 84,000
Clerk cum typist 1 2,500 2,500 30,000
Accountant 1 3,500 3,500 42,000
Peon cum Watchman
1
2,000
2,000
24,000
Total 44,800 5,37,600
28
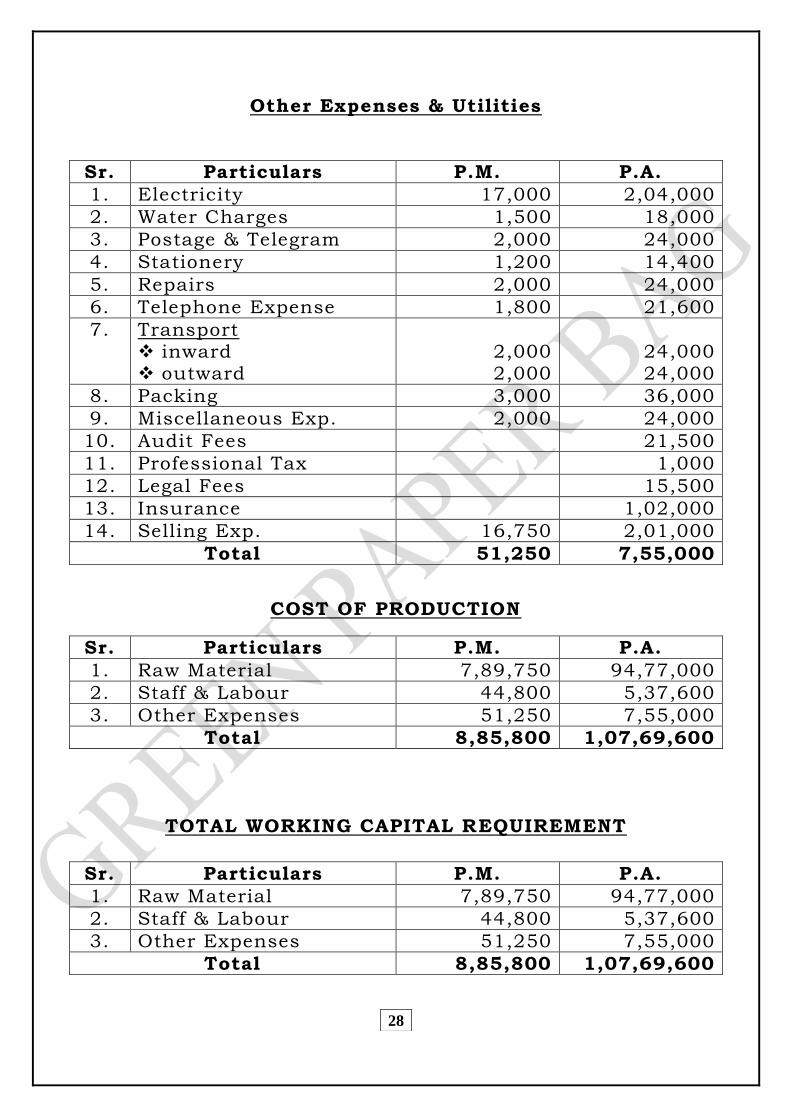
Other Expenses & Utilities
Sr. Particulars P.M. P.A.
1. Electricity 17,000 2,04,000
2. Water Charges 1,500 18,000
3. Postage & Telegram 2,000 24,000
4. Stationery 1,200 14,400
5. Repairs 2,000 24,000
6. Telephone Expense 1,800 21,600
7. Transport inward outward
2,000 2,000
24,000 24,000
8. Packing 3,000 36,000
9. Miscellaneous Exp. 2,000 24,000
10. Audit Fees 21,500
11. Professional Tax 1,000
12. Legal Fees 15,500
13. Insurance 1,02,000
14. Selling Exp. 16,750 2,01,000
Total 51,250 7,55,000
COST OF PRODUCTION
TOTAL WORKING CAPITAL REQUIREMENT
Sr. Particulars P.M. P.A.
1. Raw Material 7,89,750 94,77,000
2. Staff & Labour 44,800 5,37,600
3. Other Expenses 51,250 7,55,000
Total 8,85,800 1,07,69,600
Sr. Particulars P.M. P.A.
1. Raw Material 7,89,750 94,77,000
2. Staff & Labour 44,800 5,37,600
3. Other Expenses 51,250 7,55,000
Total 8,85,800 1,07,69,600
29
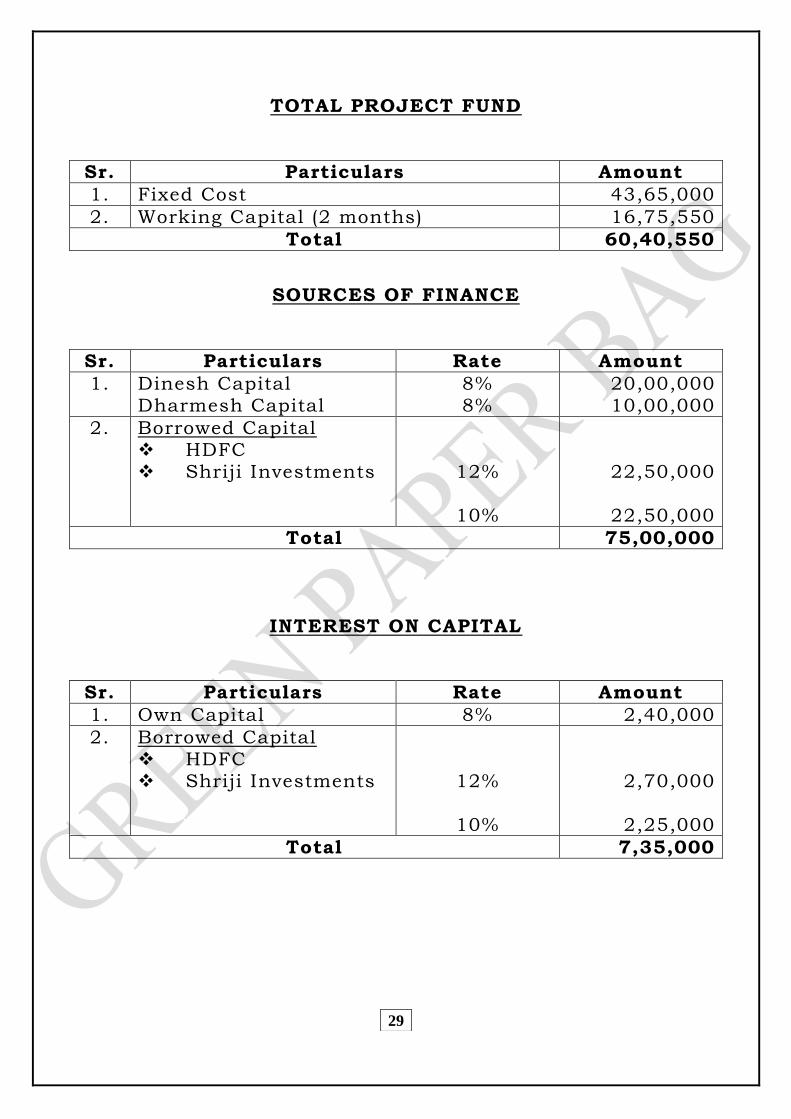
TOTAL PROJECT FUND
Sr. Particulars Amount
1. Fixed Cost 43,65,000
2. Working Capital (2 months) 16,75,550
Total 60,40,550
SOURCES OF FINANCE
Sr. Particulars Rate Amount
1. Dinesh Capital Dharmesh Capital
8% 8%
20,00,000 10,00,000
2. Borrowed Capital HDFC Shriji Investments
12%
10%
22,50,000
22,50,000
Total 75,00,000
INTEREST ON CAPITAL
Sr. Particulars Rate Amount
1. Own Capital 8% 2,40,000
2. Borrowed Capital HDFC Shriji Investments
12%
10%
2,70,000
2,25,000
Total 7,35,000
30
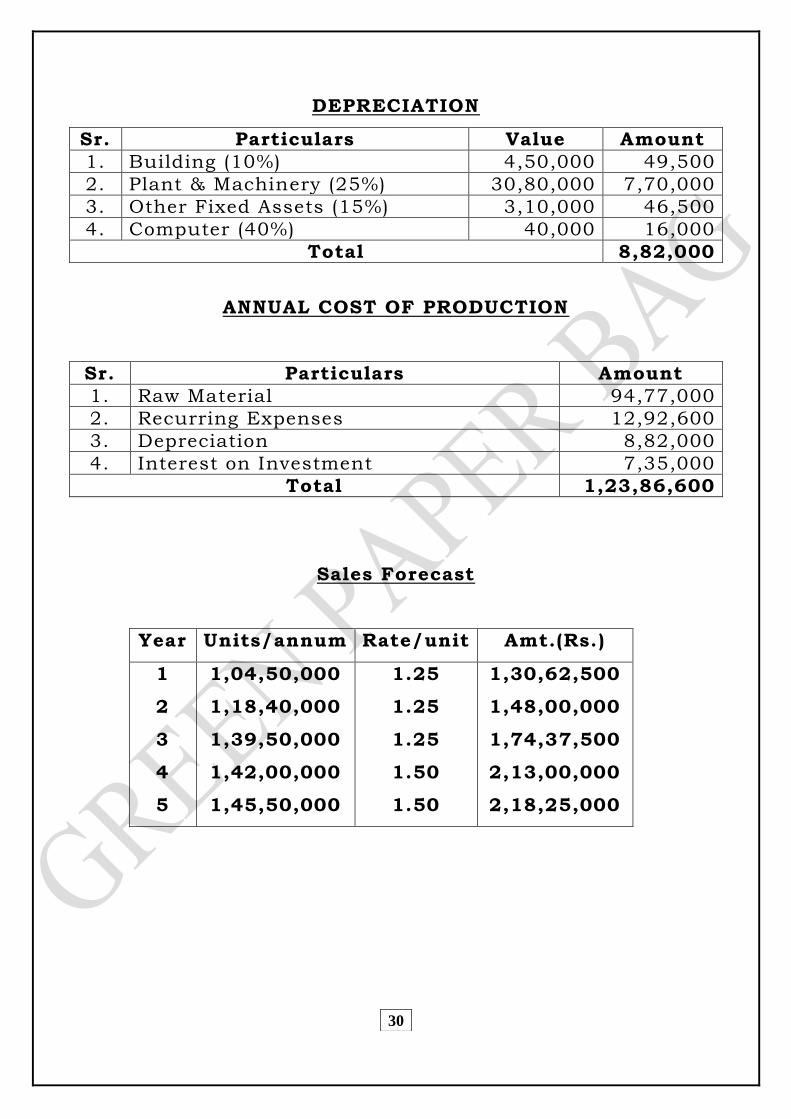
DEPRECIATION
Sr. Particulars Value Amount
1. Building (10%) 4,50,000 49,500
2. Plant & Machinery (25%) 30,80,000 7,70,000
3. Other Fixed Assets (15%) 3,10,000 46,500
4. Computer (40%) 40,000 16,000
Total 8,82,000
ANNUAL COST OF PRODUCTION
Sr. Particulars Amount
1. Raw Material 94,77,000
2. Recurring Expenses 12,92,600
3. Depreciation 8,82,000
4. Interest on Investment 7,35,000
Total 1,23,86,600
Sales Forecast
Year Units/annum Rate/unit Amt.(Rs.)
1
2
3
4
5
1,04,50,000
1,18,40,000
1,39,50,000
1,42,00,000
1,45,50,000
1.25
1.25
1.25
1.50
1.50
1,30,62,500
1,48,00,000
1,74,37,500
2,13,00,000
2,18,25,000
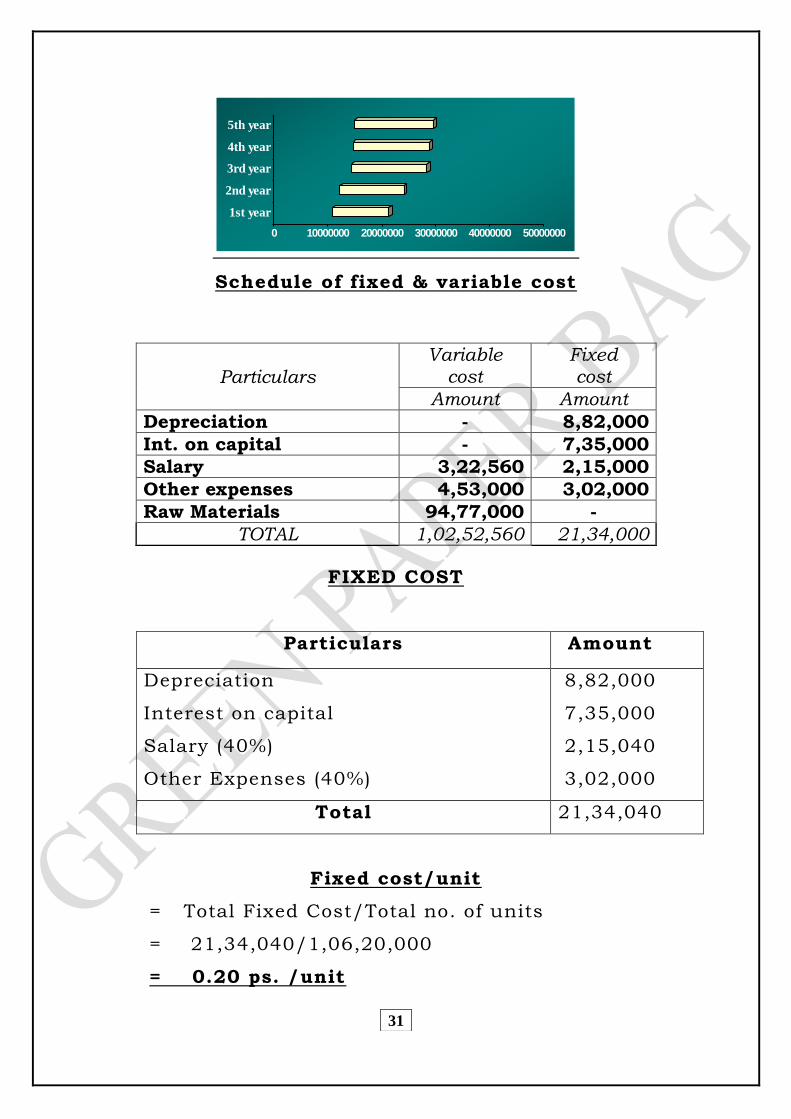
31
0 10000000 20000000 30000000 40000000 50000000
1st year
2nd year
3rd year
4th year
5th year
Schedule of fixed & variable cost
FIXED COST
Particulars Amount
Depreciation
Interest on capital
Salary (40%)
Other Expenses (40%)
8,82,000
7,35,000
2,15,040
3,02,000
Total 21,34,040
Fixed cost/unit
= Total Fixed Cost/Total no. of units
= 21,34,040/1,06,20,000
= 0.20 ps. /unit
Particulars
Variable cost
Fixed cost
Amount Amount
Depreciation - 8,82,000
Int. on capital - 7,35,000
Salary 3,22,560 2,15,000
Other expenses 4,53,000 3,02,000
Raw Materials 94,77,000 -
TOTAL 1,02,52,560 21,34,000
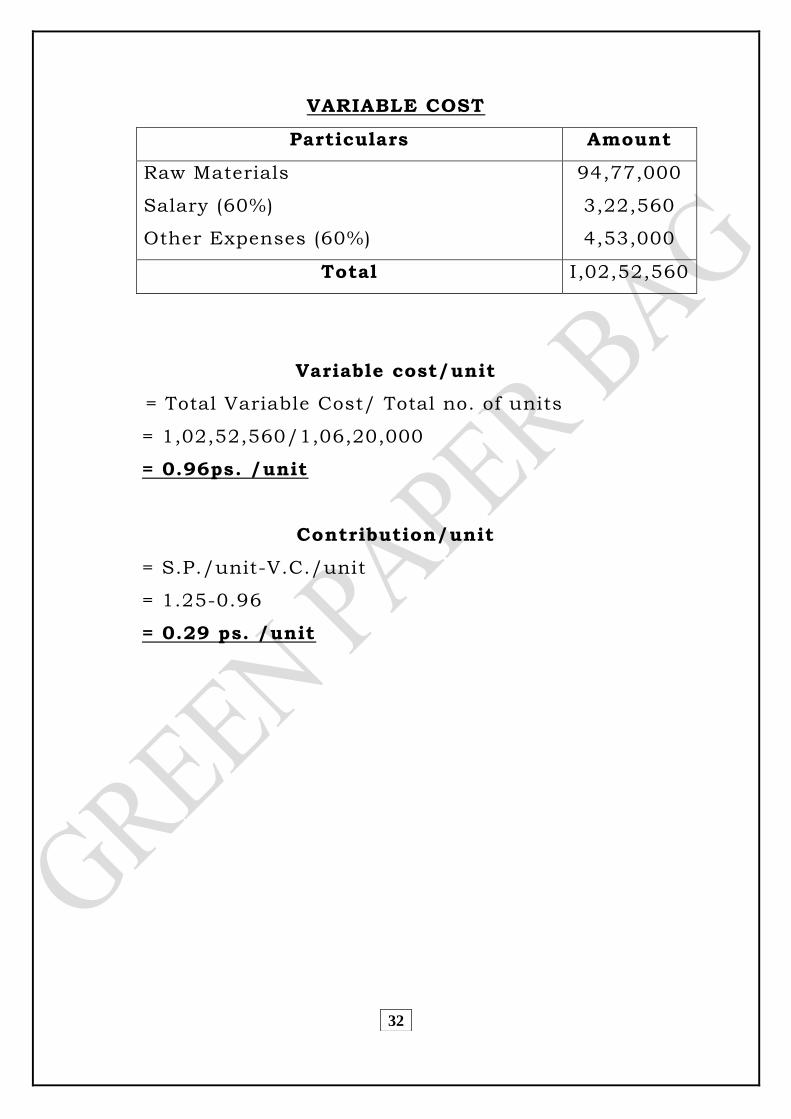
32
VARIABLE COST
Particulars Amount
Raw Materials
Salary (60%)
Other Expenses (60%)
94,77,000
3,22,560
4,53,000
Total I,02,52,560
Variable cost/unit
= Total Variable Cost/ Total no. of units
= 1,02,52,560/1,06,20,000
= 0.96ps. /unit
Contribution/unit
= S.P./unit-V.C./unit
= 1.25-0.96
= 0.29 ps. /unit
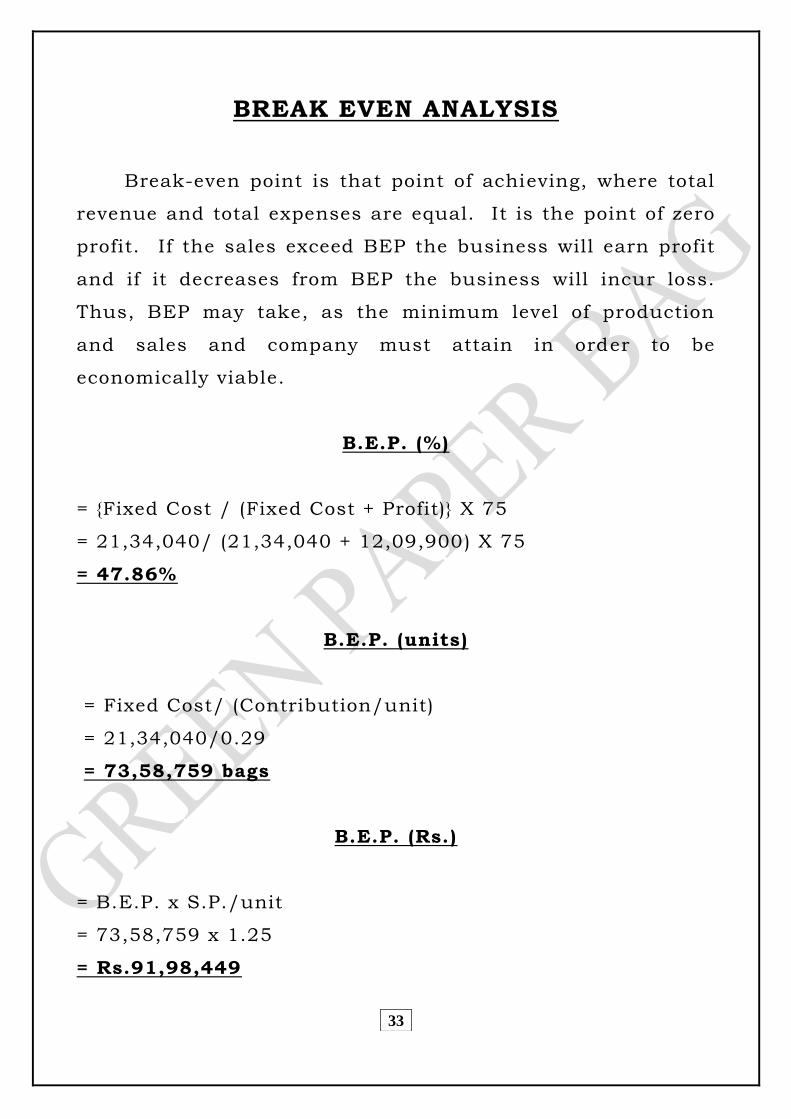
33
BREAK EVEN ANALYSIS
Break-even point is that point of achieving, where total
revenue and total expenses are equal. It is the point of zero
profit. If the sales exceed BEP the business will earn profit
and if it decreases from BEP the business will incur loss.
Thus, BEP may take, as the minimum level of production
and sales and company must attain in order to be
economically viable.
B.E.P. (%)
= {Fixed Cost / (Fixed Cost + Profit)} X 75
= 21,34,040/ (21,34,040 + 12,09,900) X 75
= 47.86%
B.E.P. (units)
= Fixed Cost/ (Contribution/unit)
= 21,34,040/0.29
= 73,58,759 bags
B.E.P. (Rs.)
= B.E.P. x S.P./unit
= 73,58,759 x 1.25
= Rs.91,98,449
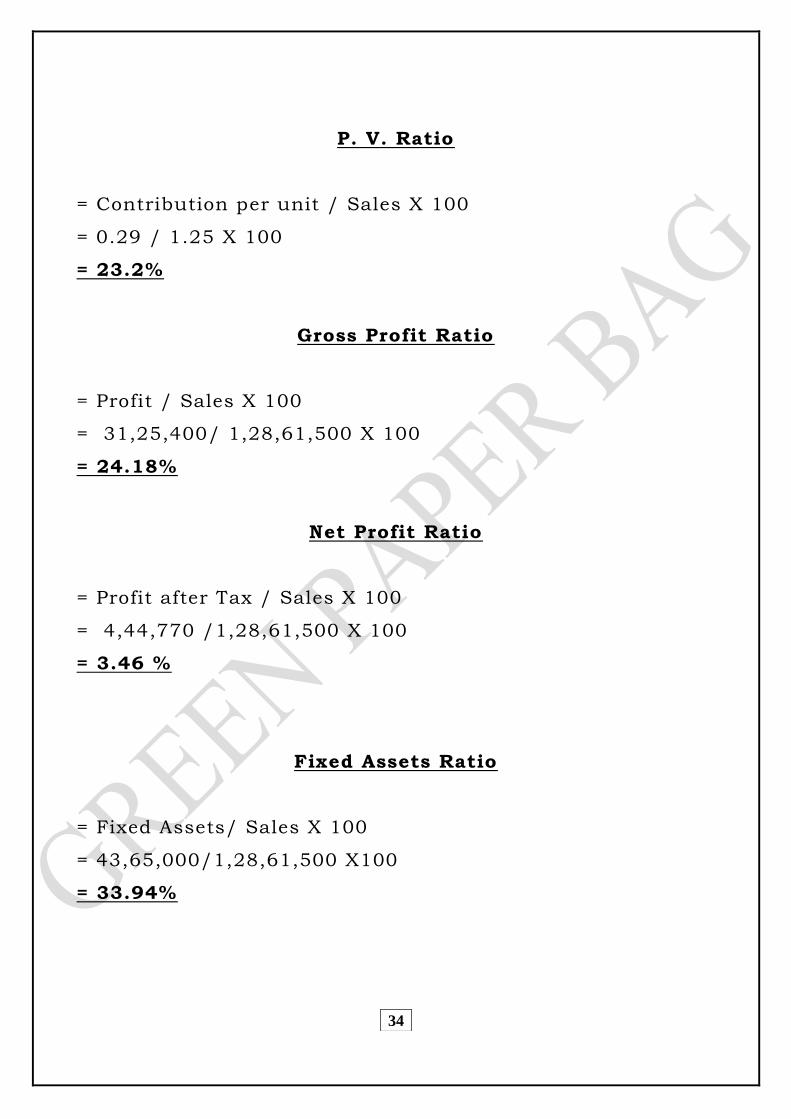
34
P. V. Ratio
= Contribution per unit / Sales X 100
= 0.29 / 1.25 X 100
= 23.2%
Gross Profit Ratio
= Profit / Sales X 100
= 31,25,400/ 1,28,61,500 X 100
= 24.18%
Net Profit Ratio
= Profit after Tax / Sales X 100
= 4,44,770 /1,28,61,500 X 100
= 3.46 %
Fixed Assets Ratio
= Fixed Assets/ Sales X 100
= 43,65,000/1,28,61,500 X100
= 33.94%
35
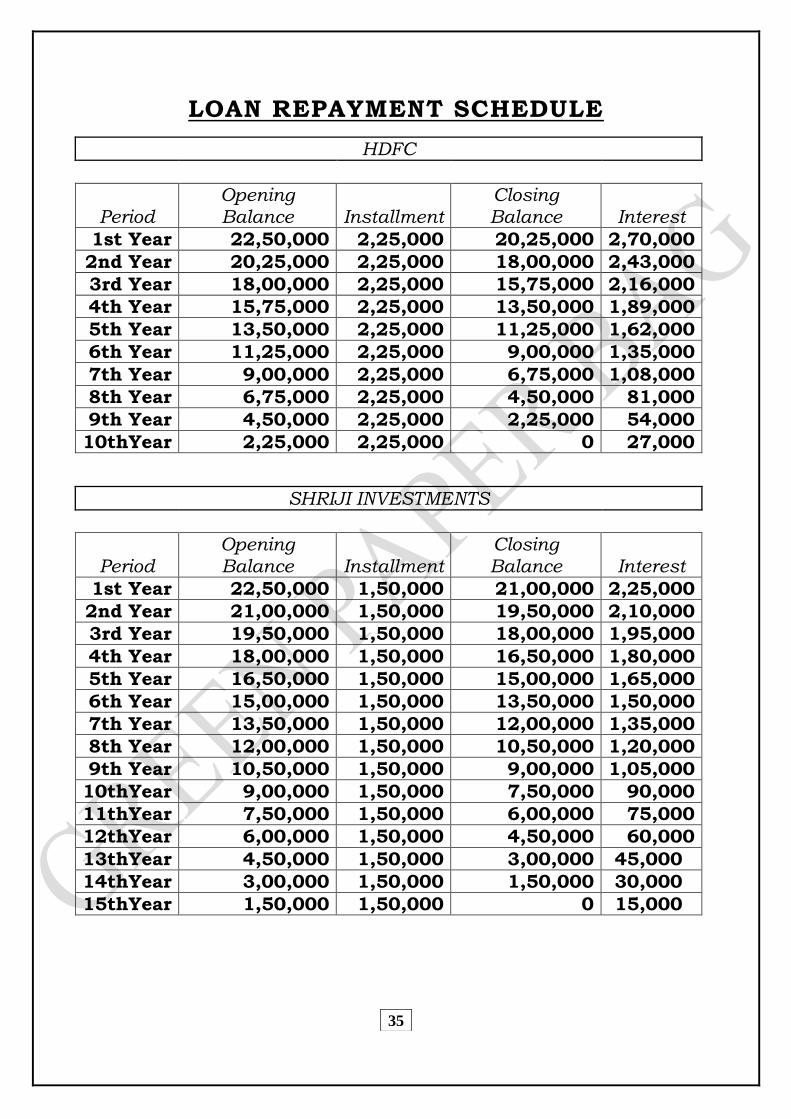
LOAN REPAYMENT SCHEDULE
HDFC
Period Opening Balance Installment
Closing Balance Interest
1st Year 22,50,000 2,25,000 20,25,000 2,70,000
2nd Year 20,25,000 2,25,000 18,00,000 2,43,000
3rd Year 18,00,000 2,25,000 15,75,000 2,16,000
4th Year 15,75,000 2,25,000 13,50,000 1,89,000
5th Year 13,50,000 2,25,000 11,25,000 1,62,000
6th Year 11,25,000 2,25,000 9,00,000 1,35,000
7th Year 9,00,000 2,25,000 6,75,000 1,08,000
8th Year 6,75,000 2,25,000 4,50,000 81,000
9th Year 4,50,000 2,25,000 2,25,000 54,000
10thYear 2,25,000 2,25,000 0 27,000
SHRIJI INVESTMENTS
Period Opening Balance Installment
Closing Balance Interest
1st Year 22,50,000 1,50,000 21,00,000 2,25,000
2nd Year 21,00,000 1,50,000 19,50,000 2,10,000
3rd Year 19,50,000 1,50,000 18,00,000 1,95,000
4th Year 18,00,000 1,50,000 16,50,000 1,80,000
5th Year 16,50,000 1,50,000 15,00,000 1,65,000
6th Year 15,00,000 1,50,000 13,50,000 1,50,000
7th Year 13,50,000 1,50,000 12,00,000 1,35,000
8th Year 12,00,000 1,50,000 10,50,000 1,20,000
9th Year 10,50,000 1,50,000 9,00,000 1,05,000
10thYear 9,00,000 1,50,000 7,50,000 90,000
11thYear 7,50,000 1,50,000 6,00,000 75,000
12thYear 6,00,000 1,50,000 4,50,000 60,000
13thYear 4,50,000 1,50,000 3,00,000 45,000
14thYear 3,00,000 1,50,000 1,50,000 30,000
15thYear 1,50,000 1,50,000 0 15,000
36
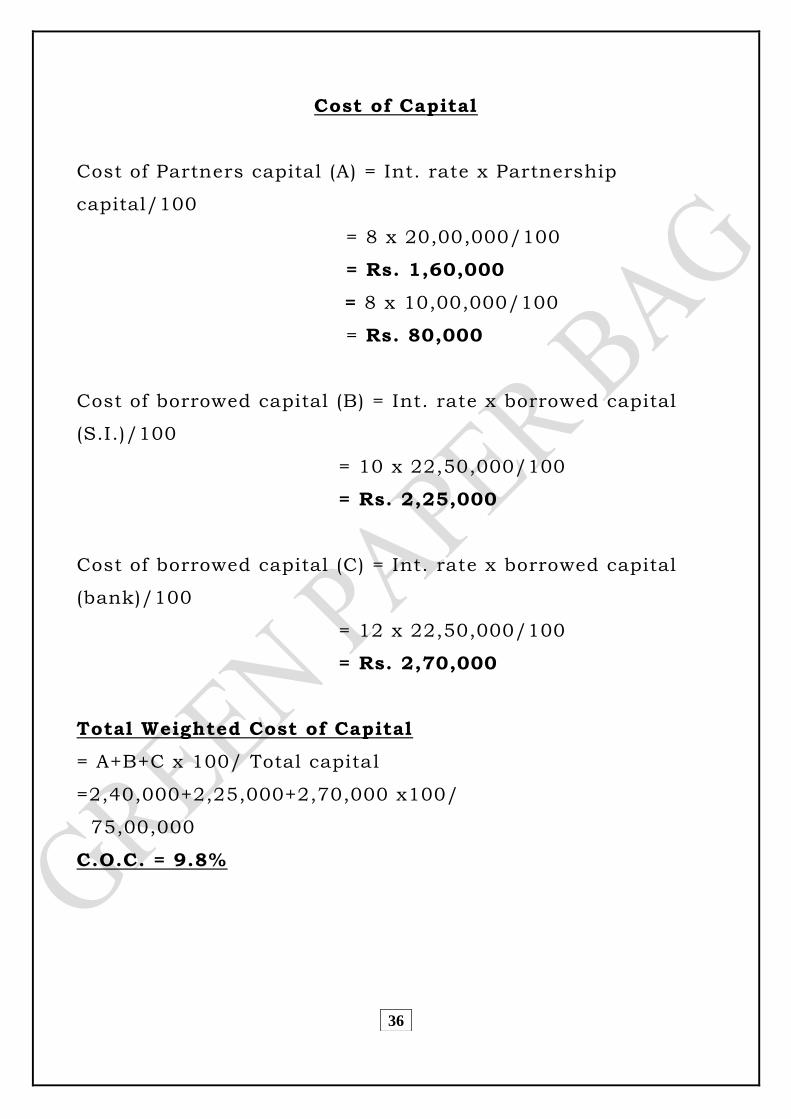
Cost of Capital
Cost of Partners capital (A) = Int. rate x Partnership
capital/100
= 8 x 20,00,000/100
= Rs. 1,60,000
= 8 x 10,00,000/100
= Rs. 80,000
Cost of borrowed capital (B) = Int. rate x borrowed capital
(S.I.)/100
= 10 x 22,50,000/100
= Rs. 2,25,000
Cost of borrowed capital (C) = Int. rate x borrowed capital
(bank)/100
= 12 x 22,50,000/100
= Rs. 2,70,000
Total Weighted Cost of Capital
= A+B+C x 100/ Total capital
=2,40,000+2,25,000+2,70,000 x100/
75,00,000
C.O.C. = 9.8%
37
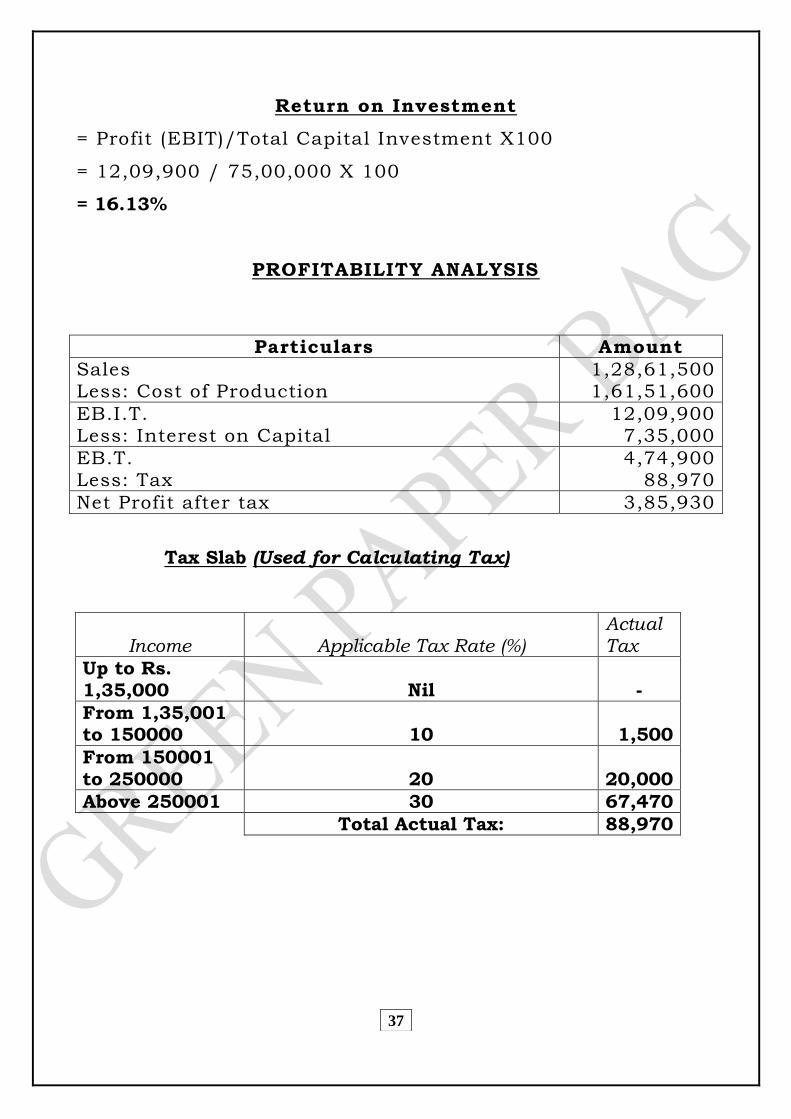
Return on Investment
= Profit (EBIT)/Total Capital Investment X100
= 12,09,900 / 75,00,000 X 100
= 16.13%
PROFITABILITY ANALYSIS
Particulars Amount
Sales Less: Cost of Production
1,28,61,500 1,61,51,600
EB.I.T. Less: Interest on Capital
12,09,900 7,35,000
EB.T. Less: Tax
4,74,900 88,970
Net Profit after tax 3,85,930
Tax Slab (Used for Calculating Tax)
Income Applicable Tax Rate (%) Actual Tax
Up to Rs. 1,35,000 Nil -
From 1,35,001 to 150000 10 1,500
From 150001 to 250000 20 20,000
Above 250001 30 67,470
Total Actual Tax: 88,970
38
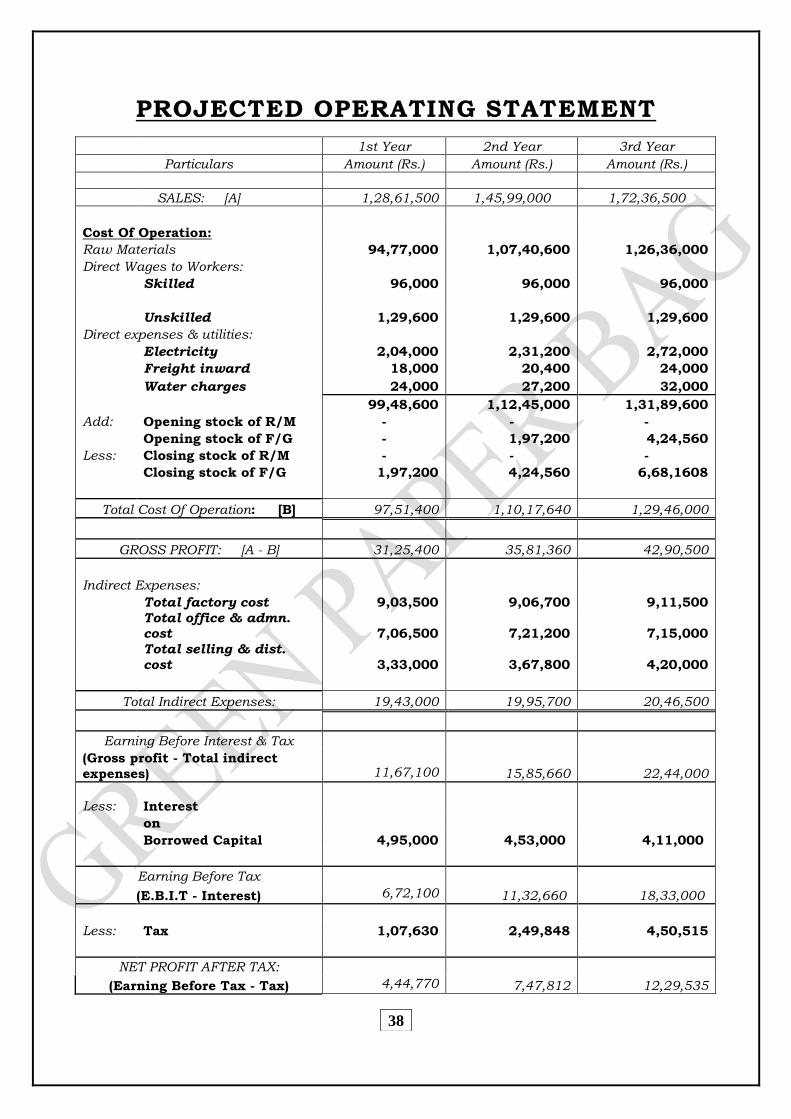
PROJECTED OPERATING STATEMENT
1st Year 2nd Year 3rd Year
Particulars Amount (Rs.) Amount (Rs.) Amount (Rs.)
SALES: [A] 1,28,61,500 1,45,99,000 1,72,36,500
Cost Of Operation:
Raw Materials 94,77,000 1,07,40,600 1,26,36,000
Direct Wages to Workers:
Skilled 96,000 96,000 96,000
Unskilled 1,29,600 1,29,600 1,29,600
Direct expenses & utilities:
Electricity 2,04,000 2,31,200 2,72,000
Freight inward 18,000 20,400 24,000
Water charges 24,000 27,200 32,000
99,48,600 1,12,45,000 1,31,89,600
Add: Opening stock of R/M - - -
Opening stock of F/G - 1,97,200 4,24,560
Less: Closing stock of R/M - - -
Closing stock of F/G 1,97,200 4,24,560 6,68,1608
Total Cost Of Operation: [B] 97,51,400 1,10,17,640 1,29,46,000
GROSS PROFIT: [A - B] 31,25,400 35,81,360 42,90,500
Indirect Expenses:
Total factory cost 9,03,500 9,06,700 9,11,500
Total office & admn. cost 7,06,500 7,21,200 7,15,000
Total selling & dist.
cost 3,33,000 3,67,800 4,20,000
Total Indirect Expenses: 19,43,000 19,95,700 20,46,500
Earning Before Interest & Tax
11,67,100 15,85,660 22,44,000
(Gross profit - Total indirect
expenses)
Less: Interest
on
Borrowed Capital 4,95,000 4,53,000 4,11,000
Earning Before Tax 6,72,100 11,32,660
(E.B.I.T - Interest) 18,33,000
Less: Tax 1,07,630 2,49,848 4,50,515
NET PROFIT AFTER TAX:
4,44,770 7,47,812 12,29,535 (Earning Before Tax - Tax)
39
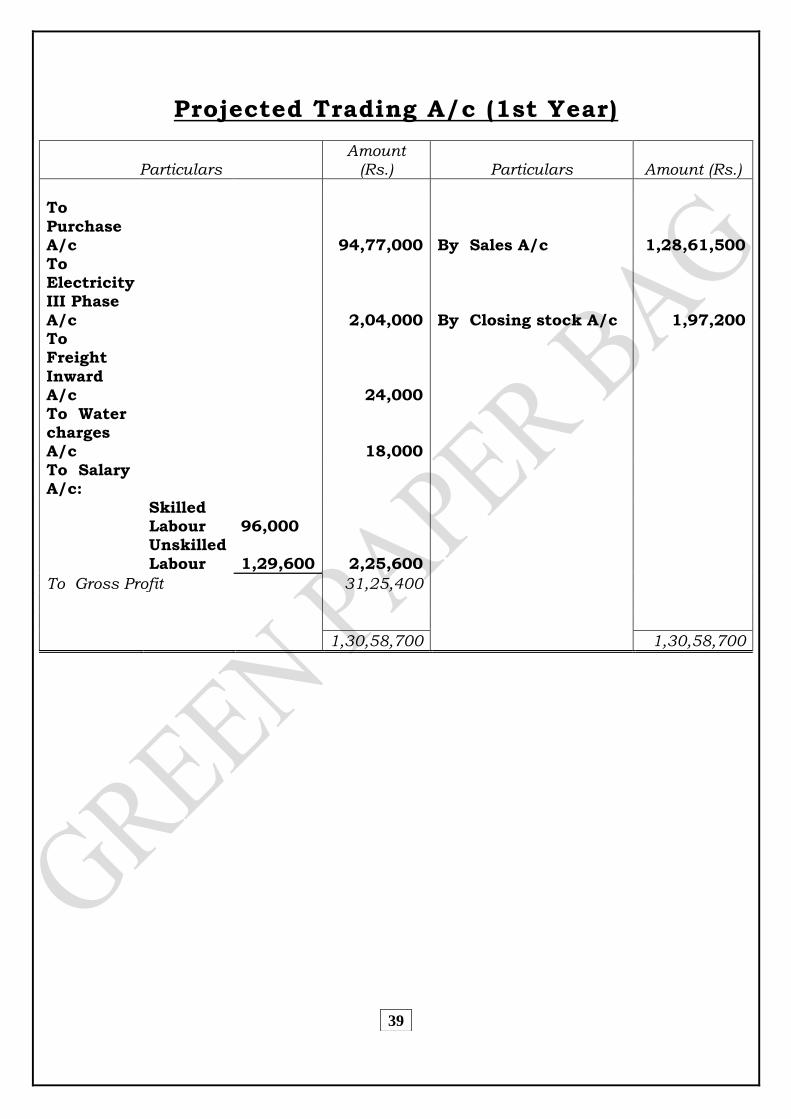
Projected Trading A/c (1st Year)
Particulars Amount
(Rs.) Particulars Amount (Rs.)
To
Purchase A/c 94,77,000 By Sales A/c 1,28,61,500
To Electricity III Phase
A/c 2,04,000 By Closing stock A/c 1,97,200 To Freight
Inward A/c 24,000
To Water charges A/c 18,000
To Salary A/c:
Skilled Labour
96,000
Unskilled
Labour 1,29,600 2,25,600
To Gross Profit 31,25,400
1,30,58,700 1,30,58,700
40
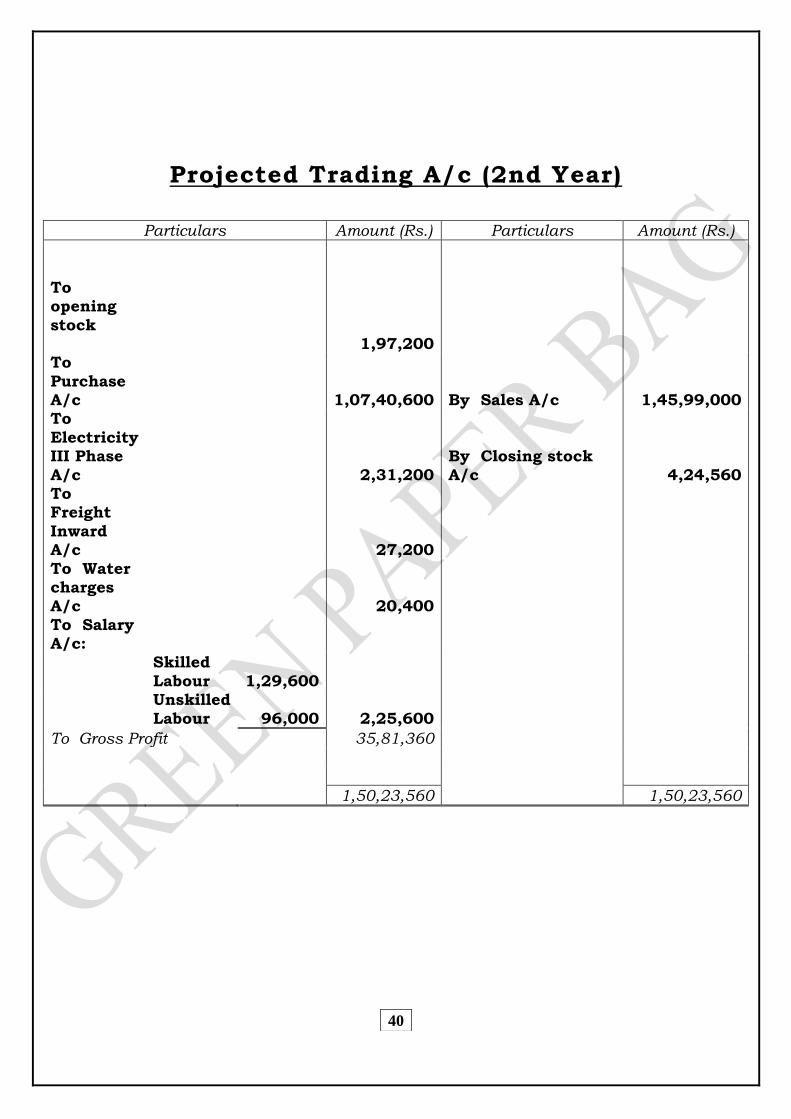
Projected Trading A/c (2nd Year)
Particulars Amount (Rs.) Particulars Amount (Rs.)
To opening
stock 1,97,200 To
Purchase A/c 1,07,40,600 By Sales A/c 1,45,99,000 To
Electricity III Phase
A/c 2,31,200
By Closing stock
A/c 4,24,560 To Freight
Inward A/c 27,200
To Water charges A/c 20,400
To Salary A/c:
Skilled
Labour 1,29,600
Unskilled
Labour 96,000 2,25,600
To Gross Profit 35,81,360
1,50,23,560 1,50,23,560
41
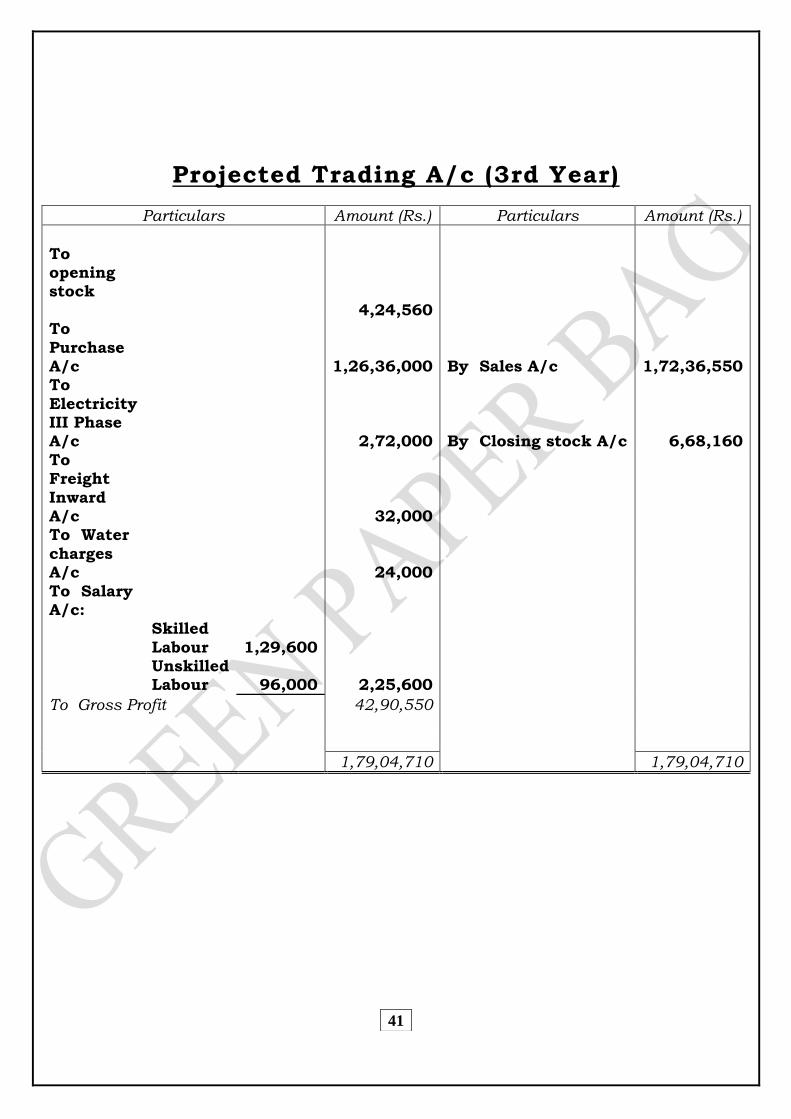
Projected Trading A/c (3rd Year)
Particulars Amount (Rs.) Particulars Amount (Rs.)
To opening stock
4,24,560 To
Purchase A/c 1,26,36,000 By Sales A/c 1,72,36,550 To
Electricity III Phase A/c 2,72,000 By Closing stock A/c 6,68,160
To Freight
Inward A/c 32,000 To Water
charges A/c 24,000
To Salary A/c:
Skilled
Labour 1,29,600
Unskilled Labour 96,000 2,25,600
To Gross Profit 42,90,550
1,79,04,710 1,79,04,710
42
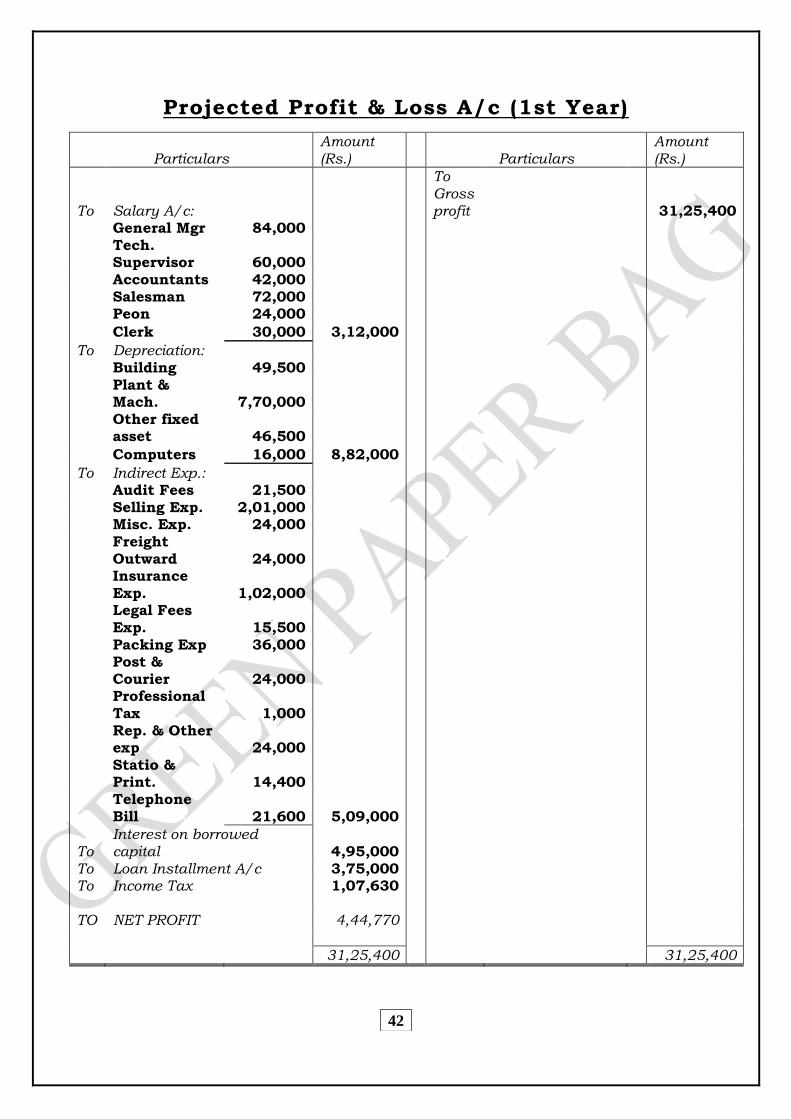
Projected Profit & Loss A/c (1st Year)
Particulars Amount (Rs.) Particulars
Amount (Rs.)
To Salary A/c:
To Gross profit 31,25,400
General Mgr 84,000
Tech. Supervisor 60,000
Accountants 42,000 Salesman 72,000 Peon 24,000
Clerk 30,000 3,12,000
To Depreciation: Building 49,500
Plant & Mach. 7,70,000
Other fixed asset 46,500
Computers 16,000 8,82,000
To Indirect Exp.: Audit Fees 21,500 Selling Exp. 2,01,000 Misc. Exp. 24,000
Freight Outward 24,000
Insurance Exp. 1,02,000
Legal Fees Exp. 15,500
Packing Exp 36,000
Post & Courier 24,000
Professional Tax 1,000
Rep. & Other exp 24,000
Statio & Print. 14,400
Telephone Bill 21,600 5,09,000
To Interest on borrowed capital 4,95,000
To Loan Installment A/c 3,75,000 To Income Tax 1,07,630 TO NET PROFIT 4,44,770
31,25,400 31,25,400
43
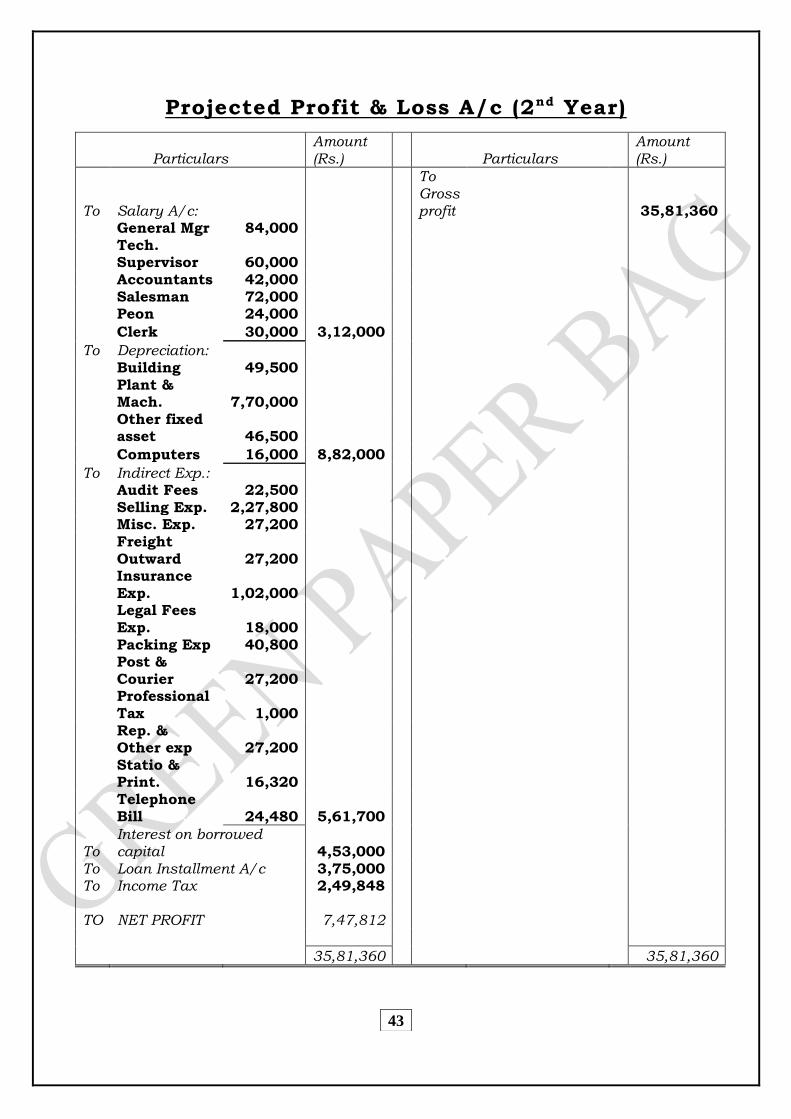
Projected Profit & Loss A/c (2nd Year)
Particulars Amount (Rs.) Particulars
Amount (Rs.)
To Salary A/c:
To Gross profit 35,81,360
General Mgr 84,000
Tech. Supervisor 60,000
Accountants 42,000 Salesman 72,000 Peon 24,000
Clerk 30,000 3,12,000
To Depreciation: Building 49,500
Plant & Mach. 7,70,000
Other fixed asset 46,500
Computers 16,000 8,82,000
To Indirect Exp.: Audit Fees 22,500 Selling Exp. 2,27,800 Misc. Exp. 27,200
Freight Outward 27,200
Insurance Exp. 1,02,000
Legal Fees Exp. 18,000
Packing Exp 40,800
Post & Courier 27,200
Professional Tax 1,000
Rep. & Other exp 27,200
Statio & Print. 16,320
Telephone Bill 24,480 5,61,700
To Interest on borrowed capital 4,53,000
To Loan Installment A/c 3,75,000 To Income Tax 2,49,848 TO NET PROFIT 7,47,812
35,81,360 35,81,360
44
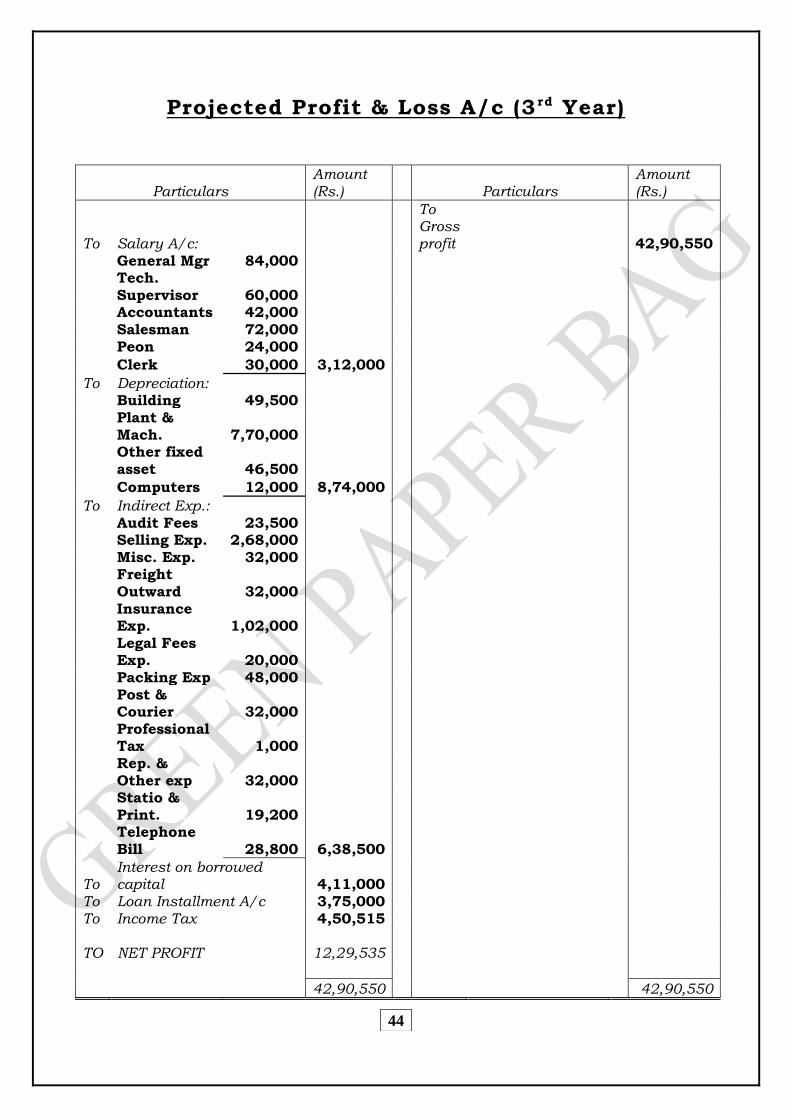
Projected Profit & Loss A/c (3 rd Year)
Particulars Amount (Rs.) Particulars
Amount (Rs.)
To Salary A/c:
To Gross profit 42,90,550
General Mgr 84,000
Tech. Supervisor 60,000
Accountants 42,000
Salesman 72,000 Peon 24,000
Clerk 30,000 3,12,000
To Depreciation: Building 49,500
Plant & Mach. 7,70,000
Other fixed asset 46,500
Computers 12,000 8,74,000
To Indirect Exp.: Audit Fees 23,500 Selling Exp. 2,68,000 Misc. Exp. 32,000
Freight Outward 32,000
Insurance Exp. 1,02,000
Legal Fees Exp. 20,000
Packing Exp 48,000
Post & Courier 32,000
Professional Tax 1,000
Rep. & Other exp 32,000
Statio & Print. 19,200
Telephone Bill 28,800 6,38,500
To Interest on borrowed capital 4,11,000
To Loan Installment A/c 3,75,000 To Income Tax 4,50,515 TO NET PROFIT 12,29,535
42,90,550 42,90,550
45
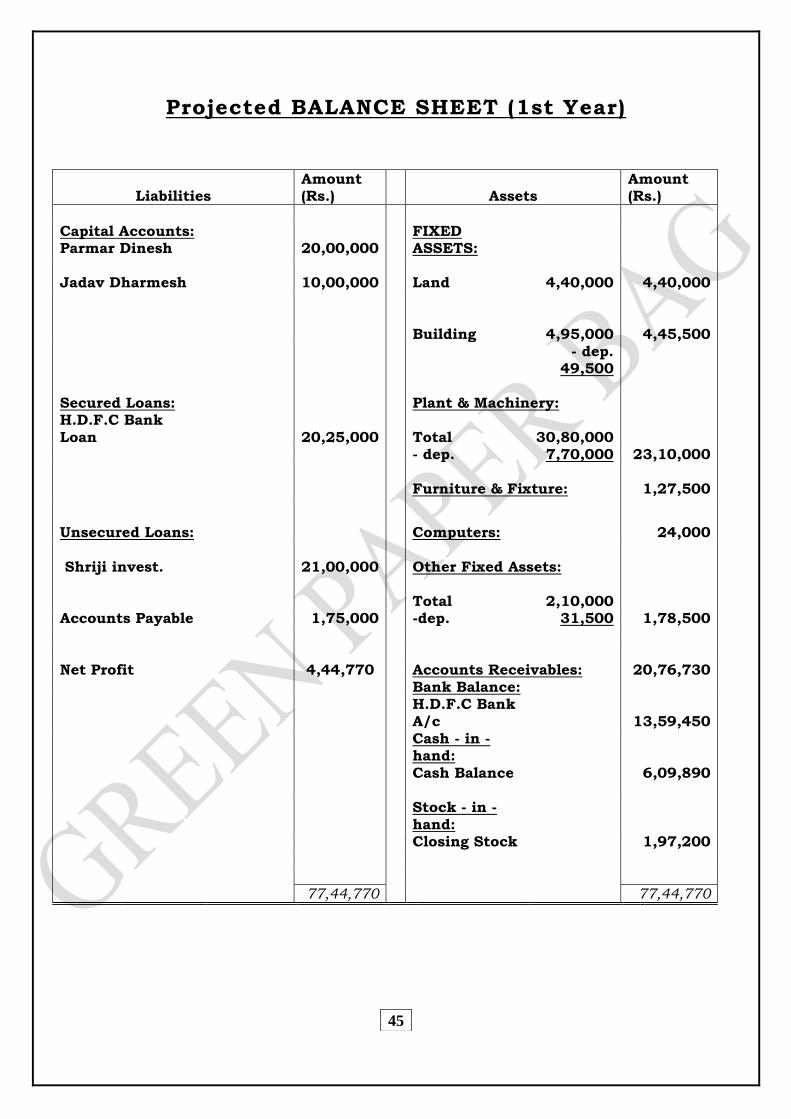
Projected BALANCE SHEET (1st Year)
Liabilities Amount (Rs.) Assets
Amount (Rs.)
Capital Accounts: Parmar Dinesh 20,00,000
FIXED ASSETS:
Jadav Dharmesh 10,00,000 Land 4,40,000 4,40,000
Building 4,95,000
4,45,500
Secured Loans:
- dep. 49,500
Plant & Machinery:
H.D.F.C Bank Loan 20,25,000 Total 30,80,000 - dep. 7,70,000 23,10,000
Furniture & Fixture: 1,27,500
Unsecured Loans: Computers: 24,000
Shriji invest. 21,00,000 Other Fixed Assets:
Total 2,10,000
Accounts Payable 1,75,000 -dep. 31,500 1,78,500 Net Profit 4,44,770 Accounts Receivables: 20,76,730 Bank Balance:
H.D.F.C Bank A/c 13,59,450
Cash - in - hand:
Cash Balance 6,09,890
Stock - in - hand:
Closing Stock 1,97,200
77,44,770 77,44,770
46
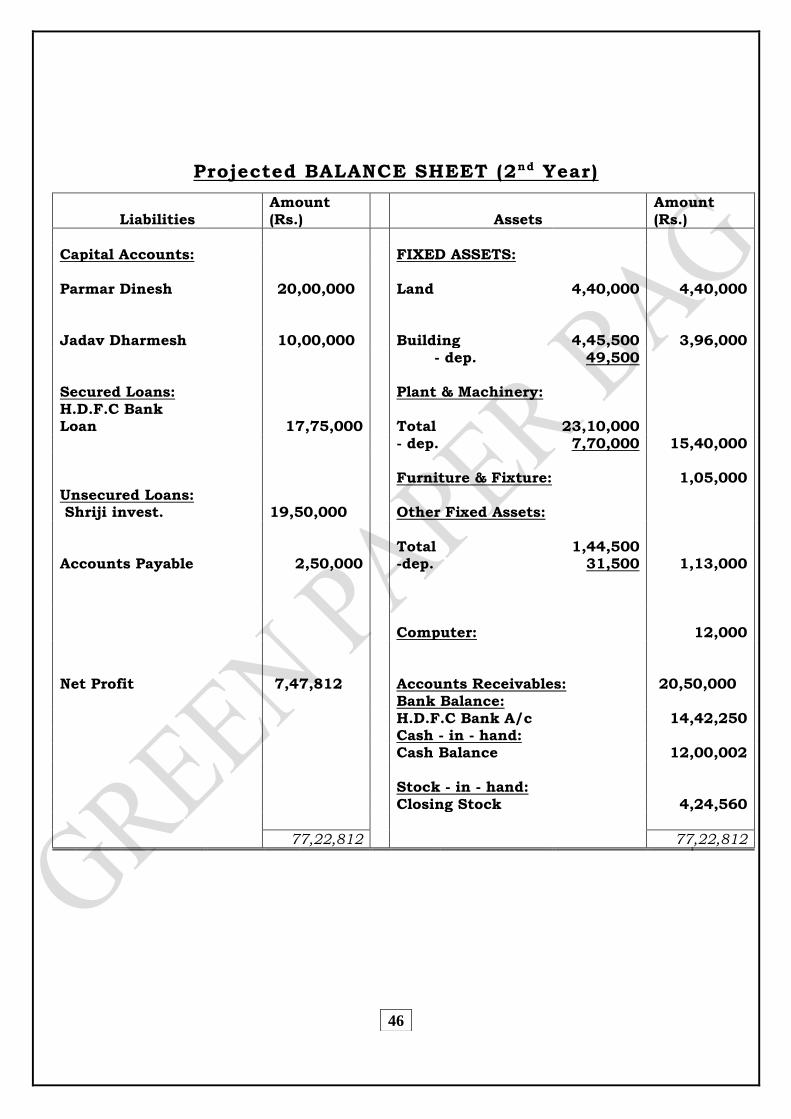
Projected BALANCE SHEET (2nd Year)
Liabilities Amount (Rs.) Assets
Amount (Rs.)
Capital Accounts: FIXED ASSETS:
Parmar Dinesh
20,00,000 Land 4,40,000 4,40,000
Jadav Dharmesh 10,00,000 Building 4,45,500
3,96,000
Secured Loans:
- dep. 49,500
Plant & Machinery: H.D.F.C Bank Loan 17,75,000 Total 23,10,000 - dep. 7,70,000 15,40,000
Furniture & Fixture: 1,05,000
Unsecured Loans: Shriji invest. 19,50,000 Other Fixed Assets:
Total 1,44,500 Accounts Payable 2,50,000 -dep. 31,500 1,13,000
Computer: 12,000
Net Profit 7,47,812
Accounts Receivables: 20,50,000
Bank Balance: H.D.F.C Bank A/c 14,42,250 Cash - in - hand: Cash Balance 12,00,002 Stock - in - hand: Closing Stock 4,24,560
77,22,812 77,22,812
47
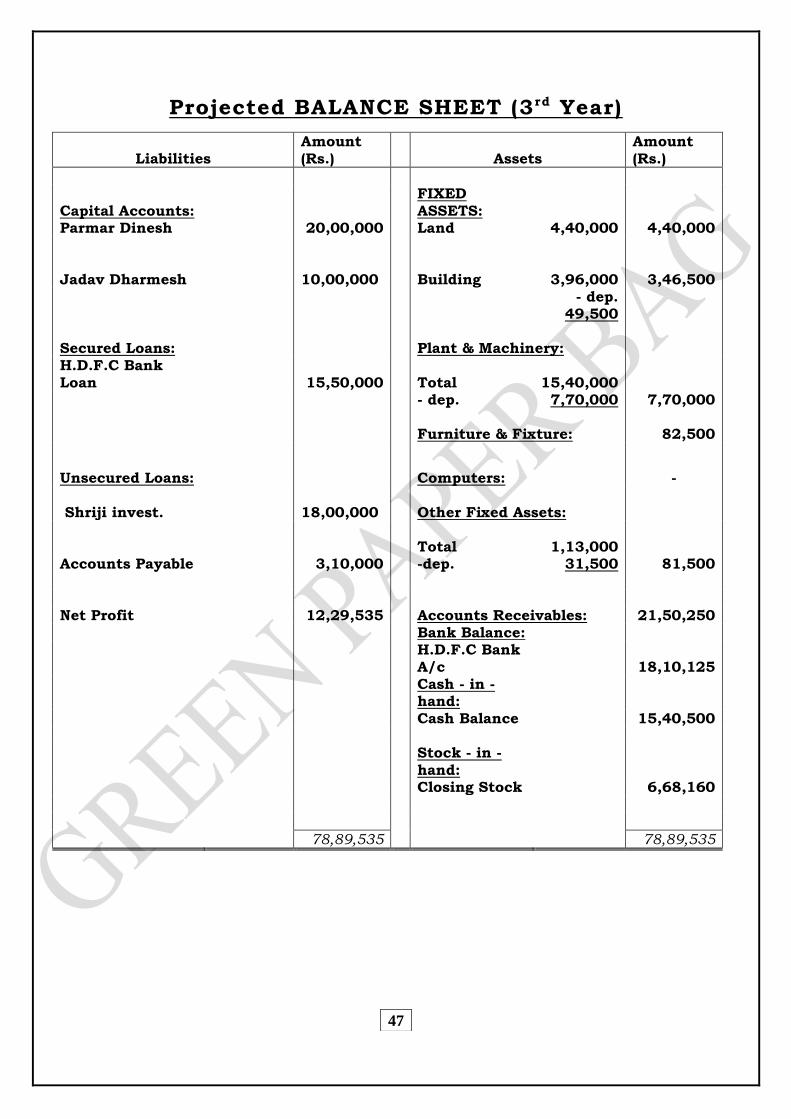
Projected BALANCE SHEET (3rd Year)
Liabilities Amount (Rs.) Assets
Amount (Rs.)
Capital Accounts: FIXED ASSETS:
Parmar Dinesh 20,00,000 Land 4,40,000 4,40,000
Jadav Dharmesh 10,00,000 Building 3,96,000
3,46,500
Secured Loans:
- dep. 49,500
Plant & Machinery:
H.D.F.C Bank Loan 15,50,000 Total 15,40,000 - dep. 7,70,000 7,70,000
Furniture & Fixture: 82,500
Unsecured Loans: Computers: -
Shriji invest. 18,00,000 Other Fixed Assets:
Total 1,13,000 Accounts Payable 3,10,000 -dep. 31,500 81,500 Net Profit 12,29,535 Accounts Receivables: 21,50,250 Bank Balance:
H.D.F.C Bank A/c 18,10,125
Cash - in - hand:
Cash Balance 15,40,500
Stock - in -
hand: Closing Stock 6,68,160
78,89,535 78,89,535
48
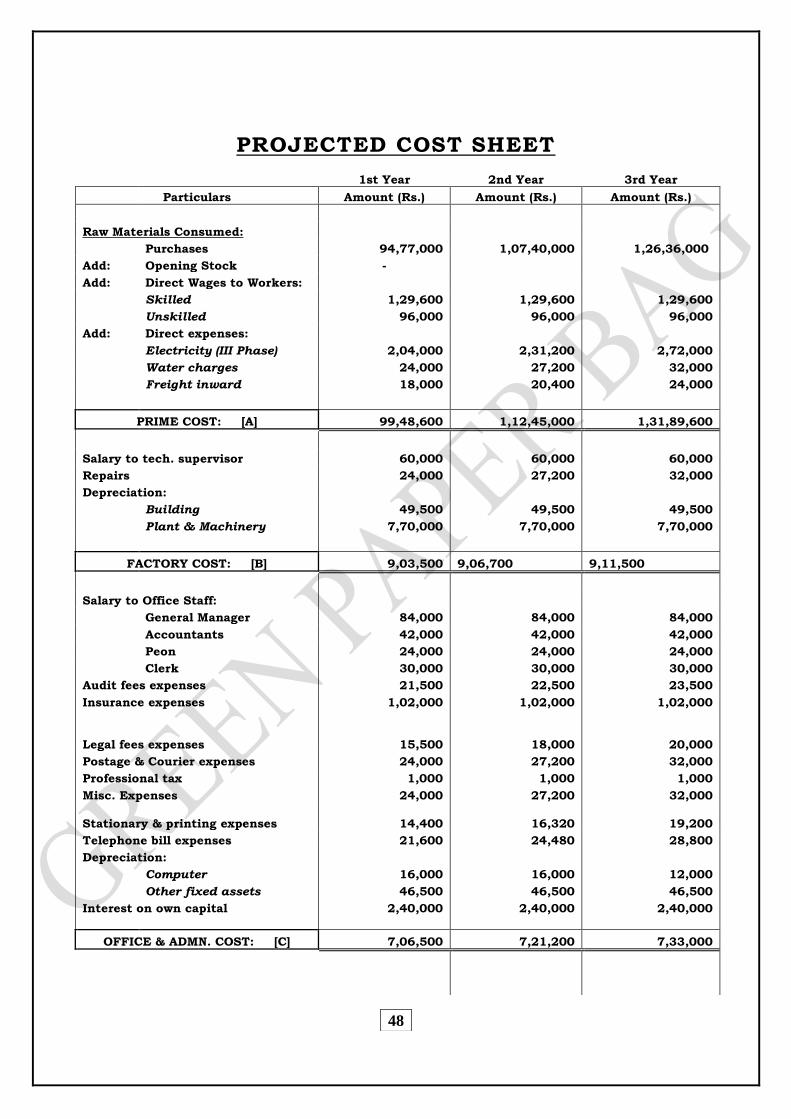
PROJECTED COST SHEET
1st Year 2nd Year 3rd Year
Particulars Amount (Rs.) Amount (Rs.) Amount (Rs.)
Raw Materials Consumed:
Purchases 94,77,000 1,07,40,000 1,26,36,000
Add: Opening Stock -
Add: Direct Wages to Workers:
Skilled 1,29,600 1,29,600 1,29,600
Unskilled 96,000 96,000 96,000
Add: Direct expenses:
Electricity (III Phase) 2,04,000 2,31,200 2,72,000
Water charges 24,000 27,200 32,000
Freight inward 18,000 20,400 24,000
PRIME COST: [A] 99,48,600 1,12,45,000 1,31,89,600
Salary to tech. supervisor 60,000 60,000 60,000
Repairs 24,000 27,200 32,000
Depreciation:
Building 49,500 49,500 49,500
Plant & Machinery 7,70,000 7,70,000 7,70,000
FACTORY COST: [B] 9,03,500 9,06,700 9,11,500
Salary to Office Staff:
General Manager 84,000 84,000 84,000
Accountants 42,000 42,000 42,000
Peon 24,000 24,000 24,000
Clerk 30,000 30,000 30,000
Audit fees expenses 21,500 22,500 23,500
Insurance expenses 1,02,000 1,02,000 1,02,000 Legal fees expenses 15,500 18,000 20,000
Postage & Courier expenses 24,000 27,200 32,000
Professional tax 1,000 1,000 1,000
Misc. Expenses 24,000 27,200 32,000 Stationary & printing expenses 14,400 16,320 19,200
Telephone bill expenses 21,600 24,480 28,800
Depreciation:
Computer 16,000 16,000 12,000
Other fixed assets 46,500 46,500 46,500
Interest on own capital 2,40,000 2,40,000 2,40,000
OFFICE & ADMN. COST: [C] 7,06,500 7,21,200 7,33,000
49
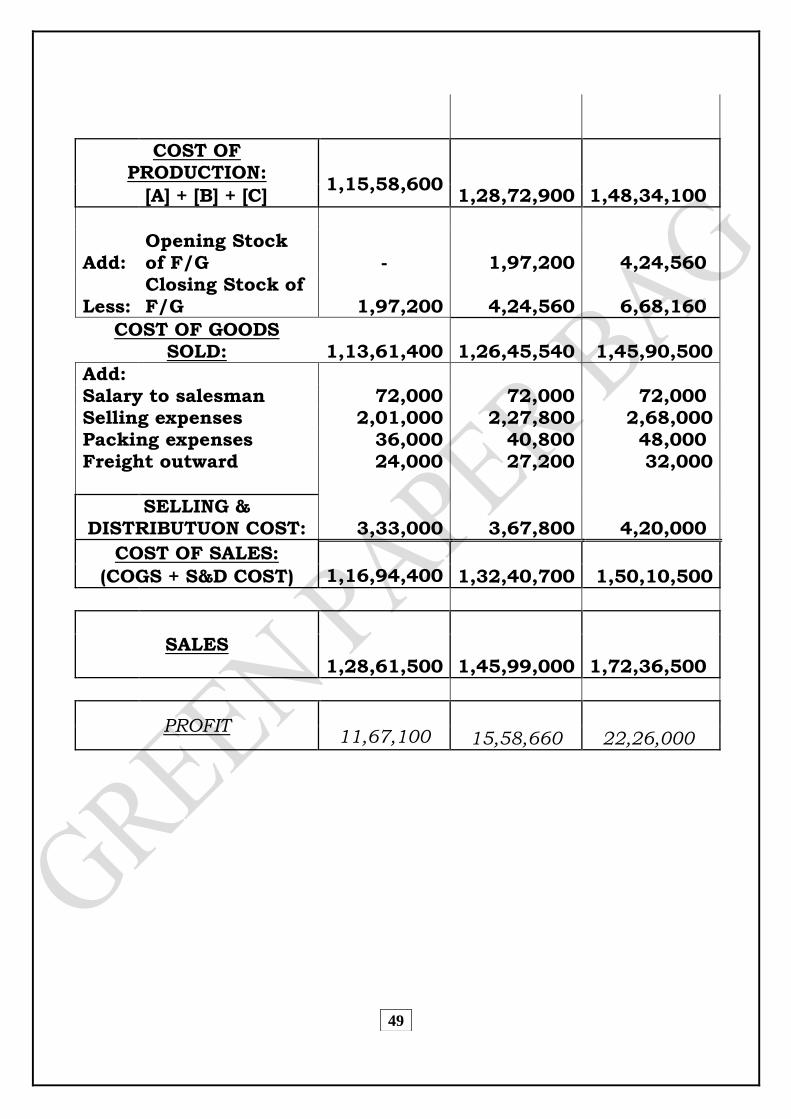
COST OF PRODUCTION:
1,15,58,600
1,28,72,900 1,48,34,100 [A] + [B] + [C]
Add: Opening Stock of F/G - 1,97,200 4,24,560
Less: Closing Stock of F/G 1,97,200 4,24,560 6,68,160
COST OF GOODS SOLD: 1,13,61,400 1,26,45,540 1,45,90,500
Add: Salary to salesman 72,000 72,000 72,000 Selling expenses 2,01,000 2,27,800 2,68,000 Packing expenses 36,000 40,800 48,000 Freight outward 24,000 27,200 32,000
SELLING & DISTRIBUTUON COST: 3,33,000 3,67,800 4,20,000
COST OF SALES: 1,16,94,400 1,32,40,700 1,50,10,500 (COGS + S&D COST)
SALES
1,28,61,500 1,45,99,000 1,72,36,500
PROFIT
11,67,100 15,58,660 22,26,000
50
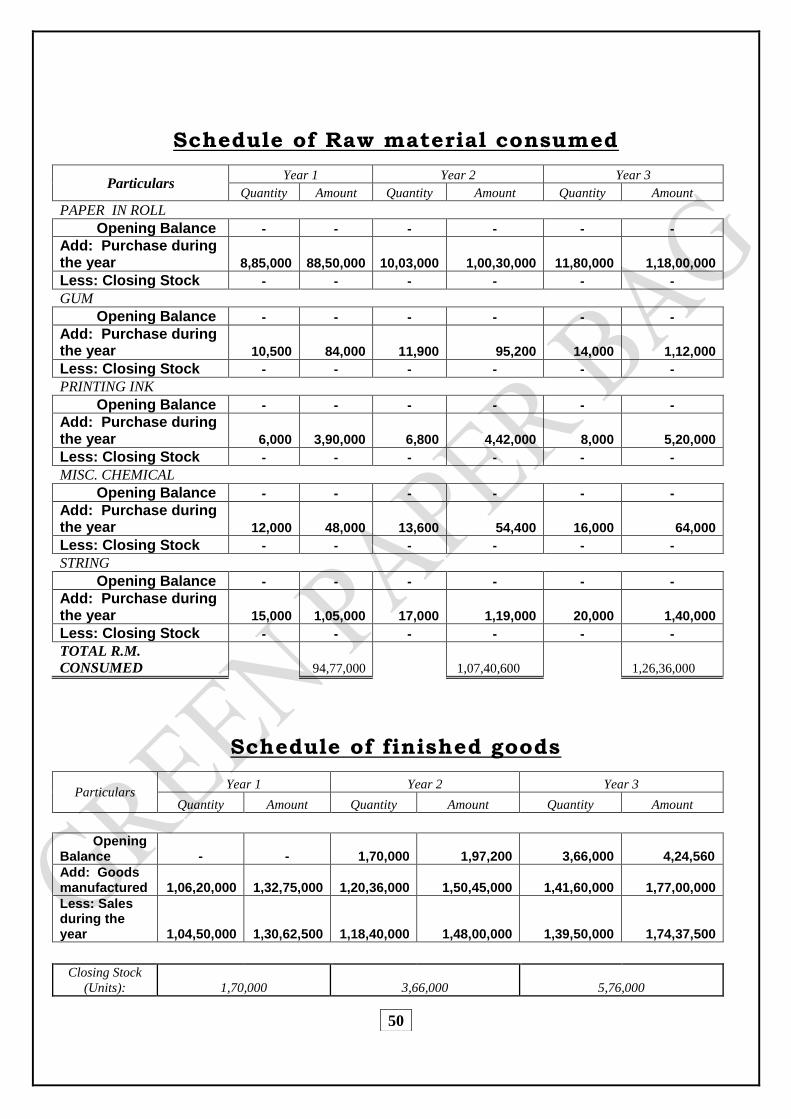
Schedule of Raw material consumed
Particulars Year 1 Year 2 Year 3
Quantity Amount Quantity Amount Quantity Amount
PAPER IN ROLL
Opening Balance - - - - - -
Add: Purchase during the year 8,85,000 88,50,000 10,03,000 1,00,30,000 11,80,000 1,18,00,000
Less: Closing Stock - - - - - -
GUM
Opening Balance - - - - - -
Add: Purchase during the year 10,500 84,000 11,900 95,200 14,000 1,12,000
Less: Closing Stock - - - - - -
PRINTING INK
Opening Balance - - - - - -
Add: Purchase during the year 6,000 3,90,000 6,800 4,42,000 8,000 5,20,000
Less: Closing Stock - - - - - -
MISC. CHEMICAL
Opening Balance - - - - - -
Add: Purchase during the year 12,000 48,000 13,600 54,400 16,000 64,000
Less: Closing Stock - - - - - -
STRING
Opening Balance - - - - - -
Add: Purchase during the year 15,000 1,05,000 17,000 1,19,000 20,000 1,40,000
Less: Closing Stock - - - - - -
TOTAL R.M.
CONSUMED 94,77,000 1,07,40,600 1,26,36,000
Schedule of finished goods
Particulars Year 1 Year 2 Year 3
Quantity Amount Quantity Amount Quantity Amount
Opening Balance - - 1,70,000 1,97,200 3,66,000 4,24,560
Add: Goods manufactured 1,06,20,000 1,32,75,000 1,20,36,000 1,50,45,000 1,41,60,000 1,77,00,000
Less: Sales during the year 1,04,50,000 1,30,62,500 1,18,40,000 1,48,00,000 1,39,50,000 1,74,37,500
Closing Stock
(Units): 1,70,000 3,66,000 5,76,000
51
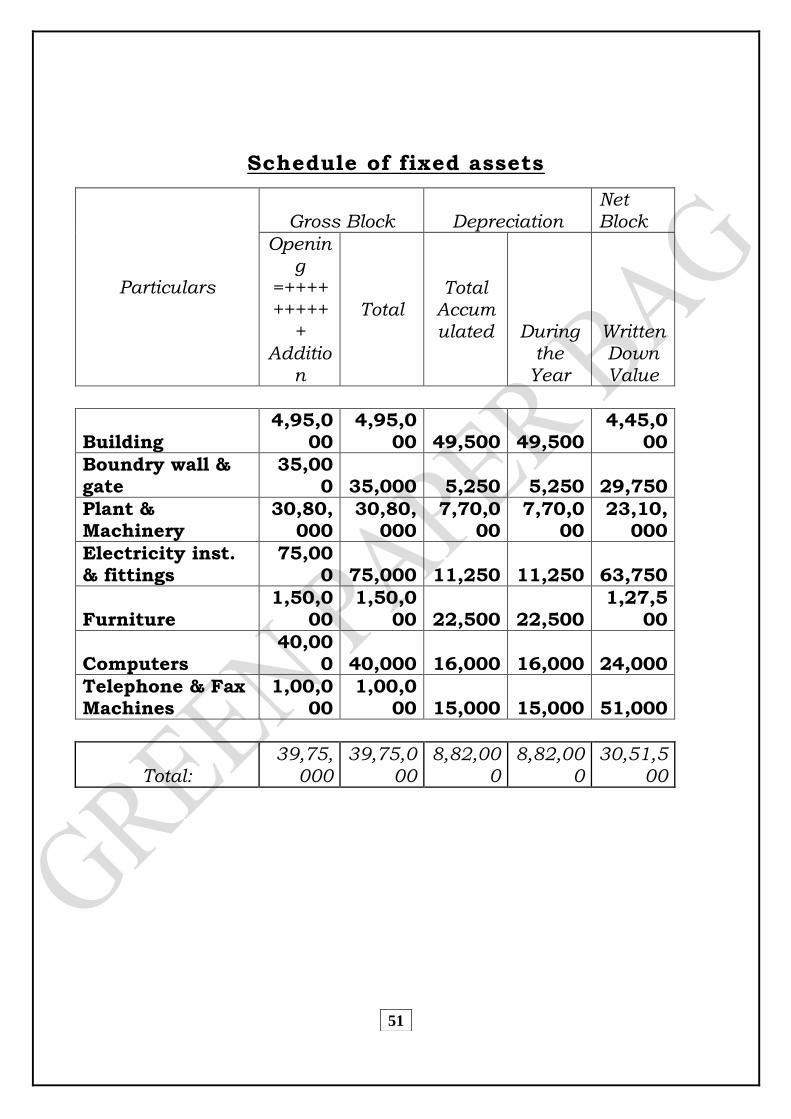
Schedule of fixed assets
Particulars
Gross Block Depreciation Net Block
Opening
=+++++++++
+ Additio
n
Total Total
Accumulated During
the Year
Written Down Value
Building 4,95,0
00 4,95,0
00 49,500 49,500 4,45,0
00
Boundry wall & gate
35,000 35,000 5,250 5,250 29,750
Plant & Machinery
30,80,000
30,80,000
7,70,000
7,70,000
23,10,000
Electricity inst. & fittings
75,000 75,000 11,250 11,250 63,750
Furniture 1,50,0
00 1,50,0
00 22,500 22,500 1,27,5
00
Computers 40,00
0 40,000 16,000 16,000 24,000
Telephone & Fax Machines
1,00,000
1,00,000 15,000 15,000 51,000
Total: 39,75,
000 39,75,0
00 8,82,00
0 8,82,00
0 30,51,5
00
52
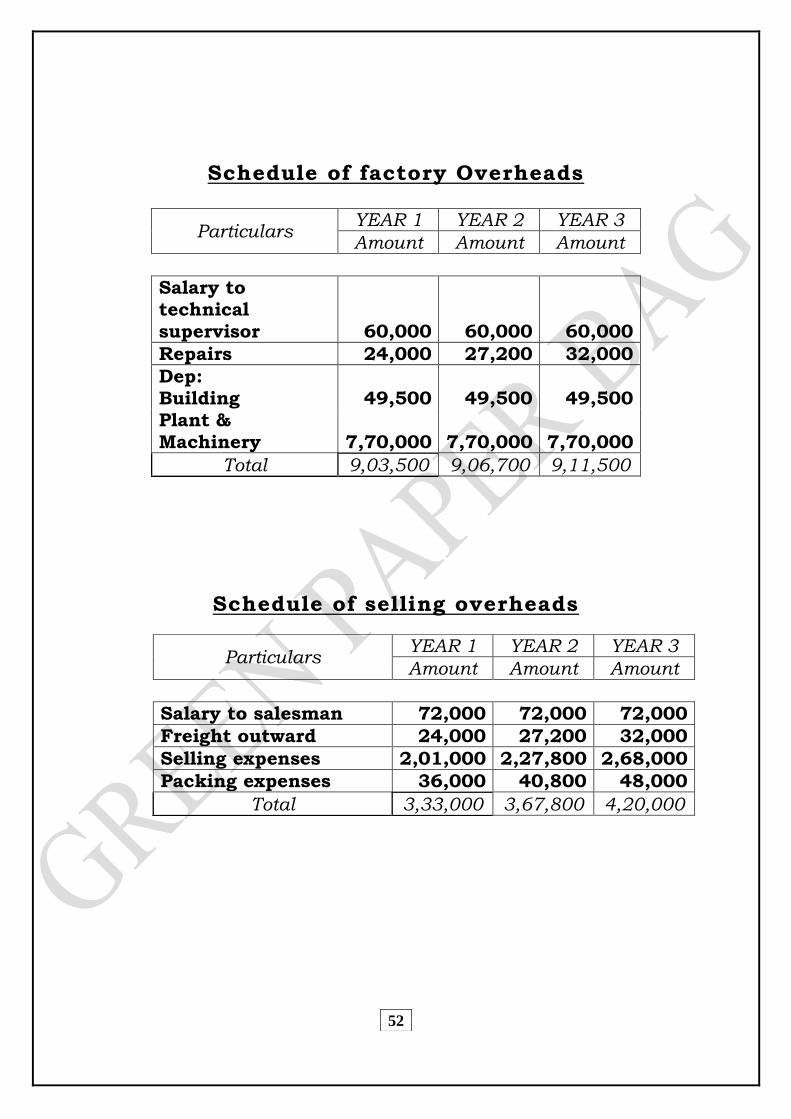
Schedule of factory Overheads
Schedule of selling overheads
Particulars YEAR 1 YEAR 2 YEAR 3
Amount Amount Amount
Salary to technical supervisor 60,000 60,000 60,000
Repairs 24,000 27,200 32,000
Dep: Building 49,500 49,500 49,500 Plant & Machinery 7,70,000 7,70,000 7,70,000
Total 9,03,500 9,06,700 9,11,500
Particulars YEAR 1 YEAR 2 YEAR 3
Amount Amount Amount
Salary to salesman 72,000 72,000 72,000
Freight outward 24,000 27,200 32,000
Selling expenses 2,01,000 2,27,800 2,68,000
Packing expenses 36,000 40,800 48,000
Total 3,33,000 3,67,800 4,20,000

53
RISK FACTORS
As the product is new the main risk is that whether
market will readily accept the product or not. It will
prove success if it properly marketed.
Another risk is that if any new material comes into
market other than paper, then it will be hard to
maintain the market.
54
NAME & ADDRESS OF MACHINERY & EQUIPMENT
SUPPLIERS
1. M/S Industrial paper M/C (P) Ltd.
A-32, phase-1, Naraina Indl. Area,
New Delhi.
2. M/S Sandhu Mechnical Engg. Work,
Industrial Area-A, Plot No. – 32,
Ludhiana.
3. M/S Indo Europe Trading Co.,
1980, Chandni Chowk, Delhi-6.
4. M/S Irupal Industrial (Regd.),
728, Industrial Area-B, Ludhiana.
5. M/S. Kohli Industries, 29,
Sona Udyog Indl. Estate,
Parsi panchyat Road,
Anderi(E), Mumbai-68.
55
NAME & ADDRESS OF RAW MATERIAL SUPPIERS
1. M/S Punalur Paper Mills,
Punalur, Kerala.
2. M/S Star Paper Mills Ltd.
Saharanpur (UP).
3. M/S Rohtas Industries Ltd.
Dalminagar (Bihar).
4. M/S paper & pulp conversion Ltd.
376, Shukrawar peth, Bihar.
56
DISCLODURE OF A/CING POLICIES
Depreciation is calculated on straight line methods.
Salary is given within 1st week of every month.
Raw material is purchased once in two months.
Stock is calculated at cost or market price whichever is
low.
Interest on ownership capital is used for costing
purpose and is reinvested in business again every year.
57
Future Plans
To use totally Eco-friendly papers, which are made out of
baggage and not tree
To make the product popular in every place of Gujarat and
gradually cover all near by states.
To make the firm a medium scale industry and then a
large scale
If possible I would export my product, as they are highly
in demand in foreign countries.
Lets hope for the best and work hard to make all future
plans come true!!!
58
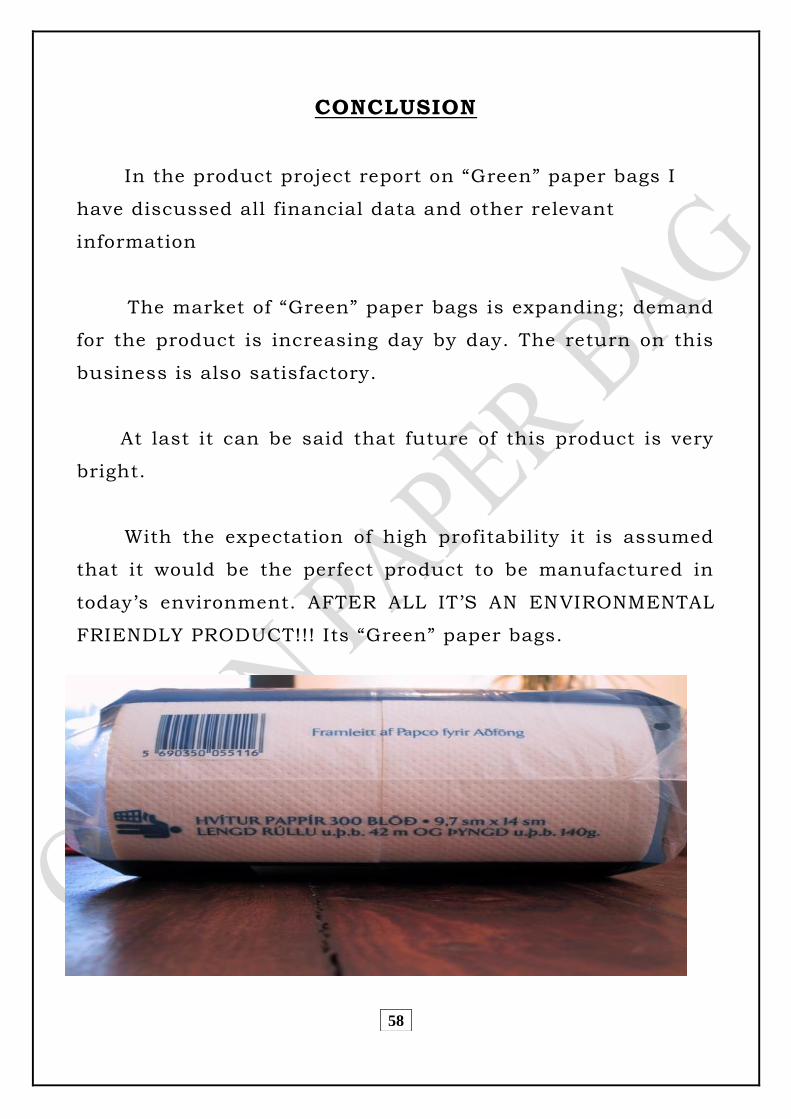
CONCLUSION
In the product project report on “Green” paper bags I
have discussed all financial data and other relevant
information
The market of “Green” paper bags is expanding; demand
for the product is increasing day by day. The return on this
business is also satisfactory.
At last it can be said that future of this product is very
bright.
With the expectation of high profitability it is assumed
that it would be the perfect product to be manufactured in
today’s environment. AFTER ALL IT’S AN ENVIRONMENTAL
FRIENDLY PRODUCT!!! Its “Green” paper bags.
59
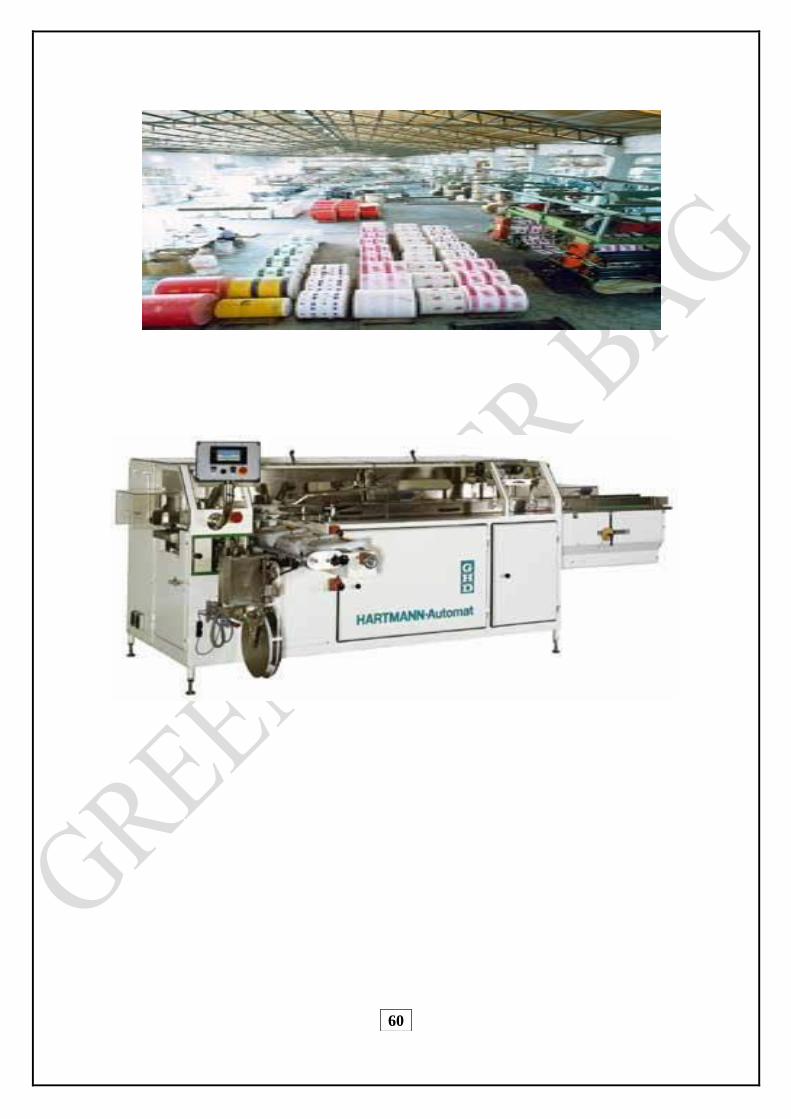
60
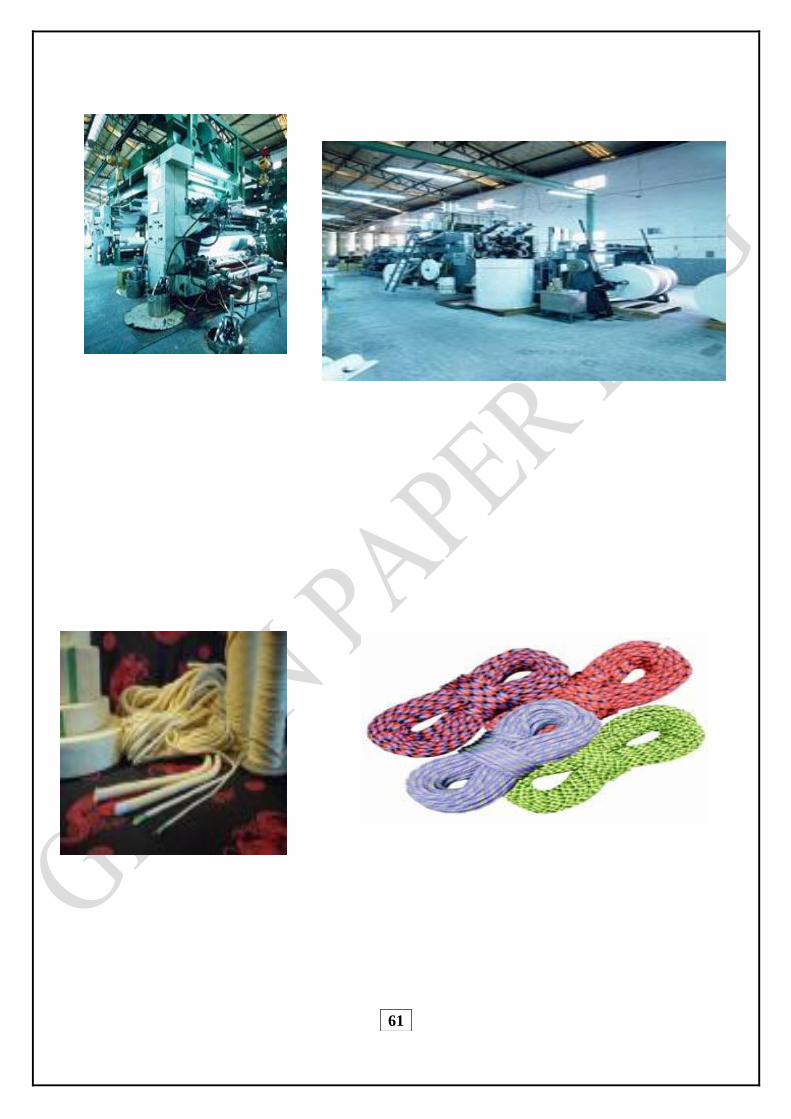
61