Dimethylglyoxime (DMG) staining for semi-quantitative mapping of ...
9
Environmental and Experimental Botany 71 (2011) 232–240 Contents lists available at ScienceDirect Environmental and Experimental Botany journal homepage: www.elsevier.com/locate/envexpbot Dimethylglyoxime (DMG) staining for semi-quantitative mapping of Ni in plant tissue Anja Gramlich a,∗ , Ahmad B. Moradi b , Brett H. Robinson c , Anders Kaestner d , Rainer Schulin a a Institute of Terrestrial Ecosystems, ETH, Universitätstr. 16, CH-8092 Zurich, Switzerland b Helmholtz Centre for Environmental Research - UFZ, Leipzig, Germany c Agriculture and Life Sciences Division, Lincoln University, Canterbury, New Zealand d Paul Scherrer Institut, Villigen, Switzerland article info Article history: Received 23 July 2010 Received in revised form 15 October 2010 Accepted 6 December 2010 Keywords: Ni hyperaccumulator Dimethylglyoxime (DMG) Semi-quantitative Ni staining Berkheya coddii abstract Determination of the nickel (Ni) distribution in tissues of hyperaccumulator plants aids in understanding the strategies and mechanisms used by these plants to take up Ni from soils. Commonly used meth- ods for measuring Ni distribution in plant tissues require expensive equipment and complex sample preparation. We tested a suite of staining methods consisting of dimethylglyoxime (DMG) dissolved in a range of solvents for the mapping of Ni distribution in the Ni hyperaccumulator Berkheya coddii Roessler. The best solution was DMG (10 g l −1 ) dissolved in borax (25 mM) and KOH (30 mM). Plant tissue cross-sections were imaged under a microscope immediately after DMG application. A Karhunen–Loeve transformation was applied to the images to minimize interference from colours of other origin, e.g. from chlorophyll. The distribution of Ni could be determined at the cellular level and consistent patterns were obtained for replicates. Staining of Ni dissolved in agar at various concentrations was used to calibrate the method. Concentrations as low as 50 mg kg −1 (fresh weight) could be detected. Averaged over sev- eral cross-sections the DMG method systematically gave lower concentrations than ICP-OES analysis of the respective plant part, indicating that not all Ni in the tissue reacted with DMG, but only Ni that is readily available. The DMG method may be used in conjunction with spectroscopic methods to resolve biologically active Ni. © 2010 Elsevier B.V. All rights reserved. 1. Introduction Soils derived from ultramafic (serpentine) rocks naturally con- tain high concentrations of nickel (Ni), usually in the range 0.1–3% Ni (Brooks, 1987). Some plants spontaneously occurring on these soils accumulate one or more orders of magnitude more Ni in their shoots than other species growing in the same environment (Brooks et al., 1977). Plants that accumulate >1000 mg of a trace element kg −1 (dry weight), concentrating the element more in the shoot than in the roots, are called hyperaccumulators. There are more than 300 known species of Ni hyperaccumulators, belong- ing to more than 33 families (Brooks, 1998b). As the toxicity of the accumulated Ni must be controlled, hyperaccumulation comes at a metabolic cost for the plant, which would be avoided if the metal would be excluded from being taken up by the roots and translo- cated into the shoots. It is hypothesised that hyperaccumulation confers benefits to the plant, including increased protection against herbivores (Boyd, 1998; Robinson et al., 2003; Sagner et al., 1998). ∗ Corresponding author. Tel.: +41 44 632 84 60. E-mail address: [email protected] (A. Gramlich). Studies on the distribution of Ni and other heavy metals in plant tissues can provide important information on the mechanisms and ecological benefits of hyperaccumulation. For example, protection against phloem-sucking insects will only be effective if Ni is present at sufficiently high concentrations in the phloem. Understanding Ni allocation in various plant parts can also be valuable for the devel- opment of methods using plants to clean up Ni-contaminated soils or for the assessment of risks arising from the use of such soils for crop production (McNear et al., 2005). Soil contamination by Ni can arise from the deposition of dusts generated by mining and smelting activities, shooting, and land application of sewage sludge (Robinson et al., 1997; Brooks, 1998a; Migliorini et al., 2004). Many authors have studied the distribution of metals in hyper- accumulator plants using electron dispersive X-ray analysis (EDXA) (e.g. Robinson et al., 2003; Bidwell et al., 2004; Marmiroli et al., 2004; Berazain et al., 2007). Unfortunately, EDXA is limited to Ni metal concentrations above 1000 mg kg −1 dry weight (McNear et al., 2005). Critical in EDXA analysis is the position of the sample relative to the X-ray beam during analysis. Large errors can occur if the angle between sample and beam is not precisely controlled. Another source of error is interferences of the energy emission lines of the target element with other elements present in the 0098-8472/$ – see front matter © 2010 Elsevier B.V. All rights reserved. doi:10.1016/j.envexpbot.2010.12.008
Transcript of Dimethylglyoxime (DMG) staining for semi-quantitative mapping of ...

Dt
Aa
b
c
d
a
ARRA
KNDSB
1
tNst(esmiamwcch
0d
Environmental and Experimental Botany 71 (2011) 232–240
Contents lists available at ScienceDirect
Environmental and Experimental Botany
journa l homepage: www.e lsev ier .com/ locate /envexpbot
imethylglyoxime (DMG) staining for semi-quantitative mapping of Ni in plantissue
nja Gramlicha,∗, Ahmad B. Moradib, Brett H. Robinsonc, Anders Kaestnerd, Rainer Schulina
Institute of Terrestrial Ecosystems, ETH, Universitätstr. 16, CH-8092 Zurich, SwitzerlandHelmholtz Centre for Environmental Research - UFZ, Leipzig, GermanyAgriculture and Life Sciences Division, Lincoln University, Canterbury, New ZealandPaul Scherrer Institut, Villigen, Switzerland
r t i c l e i n f o
rticle history:eceived 23 July 2010eceived in revised form 15 October 2010ccepted 6 December 2010
eywords:i hyperaccumulatorimethylglyoxime (DMG)emi-quantitative Ni staining
a b s t r a c t
Determination of the nickel (Ni) distribution in tissues of hyperaccumulator plants aids in understandingthe strategies and mechanisms used by these plants to take up Ni from soils. Commonly used meth-ods for measuring Ni distribution in plant tissues require expensive equipment and complex samplepreparation. We tested a suite of staining methods consisting of dimethylglyoxime (DMG) dissolvedin a range of solvents for the mapping of Ni distribution in the Ni hyperaccumulator Berkheya coddiiRoessler. The best solution was DMG (10 g l−1) dissolved in borax (25 mM) and KOH (30 mM). Plant tissuecross-sections were imaged under a microscope immediately after DMG application. A Karhunen–Loevetransformation was applied to the images to minimize interference from colours of other origin, e.g. from
erkheya coddii chlorophyll. The distribution of Ni could be determined at the cellular level and consistent patterns wereobtained for replicates. Staining of Ni dissolved in agar at various concentrations was used to calibratethe method. Concentrations as low as 50 mg kg−1 (fresh weight) could be detected. Averaged over sev-eral cross-sections the DMG method systematically gave lower concentrations than ICP-OES analysis ofthe respective plant part, indicating that not all Ni in the tissue reacted with DMG, but only Ni that isreadily available. The DMG method may be used in conjunction with spectroscopic methods to resolve
biologically active Ni.. Introduction
Soils derived from ultramafic (serpentine) rocks naturally con-ain high concentrations of nickel (Ni), usually in the range 0.1–3%i (Brooks, 1987). Some plants spontaneously occurring on these
oils accumulate one or more orders of magnitude more Ni inheir shoots than other species growing in the same environmentBrooks et al., 1977). Plants that accumulate >1000 mg of a tracelement kg−1 (dry weight), concentrating the element more in thehoot than in the roots, are called hyperaccumulators. There areore than 300 known species of Ni hyperaccumulators, belong-
ng to more than 33 families (Brooks, 1998b). As the toxicity of theccumulated Ni must be controlled, hyperaccumulation comes at aetabolic cost for the plant, which would be avoided if the metal
ould be excluded from being taken up by the roots and translo-ated into the shoots. It is hypothesised that hyperaccumulationonfers benefits to the plant, including increased protection againsterbivores (Boyd, 1998; Robinson et al., 2003; Sagner et al., 1998).
∗ Corresponding author. Tel.: +41 44 632 84 60.E-mail address: [email protected] (A. Gramlich).
098-8472/$ – see front matter © 2010 Elsevier B.V. All rights reserved.oi:10.1016/j.envexpbot.2010.12.008
© 2010 Elsevier B.V. All rights reserved.
Studies on the distribution of Ni and other heavy metals in planttissues can provide important information on the mechanisms andecological benefits of hyperaccumulation. For example, protectionagainst phloem-sucking insects will only be effective if Ni is presentat sufficiently high concentrations in the phloem. Understanding Niallocation in various plant parts can also be valuable for the devel-opment of methods using plants to clean up Ni-contaminated soilsor for the assessment of risks arising from the use of such soilsfor crop production (McNear et al., 2005). Soil contamination byNi can arise from the deposition of dusts generated by mining andsmelting activities, shooting, and land application of sewage sludge(Robinson et al., 1997; Brooks, 1998a; Migliorini et al., 2004).
Many authors have studied the distribution of metals in hyper-accumulator plants using electron dispersive X-ray analysis (EDXA)(e.g. Robinson et al., 2003; Bidwell et al., 2004; Marmiroli et al.,2004; Berazain et al., 2007). Unfortunately, EDXA is limited toNi metal concentrations above 1000 mg kg−1 dry weight (McNear
et al., 2005). Critical in EDXA analysis is the position of the samplerelative to the X-ray beam during analysis. Large errors can occur ifthe angle between sample and beam is not precisely controlled.Another source of error is interferences of the energy emissionlines of the target element with other elements present in the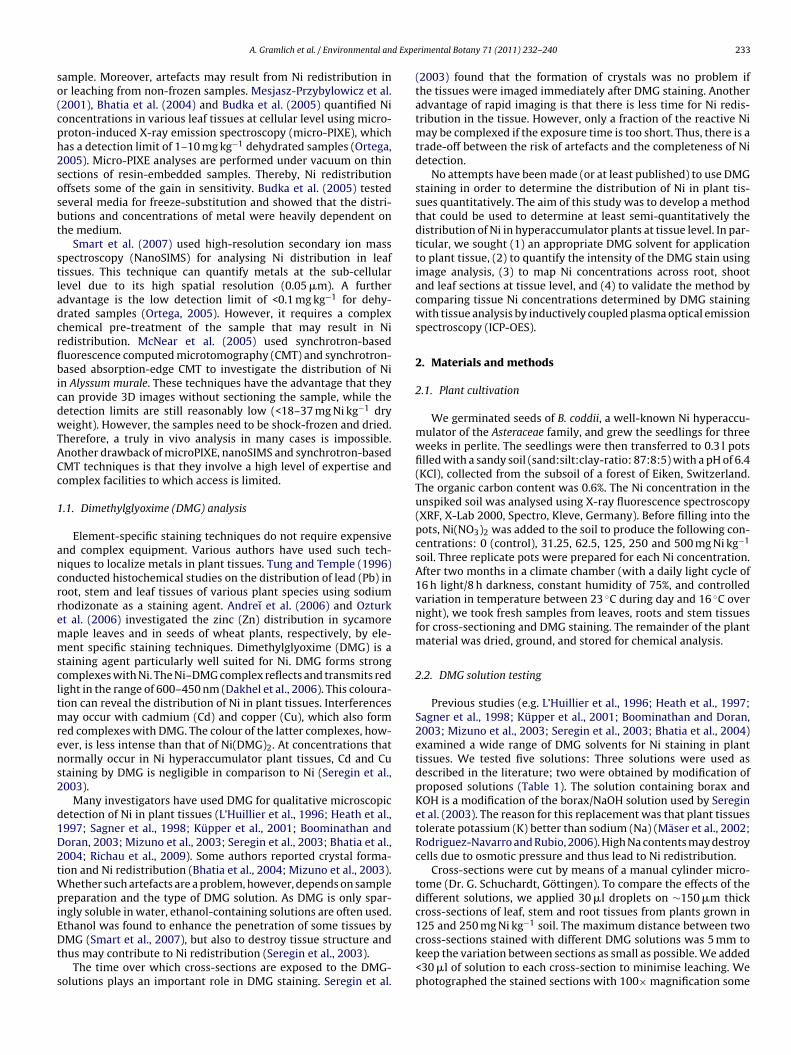
d Expe
so(cph2sosbt
stladcrflbicdwTACc
1
ancrremmscltmrens2
d1D2tWpiEDt
s
A. Gramlich et al. / Environmental an
ample. Moreover, artefacts may result from Ni redistribution inr leaching from non-frozen samples. Mesjasz-Przybylowicz et al.2001), Bhatia et al. (2004) and Budka et al. (2005) quantified Nioncentrations in various leaf tissues at cellular level using micro-roton-induced X-ray emission spectroscopy (micro-PIXE), whichas a detection limit of 1–10 mg kg−1 dehydrated samples (Ortega,005). Micro-PIXE analyses are performed under vacuum on thinections of resin-embedded samples. Thereby, Ni redistributionffsets some of the gain in sensitivity. Budka et al. (2005) testedeveral media for freeze-substitution and showed that the distri-utions and concentrations of metal were heavily dependent onhe medium.
Smart et al. (2007) used high-resolution secondary ion masspectroscopy (NanoSIMS) for analysing Ni distribution in leafissues. This technique can quantify metals at the sub-cellularevel due to its high spatial resolution (0.05 �m). A furtherdvantage is the low detection limit of <0.1 mg kg−1 for dehy-rated samples (Ortega, 2005). However, it requires a complexhemical pre-treatment of the sample that may result in Niedistribution. McNear et al. (2005) used synchrotron-baseduorescence computed microtomography (CMT) and synchrotron-ased absorption-edge CMT to investigate the distribution of Ni
n Alyssum murale. These techniques have the advantage that theyan provide 3D images without sectioning the sample, while theetection limits are still reasonably low (<18–37 mg Ni kg−1 dryeight). However, the samples need to be shock-frozen and dried.
herefore, a truly in vivo analysis in many cases is impossible.nother drawback of microPIXE, nanoSIMS and synchrotron-basedMT techniques is that they involve a high level of expertise andomplex facilities to which access is limited.
.1. Dimethylglyoxime (DMG) analysis
Element-specific staining techniques do not require expensivend complex equipment. Various authors have used such tech-iques to localize metals in plant tissues. Tung and Temple (1996)onducted histochemical studies on the distribution of lead (Pb) inoot, stem and leaf tissues of various plant species using sodiumhodizonate as a staining agent. Andreı̌ et al. (2006) and Ozturkt al. (2006) investigated the zinc (Zn) distribution in sycamoreaple leaves and in seeds of wheat plants, respectively, by ele-ent specific staining techniques. Dimethylglyoxime (DMG) is a
taining agent particularly well suited for Ni. DMG forms strongomplexes with Ni. The Ni–DMG complex reflects and transmits redight in the range of 600–450 nm (Dakhel et al., 2006). This coloura-ion can reveal the distribution of Ni in plant tissues. Interferences
ay occur with cadmium (Cd) and copper (Cu), which also formed complexes with DMG. The colour of the latter complexes, how-ver, is less intense than that of Ni(DMG)2. At concentrations thatormally occur in Ni hyperaccumulator plant tissues, Cd and Cutaining by DMG is negligible in comparison to Ni (Seregin et al.,003).
Many investigators have used DMG for qualitative microscopicetection of Ni in plant tissues (L’Huillier et al., 1996; Heath et al.,997; Sagner et al., 1998; Küpper et al., 2001; Boominathan andoran, 2003; Mizuno et al., 2003; Seregin et al., 2003; Bhatia et al.,004; Richau et al., 2009). Some authors reported crystal forma-ion and Ni redistribution (Bhatia et al., 2004; Mizuno et al., 2003).
hether such artefacts are a problem, however, depends on samplereparation and the type of DMG solution. As DMG is only spar-
ngly soluble in water, ethanol-containing solutions are often used.
thanol was found to enhance the penetration of some tissues byMG (Smart et al., 2007), but also to destroy tissue structure andhus may contribute to Ni redistribution (Seregin et al., 2003).The time over which cross-sections are exposed to the DMG-
olutions plays an important role in DMG staining. Seregin et al.
rimental Botany 71 (2011) 232–240 233
(2003) found that the formation of crystals was no problem ifthe tissues were imaged immediately after DMG staining. Anotheradvantage of rapid imaging is that there is less time for Ni redis-tribution in the tissue. However, only a fraction of the reactive Nimay be complexed if the exposure time is too short. Thus, there is atrade-off between the risk of artefacts and the completeness of Nidetection.
No attempts have been made (or at least published) to use DMGstaining in order to determine the distribution of Ni in plant tis-sues quantitatively. The aim of this study was to develop a methodthat could be used to determine at least semi-quantitatively thedistribution of Ni in hyperaccumulator plants at tissue level. In par-ticular, we sought (1) an appropriate DMG solvent for applicationto plant tissue, (2) to quantify the intensity of the DMG stain usingimage analysis, (3) to map Ni concentrations across root, shootand leaf sections at tissue level, and (4) to validate the method bycomparing tissue Ni concentrations determined by DMG stainingwith tissue analysis by inductively coupled plasma optical emissionspectroscopy (ICP-OES).
2. Materials and methods
2.1. Plant cultivation
We germinated seeds of B. coddii, a well-known Ni hyperaccu-mulator of the Asteraceae family, and grew the seedlings for threeweeks in perlite. The seedlings were then transferred to 0.3 l potsfilled with a sandy soil (sand:silt:clay-ratio: 87:8:5) with a pH of 6.4(KCl), collected from the subsoil of a forest of Eiken, Switzerland.The organic carbon content was 0.6%. The Ni concentration in theunspiked soil was analysed using X-ray fluorescence spectroscopy(XRF, X-Lab 2000, Spectro, Kleve, Germany). Before filling into thepots, Ni(NO3)2 was added to the soil to produce the following con-centrations: 0 (control), 31.25, 62.5, 125, 250 and 500 mg Ni kg−1
soil. Three replicate pots were prepared for each Ni concentration.After two months in a climate chamber (with a daily light cycle of16 h light/8 h darkness, constant humidity of 75%, and controlledvariation in temperature between 23 ◦C during day and 16 ◦C overnight), we took fresh samples from leaves, roots and stem tissuesfor cross-sectioning and DMG staining. The remainder of the plantmaterial was dried, ground, and stored for chemical analysis.
2.2. DMG solution testing
Previous studies (e.g. L’Huillier et al., 1996; Heath et al., 1997;Sagner et al., 1998; Küpper et al., 2001; Boominathan and Doran,2003; Mizuno et al., 2003; Seregin et al., 2003; Bhatia et al., 2004)examined a wide range of DMG solvents for Ni staining in planttissues. We tested five solutions: Three solutions were used asdescribed in the literature; two were obtained by modification ofproposed solutions (Table 1). The solution containing borax andKOH is a modification of the borax/NaOH solution used by Sereginet al. (2003). The reason for this replacement was that plant tissuestolerate potassium (K) better than sodium (Na) (Mäser et al., 2002;Rodriguez-Navarro and Rubio, 2006). High Na contents may destroycells due to osmotic pressure and thus lead to Ni redistribution.
Cross-sections were cut by means of a manual cylinder micro-tome (Dr. G. Schuchardt, Göttingen). To compare the effects of thedifferent solutions, we applied 30 �l droplets on ∼150 �m thickcross-sections of leaf, stem and root tissues from plants grown in
125 and 250 mg Ni kg−1 soil. The maximum distance between twocross-sections stained with different DMG solutions was 5 mm tokeep the variation between sections as small as possible. We added<30 �l of solution to each cross-section to minimise leaching. Wephotographed the stained sections with 100× magnification some
234 A. Gramlich et al. / Environmental and Experimental Botany 71 (2011) 232–240
Table 1DMG solvents tested.
Solvent Proposed by Composition of DMG-solution Tested plants andplant parts
pH Optical detectionlimit of Ni
DMG solubility
KOH Boominathan and Doran(2003)
1.16 g DMG dissolved in 100 ml0.1 M KOH solution
Alyssum bertolonii(roots)
12 2 mg l−1 Low
Ethanol Küpper et al. (2001) 1% DMG (w/v) dissolved in ethanol Alyssum lesbiacum(leaves)
8.4 2 mg l−1 Soluble after 2h ofshaking
Ethanol/amm. ac. Mizuno et al. (2003) 1 g DMG added to 100 ml ethanoland mixed with 1 M ammoniumacetate solution (1:5)
Thlaspi japonicum(leaves)
6.9 4 mg l−1 Well
Borax/NaOH After Seregin et al. (2003) 1 g DMG and 1.5 g NaOH dissolvedin 100 ml of 0.05 M
Zea mays L. (roots) 13 2 mg l−1 Well
solved
3l(aatsttT(e
2
wsgToltosre
2
2
iapcrrnBpspvet
C
Na2B4O7·10H2O solutionBorax/KOH After Boominathan and
Doran (2003) and Sereginet al. (2003)
1 g DMG and 0.18 g KOH disin 100 ml of 0.025 MNa2B4O7·10H2O solution
0 s after the application of the solution to the sections, using aight microscope (Zeiss, Switzerland) fitted with a digital cameraCanon Power Shot A640). The time between sample preparationnd photography was kept as short as possible to avoid dehydrationnd formation of Ni–DMG crystals. For each solution, we measuredhe pH and quantitatively determined the solubility of DMG in theolvents after 2 h of shaking. The optical detection limits of Ni forhe five solvents were compared by adding a droplet of each solu-ion and a droplet of a Ni-standard solution on a white filter paper.his procedure was repeated with increasingly diluted Ni-solutions12–1 mg l−1) until there was no red colouration visible (Seregint al., 2003).
.3. Sampling and preparation of the specimens
As described in Section 3.1, the borax/KOH solution (Table 1)as found to be the most suitable DMG solvent. This solvent was
ubsequently used for all further tests. For these tests, B. coddii wererown, sampled and prepared for DMG staining as described above.hree leaves were sampled from each plant (the first fully devel-ped leaf on top, fourth leaf from top and bottom leaf): From eacheaf, three cross-sections were taken (tip, middle, and one close tohe base). Roots were washed with deionised water and one rootf average thickness was chosen for cross-sectioning. One cross-ection was taken close to the shoot and one in the middle of theoots. In addition, two cross-sections were taken from the stem ofach plant (top and middle).
.4. Image analysis
.4.1. Karhunen–Loeve transformationThe colour images obtained by the digital camera were recorded
n the RGB colour space, i.e. in the three colour channels red, green,nd blue. To separate DMG from non-DMG signals, e.g. from chloro-hyll, we inspected collocation histograms for the three colourhannel combinations red–green, red–blue, and green–blue. Theed–green combination showed distinct clusters, and thereforeepresented the best choice for separation of DMG from other sig-als. We used the Karhunen–Loeve transformation (Jain, 1989;asso et al., 2010) to separate the colours representing chloro-hyll and DMG as much as possible. Using this transformation, twotochastic signals become statistically independent. They are nowrojectable into orthonormal components, where the independent
ectors are red and green. This was achieved by computing theigenvector matrix S of the covariance matrix C = cov(Ired, Igreen) forhe two colour channels, given by= SËST (1)
10 2 mg l−1 Low
Ë is the diagonal matrix of the eigenvalues and Ired and Igreen arethe row vectors of the intensities in the colour channels for red andgreen. The covariance matrix being symmetric and its eingevectorsorthogonal, the eigenvector matrix S was used to transform the twochannels into the matrix
K = S
(Ired
Igreen
)(2)
The rows of K contained the independent basis images, whichrepresent the primary signals for chlorophyll and Ni–DMG and pro-jected into an orthonormal real space of orthogonal vectors. Thebasis image in K corresponding to the larger of the two eigenval-ues contained the Ni concentration information. As a final step, thebasis image was reshaped into its original dimension. For all steps ofthe image processing the program Matlab (MathWorks) was used.
2.4.2. Determination of averaged tissue DMG staining intensitiesBefore we analysed the intensities of the tissue staining in the
processed images, we subtracted the mean background intensityfrom each single image by measuring the intensity of a rect-angular area next to the sample and subtracting it from thetotal image intensity. Then, we selected 3–5 rectangular areasin each particular tissue and determined the median stainingintensities in the areas. The averages of the 3–5 replicate areaswere taken as the mean staining intensity in the respectivetissues.
2.4.3. CalibrationTo convert colour intensities into concentrations (mg Ni kg−1
fresh weight), we prepared agar standards as a substitute for planttissues. Nickel nitrate was added at concentrations of 0, 25, 50, 100,200, 400, 800, 1600, 3200 mg Ni l−1 to a solution of 30 g agar l−1.Such a high agar concentration compared to standard applicationsfor in vitro cultures was needed for the stability of the slides andbecause of Ni–DMG leaching at lower concentrations. After auto-claving, the Ni-spiked agar solutions were filled into Petri dishes.The final Ni concentrations of the standards were determined bymeans of ICP-OES.
The agar standards were sectioned and stained in the sameway as the plant samples: Cross-sections of ∼150 �m were cut,DMG-solution was added, and the samples were imaged using lightmicroscopy. We analysed five replicates of each concentration stan-dard.
After image processing, we fitted a power function to the exper-
imental data in order to describe the relationship between stainingintensity and Ni concentration (Eq. (3)). This function was then usedto calculate the Ni concentrations of the stained plant tissues of B.coddii. The detection limit of the method was set to the lowest Niconcentration in agar that resulted in a staining of the agar that was
A. Gramlich et al. / Environmental and Experimental Botany 71 (2011) 232–240 235
F s) of Ba hite sfi
ss
2
2
m(tnpawiFspNs
2
tt(sFwq
oatrr
ig. 1. Distribution of Ni, indicated by the red colouration, in roots (r) and stems (rrows show small Ni(DMG)2-cristals in the apoplast (r) and in the symplast (s). Wgure legend, the reader is referred to the web version of the article.)
ignificantly different from the blank agar samples (Wilcoxon rankum test).
.5. Validation
.5.1. ICP-OES measurementTo test the calibration with the agar standards, we also deter-
ined the Ni concentrations of plant tissues by means of ICP-OESVista-MPX, Varian). To obtain sufficient material for ICP analysis,he leaf sampled for staining was analysed together with its nearesteighbour leaf. For stem samples, the stem was divided into fourarts that were analysed separately. The entire root system wasnalysed because of the small mass of the root samples. The samplesere dried for 24 h at 40 ◦C and then digested for 40 min at 150 ◦C
n 15 ml HNO3 using a digestion block (DigiPREP MS, SCP-Science).resh agar samples were digested in the same way as the plantamples. As we could not find plant reference material with com-arable Ni concentrations, we used standard addition with a finali concentration of 1 mg l−1 in the analysed solution (Ni standard
olution, MERCK) for quality control.
.5.2. Comparison of DMG-staining with ICP-OES analysisTo compare the concentrations determined by ICP-OES with
hose obtained by DMG-staining, the ICP-measured concentra-ions were expressed as fresh-weight related concentrationsmg Ni kg−1). Ratios of dry weight/fresh weight were determinedeparately for leaf, stem and root samples in four replicates each.resh weight concentrations were calculated by multiplying the dryeight concentrations with the respective dry weight/fresh weight
uotient.The Ni concentrations obtained by DMG staining related to part
f a cross-section only, as it was not possible in general to accuratelynalyse the entire cross-sectional area for staining intensity. Thus,he values determined by ICP-OES and DMG staining do not exactlyelate to the same areas of the cross-sections. For the leaves, weestricted the comparison for this reason to the mid ribs. For roots,
erkheya coddii plants that were grown in soils containing 500 mg Ni kg−1 soil. Redcale bars represent ∼250 �m. (For interpretation of the references to colour in this
we assumed that the average Ni concentrations of the selectedcross-sections gave a sufficient approximation for the Ni concen-trations determined by the ICP-OES measurements.
2.6. Statistical analysis of the data
For pairwise comparisons of the agar standards, the Wilcoxonrank sum test was used. To analyse the differences in concentra-tion between different plant parts (leaves, stems and roots) andbetween the different plant tissues, we used one-way ANOVA, fol-lowed by pairwise t-test (p-value adjustment method: holm). Thesignificance level was set at p ≤ 0.05. All statistical tests were per-formed using the software package “R”, version 2.1 (R DevelopmentCore Team, 2008).
3. Results
3.1. Solvent choice
The overall distribution patterns of Ni in the tissues of B. coddii,obtained with the five DMG-solutions (Table 1) were similar. How-ever, the image quality differed considerably between solvents.The solution that contained only ethanol evaporated rapidly, andimaging became impossible after 5 min. Moreover, long Ni–DMGcrystals formed. The ammonium acetate/ethanol mixture produceda weaker colour than the other solutions, probably because of thelower solution pH. We found no differences between the KOH, theborax/NaOH and the borax/KOH solutions. With all three solutions,we observed development of small crystals 5–10 min after adding
the solvents. We chose the borax/KOH solution for all subsequentDMG staining, because (a) the staining produced images of highquality under the light microscope, (b) the pH was optimal for Nicomplexation, and (c) plant tissues are generally more tolerant toK than to Na.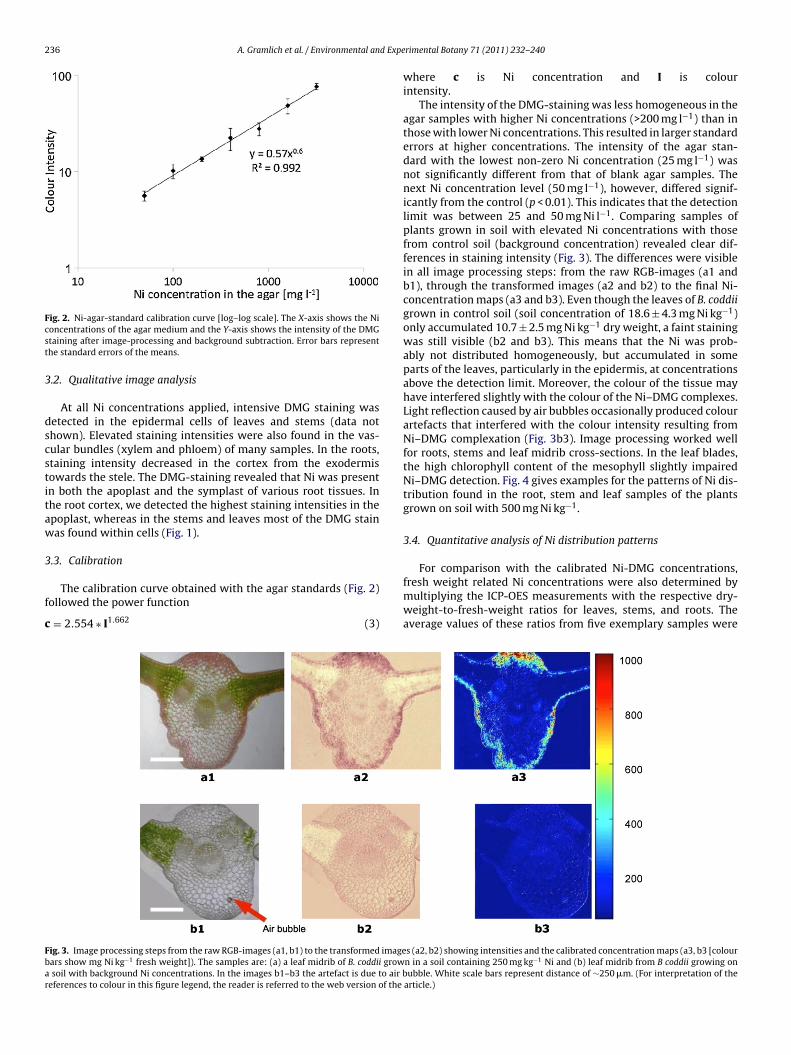
236 A. Gramlich et al. / Environmental and Expe
Fcst
3
dscstitaw
3
f
c
Fbar
ig. 2. Ni-agar-standard calibration curve [log–log scale]. The X-axis shows the Nioncentrations of the agar medium and the Y-axis shows the intensity of the DMGtaining after image-processing and background subtraction. Error bars representhe standard errors of the means.
.2. Qualitative image analysis
At all Ni concentrations applied, intensive DMG staining wasetected in the epidermal cells of leaves and stems (data nothown). Elevated staining intensities were also found in the vas-ular bundles (xylem and phloem) of many samples. In the roots,taining intensity decreased in the cortex from the exodermisowards the stele. The DMG-staining revealed that Ni was presentn both the apoplast and the symplast of various root tissues. Inhe root cortex, we detected the highest staining intensities in thepoplast, whereas in the stems and leaves most of the DMG stainas found within cells (Fig. 1).
.3. Calibration
The calibration curve obtained with the agar standards (Fig. 2)ollowed the power function
= 2.554 ∗ I1.662 (3)
ig. 3. Image processing steps from the raw RGB-images (a1, b1) to the transformed imagears show mg Ni kg−1 fresh weight]). The samples are: (a) a leaf midrib of B. coddii growsoil with background Ni concentrations. In the images b1–b3 the artefact is due to air b
eferences to colour in this figure legend, the reader is referred to the web version of the
rimental Botany 71 (2011) 232–240
where c is Ni concentration and I is colourintensity.
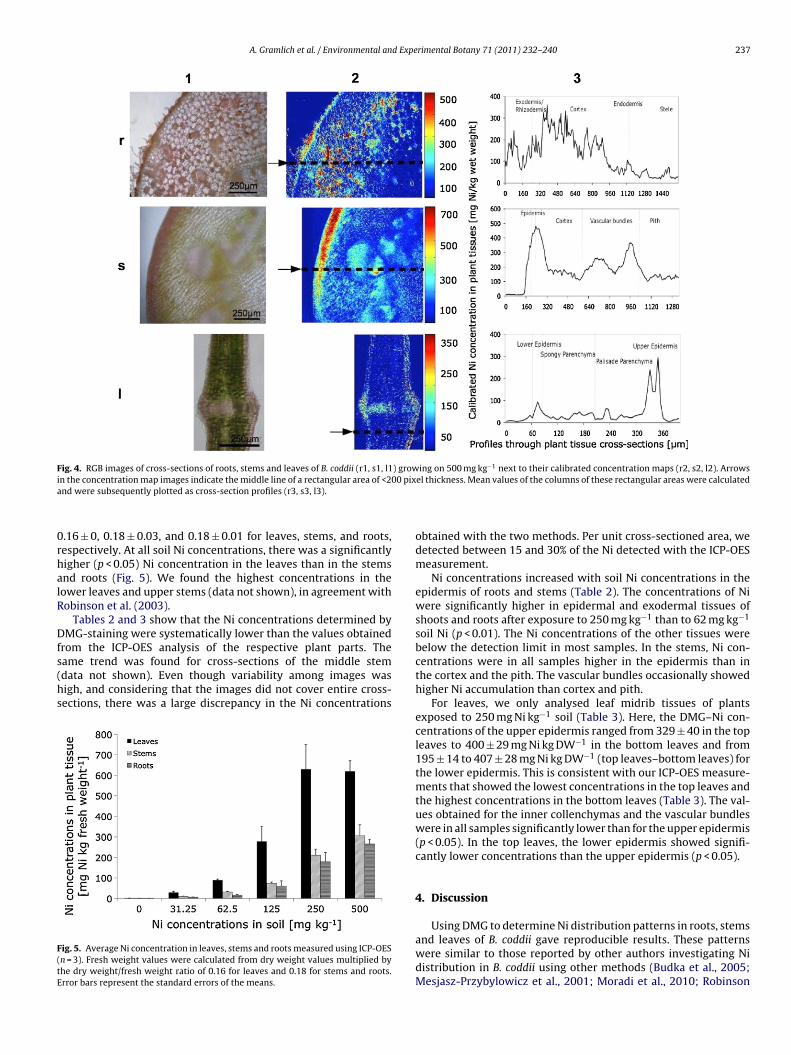
The intensity of the DMG-staining was less homogeneous in theagar samples with higher Ni concentrations (>200 mg l−1) than inthose with lower Ni concentrations. This resulted in larger standarderrors at higher concentrations. The intensity of the agar stan-dard with the lowest non-zero Ni concentration (25 mg l−1) wasnot significantly different from that of blank agar samples. Thenext Ni concentration level (50 mg l−1), however, differed signif-icantly from the control (p < 0.01). This indicates that the detectionlimit was between 25 and 50 mg Ni l−1. Comparing samples ofplants grown in soil with elevated Ni concentrations with thosefrom control soil (background concentration) revealed clear dif-ferences in staining intensity (Fig. 3). The differences were visiblein all image processing steps: from the raw RGB-images (a1 andb1), through the transformed images (a2 and b2) to the final Ni-concentration maps (a3 and b3). Even though the leaves of B. coddiigrown in control soil (soil concentration of 18.6 ± 4.3 mg Ni kg−1)only accumulated 10.7 ± 2.5 mg Ni kg−1 dry weight, a faint stainingwas still visible (b2 and b3). This means that the Ni was prob-ably not distributed homogeneously, but accumulated in someparts of the leaves, particularly in the epidermis, at concentrationsabove the detection limit. Moreover, the colour of the tissue mayhave interfered slightly with the colour of the Ni–DMG complexes.Light reflection caused by air bubbles occasionally produced colourartefacts that interfered with the colour intensity resulting fromNi–DMG complexation (Fig. 3b3). Image processing worked wellfor roots, stems and leaf midrib cross-sections. In the leaf blades,the high chlorophyll content of the mesophyll slightly impairedNi–DMG detection. Fig. 4 gives examples for the patterns of Ni dis-tribution found in the root, stem and leaf samples of the plantsgrown on soil with 500 mg Ni kg−1.
3.4. Quantitative analysis of Ni distribution patterns
For comparison with the calibrated Ni-DMG concentrations,fresh weight related Ni concentrations were also determined bymultiplying the ICP-OES measurements with the respective dry-weight-to-fresh-weight ratios for leaves, stems, and roots. Theaverage values of these ratios from five exemplary samples were
s (a2, b2) showing intensities and the calibrated concentration maps (a3, b3 [colourn in a soil containing 250 mg kg−1 Ni and (b) leaf midrib from B coddii growing onubble. White scale bars represent distance of ∼250 �m. (For interpretation of the
article.)
A. Gramlich et al. / Environmental and Experimental Botany 71 (2011) 232–240 237
F ) grow −1
i 00 pixa
0rhalR
Dfs(hs
F(tE
ig. 4. RGB images of cross-sections of roots, stems and leaves of B. coddii (r1, s1, l1n the concentration map images indicate the middle line of a rectangular area of <2nd were subsequently plotted as cross-section profiles (r3, s3, l3).
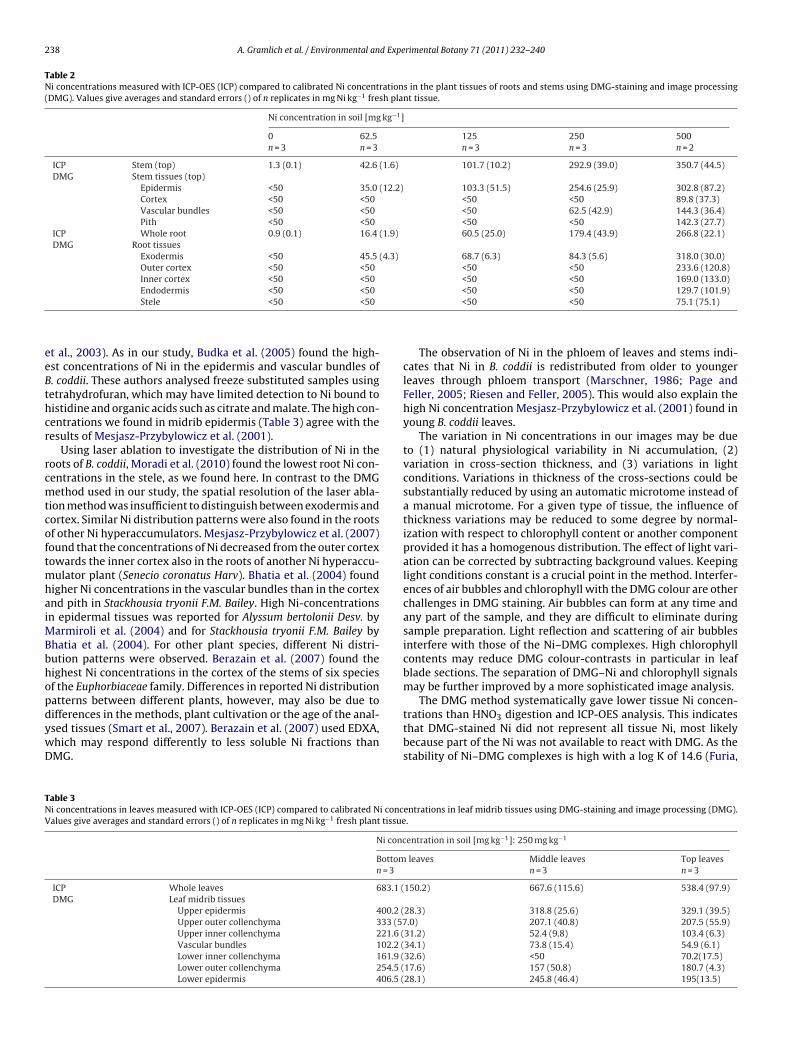
.16 ± 0, 0.18 ± 0.03, and 0.18 ± 0.01 for leaves, stems, and roots,espectively. At all soil Ni concentrations, there was a significantlyigher (p < 0.05) Ni concentration in the leaves than in the stemsnd roots (Fig. 5). We found the highest concentrations in theower leaves and upper stems (data not shown), in agreement withobinson et al. (2003).
Tables 2 and 3 show that the Ni concentrations determined byMG-staining were systematically lower than the values obtained
rom the ICP-OES analysis of the respective plant parts. Theame trend was found for cross-sections of the middle stemdata not shown). Even though variability among images wasigh, and considering that the images did not cover entire cross-ections, there was a large discrepancy in the Ni concentrations
ig. 5. Average Ni concentration in leaves, stems and roots measured using ICP-OESn = 3). Fresh weight values were calculated from dry weight values multiplied byhe dry weight/fresh weight ratio of 0.16 for leaves and 0.18 for stems and roots.rror bars represent the standard errors of the means.
ing on 500 mg kg next to their calibrated concentration maps (r2, s2, l2). Arrowsel thickness. Mean values of the columns of these rectangular areas were calculated
obtained with the two methods. Per unit cross-sectioned area, wedetected between 15 and 30% of the Ni detected with the ICP-OESmeasurement.
Ni concentrations increased with soil Ni concentrations in theepidermis of roots and stems (Table 2). The concentrations of Niwere significantly higher in epidermal and exodermal tissues ofshoots and roots after exposure to 250 mg kg−1 than to 62 mg kg−1
soil Ni (p < 0.01). The Ni concentrations of the other tissues werebelow the detection limit in most samples. In the stems, Ni con-centrations were in all samples higher in the epidermis than inthe cortex and the pith. The vascular bundles occasionally showedhigher Ni accumulation than cortex and pith.
For leaves, we only analysed leaf midrib tissues of plantsexposed to 250 mg Ni kg−1 soil (Table 3). Here, the DMG–Ni con-centrations of the upper epidermis ranged from 329 ± 40 in the topleaves to 400 ± 29 mg Ni kg DW−1 in the bottom leaves and from195 ± 14 to 407 ± 28 mg Ni kg DW−1 (top leaves–bottom leaves) forthe lower epidermis. This is consistent with our ICP-OES measure-ments that showed the lowest concentrations in the top leaves andthe highest concentrations in the bottom leaves (Table 3). The val-ues obtained for the inner collenchymas and the vascular bundleswere in all samples significantly lower than for the upper epidermis(p < 0.05). In the top leaves, the lower epidermis showed signifi-cantly lower concentrations than the upper epidermis (p < 0.05).
4. Discussion
Using DMG to determine Ni distribution patterns in roots, stemsand leaves of B. coddii gave reproducible results. These patternswere similar to those reported by other authors investigating Nidistribution in B. coddii using other methods (Budka et al., 2005;Mesjasz-Przybylowicz et al., 2001; Moradi et al., 2010; Robinson
238 A. Gramlich et al. / Environmental and Experimental Botany 71 (2011) 232–240
Table 2Ni concentrations measured with ICP-OES (ICP) compared to calibrated Ni concentrations in the plant tissues of roots and stems using DMG-staining and image processing(DMG). Values give averages and standard errors () of n replicates in mg Ni kg−1 fresh plant tissue.
Ni concentration in soil [mg kg−1]
0 62.5 125 250 500n = 3 n = 3 n = 3 n = 3 n = 2
ICP Stem (top) 1.3 (0.1) 42.6 (1.6) 101.7 (10.2) 292.9 (39.0) 350.7 (44.5)DMG Stem tissues (top)
Epidermis <50 35.0 (12.2) 103.3 (51.5) 254.6 (25.9) 302.8 (87.2)Cortex <50 <50 <50 <50 89.8 (37.3)Vascular bundles <50 <50 <50 62.5 (42.9) 144.3 (36.4)Pith <50 <50 <50 <50 142.3 (27.7)
ICP Whole root 0.9 (0.1) 16.4 (1.9) 60.5 (25.0) 179.4 (43.9) 266.8 (22.1)DMG Root tissues
Exodermis <50 45.5 (4.3) 68.7 (6.3) 84.3 (5.6) 318.0 (30.0)Outer cortex <50 <50 <50 <50 233.6 (120.8)Inner cortex <50 <50 <50 <50 169.0 (133.0)
eeBthcr
rcmtcoftmhaiMBbhopdywD
TNV
Endodermis <50 <50Stele <50 <50
t al., 2003). As in our study, Budka et al. (2005) found the high-st concentrations of Ni in the epidermis and vascular bundles of. coddii. These authors analysed freeze substituted samples usingetrahydrofuran, which may have limited detection to Ni bound toistidine and organic acids such as citrate and malate. The high con-entrations we found in midrib epidermis (Table 3) agree with theesults of Mesjasz-Przybylowicz et al. (2001).
Using laser ablation to investigate the distribution of Ni in theoots of B. coddii, Moradi et al. (2010) found the lowest root Ni con-entrations in the stele, as we found here. In contrast to the DMGethod used in our study, the spatial resolution of the laser abla-
ion method was insufficient to distinguish between exodermis andortex. Similar Ni distribution patterns were also found in the rootsf other Ni hyperaccumulators. Mesjasz-Przybylowicz et al. (2007)ound that the concentrations of Ni decreased from the outer cortexowards the inner cortex also in the roots of another Ni hyperaccu-
ulator plant (Senecio coronatus Harv). Bhatia et al. (2004) foundigher Ni concentrations in the vascular bundles than in the cortexnd pith in Stackhousia tryonii F.M. Bailey. High Ni-concentrationsn epidermal tissues was reported for Alyssum bertolonii Desv. by
armiroli et al. (2004) and for Stackhousia tryonii F.M. Bailey byhatia et al. (2004). For other plant species, different Ni distri-ution patterns were observed. Berazain et al. (2007) found theighest Ni concentrations in the cortex of the stems of six speciesf the Euphorbiaceae family. Differences in reported Ni distributionatterns between different plants, however, may also be due to
ifferences in the methods, plant cultivation or the age of the anal-sed tissues (Smart et al., 2007). Berazain et al. (2007) used EDXA,hich may respond differently to less soluble Ni fractions thanMG.able 3i concentrations in leaves measured with ICP-OES (ICP) compared to calibrated Ni concalues give averages and standard errors () of n replicates in mg Ni kg−1 fresh plant tissue
Ni conc
Bottomn = 3
ICP Whole leaves 683.1 (DMG Leaf midrib tissues
Upper epidermis 400.2 (Upper outer collenchyma 333 (57Upper inner collenchyma 221.6 (Vascular bundles 102.2 (Lower inner collenchyma 161.9 (Lower outer collenchyma 254.5 (Lower epidermis 406.5 (
<50 <50 129.7 (101.9)<50 <50 75.1 (75.1)
The observation of Ni in the phloem of leaves and stems indi-cates that Ni in B. coddii is redistributed from older to youngerleaves through phloem transport (Marschner, 1986; Page andFeller, 2005; Riesen and Feller, 2005). This would also explain thehigh Ni concentration Mesjasz-Przybylowicz et al. (2001) found inyoung B. coddii leaves.
The variation in Ni concentrations in our images may be dueto (1) natural physiological variability in Ni accumulation, (2)variation in cross-section thickness, and (3) variations in lightconditions. Variations in thickness of the cross-sections could besubstantially reduced by using an automatic microtome instead ofa manual microtome. For a given type of tissue, the influence ofthickness variations may be reduced to some degree by normal-ization with respect to chlorophyll content or another componentprovided it has a homogenous distribution. The effect of light vari-ation can be corrected by subtracting background values. Keepinglight conditions constant is a crucial point in the method. Interfer-ences of air bubbles and chlorophyll with the DMG colour are otherchallenges in DMG staining. Air bubbles can form at any time andany part of the sample, and they are difficult to eliminate duringsample preparation. Light reflection and scattering of air bubblesinterfere with those of the Ni–DMG complexes. High chlorophyllcontents may reduce DMG colour-contrasts in particular in leafblade sections. The separation of DMG–Ni and chlorophyll signalsmay be further improved by a more sophisticated image analysis.
The DMG method systematically gave lower tissue Ni concen-
trations than HNO3 digestion and ICP-OES analysis. This indicatesthat DMG-stained Ni did not represent all tissue Ni, most likelybecause part of the Ni was not available to react with DMG. As thestability of Ni–DMG complexes is high with a log K of 14.6 (Furia,entrations in leaf midrib tissues using DMG-staining and image processing (DMG)..
entration in soil [mg kg−1]: 250 mg kg−1
leaves Middle leaves Top leavesn = 3 n = 3
150.2) 667.6 (115.6) 538.4 (97.9)
28.3) 318.8 (25.6) 329.1 (39.5).0) 207.1 (40.8) 207.5 (55.9)
31.2) 52.4 (9.8) 103.4 (6.3)34.1) 73.8 (15.4) 54.9 (6.1)32.6) <50 70.2(17.5)17.6) 157 (50.8) 180.7 (4.3)28.1) 245.8 (46.4) 195(13.5)
d Expe
1booa1tn2tbid
uskc(uittsalpsTa
5
ctiodiisgeiem
R
A
B
B
B
B
B
A. Gramlich et al. / Environmental an
972), it can be assumed that all Ni ions that are physically accessi-le by DMG in a plant tissue will be detected. The stability constantf Ni(DMG)2 for example is higher than that of Ni with histidiner that with citric acid (log K of 8.69 and 4.8, respectively), whichre both important ligands for Ni in plant tissues (Krämer et al.,996; Haydon and Cobbett, 2007). However, DMG may not be ableo complex all Ni bound in walls, because the DMG solution mayot penetrate suberin and wax containing structures (Smart et al.,007). Another source of error for underestimation of Ni concen-rations in the DMG method compared to ICP-OES analysis coulde the use of agar as a medium representing plant tissue in the cal-
bration procedure. It is likely that the speciation of Ni in agar isistinct from that in plant tissue.
The DMG method developed here has particular potential to besed for comparative analyses of Ni distribution pattern in cross-ections, where factors such as the thickness of sections can beept constant or do not play a great role. For example, the methodan reveal whether Ni is stored in the apoplast or in the symplastFig. 1). Such observations can provide important information aboutptake processes and underlying mechanisms. The finding that
n the root cortex Ni was concentrated in the apoplast indicateshat Ni is transported along the apoplastic pathway until reachinghe endodermis (Marschner, 1986). The advantage of our DMG-taining method is that cross-sections can be imaged immediatelyfter the addition of the DMG-solution. This means that there isittle time available for redistribution of Ni or crystal formation, aroblem of methods that involve soaking of cross-sections in DMG-olutions for several hours (Mizuno et al., 2003; Bhatia et al., 2004).he low costs of this method and its simplicity make it widelypplicable.
. Conclusions
Using a borax/KOH/DMG solution with a pH of 10, we obtainedonsistent and reproducible DMG-staining patterns of tissue sec-ions of the Ni hyperaccumulator B. coddii, revealing how Ni thats accessible to the stain is distributed in this plant. To obtainptimal results it is necessary that sections be imaged imme-iately after staining. It appears that a substantial Ni fraction
n the tissues is not accessible to the stain, possibly becauset is unable to penetrate suberin and wax-containing structuresuch as cell walls. The observed distribution patterns were inood agreement with the findings of other authors using differ-nt methods. The DMG-staining method has the advantage thatt gives a good spatial resolution, does not require expensivequipment, is easy to use, and is rapid in comparison to otherethods.
eferences
ndreı̌, O., Vollenweider, P., Günthardt-Goerg, M.S., 2006. Foliage response to heavymetal contamination in sycamore maple (Acer pseudoplatanus L.). Forest SnowLandscape Research 80 (3), 275–288.
asso, A., Cavagnino, D., Pomponiu, V., Vernone, A., 2010. Blind watermarking ofcolor images using Karhunen–Loève transform keying. The Computer Journal,doi:10.1093/comjnl/bxq052.
erazain, R., de la Fuente, V., Rufo, L., Rodriguez, N., Amils, R., Diez-Garretas, B.,Sanchez-Mata, D., Asensi, A., 2007. Nickel localization in tissues of differenthyperaccumulator species of euphorbiaceae from ultramafic areas of Cuba. PlantSoil 293, 99–106.
hatia, N.P., Walsh, K.B., Orlic, I., Siegele, R., Ashwath, N., Baker, A.J., 2004. Studies onspatial distribution of nickel in leaves and stems of the metal hyperaccumulatorStackhousia tryonii using nuclear microprobe (micro-PIXE) and EDXS techniques.Functional Plant Biology 31, 1061–1074.
idwell, S.D., Crawford, S.A., Woodrow, I.E., Sommer-Knudsen, J., Marshall, A.T.,2004. Sub-cellular localization of Ni in the hyperaccumulator, Hybanthus flori-bundus (Lindley) F. Muell. Plant, Cell and Environment 27, 705–716.
oominathan, R., Doran, P.M., 2003. Organic acid complexation, heavy metal distri-bution and the effect of ATPase inhibition in hairy roots of hyperaccumulatorplant species. Journal of Biotechnology 101, 131–146.
rimental Botany 71 (2011) 232–240 239
Boyd, R.S., 1998. Hyperaccumulation as a plant defensive strategy. In: Brooks, R.R.(Ed.), Plants that Hyperaccumulate Heavy Metals. CAB INTERNATIONAL, pp.181–201.
Brooks, R.R., 1977. Detection of nickeliferous rocks by analysis of herbarium speciesof indicator plants. Journal of Geochemical Exploration 7, 49–57.
Brooks, R.R., 1987. Serpentine and Its Vegetaion: A Multidisciplinary Approach.Dioscorrides, Portland, Oregan, USA.
Brooks, R.R., 1998a. General introduction. In: Brooks, R.R. (Ed.), Plants that Hyper-accumulate Heavy Metals. CAB INTERNATIONAL, pp. 1–14.
Brooks, R.R., 1998b. Geobotany and hyperaccumulators. In: Brooks, R.R. (Ed.), Plantsthat Hyperaccumulate Heavy Metals. CAB INTERNATIONAL, pp. 55–94.
Budka, D., Mesjasz-Przybylowicz, J., Tylko, G., Pryzbylowicz, W.J., 2005. Freeze sub-stitution methods for Ni localization and quantitative analysis in Berkheya coddiileaves. Nuclear Instruments and Methods in Physics Research B 231, 338–344.
Dakhel, A.A., Ali-Mohamed Ahmed, Y., Henari, F.Z., 2006. Structural and opticalstudies of evaporated bis-(dimethylglyoximato)nickel(ll) thin films. OpticalMaterials 28, 925–929.
Furia, T.E., 1972. Sequestrants in foods. In: CRC Handbook of Food Additives, 2nd ed.CRC Press, Cleveland, OH (Chapter 6).
Haydon, M.J., Cobbett, C.S., 2007. Transporters of ligands for essential metal ions inplants. New Phytologist 174, 499–506.
Heath, S.M., Southworth, D., D’Allura, J.A., 1997. Localization of nickel in epidermalsubsidiary cells of leaves of Thlaspi montanum var. Siskiyouense (Brassicaceae)using energy-dispersive X-ray microanalysis. International Journal of Plant Sci-ences 158 (2), 184–188.
Jain, A., 1989. Fundamentals of Digital Image Processing. Prentice Hall, ISBN 0-13332578-4.
Krämer, U., Cotter-Howells, J.D., Chanrock, J.M., Baker, A.J., 1996. Free histidine as ametal chelator in plants that accumulate nickel. Nature 379, 635–638.
Küpper, H., Lombi, E., Zhao, F.-J., Wieshammer, G., McGrath, S.P., 2001. Cellular com-partmentation of nickel in the hyperaccumulators Alyssum lesbiacum, Alyssumbertolonii and Thlaspi goesingense. Journal of Experimental Botany 52 (365),2291–2300.
L’Huillier, L., d’Auzac, J., Durand, M., Michaud-Ferriere, N., 1996. Nickel effects on twomaize (Zea mays) cultivars: growth, structure Ni concentration and localization.Canadian Journal of Botany 74, 1547–1554.
Marmiroli, M., Gonelli, C., Maestri, E., Gabbrielli, R., Marmiroli, N., 2004. Local-isation of nickel and mineral nutrients Ca, K, Fe, Mg by scanning electronmicroscopy microanalysis in tissues of the nickel-hyperaccumulator Alyssumbertolonii and the nonhyperaccumulator Alyssum montanum l. Plant Biosystems138 (3), 231–243.
Marschner, H., 1986. Mineral Nutrition of Higher Plants, 2nd ed. Academic PressLimited.
Mäser, P., Gierth, M., Schröder, J., 2002. Molecular mechanisms of potassium andsodium uptake in plants. Plant and Soil 247, 43–54.
McNear, D.H., Peltier, E., Everhart, J., Chaney, R.L., Sutton, S., Newville, M., Rivers, M.,Sparks, D.L., 2005. Application of quantitative fluorescence and absorptionedgecomputed microtomography to image metal compartmentalization in Alyssummurale. Environmental Science Technology 39, 2210–2218.
Mesjasz-Przybylowicz, J., Barnabas, A., Pryzbylowicz, W.J., 2007. Comparisons ofcytology and distribution of nickel in roots of Ni-hyperaccumulating and non-hyperaccumulating genotypes of Senecio coronatus. Plant Soil 293, 61–78.
Mesjasz-Przybylowicz, J., Pryzbylowicz, W.J., Pineda, C.A., 2001. Nuclear microprobestudies of elemental distribution in apical leaves of the Ni hyperaccumulatorBerkheya coddii. South African Journal of Science 97, 591–593.
Migliorini, M., Pigino, G., Bernini, F., Leonzio, C., 2004. The effects of heavy metal con-tamination on the soil arthropod community of a shooting range. EnvironmentalPollution 129, 331–340.
Mizuno, N., Nosako, S., Mizuno, T., Horie, K., Obata, H., 2003. Distribution of Ni andZn in the leaves of Thlaspi japonicum growing on ultramafic soil. Soil Science andPlant Nutrition 49 (1), 93–97.
Moradi, A.B., Swoboda, S., Prohaska, T., Robinson, B.H., Kästner, A., Oswald, S., Wen-zel, W.W., Schulin, R., 2010. Mapping of nickel in root cross-sections of thehyperaccumulator plant Berkheya coddii using laser ablation ICP-MS. Environ-mental and Experimental Botany 69, 24–31.
Ortega, R., 2005. Chemical elements distribution in cells. Nuclear Instruments andMethods in Physics Research B 231, 218–223.
Ozturk, L., Yazici, M.A., Yucel, C., Torun, A., Cekic, C., Bagci, A., Ozkan, H., Braun,H.-J., Sayers, Z., Cakmak, I., 2006. Concentration and localization of zinc dur-ing seed development and germination in wheat. Physiologia Plantarum 128,144–152.
Page, V., Feller, U., 2005. Selective transport of zinc, manganese, nickel, cobalt andcadmium in the root system and transfer to the leaves in young wheat plants.Annals of Botany 96, 425–434.
R Development Core Team (2008). R: A Language and Environment for StatisticalComputing. R Foundation for Statistical Computing, Vienna, Austria. ISBN: 3-900051-07-0, URL http://www.R-project.org.
Richau, K.H., Kozhevnikova, A.D., Seregin, I.V., Vooijs, R., Koevoets, P.L.M., Smith,J.A.C., Ivanov, V.B., Schat, H., 2009. Chelation by histidine inhibits the vacuolarsequestration of nickel in roots of the hyperaccumulator Thlaspi caerulescens.
New Phytologist 183, 106–116.Riesen, O., Feller, U., 2005. Redistribution of nickel, cobalt, manganese, zinc and cad-mium via the phloem in young and maturing wheat. Journal of Plant Nutrition28 (3), 421–430.
Robinson, B.H., Brooks, R.R., Howes, A.W., Kirkman, J.H., Gregg, P.E.H., 1997. Thepotential of the high-biomass nickel hyperaccumulator Berkheya coddii for

2 d Expe
R
R
S
Smart, K.E., Kilburn, M.R., Salter, C.J., Smith, J.A.C., Grovenor, C.R.M., 2007. NanoSIMS
40 A. Gramlich et al. / Environmental an
phytoremediation and phytomining. Journal of Geochemical Exploration 60,115–126.
obinson, B.H., Lombi, E., Zhao, F.J., McGrath, S.P., 2003. Uptake and distribution ofnickel and other metals in the hyperaccumulator Berkheya coddii. New Phytol-
ogist 158, 279–285.odriguez-Navarro, A., Rubio, F., 2006. High-affinity potassium and sodium trans-port systems in plants. Journal of Experimental Botany 57 (5), 1149–1160.
agner, S., Kneer, R., Wanner, G., Cosson, J.-P., Dues-Neumann, B., Zenk, M.H., 1998.Hyperaccumulation, complexation and distribution of nickel in Sebertia acumi-nata. Phytochemistry 47 (3), 339–347.
rimental Botany 71 (2011) 232–240
Seregin, I.V., Kozhevnikova, A.D., Kazyumina, E.M., Ivanov, V.B., 2003. Nickel toxic-ity and distribution in maize roots. Russian Journal of Plant Physiology 50 (5),793–800.
and EPMA analysis of nickel localisation in leaves of the hyperaccumula-tor plant Alyssum lesbiacum. International Journal of Mass Spectroscopy 260,107–114.
Tung, G., Temple, P.J., 1996. Histochemical detection of lead in plant tissues. Envi-ronmental Toxicology and Chemistry 15 (6), 906–914.