
Dimensionality of the Force Concept Inventory: Comparing … · 2018-06-16 · Newtonian force...
32
Dimensionality of the Force Concept Inventory: Comparing Bayesian Item Response Models Xiaowen Liu Eric Loken University of Connecticut 1
Transcript of Dimensionality of the Force Concept Inventory: Comparing … · 2018-06-16 · Newtonian force...

Dimensionality of the Force Concept Inventory: Comparing Bayesian Item Response Models
Xiaowen Liu
Eric Loken
University of Connecticut
1

Overview
• Force Concept Inventory
• Bayesian implementation of one- and two-dimensional IRT
• Placing IRT results in other contexts
• Summary and future directions
2

Force Concept Inventory(FCI)
• The Force Concept Inventory (FCI) is very widely used in college physics
classes.
• Force Concept Inventory (FCI) was designed as an instrument for probing
Newtonian force concepts and commonsense misconceptions. The
questions do not require any calculations – just conceptual understanding.
• The core concepts all relate to Newtonian laws of motion, and the questions
look very simple on the surface, but require the student to answer based on
a true appreciation of Newton’s laws and what they mean, as opposed to
just using basic (and incorrect) intuitions about force and motion.
3

Force Concept Inventory(FCI)
• The test was created with specific misconceptions in mind, and the answer
choices reflect this. In fact the distractors are basically as important as the
correct answers.
• In this inventory, Newtonian force concepts were decomposed as six
conceptual dimensions and each dimension has its own sub-dimension
(Hestenes, Wells, and Swackhamer, 1992).
4

Correct Answer: DMisconception: B, C, EImpetus supplied by “hit”
Force Concept Inventory(FCI)—An Example
5

Previous Research on
Checking Dimensionality of FCI
1. Exploratory factor analysis (EFA)
• Huffman and Heller (1995) found few main factors and lots of ambiguous
factors which cannot correspond to the six proposed dimensions.
• Scott, Schumayer, and Gray (2012) identified five factors and interpreted
these factors as different Newtonian sub-concepts.
• Semak et. al (2017) identified evolution of response patterns of FCI from
pre- and post-tests. They extracted five and six factors in FCI pre-test and
post-test respectively.
6

Previous Research on
Checking Dimensionality of FCI
1. Exploratory factor analysis (EFA)
• Issues
1. Over extraction-- Eigenvalues have similar values except the first one.
2. Interpretation of extracted factors did not match to the six proposed
dimensions. This may imply that test proposed dimensions do not match
the factors actually measured.
7
Previous Research on
Checking Dimensionality of FCI
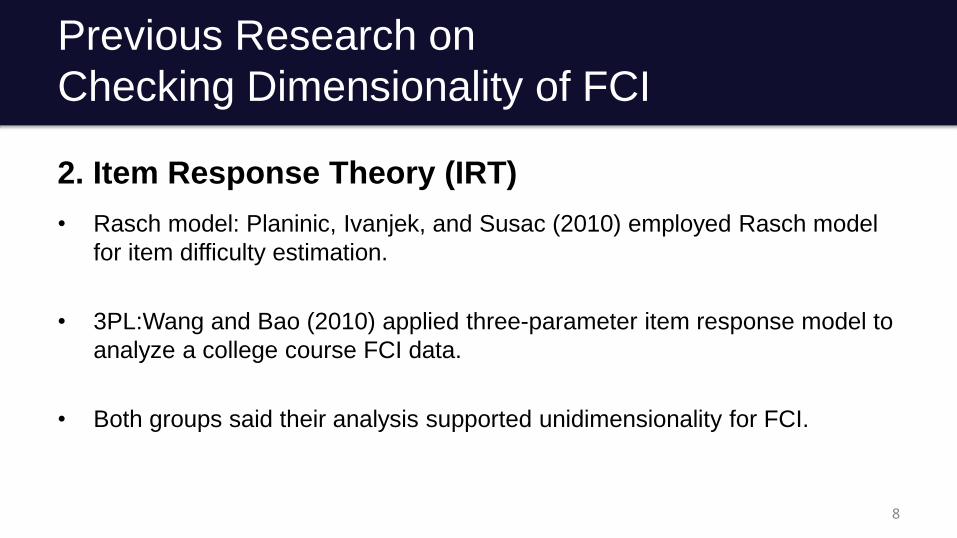
2. Item Response Theory (IRT)
• Rasch model: Planinic, Ivanjek, and Susac (2010) employed Rasch model
for item difficulty estimation.
• 3PL:Wang and Bao (2010) applied three-parameter item response model to
analyze a college course FCI data.
• Both groups said their analysis supported unidimensionality for FCI.
8

Previous Research on FCI
3. Item Response Curve (IRC)
Morris et al. (2012) applied Item response
curve to FCI to investigate distractor function
of each item at each ability level.
• Nonparametric method
• Describes the proportion of selection for
each option in each item.
• They explicated the information provided
by misconception alternatives.
9

Previous Research on FCI
3. Item Response Curve (IRC)
10
Total score
Proportion of selection

Bayesian Item Response Theory
• A Bayesian approach may improve the reliability of the statistical
inferences by treating parameters as random variables and incorporating
prior information.
• The flexibility of the model: define prior distributions for the item response
model parameters which can handle more complex sampling designs
comprising complex dependency structures (Fox, 2010).
11

Purpose
In this study, we explored test structure of FCI through Bayesian approach by
comparing two models.
Unidimensionaltwo-parameter model
Multidimensional two-parameter model
12

Bayesian IRT--Model
• Bayesian Two-PL Two-dimension IRT model
P(𝜃, 𝜉| 𝑦) ∝ p(y| 𝜃, 𝜉)p(𝜃, 𝜉)
𝜃 is the person parameter and 𝜉 is item parameters (item difficulty and discrimination).
P(y=1| 𝜃1, 𝜃2, 𝑎1, 𝑎2, 𝑏)=1
1+exp[− 𝑎1𝜃1+𝑎2𝜃2+𝑏 ]
• Estimation-- Markov chain Monte Carlo (MCMC)
13

Bayesian IRT--Prior
theta a b
2p1dim normal(0,1) lognormal(0,1) beta ~ normal(mu_beta,sigma_beta)mu_beta ~ normal(0,5) (hyper)sigma_beta ~ cauchy(0,5) (hyper)
2p2dim normal(0,1) alpha1 ~ lognormal(0, 1)
beta ~ normal(mu_beta,sigma_beta)mu_beta ~ normal(0,5) (hyper)sigma_beta ~ cauchy(0,5) (hyper)
14

Bayesian IRT--Model
• R-STAN was used for fitting the Bayesian IRT models (Luo & Jiao, 2017).
• The large sample (N = 1169) of FCI student responses was collected from a large introductory physics class at the end of the semester.
15

Item a b a1 a2 b1 1.10 2.47 1.11 0.00 2.702 0.77 0.73 0.66 0.40 0.563 0.98 1.29 1.09 0.21 1.314 1.46 2.09 0.74 1.50 3.215 1.57 0.76 1.05 1.74 1.326 1.16 2.52 1.15 0.37 2.937 0.90 2.19 0.76 0.47 1.968 1.09 0.93 1.19 0.27 1.059 0.91 0.61 1.02 0.17 0.58
10 1.85 1.43 1.76 0.77 2.6711 1.17 1.10 0.70 1.31 1.3912 1.24 2.06 1.26 0.41 2.5913 2.66 0.87 1.99 2.08 2.3714 1.09 0.64 1.26 0.19 0.7515 0.32 1.85 0.12 0.54 0.6016 0.83 2.22 0.57 0.61 1.8417 1.44 0.12 1.14 0.97 0.1618 1.62 1.00 1.02 1.96 1.8719 1.34 1.57 1.35 0.48 2.1520 1.13 1.49 0.99 0.58 1.6821 0.90 0.09 0.98 0.19 -0.0722 1.38 0.80 1.55 0.35 1.1923 1.18 0.36 1.51 0.12 0.4924 1.44 1.79 1.50 0.47 2.6525 1.98 0.25 1.69 1.04 0.5026 2.10 0.04 1.92 0.91 -0.0827 1.11 1.10 1.38 0.15 1.3328 1.94 1.60 1.22 1.66 3.1929 0.65 4.00 0.21 0.57 2.59
30 1.50 0.47 1.09 1.28 0.72
Table 1. Item parameter estimations for the two item response models
Bayesian IRT--Result
16

Bayesian IRT—Model Fit
Widely available information criterion (WAIC;Watanabe, 2010) and leave-one-out cross-
validation (LOO; Vehtari, Gelman, &Gabry, 2016a) are proved to be superior to more
traditional methods such as the likelihood ratio test, AIC, BIC, and DIC (Harbi, 2016).
In stan, the posterior distributions can be obtained and used to compute the WAIC and LOO.
Unidimensional 2PL Multidimensional 2PL
LOO 31447.7 31186.5
WAIC 31422.3 31109.6
Table 2. Fit indices for comparing the two item response models 17

Two Ways to Explain the Second Dimension
Item Response Curve K-means clustering
the items with high loadings on the second dimension have strong distractors
the items with high loadings on the second dimension can differentiate the medium and the weak group.
18

Item a b a1 a2 b1 1.10 2.47 1.11 0.00 2.702 0.77 0.73 0.66 0.40 0.563 0.98 1.29 1.09 0.21 1.314 1.46 2.09 0.74 1.50 3.215 1.57 0.76 1.05 1.74 1.326 1.16 2.52 1.15 0.37 2.937 0.90 2.19 0.76 0.47 1.968 1.09 0.93 1.19 0.27 1.059 0.91 0.61 1.02 0.17 0.58
10 1.85 1.43 1.76 0.77 2.6711 1.17 1.10 0.70 1.31 1.3912 1.24 2.06 1.26 0.41 2.5913 2.66 0.87 1.99 2.08 2.3714 1.09 0.64 1.26 0.19 0.7515 0.32 1.85 0.12 0.54 0.6016 0.83 2.22 0.57 0.61 1.8417 1.44 0.12 1.14 0.97 0.1618 1.62 1.00 1.02 1.96 1.8719 1.34 1.57 1.35 0.48 2.1520 1.13 1.49 0.99 0.58 1.6821 0.90 0.09 0.98 0.19 -0.0722 1.38 0.80 1.55 0.35 1.1923 1.18 0.36 1.51 0.12 0.4924 1.44 1.79 1.50 0.47 2.6525 1.98 0.25 1.69 1.04 0.5026 2.10 0.04 1.92 0.91 -0.0827 1.11 1.10 1.38 0.15 1.3328 1.94 1.60 1.22 1.66 3.1929 0.65 4.00 0.21 0.57 2.59
30 1.50 0.47 1.09 1.28 0.72
Table 1. Item parameter estimations for the two item response models
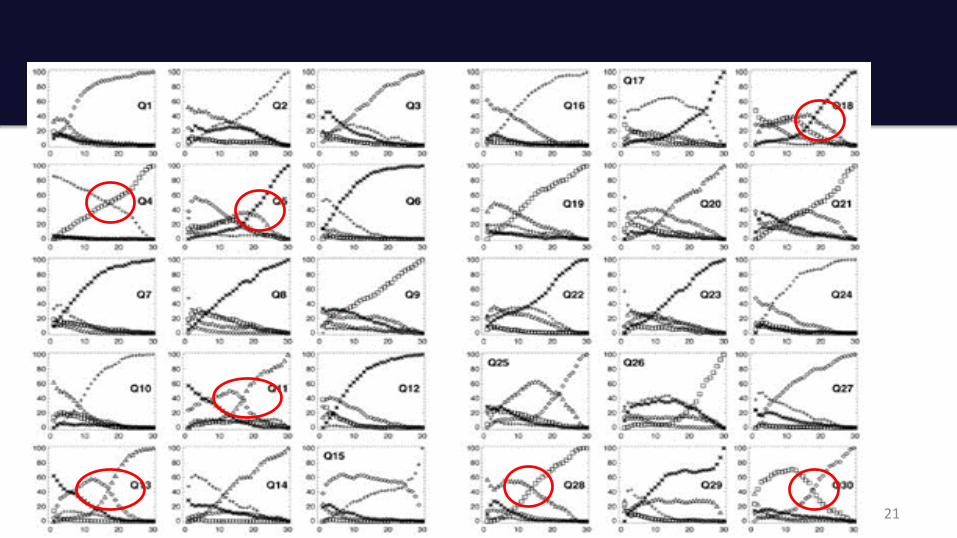
Explain the Second Dimension--Item Response Curve
Item 4, 5, 11, 13, 18, 28, 30
19

20
21
Explain the Second Dimension—
Cluster Analysis: K-Means Clustering
Suppose we take the 30 dichotomous responses and conduct kmeans clustering
This provides a simple and quick way to generate groups.
For now, we look at the solution for 3 clusters
22

Explain the Second Dimension--Cluster Analysis:
K-Means Clustering
K-means clustering produces three groups. In our data set, these three groups came out as follows:
23
Mean FCI Score Cluster Size
Weak 43% 13/30 216
Moderate 69% 21/30 420
Strong 89% 27/30 533

Explain the Second Dimension—
Cluster Analysis: K-Means Clustering
Percentage of correct answers in the three groups.
What are the questions on the FCI that most differentiate the groups?
24

Explain the Second Dimension--Cluster Analysis:
K-Means Clustering
To do this we can make a barplot of the differences in the percent correct between the weak and the moderate groups.
Item 5, 11, 13,18, 28, 30
This information is also implied by IRC graphs.
25

Explain the Second Dimension--Cluster Analysis:
K-Means Clustering
If we plot the relative differences from this histogram against the factor loadings for the second dimension of the IRT model we get the following:
Correlation=0.8The items on the FCI that show the largest contrast between the low and medium groups are also the items that load on the second factor.
26

Explain the Second Dimension--Cluster Analysis:
K-Means Clustering
Comparing the medium and strongest group. We can ask if the high versus medium contrast corresponds to anything in the IRT analysis. We now highlight a different set of items, and these differences are correlated 0.8 with the test difficulty scores from the 2dim model.
Item 2, 9, 14, 17, 21, 22, 23, 25, 2627

28
Group Mean Score
Weak 12.9
Medium 20.7
Strong 26.7
Three different approaches converge
Bayesian IRT: pick up item with higher loadings on the second dimension
Item response curve:
Cluster analysis:

Conclusion
• The current study investigates the dimensionality of the Force Concept
Inventory and finds that the two-dimension Item Response Model has a
better fit than the unidimensional model.
• We explored the second dimension in two ways:
1. Item Response Curve--the items with high loadings on the second
dimension may have strong distractors.
2. K-means clustering-- items with high loadings on the second dimension
can differentiate the medium and the weak group.
29

Future Research
• A clear next step is to use polytomous IRT model.
• Carry out an item analysis with experts
• Investigate evidence of learning progressions, or individual trajectories
of improvement.
30

References
Fox, J. P. (2010). Bayesian item response modeling: Theory and applications. Springer Science & Business Media.
Hestenes, D., Wells, M., & Swackhamer, G. (1992). Force concept inventory. The physics teacher, 30(3), 141-158.
Huffman, D., & Heller, P. (1995). What does the force concept inventory actually measure?. The Physics Teacher, 33(3), 138-143.
Luo, Y., & Jiao, H. (2017). Using the Stan Program for Bayesian Item Response Theory. Educational and Psychological Measurement, 0013164417693666.
Morris, G. A., Harshman, N., Branum-Martin, L., Mazur, E., Mzoughi, T., & Baker, S. D. (2012). An item response curves analysis of the Force Concept Inventory. American Journal of Physics, 80(9), 825-831.
Planinic, M., Ivanjek, L., & Susac, A. (2010). Rasch model based analysis of the Force Concept Inventory. Physical Review Special Topics-Physics Education Research, 6(1), 010103.
Scott, T. F., Schumayer, D., & Gray, A. R. (2012). Exploratory factor analysis of a Force Concept Inventory data set. Physical Review Special Topics-Physics Education Research, 8(2), 020105.
Semak, M. R., Dietz, R. D., Pearson, R. H., & Willis, C. W. (2017). Examining evolving performance on the Force Concept Inventory using factor analysis. Physical Review Physics Education Research, 113(1), 010103.
Sinharay, S. (2003). Bayesian item fit analysis for dichotomous item response theory models. ETS Research Report Series, 2003(2).
Sinharay, S. (2005). Assessing fit of unidimensional item response theory models using a Bayesian approach. Journal of Educational Measurement, 42(4), 375-394.
Sinharay, S. (2006). Bayesian item fit analysis for unidimensional item response theory models. British journal of mathematical and statistical psychology, 59(2), 429-449.
Sinharay, S., Johnson, M. S., & Stern, H. S. (2006). Posterior predictive assessment of item response theory models. Applied Psychological Measurement, 30(4), 298-321.
Wang, J., & Bao, L. (2010). Analyzing force concept inventory with item response theory. American Journal of Physics, 78(10), 1064-1070.
31

Questions
32