DIME Working Papers on INTELLECTUAL PROPERTY€¦ · · 2010-11-25Management of patent portfolios...
42
Dynamics of Institutions and Markets in Europe is a network of excellence of social scientists in Europe, working on the economic and social consequences of increasing globalization and the rise of the knowledge economy. http://www.dime-eu.org/ DIME Working Papers on INTELLECTUAL PROPERTY RIGHTS http://ipr.dime-eu.org/ipr_publications Emerging out of DIME Working Pack: ‘The Rules, Norms and Standards on Knowledge Exchange’ Further information on the DIME IPR research and activities: http://ipr.dime-eu.org/ Sponsored by the 6 th Framework Programme of the European Union This working paper is submitted by: Ludmila Striukova Roehampton University Email: [email protected] Value Creation from Patents: Empirical study This is Working Paper No 10 (March 2006) The Intellectual Property Rights (IPR) elements of the DIME Network currently focus on research in the area of patents, copyrights and related rights. DIME’s IPR research is at the forefront as it addresses and debates current political and controversial IPR issues that affect businesses, nations and societies today. These issues challenge state of the art thinking and the existing analytical frameworks that dominate theoretical IPR literature in the fields of economics, management, politics, law and regulation- theory.
Transcript of DIME Working Papers on INTELLECTUAL PROPERTY€¦ · · 2010-11-25Management of patent portfolios...

Dynamics of Institutions and Markets in Europe is a network of excellence of social scientists in Europe, working on the economic and social consequences of increasing globalization and the rise of the knowledge economy. http://www.dime-eu.org/
DIME Working Papers on
INTELLECTUAL PROPERTY RIGHTS
http://ipr.dime-eu.org/ipr_publications
Emerging out of DIME Working Pack:
‘The Rules, Norms and Standards on Knowledge Exchange’
Further information on the DIME IPR research and activities:
http://ipr.dime-eu.org/
Sponsored by the 6th Framework Programme
of the European Union
This working paper is submitted by:
Ludmila Striukova
Roehampton University Email: [email protected]
Value Creation from Patents:
Empirical study
This is Working Paper No 10 (March 2006)
The Intellectual Property Rights (IPR) elements of the DIME Network currently focus on research in the area of patents, copyrights and related rights. DIME’s IPR research is at the forefront as it addresses and debates current political and controversial IPR issues that affect businesses, nations and societies today. These issues challenge state of the art thinking and the existing analytical frameworks that dominate theoretical IPR literature in the fields of economics, management, politics, law and regulation- theory.

1
Value creation from patents:
empirical study Ludmila Striukova1
Abstract: The main aim of this article is to examine the role of governance structures in
value creation from patents. We discuss in turn how value can be created when patents
are co-owned, used in licensing-in, licensing-out or cross-licensing agreements or
contributed to a patent pool. Our analysis shows that non-market value embedded in
patents is becoming more important for companies when they use their patents in
cooperative governance structures. In addition, we empirically confirm that there is a
relationship between the governance structures companies choose and the type of value
they seek. Our analysis also shows that the choice of patent governance structures is
based on the objectives of the company in terms of value creation.

2
1. Introduction
Management of patent portfolios has become a major focus for corporations in all
industries, and not just those in industries that have traditionally been technology-
dominated.
Davis (2004) argues that there are four main reasons why the role of IPRs has changed.
First of all this is due to the fact that intangible assets are now more often recognized as
sources of competitive advantage. The other reasons for IPRs becoming more important
are: the globalization of business activities, advances in digital technologies in terms of
easier replicability and transferability and changes in the IPR regulatory framework. It is
important to note, that despite the increasing propensity to patent, a lot of companies still
do not recognize the value embedded in IPRs and, unfortunately do not benefit from this
value.
The paper will have the following structure. First of all we will look at determinants of
value created by patents discussed previously in the literature. We will then identify
patent governance structures to be used in the study. In section 4, we describe the
methodology used in the study, and we present the participants in section 5. We examine
the value creation from patents when used under different governance structures (co-
ownership, licensing-in/out, cross-licensing or patent pools) in sections 6-10. In the next
sections we summarize our findings and state the limitations of the study.
2 Value determinants
There are, of course, some general factors that affect the process of value creation
through patents, and below we present the points previously discussed in the literature.
Since patent rights are expensive to obtain and maintain, questions concerning the
economic value of patents have attracted economists’ interest for years, both from

3
theoretical and empirical points of view. Some of the characteristics that are thought to
affect the value of patents are listed in the circles of Figure 1 below.
Figure 1 Patent value taxonomy: value determinants
Value created by patents
Market relationships
Non-market relationships
Systems & structures
Individual entities
Lifetime of patent
Patent breadth
(“scope”)
Portfolio position
Difficulty to invent around
Governance strategy applied
Degree of protection
from infringement
Information disclosure
Renewal information
Backward & forward citations Legal
argument
Starting with the first studies by Nordhaus (1967), theorists have discussed the value-
determining parameters of patents. In his first model, Nordhaus (1967) introduced the
lifetime of a patent as a value-determining parameter. He pioneered the theory that the
development of accumulated flows of profits from the patent has the same function as
discounted value. Later, Matutes et al. (1996) suggested that returns by patent per period

4
are not constant, moreover they keep increasing until the global maximum point of the
technology cycle starts to decrease.
It is known that the value of a patent is highly idiosyncratic, i.e. it depends on the
strategy and on the complementary assets of the owner. Also, patent value changes over
time. The value of patents can depend on the degree of protection associated with a
certain invention (i.e. whether the patent is narrow or broad). Klemperer (1990) and
Gilbert and Shapiro (1990) suggest that the patent breadth (‘scope’) can also affect the
value of the patent. The authors believe that in the optimal patent system, the wider the
breadth of the patent, the higher the innovator’s profit. In addition, Lerner (1994) shows
how the breadth of patent protection significantly affects valuations. Broad patents are
more valuable when there are a lot of substitutes in the same product class.
Green and Scotchmer (1995) provide a theoretical model of the impact of technical non-
obviousness (inventive activity) and disclosure on the value of patents. The authors
suggest that by disclosing technical information, this might be rather advantageous to a
patentee’s competitors and, as result of that, the patentee might prefer trade secrets to
patents. The value of the patent may also depend on the overall value of the patent
portfolio, or on the role that this patent plays in the portfolio. Finally, Gallini (1992)
argues that the difficulty of ‘inventing around’ a patent can be important in determining
its value.
Industrial economists have also worked extensively on the assessment of patents by value
indicators. Renewal information is one of the proposed indicators. Lanjouw et al. (1998)
suggest that the information about the number of years a patent is renewed, and the
number of countries in which protection for the same invention is sought, can help to
assess the patent value. They illustrate how the value of patent protection would vary
under alternative legal rules and renewal fees. Backward2 and forward3 citations4 could
2 Citations made by a patent 3 Citations that a patent subsequently receives from other patents

5
be another indicator. Carpenter and Narin (1981), among others, argue that patents
associated with more important innovations are more likely to be cited. Legal arguments
are also mentioned by several researchers (Harhoff et al., 1999; Lanjouw and
Shankerman, 2001) as indicators of patent value. It is believed that the probability of
litigation will be higher for more valuable patents.
The studies mentioned above do not cover all previous attempts to measure patent value,
but are a presentation of some important contributions to the debate. Nevertheless, we
believe that we can add to the discussion by looking at the role of governance structures
in value creation from patents.
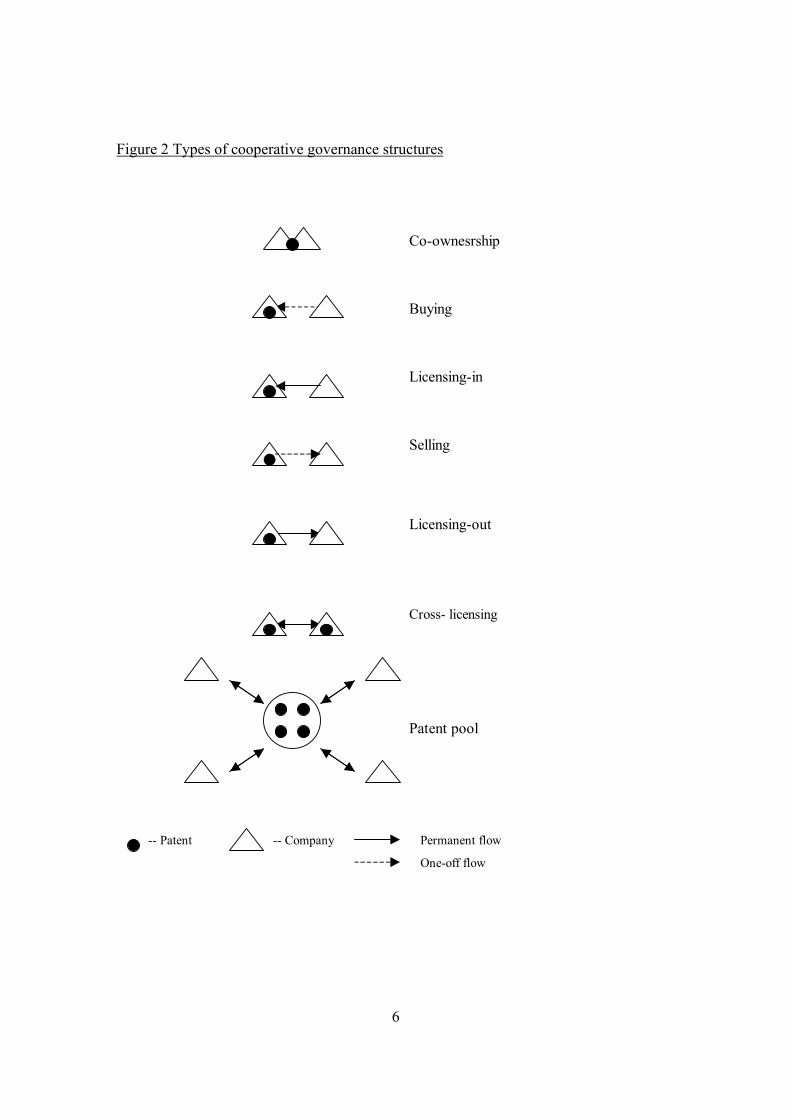
3 Types of patent cooperative governance structure
For the purposes of our research, we have built upon these studies and have identified
seven different governance structures used in patent management (see Figure 2 below).
These structures are: co-ownership, buying, selling, licensing-in, licensing-out, cross-
licensing and patent pools.
4 References to prior technology, either patents or other scientific literature on which the current patent builds or which it uses
6
Figure 2 Types of cooperative governance structures
Co-ownesrship
Buying
Licensing-in
Selling
Licensing-out
Cross- licensing
Patent pool
-- Patent -- Company Permanent flow
One-off flow

7
4. Methodology
As the goals of this study is to investigate the role of different governance structures in
value creation, we decided to aim at industries where all five governance structures (co-
ownership, licensing-in, licensing-out, cross-licensing and patent pools), were
represented. These industries are machinery, hardware, electronics, telecommunications,
energy, pharmaceuticals and software.
We also wanted to target companies who use all above mentioned structures on a regular
basis. One of the advantages of this approach was that there are only about 35-40
companies in the world who are involved in two or more patent pools5, which means that
this sample was well-defined.
We then needed to identify these individuals responsible for making decisions regarding
patent portfolios. We decided that approaching companies by email would be the best
option due to the low cost and high speed of this method. In the beginning we tried to
contact employees in charge of public relation (PR) activities in the hope that they could
provide us with the names/addresses of those engaged in IPR activities. This method did
not produce any answers, so we chose a different approach – we contacted the employees
of the selected companies who participated in international conferences and asked them
to identify the licensing directors, managers, etc of their companies. Later, patent pool
members, involved in standard setting (e.g. IETF), also helped us to identify companies
that were planning to join a patent pool. Overall, this second approach helped to identify
36 (27 involved in patent pools, 9 planning to join patent pools) prospective respondents
(companies). We then contacted those in charge of the intellectual property strategy or
patent management in each company (sometimes as many as 5 people per company) by
both telephone and email with the offer to participate in the study, respondents from 31
companies agreed to participate. The participants were offered a choice of a Word
document or an online questionnaire.
5 Source: Licensing Executives Society (2004)

8
Despite the fact that it was quite difficult to find companies willing to participate in the
survey, 31 companies agreed to fill in the questionnaire (including 22 companies that use
all five governance structures). This is considered to be a reliable response rate according
to Singh and Schwab (2000) who state: "Research experts have argued that mail surveys
may not be reliable unless they either achieve a minimum of 50% response or
demonstrate, with some form of verification, that the non-respondents are similar to the
respondents". The high response rate can certainly be explained by the intensive
communication with prospective respondents, the novelty of the study and also the
promise to share the final results. As our response rate was 84% of the originally
predetermined sample and as we received questionnaires from small, medium and big
players across several industries it can be concluded, using the statement above, that our
results are valid.
5. Participants
In the Table 1 below we present our respondents in relation to their engagement in
different patent structures. Our respondents chose to remain anonymous, that is why we
assigned codes to them and use these codes in the analysis chapters.6. We encoded their
names using the industry they belong to as the letter of the code (M – machinery, H –
hardware, EL – electronics, T – telecommunications, PH – pharmaceuticals, EN- energy,
S – software)
6 The examiners will be provided with the real names of the companies

9
Table 1. Survey participants by patenting activity
Company Code
No. of patents Co- ownership
Licensing-in Licensing out
Cross- licensing
Patent pool
M1 3,500 X X X X X
M2 >35,000 X X X X X
M3 25,000 X X X X X
H1 12,000 X X X X
H2 60,000 X X X X X
H3 >500 X X X X X
EL1 50,000 X X X X X
EL2 >500 X X X X X
EL3 5,000 X X X X X
EL4 42,000 X X X X X
EL5 402 (+303
pending)
X X X X X
EL6 112 (+400
pending)
X X X X X
EL7 20,000 X X X X X
T1 3,500 X X X X X
T2 >10,000 X X X X X
T3 750 X X X X X
T4 76 X X X
T5 1,500 X X X X X
T6 1,100 X X X X X
T7 6,000 X X X X X
PH1 >1,000 X X X X X
PH2 >5,000 X X X X X
PH3 83 X X X
PH4 >10,000 X X X X
EN1 65 X X
EN2 44 X
EN3 1150 X X
S1 59 X X X
S2 46 X X X
S3 5,000 X X X X X
S4 >3,000 X X X X X
Note: X- means active in this governance structure

10
Our respondents involved companies from 7 sectors, with the following breakdown:
Graph 1 Respondents by sectors
energy10%
hardware10%
machinery10%
pharma13%
software13%
electronics22%
telecom22% energy
hardw are
machinery
pharma
softw are
electronics
telecom
N.B. n=31
In terms of age, the majority of companies participating in our survey are older that 10
years (81%), and more than a quarter (29%) are older than 100 years. Also, the only
company less than 5 years old, is actually a joint venture between two established
companies.
Graph 2 Respondents by age
< 53% 5 - 10
16%
10 - 10052%
> 10029% < 5
5 - 1010 - 100> 100
N.B. n=31
11
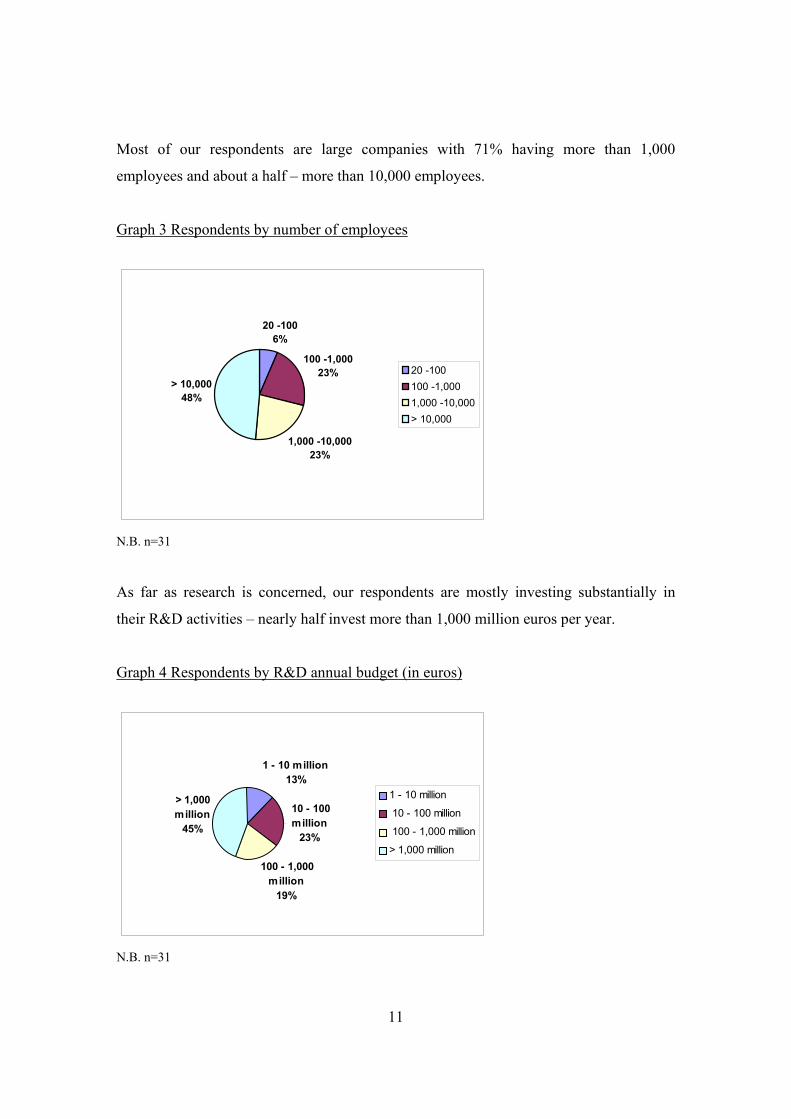
Most of our respondents are large companies with 71% having more than 1,000
employees and about a half – more than 10,000 employees.
Graph 3 Respondents by number of employees
20 -1006%
100 -1,00023%
1,000 -10,00023%
> 10,00048%
20 -100100 -1,0001,000 -10,000> 10,000
N.B. n=31
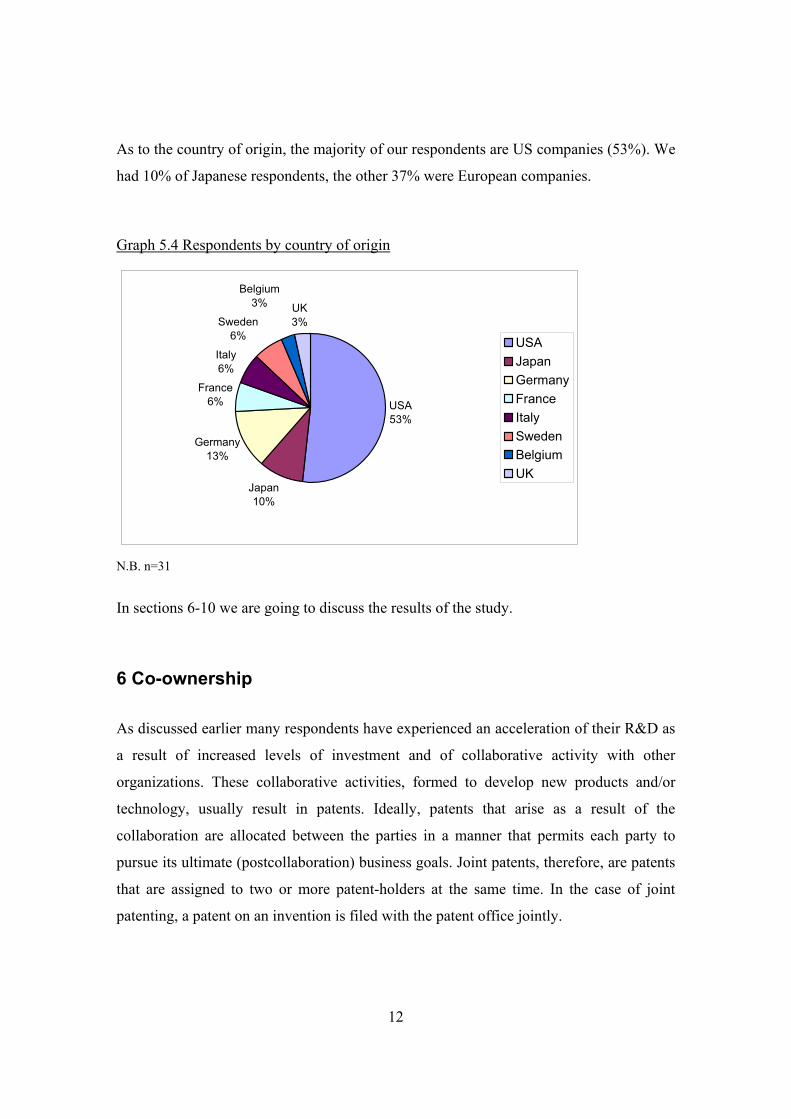
As far as research is concerned, our respondents are mostly investing substantially in
their R&D activities – nearly half invest more than 1,000 million euros per year.
Graph 4 Respondents by R&D annual budget (in euros)
1 - 10 million13%
100 - 1,000 million
19%
> 1,000 million
45%
10 - 100 million
23%
1 - 10 million
10 - 100 million
100 - 1,000 million
> 1,000 million
N.B. n=31
12
As to the country of origin, the majority of our respondents are US companies (53%). We
had 10% of Japanese respondents, the other 37% were European companies.
Graph 5.4 Respondents by country of origin
Germany13%
Belgium3% UK
3%Sweden6%
Italy6%
France6%
Japan 10%
USA53%
USAJapan GermanyFranceItalySwedenBelgiumUK
N.B. n=31 In sections 6-10 we are going to discuss the results of the study.
6 Co-ownership
As discussed earlier many respondents have experienced an acceleration of their R&D as
a result of increased levels of investment and of collaborative activity with other
organizations. These collaborative activities, formed to develop new products and/or
technology, usually result in patents. Ideally, patents that arise as a result of the
collaboration are allocated between the parties in a manner that permits each party to
pursue its ultimate (postcollaboration) business goals. Joint patents, therefore, are patents
that are assigned to two or more patent-holders at the same time. In the case of joint
patenting, a patent on an invention is filed with the patent office jointly.

13
However, not all industries are characterized by a growing rate of collaboration. All the
respondents from the energy sector reported that they do not have any co-ownership
agreements. The majority of participants who do have co-ownership agreements (24 out
of 26 companies) reported that their co-ownership agreements are signed as a result of
continuation of R&D. There are some cases where co-ownership agreements are a result
of lawsuits (EL 4, PH1), but these cases are very rare.
One interesting observation is that co-owned patents are more common for companies
with small patent portfolios (i.e. 100% of patents that belong to PH3 and S2 are co-
owned). Once companies reach a level where they own more than just a few patents (for
example H2, EL4) they tend to have less co-owned patents. Some companies even
specify that they are trying to avoid co-ownership as this type of agreement is more
complicated to govern than sole-owned ones (for example EL4).
6.1 Corporate values of co-ownership agreements
Co-owned patents are outcomes of research collaborations. All our respondents believe
that the value pf co-owned patents is only realized, however, when the co-owned patents
are used in other governance structures (licensing-in, licensing-out, cross-licensing and
patent pools).
6.2 Risks of co-ownership agreements
Co-ownership agreements also imply certain risks for a firm. All risks associated with co-
ownership are considered by respondents to be quite negligible. Companies mostly worry
about the other party selling or licensing-out the patent without their consent and about
the exposure (sometimes unwillingly) of the terms of the patent by the other party until
the patenting process is finalized. Absence of the common law, on the other hand, is the
least of companies’ concerns.

14
In addition, respondents (EL1 and T2) noted that co-ownership often prevents efficient
and adequate integration into license agreements with third party. It might create
problems when one co-owner wishes to bring an infringement action against a third party
and the other co-owner does not wish to join in the suit.
Finally, respondents (M2, EL6, T4) were concerned with some governance issues, such
as deciding who is responsible for annual renewals, who decides whether to enforce
against infringers, who controls and pays for the enforcement litigation and finally what
licensing or other action should be permitted without seeking a co-owner's consent.
7 Licensing-in
In general, the number of licensing-in agreements has not increased in the last 5 years
(with the exception of M1, EL3, EL4, T2, T5, PH2). The reason for this is the following:
usually companies that license-in are forced to do so in order to avoid infringement. Our
survey respondents are either companies with substantial patent portfolios or a few very
strong patents in their field, which means that they have something to offer in exchange
for the patents they need. Therefore, in case of infringement a number of our respondents
(H1, H2, H3, EL1, EL6, T2, T3, T4, T5, T6, T7, S1) prefer cross-licensing to licensing-
in.
7.1 Corporate values of licensing-in agreements
Avoiding infringement is not the only reason why companies license in patents. The
taxonomy in Figure 3 shows what value can be created from licensing-in agreements and
where this value resides.

15
Figure 3 Taxonomy of values derived from patents engaged in licensing-in agreements7
Market relationships
Non-market relationships
Systems & structures
Individual entities
1 (i) Assist in accelerating innovation and shortening time-to-market (ii) Help to gain access to complementary technology (iii) Help to avoid R&D in certain areas
2 (i) Help to build relationships useful for further collaboration (ii) Assist in entering a foreign market
3 (i) Increase cooperation between departments (ii) Assist in exchange of knowledge and expertise
4 (i) Strengthen existing network (ii) Create trust between the parties
7.1.1 Market relationships and individual entities (Box 1)
When discussing values created by patents engaged in licensing-in agreements,
respondents seem to support Schumpeterian view. In other words, accelerating
innovation processes and shortening time-to-market is one of the main reasons for
companies to license-in. This is very important for the energy respondents (EN1, EN3),
where innovation activity is very slow.
7 Based on the typology developed by Andersen and Striukova (2004)
16
Gaining access to additional technology is another reason why companies (especially
M2, EL3, EL5, EL7, T4, EN3) license-in. This point is especially important for
pharmaceuticals, where technology development is a costly and lengthy process.
Licensing-in gives companies rapid access to new technology, however it also makes the
company dependent on the licensor. The empirical findings are similar to Stuart’s (1999)
argument that patents make companies more prestigious and, thus, facilitate their access
to other companies’ technical resources.
Avoiding doing R&D in certain areas through licensing-in is not seen as a very important
factor by the majority of respondents. Machinery companies rank it high (one respondent
sees it as very important and two see it as important). This can be explained by the fact
that R&D in automobiles involves different domains (e.g. safety, design, speed);
moreover, car components are very different in nature (e.g. engine, window, wheel).
Therefore, it would be extremely difficult for a company to pursue research in all
possible directions.
7.1.2 Market relationships and systems and structures (Box 2)
The respondents see licensing-in agreements as not very useful for building relationships
for further collaboration, as they are usually a one-off event and are often forced by a
court decision (except H2). Our respondents also specified that licensing-in agreements
may provide assistance in entering foreign markets (H1, S3), with a minimum cost for a
licensor.
7.1.3 Non-market relationships and individual entities (Box 3) As for non-market relationships, respondents (H2, S3) noted that licensing-in agreements
may increase cooperation between departments because a successful licensing strategy
requires good and regular communication between the departments. Participants

17
emphasized that licensing agreements have evolved from straight contracts to
partnerships, where companies work closely together sharing knowledge and expertise.
This adds to the argument of Tsai and Ghoshal (1998) that trust and a shared vision can
affect this process positively. Basically, the higher the level of trust between individuals
or organizations, the more effective the transfer of knowledge and expertise.
7.1.4 Non-market relationships and systems and structure (Box 4)
Some respondents (H3, EL1, EL4, T6) noted that they use licensing-in agreement to
strengthen the existing network as close relationships imply a higher level of trust
between partners. The licensing-in agreements strengthen the network through the trust
they generate if successful. Academics see trust as a critical element of network relations
(Powell, 1990) and the respondents (H3, EL1, EL4, T6) confirm that successful
licensing-in agreements can increase the level of trust between partners and, therefore,
help to strengthen the existing network.
7.2 Risks of licensing-in agreements
The risk that licensing-in agreements discourage from further R&D is rated relatively low
by the majority of the respondents, except those from the energy sector which is
characterized by an a priori low level of R&D. What is more, being discouraged to
innovate because of the licensing-in agreement seems to be a problem mainly for
companies who invest only $1-10 million in R&D (PH3, S1, S2).
Similarly, respondents are only slightly concerned that when they participate in licensing-
in agreements the technology might become obsolete in a very short time, thus
diminishing the value of the products which are developed/manufactured as a result of
this agreement.
18
Nevertheless, the main risk for the majority of respondents is that patents might be less
useful than expected. Very often companies, especially at the late stage of product
development, have no time/resources to investigate patents and they are obliged to
license-in a patent that may finally add no or little value to the company. These
companies (H1, EL2) license in extensively in their area of research to avoid
infringement cases later. When discussing this risk, some of the respondents (T2, S3)
suggested that it could be minimized when a company is part of a network with trustful
relationships and constant information exchange.
Our respondents (H1, T2) were also concerned with the threat posed by greenmailers,
who very often force companies into licensing-in agreements, and who limit a company’s
freedom to operate. A few respondents (EL5, PH3) mentioned that it sometimes seems
like some of the prospective licensor’s patents could be invalidated, but it would be too
expensive to take these companies to court. Also, these respondents believe that by
licensing-in they become dependent on the licensor and become followers, rather than
market leaders, who set the industry standards. The fact that the company is not involved
in setting standards may even result in a high number of patents that this company has to
license in (EL5, EL6). Also, some respondents (H1, EL1) mentioned that one of the risks
may be the fact that the licensor might license-out the same patent to their competitors.
Some respondents (especially M2, H1, T5) emphasized that a company should only
license in a technology if it cannot develop this technology in-house or the costs of
development will be higher than the expected return.
8 Licensing-out
All our respondents reported that the number of their licensing-out agreements have
increased or not changed during the last five years. More companies are now starting to
recognize the value patents can bring to the company when they are licensed-out.
Moreover, companies realize that simply establishing a ‘no license’ policy is

19
meaningless, as their patents may already be infringed unknowingly by them and are
therefore ‘virtually licensed’ royalty-free. One of the respondents (S3) noted that even
when they want to stop using a patent for their main activity, they still keep this patent for
consequent licensing-out. Some companies (M1, EL5) are licensing-out in areas where
they do not compete directly. Several of our respondents have established divisions
dedicated to licensing-out.
8.1 Corporate values of licensing-out agreements
The taxonomy in Figure 4 below presents the values that can be created from involving
patents in cross-licensing agreements.

20
Figure 4 Taxonomy of values derived from patents engaged in licensing-out agreements8
Market relationships
Non-market relationships
Systems & structures
Individual entities
1 (i) Generate capital (ii) Add value to existing products (iii) Increase the scope of the patent
2 (i) Assist in setting standards (ii) Expand network of partners (iii) Capitalize the potential of foreign market
3 (i) Assist in cooperation between the departments (ii) Improve company’s reputation (iii) Assist in exchange of knowledge and expertise
4 (i) Strengthen existing network (ii) Create trust between the parties
8.1.4 Market relationships and individual entities (Box 1) First of all, the fact that licensing-out agreements help to generate capital makes this type
of agreements attractive to the majority of respondents except, perhaps, the energy
participants, where the number of licensing agreements is low, and therefore, the
licensing revenues are not that significant.
In addition, respondents noted that licensing-out agreements add value to existing
products. Pharmaceutical companies (one of which ranked this as very important and
three as important) usually want to concentrate on research activities and not on 8 Based on the typology developed by Andersen and Striukova (2004)

21
manufacturing and distributing the final product. Similarly, software companies prefer to
patent their ideas, rather then take part in further product development activities. It is
important to note here that companies with small patent portfolios (PH3, S2) believe that
licensing-out agreements may add value to their products by increasing their popularity.
Furthermore, electronics (EL1, EL2, EL3, EL4, EL5) hardware (H2, H3) and
telecommunications (T1, T2, T5, T6, T7) respondents see licensing-out agreements as a
means to increase the scope of patent usage.
8.1.2 Market relationships and systems and structures (Box 2)
Overall setting standards through licensing-out is ranked high. It is considered important
by electronics, hardware, software and telecom respondents (who all ranked it as either
very importanThe empirical study showed that in order to create this value, however,
patents should be governed appropriately.
Some of our respondents (EL4, T6) believe that licensing-out agreements are useful in
expanding their networks of partners. There is also a belief (H3, EL1) that licensing-out
agreements can help to capitalize on the potential of foreign markets. By licensing its
patents to other companies for production and distribution in different countries a licensor
can save on overhead costs and gain profit.
8.1.3 Non-market relationships and individual entities (Box 3)
As discussed previously in Section 7.1.3, there is an opinion (H2, S3) that licensing
agreements increase cooperation between departments.

22
The engagement of patents in licensing-in agreements is believed (PH2) to assist in
exchange of knowledge and expertise. Also, as licensed-out products/technologies get
validated in a ‘real world’ environment, it may improve a company’s reputation.
8.1.4 Non-market relationships and systems and structure (Box 4)
Respondents believe that similarly to licensing-in agreements (discussed in Section
7.1.4), licensing-out agreements can strengthen existing network (T7), and create trust
between parties (EL1).
8.2 Risks of licensing-out agreements
Overall, the obstacles for licensing-out have not increased over the last five years (with
the exception of EL4, T2). There are, however, certain risks associated with licensing-out
agreements.
Ensuring that the licensee has sufficient financial resources to develop or manufacture the
product is essential for the licensor and, therefore, licensors try to make sure that their
prospective licensees will be able to generate profit. Nevertheless, inability of licensee to
generate profit is regarded as low risk by our respondents.
Pharmaceutical respondents believe that by licensing-out patents to their competitors,
their company risks facing increased competition. Respondents from other industries, on
the other hand, emphasized that they are not in competition with their licensees. Some of
them believe that it is important to have a close relationship with licensees, for instance,
some companies visit their licensees (PH1, PH2), some organize meetings, seminars, etc.
(H3, EL1, EL4, T2). Respondents (M2, H2, T5) also pointed out that the demand for
technical support from their licensees has increased.

23
Most of the companies’ concerns were, however, about the fact that their reputation can
be damaged by the act of licensee. This is especially important in pharmaceuticals (PH2,
PH3) where licensees deal with life-and-death issues when developing new drugs.
Pharmaceutical respondents (PH1, PH3) mentioned that certain risks might arise when
they license out patents (usually from biotechnology firms) for further development
(normally at the stage of human trials). A few decades ago it was usual for
pharmaceutical companies to buy property rights when they needed certain patents. The
situation has changed as more companies have realized that patents can produce dynamic
value in addition to static value. This has resulted in the fact that patents are very often
not for sale and, therefore, pharmaceutical companies have to license them out. As the
majority of licensing contracts are not exclusive, licensors can license the same patents to
many companies at once, in other words, in theory they can license patents out to
companies that are in direct competition. The respondents (PH1, PH3), therefore,
mentioned that they acknowledge the risk of the same product being developed by them
and their competitors and, thus are very careful in selecting prospective licensors.
Usually, they try to license-out from companies with whom they already have a history of
previous relationships or companies they trust.
In addition, respondents pointed out that the creation of patent pools has significantly
decreased the value of patents engaged in licensing-out agreements (EL2, T6). It was also
mentioned that political concerns might be an obstacle to licensing-out (e.g. company A
cannot license to company B, because it has long-lasting relationship with company C,
who is a competitor of B and against this agreement). Another problem associated with
licensing-out, as reported by the respondents (EL6, S1), is the difficulty of deciding on
royalties.

24
9 Cross-licensing
Despite the growing number of companies who start to use their patents to generate
profits through licensing-out agreements, some of our respondents with large patent
portfolios do not use this type of patent governance (M1, H1, EL1, EL7, T1). The
licensing deals in these companies have a different character. The patent portfolios of
some companies are so large that when a new product is launched, there is a real risk that
there will be infringements of another company's patent(s). Even though issued patents
are public information, it may be impossible to check all of them. In cases of
infringement cross-licensing becomes a possible solution through which companies can
avoid litigation and get some value in return. Cross-licensing is also one of the
mechanisms used by firms to obtain design freedom when a patent thicket exists.
The number of patents that are cross-licensed can vary from two (one from each side) to a
complete patent portfolio which might include thousands of patents. Our respondents
(H3, EL1) mentioned that cross-licensing can take place in two forms. First of all it can
be an exchange of patents on a royalty-free basis. This type of agreements is used
when a patented technology is adopted as a standard. The condition here is that in order
to enter into a cross-licensing agreement without paying anything, companies have to be
roughly equal in the harm they could do to each other. Secondly, licensing agreements
can be an exchange of patents plus the use of balancing payments or, in other words,
monetary payments to even out the value of the portfolios being cross-licensed. These
balancing payments are often negotiated by the parties and are used to address a relative
imbalance in patent portfolio size or quality.
One form of cross-licensing which occurs often, as reported by respondents (EL3, T2), is
the portfolio cross license. A portfolio cross-license between two parties is the mutual
licensing of substantially all their patents worldwide to each other, to make, use and sell
certain products. The licensed products may include virtually all products or may be
restricted to certain products. The underlying rationale for portfolio cross-licensing is that
each of the parties has or may have multiple patents in multiple countries covering one or

25
more of the products of the other party. A single product may infringe multiple patents of
the other party in the country of manufacture, in each country into which that product is
imported or sold and resold through distribution, and finally in the country in which the
product is incorporated as part of another product or is otherwise used.
9.1 Corporate values of cross- licensing agreements
Companies with substantial patent portfolios have reported an increase in cross-licensing
activity for the last five years. The taxonomy (see Figure 5 below) shows what value can
be created from cross-licensing agreements and where this value resides.

26
Figure 5 Taxonomy of values derived from patents engaged in cross-licensing
agreements9
Market relationships
Non-market relationships
Systems & structures
Individual entities
1 (i) Reduce royalty slacking (ii) Reduce transaction costs (iii) Enhance company’s freedom
2 (i) Clear other companies blocking position (ii) Help to share technology (iii) Help to set standards (iv) Assist in coordinated launch of technology
3 (i) Generate new competences (ii) Create new opportunities by combining skills and resources
4 (i) Assist in building interpersonal trust (ii) Help to create general reciprocity (iii) Provide basis for further agreements
9.1.1 Market relationships and individual entities (Box 1)
Cross-licensing agreements are chosen for their ability to reduce royalty stacking by the
majority of respondents. Despite the fact that royalty rates are high in the pharmaceutical
market, a reduction of royalty stacking was not rated as important by pharmaceutical
participants (one company rated as not important and three as somewhat important). This
can be explained by the fact that in comparison with the amount of money spent on R&D,
royalty fees are minuscule.
9 Based on the typology developed by Andersen and Striukova (2004)

27
Reduction of transaction costs is considered to be another important advantage of cross-
licensing agreements by some respondents (H1, H3, EL5, T7). However, the respondents
who rated it as non-important noted that as there are only two parties involved, the
original transaction costs are not that high and, therefore, the amount of money
companies may save on transaction costs if they sign a cross-licensing agreement is
relatively low. The two above values created by patents used in cross-licensing
agreements can be linked back to the Williamson argument of economizing on
transaction cost.
A number of respondents (M2, EL1, T1) emphasized that the main reason they choose a
cross-licensing governance structure is because these agreements enhance a company’s
freedom to conduct business without fear of infringement and without the burden of
always expensive and often unpredictable litigation.
9.1.2 Market relationships and systems and structures (Box 2)
The ability of cross-licensing agreements to clear other companies blocking position is
ranked high by the majority of the respondents, especially those from pharmaceutical and
software industries. The high cost of R&D in pharmaceuticals means that it is extremely
important not to be blocked by competitors, especially at the final stage of product R&D.
As for the software market, software companies have thousands of competitors and,
therefore, it is vital for them to clear out the competition. Empirical results suggest that
the majority of respondents seem to have a similar view to that of Porter who argued that
positioning in an industry is the key asset for a company.
The fact that cross-licensing agreements help to share technology is relatively important
for our respondents, but especially for software participants, due to the fact that, unlike in
other industries, software patents do not have a lot of know-how embedded in them.

28
In addition, the majority of respondents, especially H1, EL1, EL6, T1, T3, T7, S3, S4,
find cross-licensing agreements useful in setting new standards. The exceptions here are
the pharmaceuticals participants (PH1, PH2, PH4), as standards are not important for
competition in the pharmaceutical industry. Apart from several respondents (M1, M3,
T3), companies do no think that cross-licensing agreements are very useful for the
coordinated launch of new products. Cross-licensing agreements are believed (M3) to
build strong relationships and trust, which in their turn, make it easier to agree on a
coordinated launch of new products.
.
9.1.3 Non-market relationships and individual entities (Box 3)
Companies participating in cross-licensing agreements believe that this type of patent
governance structure can stimulate the generation of competences. They argue that in
cross-licensing agreements there is a high level of know how and tacit knowledge
exchange. Similarly companies with just a few patents (T4, PH2) noted that they create
new opportunities by combining skills and resources in cross-licensing agreements. For
the majority of respondents this has only relative value. They explain it by the fact that
they use cross-licensing agreements as a means of avoiding litigation rather, than as a
way of discovering new opportunities.
9.1.4 Non-market relationships and systems and structure (Box 4)
A number of respondents believe that cross-licensing agreements can help to build
interpersonal trust. Good interpersonal relations result in shorter negotiations and
decrease the level of defection. Creating general reciprocity was ranked high by the
majority of respondents. The ability of cross-licensing agreements to provide a basis for
further agreements was also given some importance, as very often cross-licensing
agreements are forced by the court and, therefore, partners feel reluctant to cooperate.

29
9.2 Risks of cross-licensing agreements
The biggest risk (50% of respondents rated it as either very important or important),
according to our respondents is the fact that their relationships with other companies may
be affected. Most of our respondents (25 out of 31) are companies with substantial patent
portfolios (over 1000 patents), which implies a network of relations and a lot of existing
licensing agreements. The respondents note that they have to be extremely careful when
they enter a new agreement to ensure that these agreements do not hinder their existing
relationships with other third parties. However, the pharmaceutical respondents do not
consider this to be a big risk (rating it as either not important or somewhat important), as,
in comparison to companies from other industries pharmaceutical companies very rarely
have a large number of external relationships.
The risk that cross-licensing agreements might discourage investments to R&D because
of the facilitation of free-riding seems to be minimal to our respondents. In order to enter
a cross-licensing agreement a company should have patents and, therefore, should
continue to invest in R&D. Still, the electronics respondents (EL4, EL6, EL7) are slightly
worried (rated it as relatively important) about this fact, because they have a lot of
potential licensees and they can license the same patent to a number of different
licensees. Breach of contract by other parties is another risk associated with cross-
licensing agreements. However some companies (M1, H2, PH1) are trying to think of all
the different ways that their partners can breach contracts and prevent this from
happening.
Some participants (especially EL2, T1, T7) were concerned with the fact that some (and
sometimes the majority) of cross-licensed patents are still pending. One respondent (T7)
noted, in the case of pending patents, that the decision on whether to grant a patent or not,
of course, belongs to the Patent Office. Firms, however, have no choice but to trust other
parties’ ability to assess whether a patent has a high chance of being granted. Moreover,

30
they should trust that their partners will not include patents that a priori have low chances
of being granted.
10 Patent pools
The transaction cost problems that arise from the fact that some patents are overlapping
or that there are just too many patents covering the same product can be solved by
forming patent pools. Patent pools are used frequently in the electronics, hardware and
software industries because of the importance of standards and interoperability in these
industries. However, they can be important for other industries as well. Some respondents
(H1, EL4) believe that not all areas of technology can lead to the creation of patent pools,
but only those technologies that have a well-developed standard. Basically, if a patent
covers a feature required by the standard, then the patent is essential to the standard. In
one company’s opinion (EL4), the duration of the patent pool is likely to reflect the life
cycle of standards, which may overlap technology generations.
Some respondents (M1, EL2) report that a patent pool always has an administrator
appointed by the essential patent holders to handle administrative tasks such as signing
up licensees, collecting royalties from the licensees, and distributing the royalties to the
essential patent holders.
All our respondents reported that the number of patent pools they participate in has either
increased or not changed, the increasing number of patent pools was noted within
companies with substantial patent portfolios. Companies that do not participate in patent
pools are mostly European (3 out of 4)10.
The taxonomy below (Figure 6) shows what value can be created from patent pools and
where this value resides.
10 This excludes the energy sector, where neither of the companies participates in the patent pools.

31
Figure 6 Taxonomy of values derived from patents engaged in patent pools11
Market relationships
Non-market relationships
Systems & structures
Individual entities
1 (i) Reduce royalty stacking (ii) Reduce transaction costs (iii) Help to distribute risk
2 (i) Clear other companies blocking position (ii) Help to share technology (iii) Help to set standards (iv) Assist in coordinated launch of technology
3 (i) Create new opportunities by combining skills and resources (ii) Generate new competences
4 (i) Assist in building interpersonal trust (ii) Help to create general reciprocity (iii) Provide basis for further agreements
10.1 Corporate values of patent pools
10.1.1 Market relationships and individual entities (Box 1)
The fact that patent pools provide centralized management may help to solve the royalty
stacking problem which develops when multiple patents are needed for future innovation
and each patentee determines its royalty independently. The ability of patent pools to
reduce royalty stacking is considered to be an important benefit of patent pools by the
majority of our respondents. Companies from the machinery industry, however, ranked it
11 Based on the typology developed by Andersen and Striukova (2004)

32
as only somewhat important or relatively important. The reason for that, as suggested by
one of the respondents (M3), is that there are no patent pools covering just the machinery
sector and these companies join patent pools mainly to receive some additional profit.
Reduction of transaction costs is another important factor of patent pools named by our
respondents. First of all, patent pools can reduce or eliminate the need for litigation over
patent rights because such disputes can be easily settled, or avoided, through the creation
of a patent pool. A reduction of patent litigation cases would save businesses time and
money and also avoid the uncertainty of patent rights caused by litigation. As suggested
by one respondent (H3), the cost associated with negotiating one non-exclusive licence
for a basket of rights which is offered by a patent pool administrator to all comers at the
same (reasonable) price on the same terms, is much simpler and cost-effective than the
alternative of having each player engage in separate negotiations with different patentees
in order to collect the same basket of rights individually. In addition, obtaining a basket
of rights through a well-formed patent pool removes the costs and manages the risks
normally associated with the uncertainty of patent litigation and the time and effort
required to negotiate with multiple licensers.
The reduction of transaction costs is thought to be sometimes dependent on social capital
elements, such as trust and networking (M1, EL2).
The respondents (EL3, S4) noted that another benefit from patent pooling is the
distribution of risks. It was mentioned (EL3) that like an insurance policy, a patent pool
can provide an incentive for further innovation by enabling its members to share the risks
associated with R&D. What is more, it was observed (S4) that patent pools can increase
the likelihood that a company will recover some, if not all, of its investment in R&D.
10.1.2 Market relationships and systems and structures (Box 2)

33
Respondents noted, that similarly to cross-licensing agreements patent pools help to clear
off other companies blocking positions. It is one of the aims of patent pools to set new
standards, so it was not surprising to find that respondents rank this ability of patent
pools very highly.
Most respondents emphasized that patent pools are very useful for the sharing of
technology. Coordinated launch of new products has similar importance. From the
responses of the pharmaceutical companies we can see that these two factors are less
appreciated by companies from this sector.
10.1.3 Non-market relationships and individual entities (Box 3)
Our respondents think that patent pools are very important for creating new opportunities
by combining skills and resources. M1 and S3, who ranked this factor as very important
noted that there are no machinery-only patent pools and just a few on software.
Therefore, participating in a patent pool means exchanging knowledge and experience
with companies from other industries and, thus, makes it easier to find new opportunities
for development.
Similarly, the ability of patent pools to generate competences was ranked high by our
respondents. Some of them (M2, EL1) believe that it is only through the multi-party
exchange of knowledge and competences, that new competences can be generated. In
general, pool agreements are thought to be more useful than licensing-out agreements for
creating new opportunities and generating competences.
10.1.4 Non-market relationships and systems and structure (Box 4)

34
Building interpersonal trust is once again valued in patent pools more than in cross-
licensing agreements. Respondents (EL2, T4) note that relationships in patent pool
agreements are much more complicated for the simple reason that there are more parties
involved. It is true that patent pools help to cut down transaction costs. On the other hand,
if there is a lack of interpersonal trust in a pool it might become quite costly for its
members to check on each other’s past and reputation.
Similarly to cross-licensing agreements patent pools are believed (especially EL3, EL6)
to create general reciprocity. This is mostly relevant for electronics respondents, as the
majority of patent pools have mostly electronic companies as their members. Most of the
respondents think that patent pools provide a basis for further agreements. They noted
that due to the nature of patent pools which implies several companies participating, it is
very likely that a company will continue its relationship with at least one other member
of the patent pool.
10.2 Risks and of patent pools Including substitute/irrelevant patents may lead to lower royalties is the biggest problem
for all companies. In one respondent’s opinion (H2) these patents can be kept out of the
pool by hiring an independent technical expert who evaluates all potential patents to
ensure that the pool is properly maintained. Moreover, the royalty sharing mechanism can
be structured to discourage patentees from loading nonessential or bogus patents into the
pool. Respondents (H2, EL3) pointed out that there is a risk of the patent pool being
declared illegal, if antitrust enforcers determine that nonessential patents are in this pool.
Survey participants think that this fact should also encourage members to contribute
proper patents.
Defection of other members/partners is rated as relatively important. Electronics
respondents, especially those who ranked it as very important, are concerned about this
issue, as they have the most experience of patent pools and, therefore, more experience of
patent pool members defecting.

35
Discouraging investments in R&D because of facilitation of free-riding also raises some
concerns among the respondents. These results suggest, that despite the existing
concerns, patent pools will not discourage further R&D as, in the future, they will still
need patents in order to participate in new agreements. The concerns that patent pools
might in some way discourage investment in R&D are much higher than those for cross-
licensing agreements.
11 Summary
We will now summarize what value factors companies believe to be the most important
in different governance structures (Table 2).
Table 2 Benefits of patent governance structures
Benefits Governance structure
Accelerating innovation processes and shorten time to-market LI Gaining access to (sharing) complementary technology LI /PP Avoiding doing R&D in certain areas Building relationships that leads to further collaboration Generating capital LO Adding value to existing products Setting standards LO/ CL/ PP Increasing the scope of the patent Increasing bargaining power CO Creating barriers to entry for others Clearance of other companies blocking one’s position CL/ PP Reduction of royalty stacking CL/ PP Reduction of transaction costs PP Coordinated launch of new technologies PP Creating new opportunities by combining skills and experience PP Generating new competences PP Building interpersonal trust Creating general reciprocity CL/ PP Providing a basis for further agreements PP
N.B. CO – co-ownership, LI – licensing-in, LO – licensing-out, CL – cross-licensing, PP – patent pool

36
Table 2 is based on the empirical data. We chose values that were ranked by more than
50% of our respondents as very important or important. In the following we discuss how
we used the empirical data and its analysis to create a table summarizing the benefits in
different governance structures (seen by respondents).
First of all, it is important to mention that co-owned patents are normally the result of
joint R&D or a lawsuit and, therefore, do not provide the patentee with many more
additional benefits than a regular patent. Such benefits, however, can be only realized
when the co-owned patent is used in another governance structure (licensing-in,
licensing-out, cross-licensing or patent pools).
From Table 2 one can notice that the majority (out of 28) of companies see the value of
licensing-in agreements in their ability to gain access to complementary technology (21%
rated it as very important and an additional 68% as important) and to accelerate the
innovation process and shorten time-to-market (29% thought this was very important and
an additional 57% that it was important).
Licensing-out agreements are primarily used (results of 29 companies) to generate
revenue and to set standards (66% rated both reasons as very important or important,
including 28% of respondents who thought that licensing-out plays a very important role
in generating capital and 21% of respondents who supported the view that this type of
agreements is very important for setting standards.
Cross-licensing agreements are primarily valued for clearing of other companies blocking
one’s position (50% of respondents consider them very important and 36% as important).
They are also often used to reduce royalty stacking (61% of respondents rated this ability
of cross-licensing agreements as very important or important, 36% of whom saw it as
very important). Cross-licensing agreements are also believed to be extremely useful in
setting new standards (75% think that these agreements play a very important or
important role in setting standards, 29% of whom think that this role is very important).
37
Finally, this type of governance structures is seen as useful to generate non-market value
by creating general reciprocity (64% ranked it as important).
The reasons for creating patent pools (24 respondents) are similar to those for creating
cross-licensing agreements. Setting new standards is one of the major reasons (71% of
respondents rated it as very important or important, with 33% of respondents rating it as
very important). Other principle reasons include clearing of other companies blocking
position (79% see this as very important or important of whom 29% of respondents
ranked it as important), reduction of royalty stacking (83% of respondents see it as very
important or important) and reduction of transaction cost (71% ranked it as either very
important or important). In addition to these values created by patent pools, respondents
pointed out the role of the patent pool in the sharing of technology (79% rated it as very
important or important) and the coordinated launch of technology (75% rated it as very
important or important). As for the non-market values they include: creating new
opportunities by combining skills and resources (83% rated it as very important or
important), providing a basis for further agreements (67% rated it as very important or
important) and generating new competences (54% rated it as very important or
important).
Overall, it seems that the main objective companies have in mind when governing their
patents is setting standards. Four other important reasons are the ability to gain/share
complementary technology, to reduce royalty stacking, to clear other companies blocking
position and to create general reciprocity.
We will now summarize the risks companies associate with different governance
structures (Table 3 below).

38
Table 3 Risks of patent governance structures
Risks Governance Structures
Breach of agreement12 CO Absence of a common European and/or international law Being discouraged from R&D Technology becoming obsolete in a very short time Patent being less useful than expected LI Inability of licensees to generate profit Increased competition from licensees Reputation being damaged by the act of a licensee LO Relationships with other companies might be affected CL Including substitute/irrelevant patents may lead to lower royalties
PP
N.B. CO – co-ownership, LI – licensing-in, LO – licensing-out, CL – cross-licensing, PP –
patent pool
The table above presents the biggest risks a company can face when choosing one of the
governance structures. In co-ownership, risks are generally considered by respondents
(26 companies) as quite low, however, some of these risks raise more concerns than the
others. Breach of contract is considered to be the major risk in co-ownership. It includes
selling or licensing-out the patent without the concern of the other party (16% of
respondents with co-ownership agreements rated this risk as important or relatively
important and 50% said that this risk was somewhat important; overall 66% of
respondents gave some importance to this risk). Breach of contract also includes the
exposure of the patent of one of the owners before the patenting process is finalized. Our
results show that 12% of the respondents who are engaged in co-ownership agreements
believe this risk to be relatively important, and 69% – somewhat important, with a total
of 81% of respondents being concerned about this risk.
In licensing-in agreements (28 companies) the greatest risk is thought to be the fact that
the patent might be less useful than expected (68% ranked it as very important or
important). When licensing-out (29 companies), companies worry mostly about the fact
12 Includes: a) Selling or licensing-out the patent by the other party without one’s knowledge.
b) Exposure of the patent by the other owner before the patenting process is finalized. c) Defection of other members/partners.

39
that their reputation may be damaged by an act of the licensee (72% or respondents
consider this risk as important or relatively important).
Companies that sign cross-licensing agreements (28 respondents) emphasize that by
signing an agreement they often risk putting their relationship with a third party in
danger (rated by 50% of respondents as very important or important). The main concern
of companies entering patent pool agreements (24 respondents) is that irrelevant patents
might be included in a pool (54% of respondents rated it as an important risk). The fact
that some members are trying to include substitute or irrelevant patents, could be seen as
a defection of a kind.
It may be concluded that companies worry mostly about other companies’ patents being
irrelevant or less useful than expected. The respondents are also concerned about their
reputations or relationships with other companies being damaged as a result of their
engagement in some governance structures.
Finally, we noticed that hardware, electronics and telecom companies face very similar
risks from different patent governance structures. There are only some minor differences
in the way that software companies assess patent governance structures.
12 Limitations
As our results only concern companies who participate in all five governance
structures (or in same cases participating in four and planning to join the fifth
governance structure), they mainly represent companies with a developed and
elaborate strategy and are not necessarily representative of all the companies that have
patents. Therefore our results are mostly indicative, and with respect to firm size or
industry, we can only comment on industry ‘trends’ rather than statistical results. A
much large survey would be needed for this.

40
13 Conclusion
Our analysis showed that non-market value embedded in patents is becoming more
important for companies when they use their patents in cooperative governance
structures. In addition, we empirically confirmed that there is a relationship between the
governance structures companies choose and the type of value they seek. Our analysis
has also shown that the choice of patent governance structures is based on the objectives
of the company in terms of value creation.
We will therefore build upon previous studies of patent value by looking at patent value
in a more systematic way. Previous studies on value creation from patents have been
isolated and narrow – discussing only one or a few patent values, what is more these
studies were mainly market focused. We, on the other hand, have developed a broader
framework (based upon market and non-market relationships and based upon patent
value embedded in individual entities or in systems and structures) to classify the value
embedded in patents and to investigate how this value is realized.

41
Bibliography Andersen, B., & Striukova, L. 2004. Intangible Assets and Intellectual Capital: Where
Value Resides in the Modern Enterprise: Birkbeck College working paper 04/02. Carpenter, M.; Narin, F., and Woolf, P. 1981. Citation Rates to Technologically Important Patents. World Patent Information, 3(4): 160-63. Davis, L. 2004. Intellectual Property Rights, Strategy and Policy. Economics of
Innovation and New Technology, 13(5): 399–415. Gallini, N. 1992. Patent Policy and Costly Imitation. RAND Journal of Economics, 23:
52-63. Gilbert, R., & Shapiro, C. 1990. Optimal Patent Length and Breadth. RAND Journal of
Economics, 21: 106-112. Green, J., & Scotchmer, S. 1995. On the Division of Profit in Sequential Innovation.
RAND Journal of Economics, 26: 20-33. Harhoff, D., Narin, F., Scherer, F., & Vopel, K. 1999. Citation Frequency and the Value
of Patented Innovation. Review of Economics and Statistics, 81(3): 511-515. Klemperer, P. 1990. How Broad Should the Scope of Patent Protection Be? RAND
Journal of Economics, 21(1): 113-130. Lanjouw, J., Pakes, A., & Putnam, J. 1998. How to Count Patents and Value Intellectual
Property: Uses of Patent Renewal and Application Data. The Journal of Industrial Economics, 46 (4): 405-433.
Lanjouw, J., & Schankerman, M. 2001. Characteristics of Patent Litigation: A Window on Competition. RAND Journal of Economics, 32(1): 129-151.
Lerner, J. 1994. The Importance of Patent Scope: An Empirical Analysis. RAND Journal of Economics, 25: 319-333.
Matutes, C., Regibeau, P., & Rockett, K. 1996. Optimal Patent Design and the Diffusion of Innovations. RAND Journal of Economics, 27(1): 60-83.
Nordhaus, W. 1967. The Optimal Life of a Patent: Cowles Foundation Discussion Paper, New Haven, Cowles Foundation for Research in Economics.
Powell, W. 1990. Neither Markets nor Hierarchy: Network Forms of Organization. Research in Organizational Behavior (12): 295-336.
Singh, D., & Schwab, R. 2000. Predicting Turnover and Retention in Nursing Home Administrators. The Gerontologist, 40: 310-319.
Tsai, W., & Ghoshal, S. 1998. Social Capital and Value Creation: The Role of Intrafirm Networks. Academy of Management Journal, 41(4): 464-476.


![[DiMe] w04 curves nsurfaces](https://static.fdocuments.us/doc/165x107/5592da3e1a28abfa3b8b456f/dime-w04-curves-nsurfaces.jpg)

