DIK-DIK (Madoqua guntheri) UNDER DIFFERENT … Mara University, Narok, Kenya. Dr. Adam T. Ford....
90
FORAGING PREFERENCES FOR IMPALA (Aepyceros melampus) and DIK-DIK (Madoqua guntheri) UNDER DIFFERENT LEVELS OF PERCEIVED RISK IN A SAVANNAH ECOSYSTEM. By TOBIAS O. OTIENO MSc. 2016
Transcript of DIK-DIK (Madoqua guntheri) UNDER DIFFERENT … Mara University, Narok, Kenya. Dr. Adam T. Ford....
FORAGING PREFERENCES FOR IMPALA (Aepyceros melampus) and
DIK-DIK (Madoqua guntheri) UNDER DIFFERENT LEVELS OF
PERCEIVED RISK IN A SAVANNAH ECOSYSTEM.
By
TOBIAS O. OTIENO
MSc.
2016

ii
FORAGING PREFERENCES FOR IMPALA (Aepyceros melampus) and
DIK-DIK (Madoqua guntheri) UNDER DIFFERENT LEVELS OF
PERCEIVED RISK IN A SAVANNAH ECOSYSTEM.
Tobias O. Otieno
BSc, MSc
A Thesis Submitted In Partial Fulfilment of The Requirements For The Degree Of Masters Of
Science, Wildlife Management In
Department of Natural Resources, Karatina University.
2016
iii
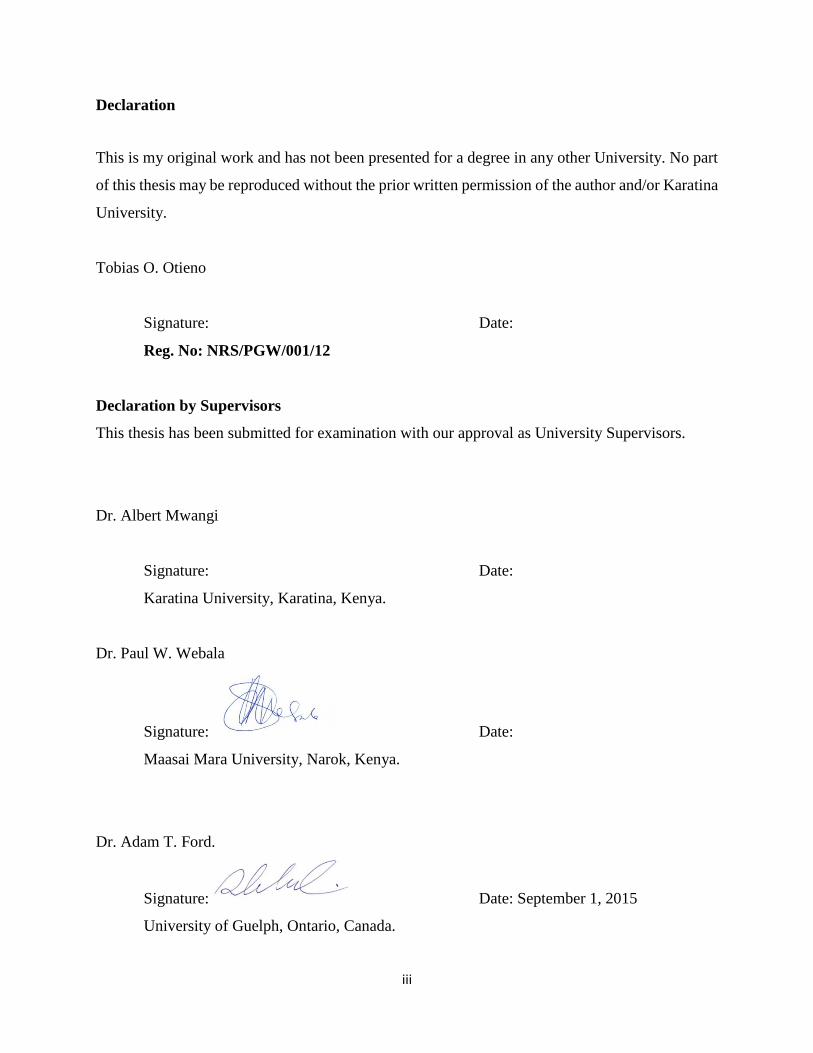
Declaration
This is my original work and has not been presented for a degree in any other University. No part
of this thesis may be reproduced without the prior written permission of the author and/or Karatina
University.
Tobias O. Otieno
Signature: Date:
Reg. No: NRS/PGW/001/12
Declaration by Supervisors
This thesis has been submitted for examination with our approval as University Supervisors.
Dr. Albert Mwangi
Signature: Date:
Karatina University, Karatina, Kenya.
Dr. Paul W. Webala
Signature: Date:
Maasai Mara University, Narok, Kenya.
Dr. Adam T. Ford.
Signature: Date: September 1, 2015
University of Guelph, Ontario, Canada.

iv
Dedication
To my girls: Angela, Neville and Lisa.

v
Abstract
Ecosystems are composed of heterogeneous landscapes characterized by different levels of forage
availability, habitats and predation risk. Ewaso ecosystem in Laikipia, Kenya is such landscape
and is composed of human-made glades within acacia bushland. Abundant and diverse community
of large (> 5 kg) mammalian herbivores (LMH) and carnivores occur within this landscape.
Whereas smaller-bodied LMH face greater predation and must forage on higher quality forage,
larger-bodied LMH are more constrained by quantity rather than food quality or predation. Plants
have anti-herbivory strategies such as chemical and mechanical defences. In response to risk and
dietary limitations LMH exhibit a range of foraging behaviours in different habitats. This study
was conducted between December 2012 and July 2014 at Mpala Research Centre and it looked
into how predation risk coupled with plant defences, shape the foraging preference of impala and
dik-dik using a modified giving up density (GUD) experiment with A. brevispica, A. etbaica,
Croton dichogamus and Grewia bicolor as forage species. Random pairwise branch cuttings from
the forage plants were placed in front of camera trap in the glades and the corresponding nearby
bushlands. A total of 20 random sites and 10 trials per pairwise combination were used. Leaf
biomass density was estimated before and after exposure to LMH. Foraging events from camera
trap images and leaf biomass density remaining and removed were used to quantify forage
preference and plant defence efficacy. Linear mixed effects models were used to test for the effect
of habitat type on the forage preference and plant defence efficacy. Results show that impala were
more selective in risky habitat and preferred the thorn-less Grewia bicolor and the less-
mechanically defended A. brevispica. Dik-dik preferred the thorny and highly mechanically
defended A. etbaica even in the risky habitats. Well defended plants, mechanically (e.g A. etbaica)
or chemically (e.g Croton dichogamus), were safer from herbivory than less defended plants. For
herbivores, risk of predation is more important than forage preference while for plants, defences
are more important than habitat type. The study illustrated the important role pastoralists play in
influencing the spatial variability in LMH diet choice and foraging behaviour within savannah
ecosystem.
Keywords: Large Mammalian Herbivore (LMH), Predation Risk, Mechanical defences,
Chemical defences, Giving Up Density (GUD), Foraging preference. Impala, Dik-
dik.
vi
Table of Contents
Declaration ................................................................................................................................. iii
Dedication .................................................................................................................................. iv
Abstract ....................................................................................................................................... v
Table of Contents ....................................................................................................................... vi
List of Tables .............................................................................................................................. x
List of Figures ............................................................................................................................ xi
List of Plates ............................................................................................................................. xii
List of Appendices ................................................................................................................... xiii
Abbreviations and Acronyms .................................................................................................. xiv
Acknowledgements ................................................................................................................... xv
Chapter 1 : Introduction .................................................................................................................. 1
1.1 Background ........................................................................................................................... 1
1.2 Rationale for the Study ......................................................................................................... 4
1.3 Problem Statement ................................................................................................................ 5
1.4 Main Objective...................................................................................................................... 5
1.4.1 Specific Objectives ........................................................................................................ 6

vii
1.5 Study Hypotheses.................................................................................................................. 6
Chapter 2 : Literature Review ......................................................................................................... 9
2.1 Ewaso Ecosystem.................................................................................................................. 9
2.2 Formation of Glades and Landscape Heterogeneity ............................................................. 9
2.3 Optimal Foraging Theories ................................................................................................. 11
2.4 Predation Risk and Foraging Behaviour ............................................................................. 11
2.5 Role of Plant Defences in Foraging Preference .................................................................. 13
2.6 Gaps in Predation Risk Mediated Foraging Behaviour Studies.......................................... 15
Chapter 3 : Methodology .............................................................................................................. 17
3.1 Study Area .......................................................................................................................... 17
3.2 Study Species ...................................................................................................................... 19
3.2.1 Impala Aepyceros melampus........................................................................................ 19
3.2.2 Guenther’s dik-dik Madoqua guntheri ........................................................................ 19
3.2.3 Forage Species ............................................................................................................. 21
3.3 Field Experiment Setup....................................................................................................... 22
3.4 Measureable variables ......................................................................................................... 25
3.4.1 Site Variables ............................................................................................................... 26

viii
3.4.2 Plant Variables ............................................................................................................. 26
3.4.3 Animal Variables ......................................................................................................... 27
3.5 Data Analysis ...................................................................................................................... 27
Chapter 4 : Results ........................................................................................................................ 29
4.1 Visibility in the Glades and Bushland ................................................................................ 29
4.2 Foraging Events from Camera traps ................................................................................... 29
4.2.1 Impala Foraging Preference as Determined by Foraging Events ................................ 30
4.2.2 Dik-dik Foraging Preference as Determined by Foraging Events ............................... 31
4.2.3 Comparing Foraging Events of Impala and Dik-dik.................................................... 32
4.3. Foraging Preference as Determined by Leaf Biomass Density Removed ......................... 34
4.3.1 Impala Foraging Preference from Leaf Biomass Density Removed ........................... 34
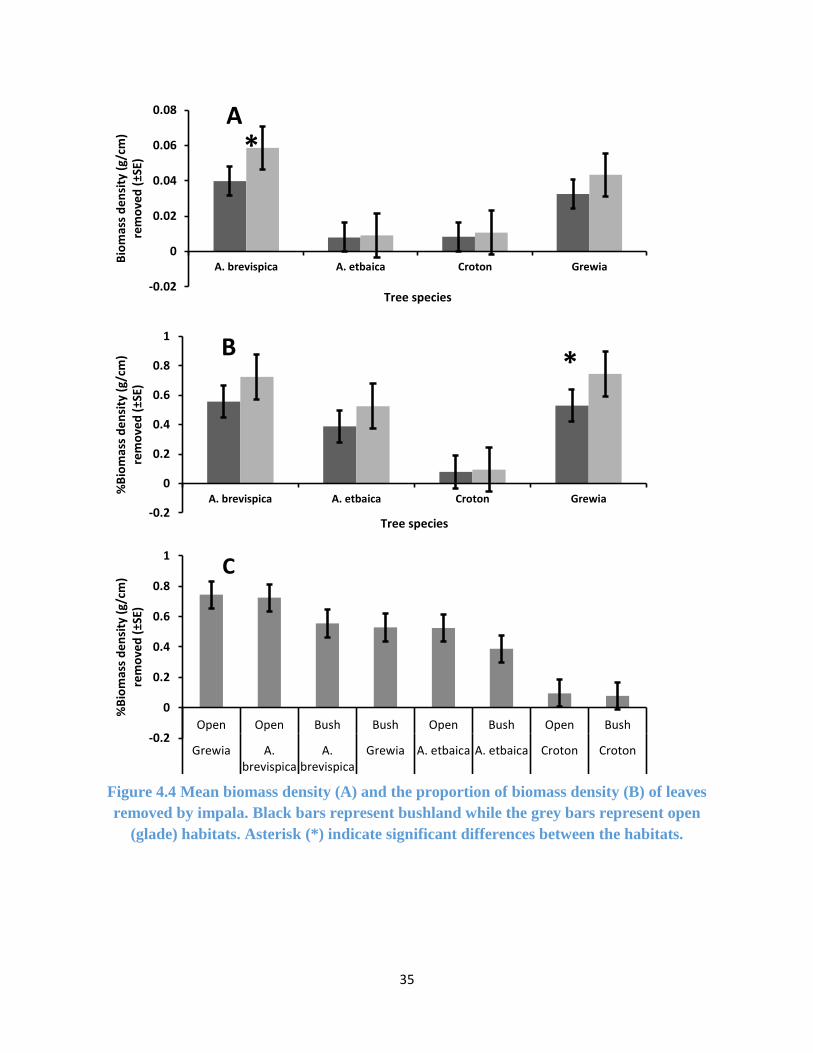
4.3.2 Dik-dik Foraging Preference from Leaf Biomass Density Removed .......................... 36
4.3.3 Leaf Biomass Density Removed by both Impala and Dik-dik .................................... 38
4.4 Efficacy of Plant Defences .................................................................................................. 40
4.4.1 Efficacy of Plant Defences against Herbivory by Impala ............................................ 40
4.4.2 Efficacy of Plant Defences against Herbivory by Dik-dik .......................................... 41
4.4.2 Efficacy of Plant Defences against Herbivory by Impala and Dik-dik ....................... 42

ix
Chapter 5 : Discussion .................................................................................................................. 44
5.1 Discussion ........................................................................................................................... 44
5.1.1 Foraging Preference ..................................................................................................... 44
5.1.2 Efficacy of Plant Defences against Herbivory by Impala and Dik-dik ....................... 47
Chapter 6 : Conclusion and Recommendation .............................................................................. 49
6.1 Conclusion .......................................................................................................................... 49
6.2 Implication to Ecology and Management ........................................................................... 49
6.2 Study Limitation and Recommendations ............................................................................ 51
References ..................................................................................................................................... 53
Appendices .................................................................................................................................... 68

x
List of Tables
Table 2.1 Average dry weight of leaves ........................................ Error! Bookmark not defined.
Table 3.2 Total tannin content for Grewia spp, Croton spp and A. brevispica.Error! Bookmark
not defined.
Table 4.1 Post hoc multiple comparison of foraging events using Tukey HSD. .......................... 33
xi
List of Figures
Figure 3.1 Map of Mpala Research Centre. .................................................................................. 18
Figure 4.1 Combined foraging events for impala and dik-dik. ..................................................... 30
Figure 4.2 Foraging events for impala .......................................................................................... 31
Figure 4.3 Foraging events for dik-dik . ....................................................................................... 32
Figure 4.4 Biomass density of leaves removed by impala............................................................ 35
Figure 4.5 Biomass density of leaves removed by dik-dik.. ......................................................... 37
Figure 4.6 Biomass density of leaves removed by impala and dik-dik.. ...................................... 39
Figure 4.7 Proportion of biomass density of leaves remaining for impala ................................... 41
Figure 4.8 Proportion of biomass density of leaves remaining for dik-dik .................................. 42
Figure 4.9 Proportion of biomass density remaining for impala and dik-dik. .............................. 43
xii
List of Plates
Plate 3.1 Focal herbivore species . ............................................................................................... 20
Plate 3.2 Focal forage species. . ................................................................................................... 22
Plate 3.3 Photos of the experimental setup . ................................................................................ 25

xiii
List of Appendices
Appendix 1. Average Leaf Weight for the Forage Tree Species . ............................................... 68
Appendix 2. Average Visibility in Bush and glades .................................................................... 69
Appendix 3. Summary of Foraging Events for Impala and Dik-dik. ........................................... 70
Appendix 4. Summary Statistics for Biomass Density removed by Impala and Dik-dik ............ 71
Appendix 5. Summary Statistic for % Biomass Density removed by Impala and Dik-dik. ........ 72
Appendix 6. Summary Statistics for Biomass Density of Leaves Remaining ............................. 73
Appendix 7. Summary Statistics for % Biomass Density of Leaves Remaining ........................ 74
xiv
Abbreviations, Acronyms and Definitions
A. brevispica Acacia brevispica.
A. etbaica Acacia etbaica.
ANOVA Analysis of variance.
C3 Carbon 3 forbs.
ca Approximate
Croton Croton dichogamus
Foraging events Total number of images recorded by camera traps for impala and
dik-dik foraging on each of the forage plants.
Glade Open tree-less patches within Acacia bushland derived from
abandoned livestock bomas.
Grewia Grewia bicolor
GUD Giving Up Density.
HSD Honestly Significant Figures.
Larger-bodied LMH LMH weighing about 50 kg (e.g impala)
LMH Large Mammalian Herbivores. These are mammalian herbivores
weighing from 5 kg and above.
LOF Landscape Of Fear.
MRC Mpala Research Centre.
MSc. Master of Science.
Smaller-bodied LMH LMH weighing about 5 kg (e.g dik-dik).
Spp. Species.

xv
Acknowledgements
First and foremost, my heartfelt gratitude goes to Dr. Adam T. Ford for introducing me to Mpala
Research Centre (MRC) and for recommending for me for the Levinson-STRI scholarship that
was offered through MRC under the mentorship of Dr. Jacob Goheen. Adam was very invaluable
from the onset in conceptualizing this research and continued to be so throughout. He was, and
still is, not only my mentor and colleague, but also a friend. This work would have not been
possible if it was not for his continued support. I am very grateful.
My sincere deepest gratitude also goes to Dr. Jacob Goheen for letting me be part of his UHURU
research team, for helping me get into graduate school and for his unwavering support as my co-
advisor, and as my boss. I admire his passion for what he does. He has moulded me, and continues
to do so, to become a better me in this field. I will forever be thankful to him.
I am also very grateful to Dr. Paul Webala for making sure I had every help I needed and for his
invaluable advice and support towards this work. His unwavering support and encouragement was
not only limited to academics but also on career development and life in general. I will forever be
indebted to him.
I cannot forget to thank Simon Lima for helping me in carrying out the field activities. He was
always with me from setting up the experiment to making sure everything was working okay. I
greatly appreciate his help. On the same note, I would also like to extend my gratitude to everyone
in UHURU project team at MRC.
I am very thankful to the former director of MRC, Dr. Margaret Kinnaird, for giving me the
opportunity to be part of MRC student-researchers team, for the internship and for the scholarship
that enabled me to pursue my graduate studies. My gratitude also goes to the entire MRC fraternity
for housing, feeding and providing enabling environment to carry out this work.

xvi
Great appreciation for financial support from Levinson-STRI scholarship, Dr. Jacob Goheen lab,
American Society of Mammalogist, University of Wyoming and IDEA WILD for making this
study possible.
Finally I give utmost thanks to my family, for their love, patience, and for being there for me every
step of the way. Especially, my special thanks goes to Angela for supporting me physically,
emotionally and financially throughout the process, and for Neville and Lisa for always making
me smile.
And thanks be to God.

1
Chapter 1 : Introduction
1.1 Background
Terrestrial ecosystems are composed of patches that vary in food availability, habitat type, and
predation risk (Brown et al., 1979; McNaughton, 1979; Belovsky, 1981). This heterogeneity
shapes the diversity and distribution of organisms (Druce et al., 2009; Willems & Hill, 2009)
because of the manner in which species partition different resources through their behaviour,
movement patterns, and foraging preferences (Kartzinel et al., 2015). Foraging theory posits that
organisms will maximize energy intake while minimizing predation risk (Emlen, 1966; MacArthur
& Pianka, 1966; Charnov, 1976; Brown, 1988, 1992). These models predict that a forager will stop
depleting a patch when the benefits of harvest no longer exceed the sum of energetic, predation,
and forgone opportunity costs of foraging (Brown & Mitchell, 1989; Brown, 1998, 1992; Makin
et al., 2012). For example, animals are predicted to spend more time foraging when predation risk
is relatively low and when forage quality is relatively high (Moorcraft et al., 2006). Thus, risk
avoidance and energetic gain is a common trade-off faced by many organisms.
For ungulates, one of the key factors affecting predation risk is body size (Berger & Cunningham,
1988; Sinclair et al., 2003; Radloff & du Toit, 2004). Smaller-bodied species are more vulnerable
to predation (Sinclair et al., 2003) and typically use cryptic anti-predator strategies, as opposed to
larger species, which are more vulnerable to starvation and use early detection and evasion
strategies to reduce risk (Jarman, 1974; Brashares et al., 2000). These risk-forage trade-offs
provide insight as to how diverse assemblages of Large (>5 kg) Mammalian Herbivores (LMH)
coexist in East African savannahs (Ritchie & Olff, 1999).
While the risk of predation and resource abundance are commonly used gradients to assess forage-
risk trade-offs in LMH, few studies have examined the role of plant defence. Plants have developed

2
several strategies to minimize loss of biomass to herbivores, such as chemical and mechanical (i.e.
physical) defences like spines and thorns (du Toit, 2003; Borchard et al., 2011). Plant defences
either reduce the consumption rates or reduce the ability of herbivores to digest material once
consumed (Belovsky et al., 1991; Robbins, 1993).
Condensed tannins (a form of chemical defence) act as repellents to LMH by giving plants an
undesirable, astringent taste (Harborne, 1991; Bryant et al., 1992) or by reducing availability of
protein and other nutrients (Robbins et al., 1987) through protecting plant cell walls from being
degraded in the rumen of LMH and inactivating digestive enzymes (Cooper & Owen-Smith, 1985).
In other words, LMH can consume plants with high densities of tannins, but their ability to ferment
and acquire nutrients from such material is inhibited.
Mechanical defences are thought to reduce intake rates of plant biomass (Cooper & Owen-Smith,
1986; Belovsky et al., 1991; Gowda 1996), but have little effect on digestibility once consumed.
Together, both mechanical and chemical defences limit resource availability for LMH and thus
may serve as a key axis of niche differentiation among different-sized LMH.
Among LMH, larger-bodied (herein 40 – 50 kg: e.g impala) species are better able to digest coarse
and more toxic plant material than smaller-bodied (5 - 10 kg: e.g dik-dik) species, which require
higher densities of nutrients in their food but less total plant material (Underwood, 1982; Ritchie
& Olff, 1999; Borchard et al., 2011). Thus, chemical defences are likely more effective at deterring
herbivory from smaller-bodied LMH species than larger-bodied ones. Many of the most apparent
mechanical defences in African savannahs are thorns and spines on woody vegetation, especially
those of the genus Acacia. Smaller-bodied LMH, such as dik-dik, have nimble mouthparts that
enable them to manoeuvre around the spines and thorns of Acacia. Thus, mechanical defences are

3
probably better able to deter herbivory from larger-bodied LMH than smaller-bodied species. The
very largest, or ‘mega-herbivores’ (e.g., elephants and giraffes), have generally escaped both
predation and plant defences (Sinclair et al., 2003).
Throughout savannahs in Laikipia, small patches of grass-dominated open areas (herein referred
to as glades) of 0.2 – 1 ha occur within the acacia bushland and woodland communities (Young et
al., 1995; Augustine et al., 2011). Glades are derived from abandoned livestock bomas, which are
temporary livestock enclosures, and may persist for decades after they have been abandoned
(Young et al., 1995; Augustine, 2003). These glades contain nutrient enriched soil, and support a
unique plant community dominated primarily by stoloniferous grass Cynodon plectostachyus
(Young et al., 1995; Augustine, 2003).
The glades are used by grazing and mixed-feeding LMH, likely to access the nutrient-rich grasses
(Augustine, 2004) and or access to safety (Ford et al., 2014) due to the increased visibility (Riginos
& Grace, 2008). For example, glades are heavily used by impala in the dry season when grasses
are dry and impala are foraging on bushes (Augustine, 2010; Augustine et al., 2011). Many African
LMH select for visibility because it enhances the detection and evasion of predators (Underwood,
1982; Hopcraft et al., 2005; Riginos & Grace, 2008; Anderson et al., 2010; Valeix et al., 2011);
however, this is not true for smaller-bodied LMH like dik-dik, who perceive open areas as risky
(Jarman, 1974; but see Ford & Goheen, 2015). Recent work is pointing to the role of visibility in
shaping the distribution and habitat utilization by larger-bodied LMH like the impala (Riginos &
Grace, 2008; Ford et al., 2014; Riginos, 2015). Visibility in glades is about double than that found
in the surrounding bushland, just 100 m away from the glade edge (Ford et al., 2014).
4
The purpose of this study, therefore, was to use an experimental approach to determine the extent
to which risk of predation, plant defence, and LMH body size interact to shape foraging behaviour
and the impact of herbivory on trees, via two sympatric browsers: the 5 kg dik-dik and the 50 kg
impala.
1.2 Rationale for the Study
With the growing utilization of domestic browsers (camels, goats) for human livelihoods,
understanding the foraging preferences of wild browsers is essential for the stewardship of natural
landscapes. Decades of developing the science and cultural practices of coexistence between
livestock and wildlife have largely focused on cattle-grazer interactions (Odadi et al., 2011a; Odadi
et al., 2011b; Augustine, 2003). However, throughout Laikipia County, Kenya, foraging
preferences by browsers is largely unknown, despite browsers making up the majority of wildlife
in this area (O’Brien & Kinnaird, 2011). Because wild browsers can affect the abundance and
distribution of forage (Ford et al., 2014), it is important that we better understand how risk of
predation changes the forage preference of wildlife. This information would be critical to
developing sound land management practices that ensure the coexistence of wildlife populations
and human livelihoods.
In addition to shifting range management practices, ecosystems in many areas may transform
under climate change (Sala et al., 2000). Climate change is predicted to have major adverse effects
in arid and semi-arid landscapes, such as Laikipia, with increases in shrub encroachment (i.e. the
increase in woody plant cover) into formerly open and grassy areas (Archer et al., 1995; Jörg &
Jeltsch, 2004). Shrub encroachment has adverse effects on the cattle carrying capacity (Jeltsch et
al., 1997; Roques et al., 2001) and biodiversity (Meik et al., 2002). Given that impala avoid bushy
areas to lower the risk of predation (Underwood, 1982; Estes et al., 1999; Hopcraft et al., 2005;

5
Riginos & Grace, 2008; Anderson et al., 2010; Valeix et al., 2011; Ford et al., 2014), and dik-dik
avoid open areas (Jarman, 1974; Ford & Goheen, 2015), bush encroachment is likely to affect the
diet selection and foraging behaviour of these LMH. In order to develop sound management
practices, it is therefore paramount to understand what forage species these LMH feed on and
where, in terms of predation risk.
1.3 Problem Statement
Although the link between predation risk and habitat use by terrestrial LMH has been well
established (Lima & Dill, 1990; Lima 1998; Brown et al., 1999; Laundré et al., 2001; Verdolin
2006; Ford et al., 2014; Ford & Goheen, 2015), there is paucity (if not lacking altogether) of studies
that have focused solely into how plant defences (mechanical or chemical) interplay with predation
risk in influencing foraging behaviour of sympatric LMH with varying body size and in habitats
varying in levels of predation risk. This study used a modified GUD to determine the extent to
which plant defences interact with predation risk to influence the foraging behaviour of impala
and dik-dik in a heterogeneous savannah landscape.
1.4 Main Objective
The objective of this study was to determine the foraging preference of two LMH species under
different levels of perceived risk. The focus was on impala Aepyceros melampus (ca. 50 kg), and
Guenther’s dik-dik Madoqua guenther, (ca. 5 kg), and their consumption of four species of trees:
Acacia brevispica, A. etbaica, Grewia spp and Croton dichogamus. These tree species are the most
abundant at Mpala Research Centre (Young et al., 1995) and exhibit different levels of plant
defences against herbivory.

6
1.4.1 Specific Objectives
The following were the specific objectives of the study.
1. To determine if forage preference for impala and dik-dik changes with habitat types
varying in predation risk.
2. To determine if impala and dik-dik prefer the same forage species.
3. To determine if forage preferences are driven by plant defences.
4. To determine the efficacy of plant defences against herbivory by impala and dik-dik.
1.5 Study Hypotheses
Under this study the following hypotheses were tested:
A.) Palatability-Driven Foraging: Plant defences drive foraging preferences for both LMH
equally, such that the preferred forage species would be the same for both LMH irrespective of
body size or level of risk. The prediction was that Grewia bicolor and A. brevispica would be
preferred to A. etbaica and Croton dichogamus. A. etbaica is highly mechanically defended
(presence of long and short thorns) whereas Croton dichogamus is highly chemically defended
(high tannin content) (Hemayet et al., 2012).
B.) Accessibility-Driven Foraging: Mechanical plant defences drive foraging preferences for
both LMH, such that the preferred forage would be the most poorly-defended mechanically
irrespective of LMH identity. Because A. etbaica is better defended mechanically (with both long
spines and short curved spines) than A. brevispica (with only short less curved spines), whereas
Grewia bicolor and Croton dichogamus do not have any thorns or spines to deter accessibility, it
was predicted that A. etbaica would be least preferred by both LMH.

7
C.) Risk-Sensitive Foraging: The preferred forage species would depend on whether the LMH
encounters the plant in a safe or risky area. In safe areas, LMH would prefer mechanically defended
plants because they can afford to spend the time required to access leaves among spiny defences.
In risky areas, LMH would prefer chemically defended plants because they are trading off
acquisition time (intake) with handling time (digestion). In this case, digestion may occur while
engaging in more vigilant behaviour or in a safer habitat. The prediction was that in high risk areas
the LMH would prefer the thorn-less Croton dichogamus and Grewia bicolor while in low risk
areas they would prefer the thorny A. etbaica and A. brevispica.
However, differences in allometric scaling of gut capacities, metabolic rate, and predation rates
modified the above hypotheses in the following manner:
I.) Palatability-Driven Foraging: With faster rates of digestion, larger-bodied LMH can more
easily overcome chemical defences, require greater intake per day, and are less selective than
smaller-bodied LMH. Therefore, the effect of plant defence on foraging preference should be
stronger for smaller-bodied LMH species than larger-bodied ones. It was predicted that the
magnitude of selection for Grewia bicolor and A. brevispica relative to A. etbaica and Croton
dichogamus would be greater for dik-dik than impala.
II.) Accessibility-Driven Foraging: With their smaller mouthparts, smaller-bodied LMH are
better equipped to avoid mechanical defence than larger-bodied LMH. Therefore, preference for
plants with different amounts of mechanical defence should be greater for larger-bodied species.
Under this hypothesis, it was predicted that the magnitude of selection for A. brevispica over A.
etbaica would be greater for impala than dik-dik.
8
III.) Risk-Sensitive Foraging: Smaller-bodied LMH experience more risk than larger ones, and
tend to use denser vegetation under riskier conditions. Larger-bodied LMH tend to use open areas
to minimize risk. Here, it was predicted that dik-dik would spend more time foraging in bush and
impala would spend more time foraging in open areas. Likewise, dik-dik would be more selective
than impala in open areas where they perceive greater risk and require more return per unit time.
Conversely, impala would be more selective than dik-dik in bushy areas where they perceive
greater risk.

9
Chapter 2 : Literature Review
2.1 Ewaso Ecosystem
Georgiadis (2011) defined Ewaso ecosystem by the geographical extents of two large-scale
processes; the dry-season river flow and the elephant migration. Two major water-towers, the
Aberdare Range and Mt. Kenya, collect much of the regions’ rainfall and are drained mainly by
two permanent rivers: the Ewaso Nyiro and Ewaso Narok, which flow into the Lorian Swamp
(Georgiadis, 2011). The functional ecosystem “boundary” of Ewaso ecosystem encompasses the
upper drainage basin of the Ewaso Nyiro and Ewaso Narok rivers and covers about 40,000 km2
within Laikipia County and parts of adjacent Samburu, Meru, Isiolo, and Marsabit Counties
(Georgiadis, 2011). There is abundant wildlife in this region and they mostly occur in the
southwestern section of the region, on private ranches in Laikipia County (Georgiadis, 2011).
Ewaso ecosystem is a human-wildlife occupied landscape with abundant native ungulate
populations occurring on rangelands outside formally protected areas alongside livestock
(Georgiadis, 2011). Wildlife in this system share most of the landscape with varying densities of
people and livestock and only about 6% of the total land area has protection status (Georgiadis,
2011). This livestock-wildlife co-existence is very critical for the conservation of wildlife in this
region (Prins et al., 2000). Previous studies have shown that these interactions are important to
both the livestock and wild ungulates and can either be negative (competition) or positive
(facilitation) (Augustine et al., 2011; Odadi et al., 2011a; Prins et al., 2000).
2.2 Formation of Glades and Landscape Heterogeneity
Predators, apart from influencing the behaviour of LMH (Laundre et al., 2001), can also indirectly
influence the pastoralist’s livestock husbandry practices (Augustine, 2003; Augustine, 2004). The

10
presence of complete assemblage of carnivore species within Ewaso ecosystem landscape
(O’Brien & Kinnaird, 2011; Woodroffe, 2011), over the centuries has warranted the need for the
pastoralists to find ways of protecting their livestock from depredation and one such way is through
corralling their livestock at night in bomas made from thorny Acacia trees. These bomas are
temporary structures which are usually abandoned when the pastoralists relocate to new locations
in search of greener pastures (Young et al., 1995; Augustine, 2003). The bomas are traditionally
made by clearing bushland and using thorny Acacia trees as fence to keep off the predators. Over
time, this husbandry practice has led to proliferation of small patches of tree-less, grass-dominated
open areas of 0.2 – 1 ha occurring within the Acacia bushland and these are generally referred to
as glades (Young et al., 1995; Augustine et al., 2011). These glades contain nutrient enriched soil,
and support a unique plant community dominated primarily by the stoloniferous grass Cynodon
plectostachyus (Young et al., 1995; Augustine 2003). Within Mpala Research Centre (MRC) these
glades occur at a density of between 0·71 km-2 and of 1·21 km-2 for over decades and none has
ever reverted to bushland (Augustine, 2003).
These glades form a mosaic of open patches within the Acacia bushland providing a heterogeneous
landscape. Landscape heterogeneity, in terms of vegetation distribution and predation risk, can
significantly influence the local distribution and abundance, and the foraging behaviour of wild
herbivores (Young et al., 1995; Laundre et al., 2001; Seargent et al., 2007; Riginos & Grace, 2008;
Ford et al., 2014; Ford & Goheen, 2015). In terrestrial savannah ecosystems, variation in LMH
body size and the dietary tolerance, has been shown to results in varying diet and habitat selectivity
across LMH species (du Toit & Owen-Smith, 1989). This together with the functional differences
between grazing and browsing guilds (Prins & Douglas-Hamilton, 1990; Fritz et al., 2002)
contributes to the high heterogeneity of the landscapes in this ecosystem (du Toit, 2003).
11
2.3 Optimal Foraging Theories
LMH, due to the predation risk posed by the presence of carnivores are known to exist in a
‘‘Landscape of Fear’’ (LOF) (Laundre et al., 2001; Brown & Kotler, 2004) and they must often
trade-off between avoiding predators and maximizing the quality and or quantity of their forage
intake (Sih, 1980; Lima, 1998; Houston et al., 1993). The nature of this trade-off is dependent on
herbivores’ perceived degree of predation risk (Brown & Kotler, 2004).
Foraging theories (Emlen, 1966; MacArthur & Pianka, 1966; Charnov, 1976; Brown, 1988, 1992)
posits that LMH will always seek to maximize energy intake while minimizing predation risk and
are predicted to match their resources when predation risk is low and to trade off food for safety
by avoiding dangerous habitats when risk is high (Power, 1984a, 1984b; Abrahams & Dill, 1989;
van Baalen & Sabelis, 1993). These models predict that animals will spend more time foraging in
a given habitat when the predation risk is lower and when forage quality is high and will spend
less time foraging when predation risk is high and forage quality is low (Moorcraft, et al., 2006).
They do so by either reducing the time spent foraging and or increasing their level of vigilance
while foraging in riskier habitats (Sih, 1980; Lima & Dill, 1990; Kotler et al., 1994; Brown, et al.
1999). LMH rely heavily on behavioural responses (e.g vigilance) to nonlethal predation risk
(Brown et al., 1999) and various studies have supported this for a variety of LMH species
(Underwood, 1982; Lagory, 1986; Scheel, 1993; Bednekoff & Ritter, 1994; Molvar & Bowyer,
1994; Ford & Goheen, 2015).
2.4 Predation Risk and Foraging Behaviour
LOF is as a result of the risk of predation and it is the way in which prey perceive differing habitats
having differing levels of predation risk within a landscape (Laundre et al., 2001). It quantifies
how LMH avoid predation risks in space (Laundre et al., 2001) and has been used to understand

12
how animals behave in terrestrial (Brown et al., 1999; Kotler et al., 2002; Brown & Kotler, 2004,
Ford & Goheen, 2015) and marine ecosystems (Wirsing et al., 2008). In such a landscape, LMH
must often trade-off between avoiding predators and maximizing the quality and or quantity of
their forage intake (Sih, 1980; Houston et al., 1993; Lima, 1998).
Predation risk has been known to do directly or indirectly affect physiology (Sheriff et al., 2009)
and behaviour of animals (Lima & Dill, 1990; Ford et al., 2014; Ford & Goheen, 2015). This
implies that animals adjust their use of space to their perception of the distribution of predation
risk (Lima & Dill, 1990; Brown & Kotler, 2004; Cresswell, 2008). It is important to note that LOF
for different LMH species is never uniform and one of the key factors affecting predation risk in
LMH is the body size (Berger & Cunningham, 1988; Sinclair et al., 2003; Radloff & du Toit,
2004). Smaller-bodied LHM species are more vulnerable to predation (Sinclair et al., 2003) and
typically use cryptic anti-predator strategies, as opposed to larger-bodied LMH species, which are
more vulnerable to starvation and use early detection and evasion strategies to reduce risk (Jarman
1974; Brashares et al., 2000). These risk-forage trade-offs provide insight as to how diverse
assemblages of LMH coexist in East African savannahs (Ritchie & Olff, 1999).
Carnivores predating on herbivorous animals can have a cascading effect on plant populations by
either altering herbivore density through direct consumption, or indirectly through mediating prey
forage behaviour, or both (Rosenzweig, 1973; Oksanen et al., 1981; Abrams, 1996). The presence
of predators in itself represents a risk of predation to herbivores that can mediate predator–plant
interactions by altering herbivore prey foraging behaviour (Abrams, 1996; Ford et al., 2004; Ford
& Goheen, 2015) and this can lead to marked changes in plant biomass, distribution, and diversity
(Crawley, 1983). Thus, predators affect plants indirectly by altering spatial patterns of LMH
herbivory (Abrams 1995; Schmitz 2003, Schmitz et al., 2004, Ford et al., 2014).

13
2.5 Role of Plant Defences in Foraging Preference
Plants over centuries of evolution have developed several counter measure strategies to minimize
loss of plant material to LMH. These strategies include mechanical (i.e physical) defence such as
thorns and spines (Myers & Bazeley, 1991), chemical defence e.g tannin content (McNaughton &
Tarrants, 1983; du Toit et al., 1990; Bryant et al., 1992; Ward et al., 1997), growth strategies (for
instance, growing too tall for the leaves to be eaten, Milewski et al.,, 1991; Palo et al., 1993), and
low nutrient content (Lundberg & Astrom, 1990). Plant defences act by either reducing the
consumption rates or by reducing the ability of herbivores to digest material once ingested
(Belovsky et al., 1991; Robbins, 1993).
Mechanical defences, generally act by reducing the rates at which plant materials can be ingested
by herbivores (Belovsky & Schmitz, 1994; Cooper & Owen-Smith, 1986; Belovsky et al., 1991;
Gowda, 1996). Thorns and spines require herbivores to manoeuvre before harvesting so that the
thorns or spines do not "prick" the forager (Belovsky & Schmitz, 1994) thus mechanical defences
modify the feeding-time constraint and therefore thorny plants should take longer, on average, to
harvest than the thorn-less plants (Cooper & Owen-Smith, 1986). The condition required for the
thorns to be an effective mechanical defence is that the nutrient content per unit of digestive
constraint utilized must be greater for the defended plant (Belovsky & Schmitz, 1994). However,
mechanical defences cannot be attributed with universal efficacy, rather, efficacy depends upon
the context of body mass of LMH and the attributes of other plants available to the herbivore in
the immediate environment (Belovsky & Schmitz, 1994).
Condensed tannins, as a form of chemical defence, on the other hand, act as repellents to LMH by
giving plants an undesirable, astringent taste (Harborne, 1991; Bryant et al., 1992) or by reducing

14
availability of protein and other nutrients (Robbins et al., 1987) through protecting plant cell walls
from being degraded in the rumen of LMH and inactivating digestive enzymes (Cooper & Owen-
Smith, 1985). For any plant chemical to be a successful defence it must attain a threshold of
digestion-inhibition before it reduces consumption and any further ability to reduce digestion does
not reduce consumption any further (Belovsky & Schmitz, 1994). However, the effects of the
chemical are not always so apparent and higher quantity of the chemical does not always lead to
reduced consumption (Belovsky & Schmitz, 1994).
The effect of tannin as a chemical defence is dependent on the type of tannin consumed, its
chemical structure and molecular weight, the amount ingested, and the animal species involved
(Behmer et al., 2002; Frutos et al., 2004). High concentrations of tannins reduce voluntary feed
intake and nutrient digestibility, whereas low to moderate concentrations may improve the
digestive utilisation of feed mainly due to a reduction in protein degradation in the rumen and a
subsequent increase in amino acid flow to the small intestine (Barry et al., 1986; Frutos et al.,
2004).
Investing in defences are costly for plants and come at the expense of growth and reproduction
(Briggs & Schultz, 1990; Palo et al., 1993). Due to the costs of defence, plants investing in
mechanical defences have been associated with low densities of chemical defences (Moles et al.,
2013; Ward & Young, 2002).
Larger-bodied LMH species, like impala, are known to require higher densities of nutrients in their
food but less total plant material and due to their large gut capacity are able to digest coarse and
more toxic plant materials (Underwood, 1982; Ritchie & Olff 1999; Borchard et al., 2011).
Smaller-bodied LMH (e.g dik-dik), on the other hand, with their nimble mouth parts are able to
15
navigate around the thorns more effectively than the impalas and thus chemical defences are likely
more effective at deterring herbivory from smaller-bodied LMH species than larger-bodied
species. The very largest, or ‘mega-herbivores’ (e.g., elephants and giraffes), have generally
escaped both predation and plant defences (Sinclair et al., 2003). Together, both mechanical and
chemical defences limit resource availability for LMH and thus may serve as a key axis of niche
differentiation among different-sized LMH.
2.6 Gaps in Predation Risk Mediated Foraging Behaviour Studies
Several studies have described the effects of habitat types and predation risk on foraging behaviour
for a number of taxa including deer Odocoileus spp (Altendorf et al., 2001; Lingle, 2002), caribou
Rangifer tarandus (Whittington et al., 2011), guanaco Lama guanicoe (Marino & Baldi, 2008),
antelope (Jarman, 1974; Underwood, 1982; Sinclair & Arcese, 1995; Valeix et al., 2009; Ford et
al., 2014), elk (Fortin et al., 2005; Kuijper et al., 2013), Nubian ibex Capra nubiana (Iribaren &
Kotler, 2012), and moose Alces alce (Berger, 2007; Gervasi et al., 2013). Though there are a few
studies that have focussed on the role of predation risk in mediating behavioural change in smaller-
bodied LMH like dik-dik (e.g Ford & Goheen, 2015), most have solely focused on larger (> 40
kg) and gregarious species that typically alter group size in response to predation risk (Dehn, 1990;
Fortin & Fortin, 2009; Taraborelli et al., 2014), avoid risky areas (Kuijper et al., 2013; Ford et al.,
2014), and often increase use of open habitats to facilitate detection of predators (Anderson et al.,
2010; Ford et al., 2014). This emphasis on larger-bodied LMH species does not represent the
diversity of life-history traits among LMH.
From the available body of work, it has also emerged that the response of herbivores to predation
risk is not homogenous across LMH but is rather specific to species (Ford & Goheen, 2015).
Sympatric species of prey may respond to risk in different ways, even when hunted by the same
16
predator species (Lingle, 2002; Periquet et al., 2012; Gervasi et al., 2013). This would therefore
mean that LMH functional traits such as body size, sociality, feeding style, would influence how
different LMH behave in habitats varying in predation risk (Ford & Goheen, 2015). Due to this
species specific response to predation risk, several studies on different LMH species with varying
traits across different systems are needed (Ford & Goheen, 2015) before a predictive theory can
be fully developed (Creel, 2011).
While the link between predation risk and habitat use by terrestrial herbivores has been well
established (Lima & Dill, 1990; Lima 1998; Brown et al., 1999; Laundré et al., 2001; Verdolin,
2006), there is no much studies presently known that have looked into how plant defences
(mechanical or chemical) interplay with predation risk in influencing foraging behaviour of
sympatric LMH with varying body size.

17
Chapter 3 : Methodology
3.1 Study Area
The study was conducted between December 2012 and July 2014 at Mpala Research Centre
(MRC) in Laikipia County, Kenya (0° 17’ N, 37° 53’ E) at 1600 - 1800 m above sea level (Figure
3.1). The research centre and the associated Mpala Ranch comprises ca. 190 km2 of semi-arid
savannah where people, livestock and wildlife coexist, thereby offering opportunity to use
ecological insights to inform land management (Odadi et al., 2011a; Ford et al., 2014). Rainfall
averages 508 mm per annum and is weakly trimodal, with a major peak in April-May, and minor
peak in August, and October-November (Augustine, 2010).
Two major soil types underlie MRC. Poorly-drained volcanic vertisols (i.e., ‘black-cotton’ soil)
underlie ca. 10% of MRC, and support a plant community dominated by the tree Acacia
drepanolobium and a continuous understory that includes the grasses, Agrostis spp, Lintonia
nutans, and Themada triandra, and the forbs Aerva lanata, Commelina spp, Dyschoriste radicans,
Indogofera spp. and Rhinacanthis ndorensis (Young et al., 1995; Young et al., 1998). The
remaining red, sandy loam soils exhibit a higher diversity of woody species, including Acacia
brevispica, A. etbaica, A. mellifera, Croton dichogamus and Grewia bicolor with a discontinuous
understory dominated by the grasses Cynodon dactylon, Digitaria milanjiana, Pennisetum
mezianum, and P. stramineum (Augustine & McNaughton, 2004).
Across MRC, abandoned livestock corrals (‘bomas’) persist as treeless, nutrient-rich lawns
(‘glades’) that are embedded within a background of Acacia-dominated bushland (99% of the
landscape) (Young et al., 1995).

18
Figure 3.1 Map of Mpala Research Centre and associated Mpala conservancy.
The native herbivore biomass density at MRC stands at ca. 5,282 kg per km2 of which the most
abundant are elephant (Loxodonta africana) at 2,882 kg per km2, impala (Aepyceros melampus) at
813 kg per km2, and dik-dik (Madoqua guentheri) at 693 kg per km2 - making over 80% of the
total wild herbivores biomass at the study area (Augustine, 2010). Other herbivores found in this
area include: zebra (Equus burchellii), giraffe (Giraffa camelopardalis), waterbuck (Kobus
ellipsiprymnus), buffalo (Syncerus caffer), eland (Taurotragus oryx), and scrub hares (Lepus
saxatilis) (Augustine, 2010).
Native large (> 20 kg) predators occurring in this area include African wild dog (Lycaon pictus),
lion (Panthera leo), leopard (P. pardus), spotted hyena (Crocuta crocuta), and striped hyena

19
(Hyaena hyaena) (Woodroffe, 2011; Ford et al., 2014; Ford & Goheen, 2015). They occur at a
combined density of ca. 35 individuals per 100 km2 (Ford et al., 2014).
3.2 Study Species
3.2.1 Impala Aepyceros melampus (Lichtenstein, 1812)
Impala are a medium-sized African antelope, ranging between 75 and 95 cm at the shoulder and
weighing between 40 and 60 kg (Plate 3.1a). Impala are water-dependent and occur along ecotones
associated with light woodlands and savannahs in Kenya, Tanzania, Swaziland, Mozambique,
northern Namibia, Botswana, Zambia, Zimbabwe, southern Angola, north-eastern South Africa,
and Uganda. Impala are almost wholly grazers during the rains and during the dry season they are
mostly in the woodlands, browsing on shrubs, herbs, pods, and seeds (Kingdon, 1997). They are
the most dominant ungulate (over 50% of biomass) among the MRC resident herbivores and occur
at biomass densities of 813 kg per km2 (Augustine, 2002).
3.2.2 Guenther’s dik-dik Madoqua guntheri (Günther, 1894)
Dik-dik (Plate 3.1b) are a small monogamous and territorial antelope in the genus Madoqua that
live in the bushland of eastern and southern Africa and are specialized in feeding on C3 (non-grass
plants) forbs and trees (Kingdon, 1997; Cerling et al., 2003; Manser & Brotherton, 1995). They
stand at about 30–40 cm at the shoulder, are 50–70 cm long, weigh 3–6 kg and can live for up to
10 years (Kingdon, 1997). Dik-dik are numerous at MRC. They are the third most abundant after
elephant and impala and occur at density of 693 kg per km2 (Augustine, 2010).
20
(a)
(b)
Plate 3.1 Focal herbivore species in this study. (a) Impala Aepyceros melampus and (b) Dik-
dik Madoqua guntheri.
21
3.2.3 Forage Species
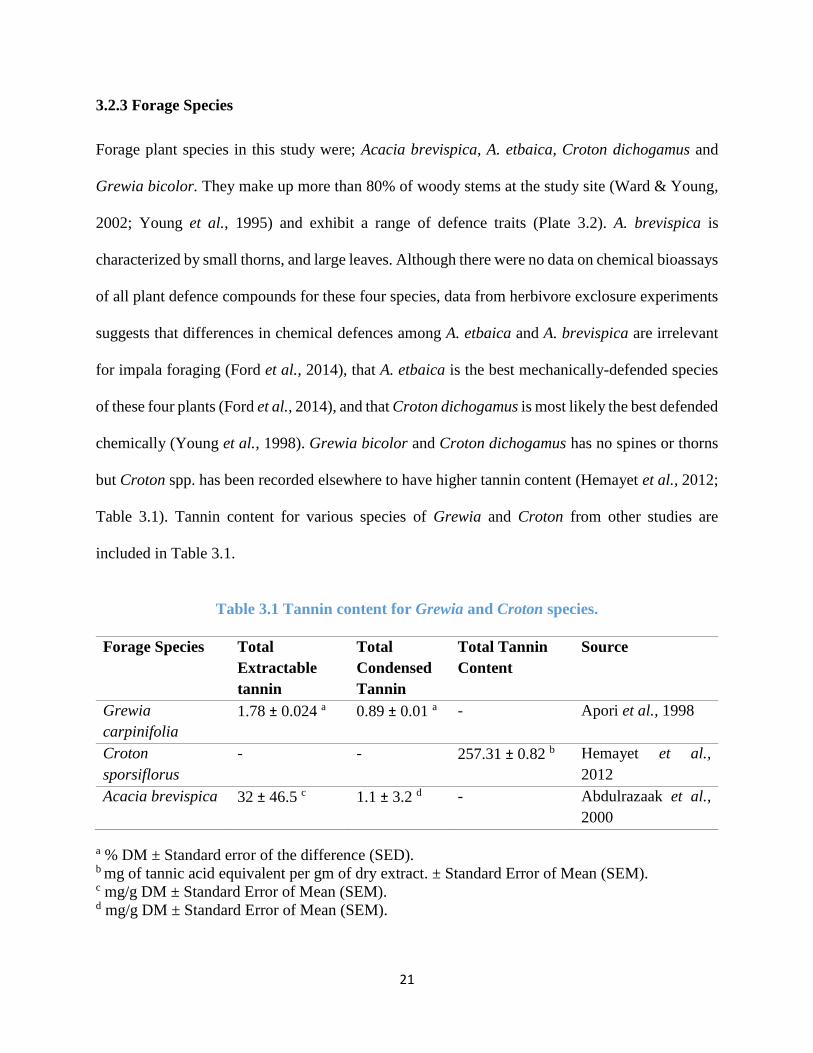
Forage plant species in this study were; Acacia brevispica, A. etbaica, Croton dichogamus and
Grewia bicolor. They make up more than 80% of woody stems at the study site (Ward & Young,
2002; Young et al., 1995) and exhibit a range of defence traits (Plate 3.2). A. brevispica is
characterized by small thorns, and large leaves. Although there were no data on chemical bioassays
of all plant defence compounds for these four species, data from herbivore exclosure experiments
suggests that differences in chemical defences among A. etbaica and A. brevispica are irrelevant
for impala foraging (Ford et al., 2014), that A. etbaica is the best mechanically-defended species
of these four plants (Ford et al., 2014), and that Croton dichogamus is most likely the best defended
chemically (Young et al., 1998). Grewia bicolor and Croton dichogamus has no spines or thorns
but Croton spp. has been recorded elsewhere to have higher tannin content (Hemayet et al., 2012;
Table 3.1). Tannin content for various species of Grewia and Croton from other studies are
included in Table 3.1.
Table 3.1 Tannin content for Grewia and Croton species.
Forage Species Total
Extractable
tannin
Total
Condensed
Tannin
Total Tannin
Content
Source
Grewia
carpinifolia
1.78 ± 0.024 a 0.89 ± 0.01 a - Apori et al., 1998
Croton
sporsiflorus
- - 257.31 ± 0.82 b Hemayet et al.,
2012
Acacia brevispica 32 ± 46.5 c 1.1 ± 3.2 d - Abdulrazaak et al.,
2000
a % DM ± Standard error of the difference (SED). b mg of tannic acid equivalent per gm of dry extract. ± Standard Error of Mean (SEM). c mg/g DM ± Standard Error of Mean (SEM). d mg/g DM ± Standard Error of Mean (SEM).
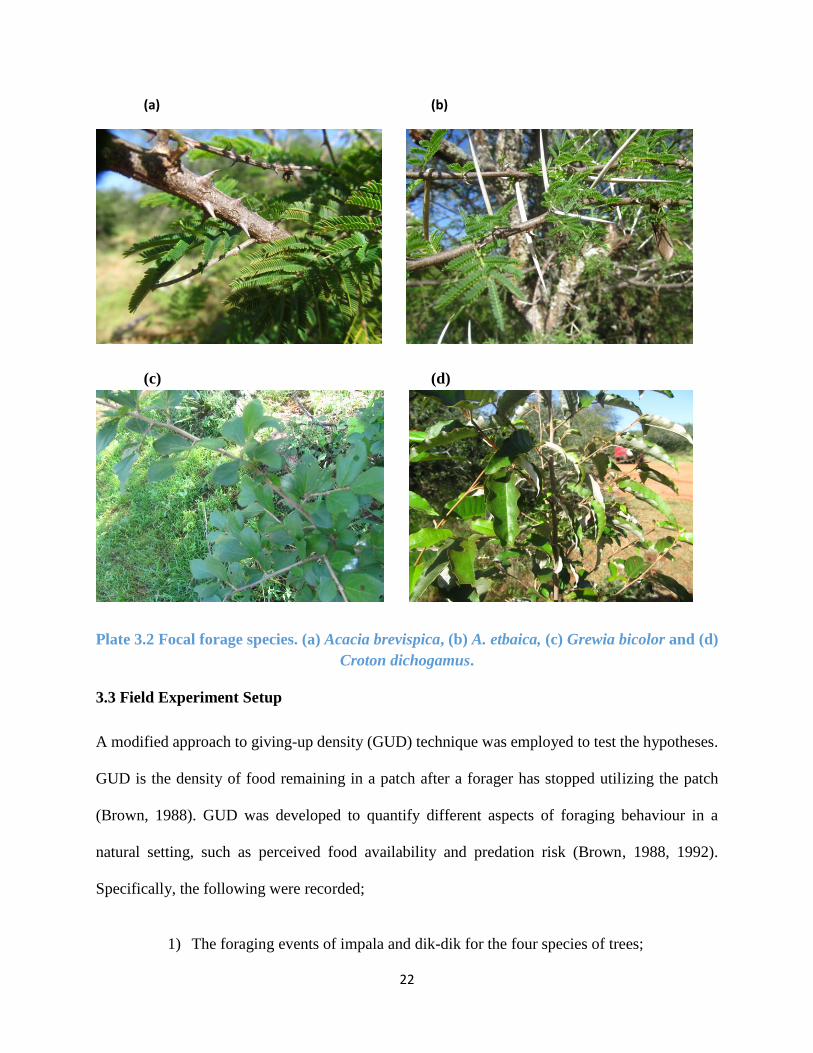
22
(a) (b)
(c) (d)
Plate 3.2 Focal forage species. (a) Acacia brevispica, (b) A. etbaica, (c) Grewia bicolor and (d)
Croton dichogamus.
3.3 Field Experiment Setup
A modified approach to giving-up density (GUD) technique was employed to test the hypotheses.
GUD is the density of food remaining in a patch after a forager has stopped utilizing the patch
(Brown, 1988). GUD was developed to quantify different aspects of foraging behaviour in a
natural setting, such as perceived food availability and predation risk (Brown, 1988, 1992).
Specifically, the following were recorded;
1) The foraging events of impala and dik-dik for the four species of trees;

23
2) The number of leaves remaining after visitations by impala and dik-dik; and
3) The number of leaves removed after exposure to herbivores was also calculated.
Forage tree species of focus were Acacia brevispica, A. etbaica, Croton dichogamus and Grewia
bicolor which make up >80% of stems at MRC (Ward & Young, 2002; Young et al., 1995) and
exhibit a range of mechanical and chemical defences.
Branch cuttings (ca. 150 cm tall) from random pairwise combination of forage species were placed
ca. 8 m in front of motion sensitive camera trap (Plate 3.3). The pair-wise branch cuttings were set
at 1 m apart and were anchored in pots filled with soil and water to maximize longevity of green
foliage. Pots were dug into the ground with their tops level with the ground and covered with local
substrate to minimize animals’ perceptions of human activity. The random pairwise combinations
were placed in three plots per study site, one in the centre of the glade and two in the surrounding
bushland, about 50 m from the edge of the glades, to increase probability of encounter in the
bushland sites. The plots in the bushland were set in areas with signs of focal species (e.g., game
trails, dung middens) to maximize probability of encounter. Leaves were counted around mid-day
after two days. Of all the glades available within the study site, a total of 20 were used for this
study. These were randomly selected but only glades that showed signs (e.g fresh droppings, game
trails) of recent use by impala and dik-dik were used. Only one of the glades that were likely to be
used by same group of impalas, based on GPS telemetry (Ford et al., 2014), were used for the
experiment. Of the four tree species used in this study, there were a total of six pairwise
combinations. Ten trials were setup for each of the six pairwise combination giving a total of 600
trials.

24
Motion sensitive camera traps of Reconyx RM45 model (RECONYX, Inc., Holman, WI, USA)
were used. They were set to take 5 pictures per trigger with no delay between trigger intervals. In
order to minimize biases brought about the angle of field of view and detection zone (Trolliet et
al., 2014) camera traps of the same make and model were used throughout the experiment.
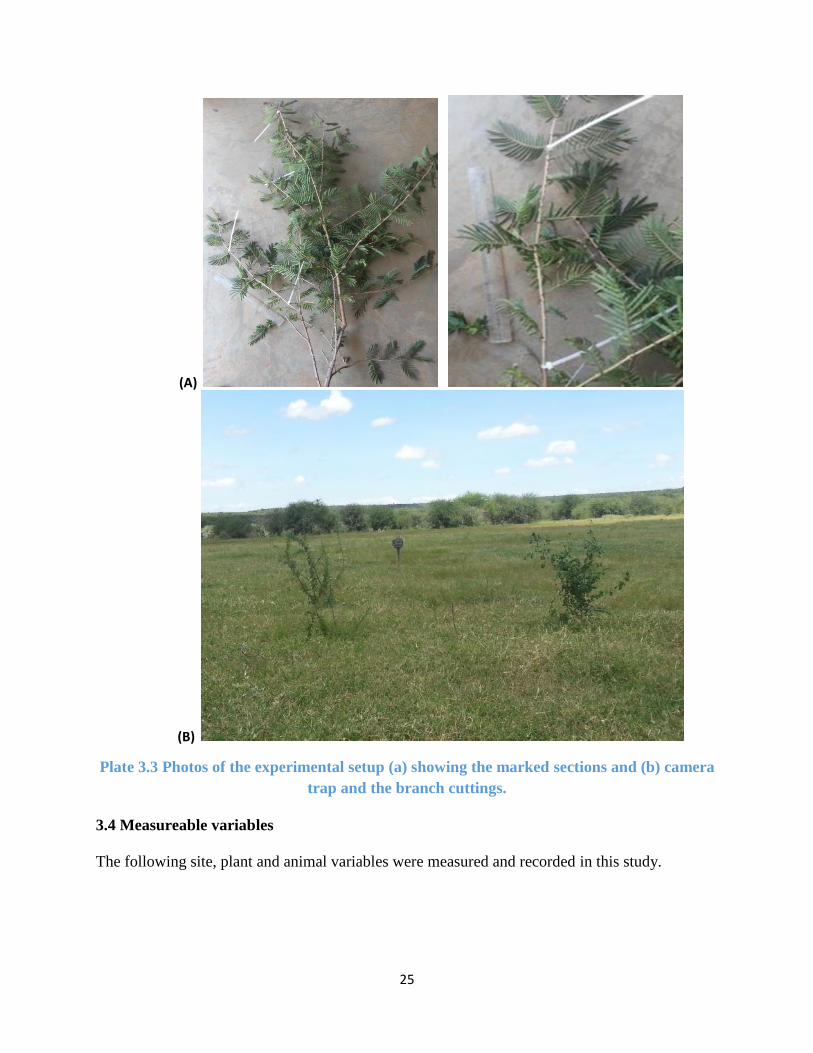
25
(A)
(B)
Plate 3.3 Photos of the experimental setup (a) showing the marked sections and (b) camera
trap and the branch cuttings.
3.4 Measureable variables
The following site, plant and animal variables were measured and recorded in this study.

26
3.4.1 Site Variables
At each of the 20 plots, GPS position, season, the distance to the nearest dik-dik dung midden/game
trail and the visibility of each site were recorded. Visibility (the mean distance to the nearest line-
of-sight obstruction) was quantified using a range finder (Riginos & Grace, 2008). For each site
visibility was measured in 4 directions (every 900 for the four cardinal directions of the compass)
from the centre of the site. The rangefinder was held level at a height of about 1 m. All 4
measurements were then averaged for each habitat type. Results for the average visibility of the
glades and bushland sites are included in Appendix 2.
3.4.2 Plant Variables
For every branch cutting in each plot the following were recorded:
a) Leaf density loss: Two random sections of each branch cutting were marked with zip ties,
one at the upper branches and one at the lower branches (Plate 3.3). The length of each
marked section was measured and the number of leaves counted before and after
encounters with the herbivores. The lower branches (about 50 cm from the ground) targeted
dik-dik while the upper branches (about 1 m from the ground) specifically targeted impala.
Two datasets were derived from this; i) the biomass density and proportion of biomass
density removed, and ii) the biomass density and proportion of biomass density remaining
after exposure to the foragers.
b) Average leaf mass: To convert the number of leaves removed to biomass, 10 samples of
each tree species leaves were taken, weighed, oven-dried, and then weighed again to get
an average dry weight of a single leaf for each of the forage plant species. Given the
differences in leaf sizes the number of leaves per sample varied for each tree species. For
27
A. brevispica and Croton dichogamus, each sample had 10 leaves. A. etbaica had 30 leaves
per sample while Grewia bicolor had 20 leaves per sample (see Appendix 1).
3.4.3 Animal Variables
Animal responses included the number of images recorded by the camera trap for each herbivore
feeding per plant. From each of the camera trap photos, the number of individuals feeding on each
of the plant species for every setup were recorded. The foraging events were then compared to the
type of forage and the habitat to help understand impala and dik-dik foraging behaviour in relation
to predation risk and diet choice.
3.5 Data Analysis
Data analysis reflected responses of plants and animals to experimental treatments. The images
from the camera traps were first quantified by going through each and every single image and
recording the LMH species, the forage plant species they were feeding on, the habitat type (glade
or bush), and the browsing height (lower or upper branches). Only images in which impala or dik-
dik were recorded browsing on any of the four forage plants were included for data analysis.
Student t-tests were used to test for differences in means. Data that did not follow the bell-shaped
normality curve were first log transformed before parametric data analysis were applied.
To quantify foraging preference, the number of camera trap images taken at each plant were
compared, accounting for the nested experimental design of plot within trial. From this foraging
events data were generated. Foraging events were the total number of images recorded by camera
traps for each herbivore (impala or dik-dik) actually feeding on the forage species. Generalized
linear mixed models with a Poisson distribution were used because the response variable were
counts of events. The number of images were compared by herbivore species, by tree species, by
28
habitat type, and by all possible two-way and three-way interactions using one way ANOVA and
Tukey-HSD tests.
Leaf removal (the number of leaves removed after exposure to impala and dik-dik) were also used
to quantify diet preference by comparing the biomass density and the proportion of biomass
density of leaves removed for each tree species in both habitats at lower and at upper branch
heights and for the whole branch cutting. Leaf removal/loss on the upper branches were equated
to impala foraging while for the lower branches to dik-dik foraging. These were the actual leaf
biomass eaten by impala and dik-dik. Linear-mixed effects models were used to test for the effects
of habitat type on the leaf removal, in upper and lower branches and for the whole tree.
To quantify the effectiveness of plant defence against herbivory by impala and dik-dik, leaf
survival (leaves remaining after exposure to the herbivores), the biomass density and the
proportion of biomass density of leaves remaining were compared for each tree species in both
habitats, at lower and upper branch heights and for the whole branch cuttings. Linear-mixed effects
models were again used to test for the effects of habitat type on the leaf removal, both in upper
and lower branches. Leaf survival was equated to the effectiveness of the plant defences against
herbivory by impala and dik-dik. The higher the number or biomass density remaining after
visitation by the herbivores, the more effective the plant defences possessed by the tree species.
All statistical analyses were performed using the “nlme” (Pinheiro et al., 2015), ‘lme4’ (Bates et
al., 2015) and ‘glmmADMB’ packages (Fournier et al., 2012) in R version 3.2.2 (R Core Team
2015) and significance was determined at the level of P < 0.05.
29
Chapter 4 : Results
4.1 Visibility in the Glades and Bushland
There were significant differences in mean visibility in bush and glades (t = -7.52, df = 18.78, p-
value < 0). Mean visibility in the glades was 71.5 (± 7.78) m while for bush visibility reduced to
12.38 (± 1.14) m (Appendix 2).
4.2 Foraging Events from Camera traps
A total of 25,172 foraging events were recorded for both impala and dik-dik in the open and
bushland habitats. Of these, 16,006 were recorded in the open while 9,166 were recorded in the
bushland. Approximately 54.35% more foraging events occurred in the open habitats than the
bushland. Impala recorded 15,865 foraging events in the open habitat and 8,429 in bushland, while
dik-dik recorded 141 and 737 in the open and bushland habitats respectively. Impala recorded
16,533 foraging events for leaves on the upper branches while dik-dik only recorded 26 foraging
events. On the lower branches, impala recorded 7,761 and dik-dik 852 foraging events.
There were significant effects of herbivore species, habitat type, and plant species on foraging
preferences. In overall Grewia bicolor and A. brevispica were browsed more, both in the open and
in the bushland, whereas A. etbaica and Croton were browsed the least (Figure 4.1). Summary of
the foraging events data are included in Appendix 3.

30
Figure 4.1 Combined mean foraging events for impala and dik-dik in open and bush
habitats.
4.2.1 Impala Foraging Preference as Determined by Foraging Events
Impala recorded higher mean foraging events in open habitats than in bushland (t = -6.276, df =
378.53, p-value < 0.01), with the exception of Grewia bicolor (Table 4.1). They recorded 50.65%
more mean foraging on the upper branches than on the lower branches (t = -7.133, df = 401.91, p-
value < 0.001). Tukey post-hoc multiple comparison analysis for the same plant species in different
habitats for impala were < 0.05 except for Grewia bicolor (Table 4.1). Impala’s foraging
preference did not significantly vary by plant species in the glades (open habitat) (Table 4.1) while
in the riskier bushland sites, impala significantly browsed more on the less-thorny A. brevispica
than A. etbaica (Table 4.1). Impala recorded the second highest mean foraging events for the thorn-
less Grewia bicolor in the bush (Figure 4.2). Impala diet preference in the bush ranked from A.
brevispica to Grewia bicolor, to Croton dichogamus and to A. etbaica in that order (Figure 4.2).
-10
0
10
20
30
40
50
Open Open Open Open Bush Bush Bush Bush
Grewia A.brevispica
A. etbaica Croton A.brevispica
Grewia A. etbaica Croton
Me
an f
ora
gin
g e
ven
ts (
±SE
)

31
Figure 4.2 Mean foraging events for impala recorded by camera traps. Asterisks (*)
indicate significance at p=0.05 between the open and bushland habitats. Grey bars in (A)
represent open (glades) while black bars represent bushland habitats
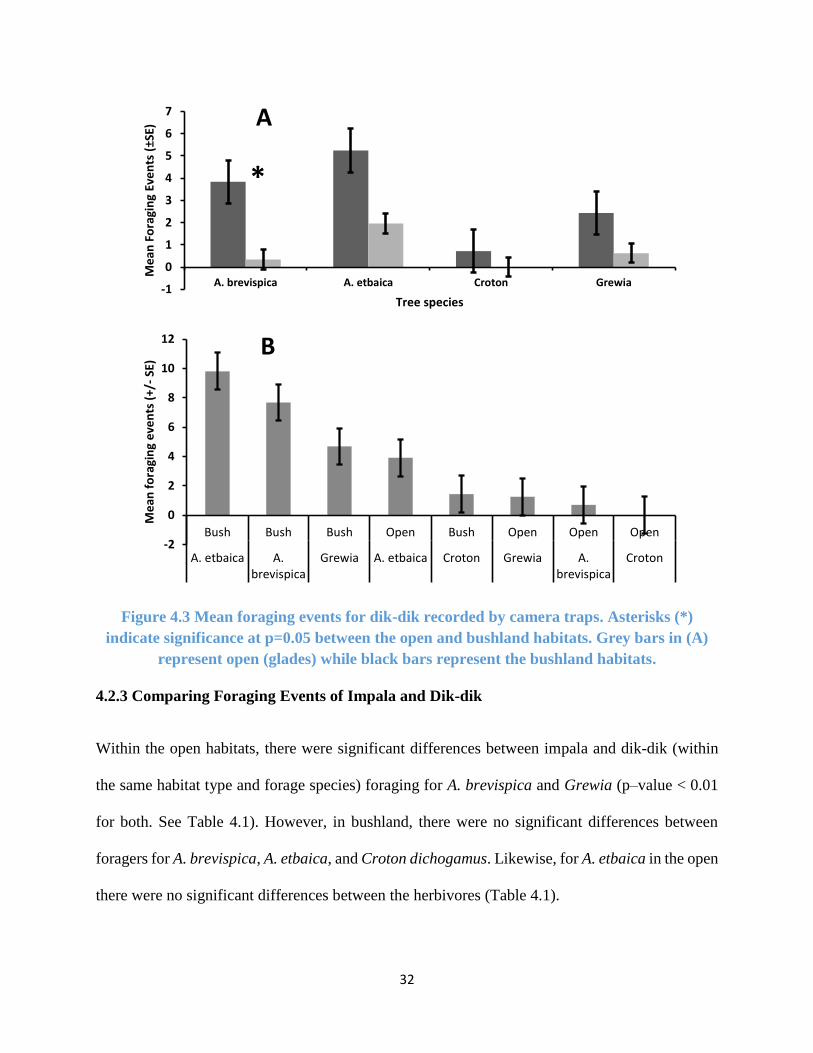
4.2.2 Dik-dik Foraging Preference as Determined by Foraging Events
Dik-dik mean foraging events were higher in the bushland than in the open habitat (t = 4.356, df
= 394.34, p-value < 0.01) (Figure 4.3). They exclusively foraged on the lower branches (185.76%
more) than on the upper branches (t = 8.527, df = 222.98, p-value < 0.001) and preferred foraging
on A. etbaica and A. brevispica compared to Grewia bicolor or Croton dichogamus (Figure 4.3,
Table 4.1). They showed high preference for the thorny A. etbaica, even in the open habitat where
they perceive as risky (Figure 4.3). Dik-dik were never recorded by camera traps feeding on Croton
dichogamus in the glades.
0
20
40
60
80
100
120
140
A. brevispica A. etbaica Croton Grewia
Me
an F
ora
gin
g Ev
en
ts (
±SE)
Tree species
* **
A
0
20
40
60
80
100
120
140
Open Open Open Open Bush Bush Bush Bush
Grewia Croton A.brevispica
A. etbaica A.brevispica
Grewia Croton A. etbaica
Me
an f
ora
gin
g e
ven
ts (
+/-
SE)
B
32
Figure 4.3 Mean foraging events for dik-dik recorded by camera traps. Asterisks (*)
indicate significance at p=0.05 between the open and bushland habitats. Grey bars in (A)
represent open (glades) while black bars represent the bushland habitats.
4.2.3 Comparing Foraging Events of Impala and Dik-dik
Within the open habitats, there were significant differences between impala and dik-dik (within
the same habitat type and forage species) foraging for A. brevispica and Grewia (p–value < 0.01
for both. See Table 4.1). However, in bushland, there were no significant differences between
foragers for A. brevispica, A. etbaica, and Croton dichogamus. Likewise, for A. etbaica in the open
there were no significant differences between the herbivores (Table 4.1).
-1
0
1
2
3
4
5
6
7
A. brevispica A. etbaica Croton Grewia
Me
an F
ora
gin
g Ev
en
ts (
±SE)
Tree species
A
*
-2
0
2
4
6
8
10
12
Bush Bush Bush Open Bush Open Open Open
A. etbaica A.brevispica
Grewia A. etbaica Croton Grewia A.brevispica
Croton
Me
an f
ora
gin
g e
ven
ts (
+/-
SE)
B
33
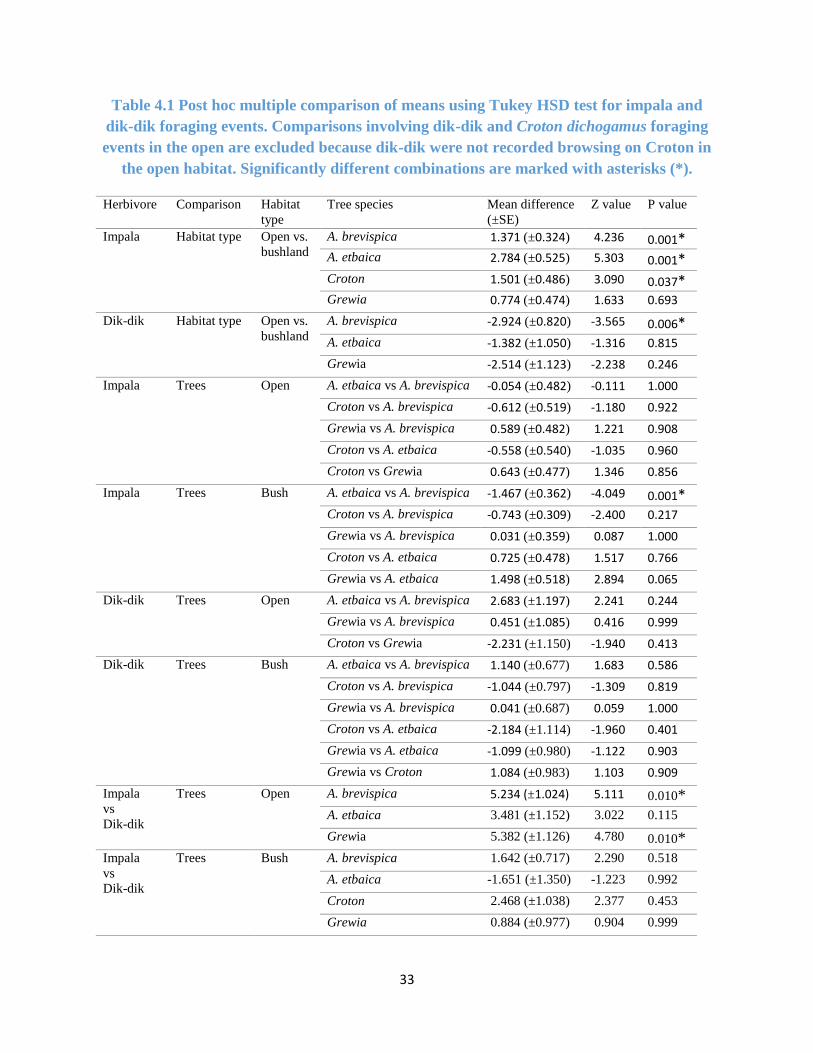
Table 4.1 Post hoc multiple comparison of means using Tukey HSD test for impala and
dik-dik foraging events. Comparisons involving dik-dik and Croton dichogamus foraging
events in the open are excluded because dik-dik were not recorded browsing on Croton in
the open habitat. Significantly different combinations are marked with asterisks (*).
Herbivore Comparison Habitat
type
Tree species Mean difference
(±SE)
Z value P value
Impala Habitat type Open vs.
bushland
A. brevispica 1.371 (±0.324) 4.236 0.001* A. etbaica 2.784 (±0.525) 5.303 0.001*
Croton 1.501 (±0.486) 3.090 0.037* Grewia 0.774 (±0.474) 1.633 0.693
Dik-dik Habitat type Open vs.
bushland
A. brevispica -2.924 (±0.820) -3.565 0.006*
A. etbaica -1.382 (±1.050) -1.316 0.815
Grewia -2.514 (±1.123) -2.238 0.246
Impala Trees Open A. etbaica vs A. brevispica -0.054 (±0.482) -0.111 1.000
Croton vs A. brevispica -0.612 (±0.519) -1.180 0.922
Grewia vs A. brevispica 0.589 (±0.482) 1.221 0.908
Croton vs A. etbaica -0.558 (±0.540) -1.035 0.960
Croton vs Grewia 0.643 (±0.477) 1.346 0.856
Impala Trees Bush A. etbaica vs A. brevispica -1.467 (±0.362) -4.049 0.001*
Croton vs A. brevispica -0.743 (±0.309) -2.400 0.217
Grewia vs A. brevispica 0.031 (±0.359) 0.087 1.000
Croton vs A. etbaica 0.725 (±0.478) 1.517 0.766
Grewia vs A. etbaica 1.498 (±0.518) 2.894 0.065
Dik-dik Trees Open A. etbaica vs A. brevispica 2.683 (±1.197) 2.241 0.244
Grewia vs A. brevispica 0.451 (±1.085) 0.416 0.999
Croton vs Grewia -2.231 (±1.150) -1.940 0.413
Dik-dik Trees Bush A. etbaica vs A. brevispica 1.140 (±0.677) 1.683 0.586
Croton vs A. brevispica -1.044 (±0.797) -1.309 0.819
Grewia vs A. brevispica 0.041 (±0.687) 0.059 1.000
Croton vs A. etbaica -2.184 (±1.114) -1.960 0.401
Grewia vs A. etbaica -1.099 (±0.980) -1.122 0.903
Grewia vs Croton 1.084 (±0.983) 1.103 0.909
Impala
vs
Dik-dik
Trees Open A. brevispica 5.234 (±1.024) 5.111 0.010* A. etbaica 3.481 (±1.152) 3.022 0.115
Grewia 5.382 (±1.126) 4.780 0.010* Impala
vs
Dik-dik
Trees Bush A. brevispica 1.642 (±0.717) 2.290 0.518
A. etbaica -1.651 (±1.350) -1.223 0.992
Croton 2.468 (±1.038) 2.377 0.453
Grewia 0.884 (±0.977) 0.904 0.999
4.3. Foraging Preference as Determined by Leaf Biomass Density Removed
Summary of leaf biomass density and the proportion (%) of biomass density removed by impala
and dik-dik are appended in Appendix 4 and Appendix 5 respectively.
4.3.1 Impala Foraging Preference from Leaf Biomass Density Removed
For leaves on the upper branches, there were no significant difference between the mean biomass
density of leaves removed in the open and bushland habitats for all the tree species except A.
brevispica (F (1, 59) = 4.592, p-value = 0.036) (Figure 4.4a, Appendix 4). But the proportion (%)
of biomass density removed only showed significant difference between the habitats for Grewia
bicolor (F (1, 52) = 6.415, p-value = 0.014) (Figure 4.4b, Appendix 5). Grewia bicolor and A.
brevispica, were browsed the most, both in the open and bushland habitats (Figure 4.4c). A. etbaica
was the least browsed by impala in the open bush while Croton dichogamus was avoided by impala
in both habitats (Figure 4.4c).
35
Figure 4.4 Mean biomass density (A) and the proportion of biomass density (B) of leaves
removed by impala. Black bars represent bushland while the grey bars represent open
(glade) habitats. Asterisk (*) indicate significant differences between the habitats.
-0.02
0
0.02
0.04
0.06
0.08
A. brevispica A. etbaica Croton Grewia
Bio
mas
s d
en
sity
(g/
cm)
rem
ove
d (
±SE)
Tree species
A*
-0.2
0
0.2
0.4
0.6
0.8
1
A. brevispica A. etbaica Croton Grewia
%B
iom
ass
de
nsi
ty (
g/cm
) re
mo
ved
(±S
E)
Tree species
B*
-0.2
0
0.2
0.4
0.6
0.8
1
Open Open Bush Bush Open Bush Open Bush
Grewia A.brevispica
A.brevispica
Grewia A. etbaica A. etbaica Croton Croton
%B
iom
ass
de
nsi
ty (
g/cm
) re
mo
ved
(±S
E)
C
36
4.3.2 Dik-dik Foraging Preference from Leaf Biomass Density Removed
There were no effect of habitat type on the biomass density of leaves removed on the lower
branches for all the tree species except for Grewia bicolor (F (1, 52) = 4.086, p-value = 0.048)
(Figure 4.5a, Appendix 4). The proportion (%) of biomass density of leaves removed on the lower
branches were not affected by habitat type for all the tree species (See Appendix 5). Foraging on
the lower branches was mainly done by dik-dik. In the open dik-dik browsed more on Grewia
dichogamus and A. brevispica while in the bush higher proportion of biomass density was removed
for A. etbaica (Figure 4.5c). Croton dichogamus recorded the least proportion of biomass density
removed in both habitats (Figure 4.5c).
37
Figure 4.5 Mean biomass density (A) and the proportion of biomass density (B) of leaves
removed by dik-dik. Black bars represent bushland habitats while grey bars represent
-0.01
0
0.01
0.02
0.03
0.04
0.05
0.06
0.07
A. brevispica A. etbaica Croton Grewia
Bio
mas
s d
en
sity
(g/
cm)
rem
ove
d (
±SE)
Tree species
A
*
-0.2
0
0.2
0.4
0.6
0.8
1
A. brevispica A. etbaica Croton Grewia
%B
iom
ass
de
nsi
ty (
g/cm
) re
mo
ved
(±S
E)
Tree species
B
0
0.1
0.2
0.3
0.4
0.5
0.6
0.7
0.8
0.9
Open Open Bush Open Bush Bush Open Bush
Grewia A.brevispica
A. etbaica A. etbaica Grewia A.brevispica
Croton Croton
%B
iom
ass
de
nsi
ty (
g/cm
) re
mo
ved
(±
SE)
C

38
open habitat. Asterisk (*) indicate significant differences between open and bushland
habitat.
4.3.3 Leaf Biomass Density Removed by both Impala and Dik-dik
When leaf removal for both leaves on the lower and upper branches (the whole tree) were
compared, habitat effect on the biomass density and the proportion (%) of biomass density of
leaves removed were only significant for A. brevispica F (1, 59) = 4.268, p-value = 0.043) and
Grewia bicolor (F (1, 52) = 4.871, p-value = 0.032) (Figure 4.6: See Appendix 4 and 5). Grewia
bicolor and A. brevispica were browsed the most while A. etbaica were browsed the least, both in
the open and bushland habitats (Figure 4.6c). Croton recorded the least proportion of biomass
density removed in both habitats (Figure 4.6c). The per capita (per leaf) risk of herbivory from
impala and dik-dik increased from plants in the bush to the plants in the open habitat, and from
plants without or with minimal physical (thorns) defence to plants with higher physical defences
(Figure 4.6c).

39
Figure 4.6 Mean biomass density (A), the proportion of biomass density (B), and the
ranking of the proportion of biomass density removed (C) by impala and dik-dik. Asterisk
(*) indicate significant differences between open and bushland habitat.
-0.01
0
0.01
0.02
0.03
0.04
0.05
0.06
0.07
A. brevispica A. etbaica Croton Grewia
Bio
mas
s d
en
sity
(g/
cm)
rem
ove
d (
±SE)
Tree species
A
**
-0.2
0
0.2
0.4
0.6
0.8
1
A. brevispica A. etbaica Croton Grewia
%B
iom
ass
de
nsi
ty (
g/cm
) re
mo
ved
(±S
E)
Tree species
B* *
0
0.2
0.4
0.6
0.8
1
Open Open Open Bush Bush Bush Open Bush
Grewia A.brevispica
A. etbaica A.brevispica
Grewia A. etbaica Croton Croton
%B
iom
ass
de
nsi
ty (
g/cm
) re
mo
ved
(±S
E)
C

40
4.4 Efficacy of Plant Defences
Leaf survival was the number of leaves remaining after exposure to the herbivores. Leaf biomass
density remaining and proportion of leaf biomass density remaining on the upper branches was
used to determine the effectiveness of the plant defences against impala herbivory and on the lower
branches to determine plant defence efficacy against herbivory by dik-dik.
4.4.1 Efficacy of Plant Defences against Herbivory by Impala
The mean biomass density of leaves remaining on the upper branches (Figure 4.7a) were
significantly higher in bush than open habitats for A. brevispica (F (1, 59) = 4.768, p-value =
0.033), A. etbaica (F (1, 67) = 6.404, p-value = 0.014), and Grewia bicolor (F (1, 52) = 8.492, p-
value = 0.005), but not for Croton dichogamus (F (1, 57) = 0.006, p-value = 0.939) (See Appendix
6). On the other hand the proportion (%) of biomass density remaining only showed effect of
habitat type for A. etbaica (F (1, 67) = 4.057, p-value = 0.048) and Grewia bicolor (F (1, 52) =
11.455, p-value = 0.001) (Figure 9b, Appendix 7). In overall, Croton dichogamus and A. etbaica,
both in the open and bush, recorded the highest proportion of biomass density remaining while
Grewia bicolor and A. brevispica in the open recorded the least biomass density remaining (Figure
4.7b).
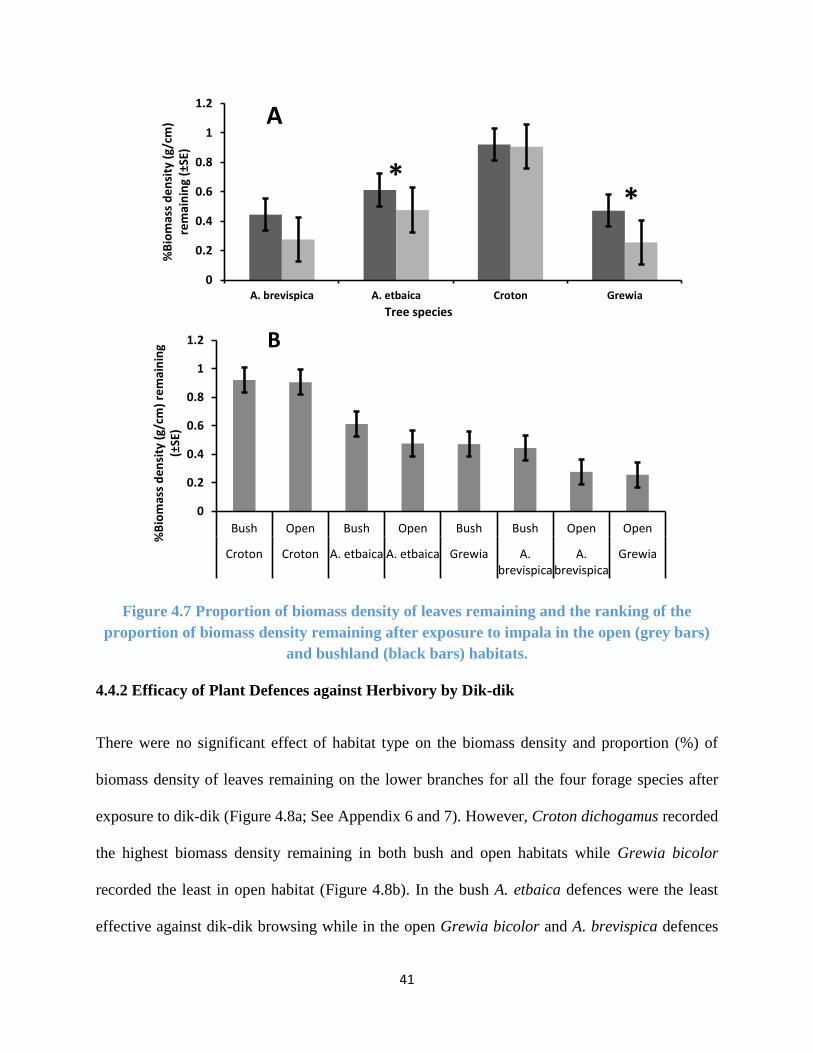
41
Figure 4.7 Proportion of biomass density of leaves remaining and the ranking of the
proportion of biomass density remaining after exposure to impala in the open (grey bars)
and bushland (black bars) habitats.
4.4.2 Efficacy of Plant Defences against Herbivory by Dik-dik
There were no significant effect of habitat type on the biomass density and proportion (%) of
biomass density of leaves remaining on the lower branches for all the four forage species after
exposure to dik-dik (Figure 4.8a; See Appendix 6 and 7). However, Croton dichogamus recorded
the highest biomass density remaining in both bush and open habitats while Grewia bicolor
recorded the least in open habitat (Figure 4.8b). In the bush A. etbaica defences were the least
effective against dik-dik browsing while in the open Grewia bicolor and A. brevispica defences
0
0.2
0.4
0.6
0.8
1
1.2
A. brevispica A. etbaica Croton Grewia
%B
iom
ass
de
nsi
ty (
g/cm
) re
mai
nin
g (±
SE)
Tree species
A
**
0
0.2
0.4
0.6
0.8
1
1.2
Bush Open Bush Open Bush Bush Open Open
Croton Croton A. etbaica A. etbaica Grewia A.brevispica
A.brevispica
Grewia
%B
iom
ass
de
nsi
ty (
g/cm
) re
mai
nin
g (±
SE)
B

42
were the least effective as these recorded the least proportion (%) biomass density remaining
(Figure 4.8b).
Figure 4.8 Proportion of biomass density of leaves remaining (B) and the ranking (C) of the
proportion of biomass density remaining after exposure to dik-dik in the open (grey bars)
and bushland (black bars) habitats.
4.4.2 Efficacy of Plant Defences against Herbivory by Impala and Dik-dik
There were no significant differences in the biomass density and proportion of biomass density
remaining between the glades and bushland for all the forage tree species except for Grewia
bicolor (A. brevispica F(1,59) = 1.458) p=0.232, A. etbaica F(1,67) = 1.969) p=0.165, Croton
0
0.2
0.4
0.6
0.8
1
1.2
A. brevispica A. etbaica Croton Grewia
%B
iom
ass
de
nsi
ty (
g/cm
) re
mai
nin
g (±
SE)
Tree species
A
0
0.2
0.4
0.6
0.8
1
1.2
Bush Open Bush Bush Open Bush Open Open
Croton Croton A.brevispica
Grewia A. etbaica A. etbaica A.brevispica
Grewia
%B
iom
ass
de
nsi
ty (
g/cm
) re
mai
nin
g (±
SE)
B

43
dichogamus F(1,52) = 0.319, p=0.574, Grewia bicolor F(1,52) = 9.542, p=0.003). There were
55.18% more of Grewia bicolor remaining in bush than in glades.
Figure 4.9 Proportion (%) of mean biomass density remaining after exposure to both
impala and dik-dik.
0
0.2
0.4
0.6
0.8
1
1.2
A. brevispica A. etbaica Croton Grewia
%B
iom
ass
de
nsi
ty (
g/cm
) re
mai
nin
g (±
SE)
Tree species
*
A
0
0.2
0.4
0.6
0.8
1
1.2
Bush Open Bush Bush Bush Open Open Open
Croton Croton A. etbaica Grewia A.brevispica
A. etbaica A.brevispica
Grewia
%B
iom
ass
de
nsi
ty (
g/cm
) re
mai
nin
g (±
SE)
B
44
Chapter 5 : Discussion
5.1 Discussion
5.1.1 Foraging Preference
Results show that impala generally foraged more in the glades where they perceived as less risky.
The grasses in the glades are rich in nutrients and has been posited to be the reason why impalas
are attracted to these habitats (Augustine, 2004). But Ford et al. (2014) showed that the primary
reason impalas frequent glades is to avoid predation as predators are known to use bush cover to
conceal themselves when hunting (Underwood, 1982; Hopcraft et al., 2005; Riginos & Grace,
2008; Anderson et al., 2010; Thaker et al., 2011; Valeix et al., 2011). Because ungulates live in a
‘landscape of fear’ (LOF) (Laundre et al., 2001) and tend to avoid those habitats they perceive to
be risky, impala avoided bushland but frequented the open habitats (van der Merwe & Brown,
2008; Iribarren & Kotler, 2012; Ford et al., 2014; Laundre et al., 2014). This is evident by the
comparatively higher foraging events recorded by the camera traps in the glades and the mean leaf
biomass density removed by impala (upper branches) in the glades.
However, this was not the case for the small-bodied dik-dik, whom like other smaller-bodied
LMH, rely on cryptic behaviour to avoid predators (Jarman, 1974). Dik-dik LOF was quite the
opposite of impala and they have been known to spend most of their time in the bushland (Ford &
Goheen, 2015). Both impala and dik-dik recorded higher foraging in the habitats they perceived
as less risky and in these habitats they had more foraging time per tree species. This was in line
with the predictions under risk-driven hypotheses, where the LMH were predicted to record more
foraging in habitats they perceived as safe and more selective in risky habitats. Increasing access
time for resources lead to more foraging events in the safe habitats, for both impala and dik-dik
45
and this has also been recorded in other studies for rodents (Brown, 1988), for primates
(Cowlishaw, 1997), for birds (Carrascal et al., 2006) and for herbivores (Valeix et al., 2009).
Impala while in the risky bushland habitat foraged more on plants that were relatively easier to
ingest: the less-thorny A. brevispica and the thorn-less Grewia bicolor. They however, foraged
less on the thornier A. etbaica and avoided Croton dichogamus. A. brevispica has only short spines
compared to A. etbaica that has both short and long spines. Grewia bicolor lack the thorns
altogether. Spines are form of mechanical plant defence and they act by reducing ingestion of
leaves by the herbivores (du Toit 2003; Borchard et al., 2011) thus ingesting leaves of Grewia
bicolor and A. brevispica would be relatively much easier and faster than ingesting leaves of A.
etbaica. Ford et al. (2014) showed that impala avoided A. etbaica because of the long spines and
when the long spines were removed and added to A. brevispica their foraging on A. etbaica was
tremendously increased. The study illustrated the importance of spines and thorns on the ingestion
of plants by impalas in a savannah ecosystem. Because the risk of predation for impala is greater
in the bushland they needed to allocate more time scanning for predators and thus they chose to
forage on plants that were easier and faster to ingest. Croton dichogamus though does not have
any prominent form of mechanical defence, must have had a relatively strong chemical defence
(Young et al., 1998 Hemayet et al., 2012) and so was foraged on the least by impala, both in glades
and in the bushland. This implies that the effect of Croton dichogamus chemical defence is way
much higher than the nutritional value the LHM would derive from these leaves.
Dik-dik, just like impala, also browsed more in the habitat they perceived as "safe" (bushland) and
lesser in the "risky" habitat (glades). They however, preferred the thorny A. etbaica and A.
brevispica to the thorn-less Grewia bicolor and Croton dichogamus. With their nimble mouthparts,
smaller LMH are better equipped to avoid plant mechanical defence than the larger LMH. Dik-dik

46
were able to navigate around the thorns to reach the leaves of A. etbaica and A. brevispica more
easily than impala.
Both impala and dik-dik avoided Croton dichogamus in both habitats. High concentrations of
tannins are known to reduce voluntary feed intake and nutrient digestibility, whereas low to
moderate concentrations have nutritional benefit for herbivores by protecting dietary proteins from
excessive ruminal degradation without affecting forage intake or fibre digestion (Barry et al., 1986;
Frutos et al., 2004). Although doing bioassays for the chemical contents of the forage plants was
beyond the scope of this study, Croton dichogamus has been recorded elsewhere to have a higher
tannin content (Hemayet et al., 2012) making it less nutritionally important. Tannin content for
Grewia spp leaves have been recorded in other studies to be less than tannin content for Croton
spp (Apori et al., 1998; Hemayet et al., 2012). Ford et al. (2014) experimentally showed that for
A. brevispica and A. etbaica mechanical defences were more important in influencing their
herbivory. In removing the long thorns on A. etbaica and adding them to A. brevispica impalas
increased their foraging on the thorn-removed A. etbaica but reduced their consumption of the
thorn-addition A. brevispica. This demonstrated that for A. etbaica and A. brevispica mechanical
defences were the limiting factor for LMH feeding on them. This was also supported in this study:
Dik-dik despite A. etbaica being highly mechanically defended they still recorded higher foraging
for it because with their nimble mouth parts the thorns were not effective in deterring herbivory
against them.
All in all, these results support the palatability-driven hypothesis prediction that chemicals
defences would be more effective against smaller-bodied LMH and because gut capacity decreases
with body size larger guts are needed to overcome the effect of chemical defences once ingested.
Thus diet preference for dik-dik was more constrained by plant chemical defences rather than
47
mechanical defences and they would even trade-off some risk to get to A. etbaica in the risky
habitat (glades).
5.1.2 Efficacy of Plant Defences against Herbivory by Impala and Dik-dik
The biomass density of leaves remaining on the trees after exposure to impala and dik-dik reflected
on the effectiveness of plant defences against herbivory. The higher the GUD (biomass density
remaining) the more effective the plant defences were against herbivory by the LMH. Overally,
the thorn-less Croton dichogamus defences were the most effective against impala and dik-dik
herbivory, both in the glades and in the bush, followed by A. etbaica in the bush. Despite Croton
dichogamus lacking the mechanical defences like thorns and spines, their tannin content must have
been high enough (Hemayet et al., 2012) to render them nutritionally unimportant to herbivores
regardless of which habitat they were (Barry et al., 1986; Young et al., 1995; Frutos et al., 2004).
But because this study did not conduct chemical bioassays for the forage plant species, probably
some factors other than tannin content could have contributed to the higher GUD for Croton
dichogamus in both habitats. However, plants have been shown not to invest in both mechanical
and chemical defences (Moles et al., 2013; Ward & Young, 2002) and thus the lack of spinescense
in Croton dichogamus and Grewia bicolor makes them more likely to have invested in chemical
defences and the vice versa for A. etbaica and A. brevispica.. The long spines of A. etbaica has
been shown to reduce herbivory (Ford et al., 2014) and given that impala perceive bush as risky
A. etbaica would take them longer to ingest (Cooper & Owen-Smith, 1986; Belovsky et al., 1991;
Gowda 1996) and yet they needed to allocate more time in predation avoidance behaviour such as
scanning for predators. But while in the safer habitat (glades), impala had time allocated for
browsing and so they managed to at least browse on A. etbaica.

48
Though A. etbaica defences were effective against impala, especially in bushland, for dik-dik A.
etbaica was the least effective in both habitats. Due to the allometric gut capacity scaling,
mechanical defences are less effective against the smaller-bodied LMH as they are able to navigate
around the thorns and spines to get to the leaves of mechanically defended plants. Some studies
comparison. Larger-bodied LMH species, like impala, are known to require higher densities of
nutrients in their food but less total plant material and due to their large gut capacity are able to
digest coarse and more toxic plant materials (Underwood, 1982; Ritchie & Olff 1999; Borchard et
al., 2011).
When looking at the efficacy of plant defences against herbivory by both impala and dik-dik,
Croton dichogamus and A. etbaica defences in the bush and glade were the most effective (fewer
GUD), while A. brevispica and Grewia bicolor defences in glades were the least effective
(comparatively more GUD) against herbivory. A. brevispica and A. etbaica both has thorns but the
latter (A. etbaica) has got both the short and long spines making it the most mechanically defended
than A. brevispica. While on the other hand Croton species have been recorded to have higher
tannin content compared to Grewia species (Apori et al., 1998; Hemayet et al., 2012) making
Croton spp highly chemically defended. From this, a clear pattern emerges where plants with better
mechanical or chemical defences have higher chances of escaping herbivory from LMH than
plants with less or without defences and this is in support of the palatability driven and accessibility
driven foraging hypotheses.
49
Chapter 6 : Conclusion and Recommendation
6.1 Conclusion
From the herbivore’s perspective, the risk of predation is more important than forage preference.
Higher foraging events and density of biomass removal for impala were all in the safer habitats,
(glades), and they were more selective in the bush. Impala preferred the less mechanically
defended A. brevispica and the thorn-less Grewia in bush but showed no preference while in the
glades. Dik-dik on the other hand, recorded the highest foraging events and density of biomass
removal in the bush and showed preference for the thorny A. etbaica even in the riskier open
habitats. For dik-dik the effect of chemical defences is more important than mechanical defences
and so they would rather trade off some risk to get the highly mechanically defended A. etbaica in
the risky habitat (glades).
From the plants perspective, defences are more important than habitat and thus plants with better
mechanical or chemical defenses have higher chances of escaping herbivory from impala and dik-
dik irrespective of the habitat in which they are.
6.2 Implication to Ecology and Management
Anthropogenic activities exert a major influence on the interaction between carnivores, herbivores
and the vegetation communities in a savannah ecosystem. Glades are as a result of livestock
husbandry practices (Young et al., 1995) and they provide a mosaic that has shaped the spatial
foraging patterns of LMH (Ford et al., 2014). With the loss of carnivores, for instance, landscapes
are more likely to become less risky (Berger et al., 2001) decoupling the spatial interplay of risk
avoidance and diet selection. Loss of carnivores will also render obsolete the need for pastoralists
to corral their livestock in bomas at night, eliminating the formation of glades and thus the risk

50
heterogeneous landscape. Human-driven loss of large carnivores from African savannahs (Estes
et al., 2011) will reduce spatial variation in plant communities (Ford et al., 2014) and only plants
equipped with better defences against herbivory are likely to survive. Again with effects of the
imminent climate change such as shrub encroachment (increase of woody plant cover) into
formerly open and grassy areas (Archer et al., 1995), glades are likely to be eliminated making
this ecosystem homogenous in terms of land cover. This study illustrate the important role
pastoralists, in the presence of carnivores, play (indirectly) in the spatial interplay of risk
avoidance, diet selection and tree distribution within the Savannah ecosystem.

51
6.2 Study Limitation and Recommendations
One important limiting aspect of this study was the lack of comparative bioassays of chemical
composition for the four forage plant species. The study relied more on the secondary data from
other studies of which not a single one had chemical composition (more so tannin content) for all
the forage plant species in this study. Though there are almost non-existent studies on the
nutritional and tannin content for all the four study forage species there was at least for Grewia
spp (e.g Apori, et al., 1998), Croton spp (e.g Hemayet et al., 2012), and A. brevispica (e.g
Abdulrazaak et al., 2000), but none for A. etbaica. Even though thorns and spines are more
important as plant defences against herbivory for mechanically defended plants (A. brevispica and
A. etbaica) it would still be very valuable and informative to look into how nutritional and chemical
composition vary across these forage species. It is therefore highly recommended that any future
study looking into how plant defences, especially chemical defences, influence foraging behaviour
of herbivores should incorporate the aspect of bioassay analysis. This is so because, there are no
known studies up to date that have looked into how the combined effect of chemical or mechanical
defences, nutritive value, and the risk of predation influence foraging behaviours of wild
herbivores. This study, in particular, only looked at the interaction of mechanical defences and
“perceived” chemical defences, coupled with predation risk on foraging behaviour of LMH, but
never looked into detail the influence of nutritional value and chemical content, more so tannin
content, on diet choice.
Another interesting aspect to look into in the future studies would be how predation risk and plant
defences influence the foraging preference of herbivores larger (<50) than impala (e.g buffaloes)
and the mega-herbivores (e.g giraffes, elephants) given that there LOF is different from those of

52
impala and dik-dik and the mega-herbivores are likely to escape both plant defences and predation
(Sinclair et al., 2003).
It is evident that livestock husbandry practices influences the heterogeneity of the savannah
landscapes (Young et al., 1995: Augustine 2004) and this in turn influences the distribution of
trees (Ford et al., 2004) and the diet choice of LMH. It is therefore paramount for the rangeland
managers to recognize that placement and relocation rate of bomas has influence on the foraging
behaviour and diet choice of LMH across a spatial gradient.
53
References
Abdulrazaka, S. A., Fujiharaa, T., Ondiek, J. K., & Ørskov, E. R. (2000). Nutritive evaluation of some
Acacia tree leaves from Kenya. Animal Feed Science and Technology, 85, 89-98.
Abrahams, M. V., & Dill, L. M. (1989). A determination of the energetic equivalence of the risk of
predation. Ecology, 70, 999–1007.
Abrams, P. A. (1995). Implications of dynamically variable traits for identifying, classifying, and
measuring direct and indirect effects in ecological communities. American Naturalist, 146,
112–134.
Abrams, P.A. (1996). Evolution and the consequences of species introductions and deletions. Ecology,
77, 1321–1328.
Altendorf, K. B., Laundre, J. W., Gonzalez, C. A. L., & Brown, J. S. (2001). Assessing effects of
predation risk on foraging behavior of mule deer. Journal of Mammalogy, 82, 430–439.
Anderson, T. M., Hopcraft, J. G. C., Eby, S., Ritchie, M., Grace, J. B., & Olff, H. (2010). Landscape-
scale analyses suggest both nutrient and antipredator advantages to Serengeti herbivore
hotspots. Ecology, 91, 1519-1529.
Apori, S. O., Castro, F. B., Shand, W. J., & Ørskov, E. R. (1998). Chemical composition, in sacco
degradation and in vitro gas production of some Ghanaian browse plants. Animal Feed Science
and Technology, 76, 129-137.
Archer, S., Schimel, D. S., & Holland, E. A. (1995). Mechanisms of shrubland expansion: land use,
climate or CO2? Climatic Change, 29, 91-99.
Augustine, D. J., & McNaughton, S. J. (2004). Regulation of shrub dynamics by native browsing
ungulates on East African rangeland. Journal of Applied Ecology, 41, 45–58.
54
Augustine, D. J. (2002). Large herbivores and process dynamics in a managed savanna ecosystem.
Unpublished doctoral dissertation, Syracuse University, Syracuse.
Augustine, D. J. (2003). Long-term, livestock-mediated redistribution of nitrogen and phosphorus in
an East African savannah. Journal of Applied Ecology, 40, 137–149.
Augustine, D. J. (2004). Influence of cattle management on habitat selection by impala on central
Kenyan rangeland. Journal of Wildlife Management, 68, 916-923.
Augustine, D. J. (2010). Response of native ungulates to drought in semi-arid Kenyan rangeland.
African Journal of Ecology, 48, 1009-1020.
Augustine, D. J., Veblen, K. E., Goheen, J. R., Riginos, C., & Truman, P. Y. (2011). Pathways for
Positive Cattle–Wildlife Interactions in Semiarid Rangelands. In N. J. Georgiadis (Ed),
Conserving Wildlife in African Landscapes: Kenya’s Ewaso Ecosystem (pp. 55–71).
Washington, DC, USA: Smithsonian Institution Scholarly Press.
Barry, T. N., Manley, T. R., & Duncan, S. J. (1986). The role of condensed tannins in the nutritional
value of Lotus pedunculatus for sheep. 4. Sites of carbohydrate and protein digestion as
influenced by dietary reactive tannin concentration. British Journal of Nutrition, 55, 123-137.
Bates, D., Mächler, M., Bolker, B. M., & Walker, S. C. (2015). Fitting Linear Mixed-Effects Models
Using lme4. Journal of Statistical Software, 67. doi: 10.18637/jss.v067.i01
Bednekoff, P. A., & Ritter, R. (1994). Vigilance in Nxai pan springbok, Antidorcas marsupialis.
Behaviour, 129(1), 1-11.
Behmer, S. T., Simpson, S. J., & Raubenheimer, D. (2002). Herbivore Foraging in Chemically
Heterogeneous Environments: Nutrients and Secondary Metabolites. Ecology, 83, 2489-2501.
URL: http://www.jstor.org/stable/3071809 Accessed: 23/11/2014 00:20
55
Belovsky, G. E., & Schmitz, O. J. (1994). Plant Defenses and Optimal Foraging by Mammalian
Herbivores. Journal of Mammalogy, 75, 816-832. URL: http://www.jstor.org/stable/1382464
Accessed: 05/07/2012 01:30
Belovsky, G. E. (1981). Food plant selection by a generalist herbivore: the moose. Ecology, 62, 1020-
1030.
Belovsky, G. E., Schmitz, O. J., Slade, J. B., & Dawson, T. J. (1991). Effects of spines and thorns on
Australian arid zone herbivores of different body masses. Oecologia, 88, 521-528.
Berger, J. (2007). Fear, human shields and the redistribution of prey and predators in protected areas.
Biology Letters, 3, 620–623.
Berger, J., Swenson, J. E., & Persson, I. L. (2001). Recolonizing carnivores and naive prey:
conservation lessons from Pleistocene extinctions. Science, 291, 1036–1039.
Berger, J., & Cunningham, C. (1988). Size-related effects on search times in North American
grassland female ungulates. Ecology, 69, 177–183.
Borchard, F., Berger, H., Bunzel-Drüke, M., & Fartmann, T. (2011). Diversity of plant–animal
interactions: Possibilities for a new plant defence indicator value? Ecological Indicators, 11,
1311–1318.
Brashares, J. S., Garland, T., & Arcese, P. (2000). Phylogenetic analysis of coadaptation in behavior,
diet, and body size in the African antelope. Behavioral Ecology, 11, 452-463.
Briggs, M. A., & Schultz, J. C. (1990). Chemical defense production in Lotus corniculatus L. II. Trade-
offs among growth, reproduction and defense. Oecologia, 83(1), 32-37.
Brown, J. S., & Kotler, B. P. 2004. Hazardous duty pay and the foraging cost of predation. Ecology
Letters, 7, 999–1014.
56
Brown, J. H., Reichman, O. J., & Diane W. Davidson, D. W. (1979). Granivory in Desert Ecosystems.
Annual Review of Ecology and Systematics, 10, 201-227. Stable URL:
http://www.jstor.org/stable/2096790 Accessed: 09-08-2015 12:13 UTC.
Brown, J. S., Laundré, J. W., & Gurung, M. (1999). The Ecology of Fear: Optimal Foraging, Game
Theory, and Trophic Interactions. Journal of Mammalogy, 80, 385-399. URL:
http://www.jstor.org/stable/1383287 Accessed: 26/12/2013 23:53
Brown, J. S. (1988). Patch use as an indicator of habitat preference, predation risk, and competition.
Behavioral Ecology and Sociobiology, 22, 37–47.
Brown, J. S. (1998). Game theory and habitat selection. – In: Dugatkin, L. A. and Reeve, H. K. (Eds),
Game theory and animal behaviour (pp. 188-220). London: Oxford Univ. Press.
Brown, J. S. (1992). Patch use under predation risk: I. Models and prediction. Annales Zoologici
Fennici 29: 301–309.
Brown, J. S., & Mitchell, W. A. (1989). Diet Selection on Depletable Resources. Oikos, 54, 33-43.
Bryant, J. P., Reichardt, P. B., & Clausen, T. P. (1992). Chemically mediated interactions between
woody plants and browsing mammals. Journal of Range Management, 45, 18–24.
Carrascal, L. M., Alonso, C. L., & Lindström, J. (2006). Habitat Use under Latent Predation Risk. A
Case Study with Wintering Forest Birds. Oikos, 112, 51–62. Retrieved from
http://www.jstor.org/stable/3548557.
Cerling, T. E., Harris, J. M., & Passey, B. H. (2003). Diets of East African bovidae based on stable
isotope analysis. Journal of Mammalogy, 84, 456-470.
Charnov, E. L. (1976). Optimal foraging, the marginal value theorem. Theoretical. Population.
Biology, 9, 129-136.

57
Cooper, S. M., & Owen-Smith, N. (1985). Condensed tannins deter feeding by browsing ruminants in
a South-African savanna. Oecologia, 67, 142–146.
Cooper, S. M., & Owen-Smith, N. (1986). Effects of plant spinescence on large mammalian
herbivores. Oecologia, 68, 446-455
Cowlishaw, G. (1997). Trade-offs between foraging and predation risk determine habitat use in a
desert baboon population, Animal Behaviour, 53, 667-686. DOI:
http://dx.doi.org/10.1006/anbe.1996.0298.
Crawley, M. J. (1983). Herbivory. The dynamics of animal-plant interactions. Blackwell Scientific
Publications.
Creel, S. (2011). Toward a predictive theory of risk effects: hypotheses for prey attributes and
compensatory mortality. Ecology, 92, 2190–2195.
Cresswell, W. (2008). Non‐lethal effects of predation in birds. Ibis, 150, 3-17.
Dehn, M. M. (1990). Vigilance for predators - detection and dilution effects. Behavioral Ecology and
Sociobiology, 26, 337–342.
Druce, D. J., Brown, J. S., Kerley, G. I. H., Kotler, B. P., Mackey, R. L., & Slotow, R. (2009). Spatial
and temporal scaling in habitat utilization by klipspringers (Oreotragus oreotragus)
determined using giving-up densities. Austral Ecology, 43, 577–587.
du Toit, J. T. 2003. Large herbivores and savanna heterogeneity. In J. T. du Toit., K. H. Rogers, H. C.
Biggs (Eds.), The Kruger Experience. Ecology and Management of Savanna Heterogeneity
(pp. 292–309). Washington, DC, USA, Island Press.
du Toit, J. T., Bryant, J.P., & Frisby, K. (1990). Regrowth and palatability of Acacia shoots following
pruning by African Savanna browsers. Ecology 71, 140–154.
58
du Toit, J. T., Owen-Smith, N. (1989). Body size, population metabolism, and habitat specialization
among large African herbivores. American Naturalist 133, 736–740.
Emlen, J. M. (1966). The Role of Time and Energy in Food Preference. American Naturalist, 100,
611-617.
Estes, J. A., Konar, B., & Tinker, M. T. (1999). Sea otter population biology and subtidal community
ecology at Shemya Island, Alaska. Final report for Department of Defence Legacy project
number 9401280 & 9510014. U.S. Air Force, Elmendorf Air Force Base, AK.
Estes, J. A., Terborgh, J., Brashares, J. S., Power, M. E., Berger, J., Bond, W. J., Carpenter, S. R.,
Essington, T. E., Holt, R. D., Jackson, B. C., Marquis, R. J., Oksanen, L., Oksanen, T., Paine,
R. T., Pikitch, E. K., Ripple, W. J., Sandin, S. A., Scheffer, M., Schoener, T. W., Shurin, J. B.,
Sinclair, A. R. E., Soule, M. E., Virtanen, R., & Wardle, D. A. (2011). Trophic Downgrading
of Planet Earth. Science, 333, 301-306.
Ford, A. T., & Goheen, J. R. (2015). An experimental study on risk effects in a dwarf antelope,
Madoqua guentheri.. Journal of Mammalogy, 96, 918–926. DOI:10.1093/jmammal/gyv090
Ford, A. T., Goheen, J. R., Otieno, T. O., L. Bidner, L., Isbell, L. A., Palmer, T. M., Ward, D.,
Woodroffe, R., & Pringle, R. M. (2014). Large carnivores make savanna tree communities less
thorny. Science, 346, 346-349.
Fortin, D., & Fortin, M. E. (2009). Group-size-dependent association between food profitability,
predation risk and distribution of free-ranging bison. Animal Behaviour, 78, 887–892.
Fortin, D., Beyer, H. L., Boyce, M. S., Smith, D. W., Duchesne, T. & Mao, J. S. (2005). Wolves
influence elk movements: behaviour shapes a trophic cascade in Yellowstone National Park.
Ecology, 86, 1320–1330.

59
Fournier, D. A., Skaug, H. J., Ancheta, J., Ianelli, J., Magnusson, A., Maunder, M. N., & Sibert, J.
(2012). AD Model Builder: using automatic differentiation for statistical inference of highly
parameterized complex nonlinear models. Optimization Methods and Software, 27(2), 233-
249.
Fritz, H., Duncan, P., Gordon, I. J., & Illius, A. W. (2002). Mega-herbivores influence trophic guilds
structure in African ungulate communities. Oecologia, 131, 620–625.
Frutos P., Hervás, G., Giráldez, F. J., & Mantecón, A. R. (2004). Review. Tannins and ruminant
nutrition. Spanish Journal of Agricultural Research, 2, 191-202.
Georgiadis, N. J. (2011). Introduction: Conserving Wildlife in African Landscapes: Kenya’s Ewaso
Ecosystem. In N. J. Georgiadis (Ed.), Conserving Wildlife in African Landscapes: Kenya’s
Ewaso Ecosystem (pp. 1–10). Washington, DC, USA: Smithsonian Institution Scholarly Press.
Gervasi, V. H. S., Zimmermann, B., Mattisson, J., Wabakken, P., & Linnell, J. D. C. (2013).
Decomposing risk: landscape structure and wolf behavior generate different predation patterns
in two sympatric ungulates. Ecological Applications, 23, 1722–1734.
Gowda, J. H. (1996). Spines of Acacia tortilis: what do they defend and how? Oikos, 77, 279–284.
Harborne, J. B. (1991). The chemical basis of plant defence. In R. T. Palo, C. T. Robbins, (Eds.), Plant
Defences against Mammalian Herbivory (pp. 192). Boca Raton, FL, USA, CRC Press.
Hemayet, H., Howlader, S. I., Dey, S. K., Hira, A., Ahmed, A., Rahman, G. M. Z., & Jahan, F. (2012).
Anti-diarrhoeal Activity and Total Tannin Content of Ethanolic Leaf Extract of Croton
Sparsiflorus. Journal of Pharmaceutical and Bioanalytical Science, 1, 50-55.
Hopcraft, J. G. C., Sinclair, A. R. E., & Packer, C. (2005). Planning for success: Serengeti lions seek
prey accessibility rather than abundance. Journal of Animal Ecology, 74, 559-566.

60
Houston, A. I., McNamara, J. M., & Hutchinson, J. M. C. (1993). General results concerning the trade-
off between gaining energy and avoiding predation. Philosophical Transactions of the Royal
Society of London B, Biological Sciences, 341, 375–397.
Iribarren, C., & Kotler, B. P. (2012). Foraging patterns of habitat use reveal landscape of fear of
Nubian ibex Capra nubiana. Wildlife Biology, 18, 194-201.
Jarman, P. J. (1974). The Social Organisation of Antelope in Relation to Their Ecology. Behaviour,
48, 215-267.
Jeltsch, F., Milton, S. J, Dean, W. R. J., & van Rooyen, N. (1997). Analysing shrub encroachment in
the southern Kalahari: a grid-based modelling approach. Journal of Applied Ecology, 34, 1497-
1508.
Jorg, T., & Jeltsch, F. (2004). Modelling the impact of climate change on woody plant population
dynamics in South African savannah. BMC Ecology, 4, 17.
Kartzinel, T. R., Chen, P.A, Coverdale, T. C., Erickson, D. L., Kress, W. J., Kuzmina, M. L.,
Rubenstein, D. I., Wang, W., & Pringle, R. M. (2015). DNA meta-barcoding illuminates
dietary niche partitioning by African large herbivores. Proceedings of National Academy
Science USA, 112, 8019-8024.
Kingdon, J. (1997). The Kingdon field guide to African mammals. Princeton University press.
Kotler, B. P., Ayal, Y., & Subach, A. (1994). Effects of predatory risk and resource renewal on the
timing of foraging activity in a gerbil community. Oecologia, 100, 391–396.
Kotler, B. P., Brown, J. S., Dall, S. R.X., Gresser, S., Ganey, D., & Bouskila, A. (2002). Foraging
games between gerbils and their predators: temporal dynamics of resource depletion and
apprehension in gerbils. Evolutionary Ecology Research, 4, 495–518.
61
Kuijper, D. P. J., de Kleine, C., Churski, M., van Hooft, P., Bubnicki, J., & Jedrzejewska, B. (2013).
Landscape of fear in Europe: wolves affect spatial patterns of ungulate browsing in Bialowieza
Primeval Forest, Poland. Ecography, 36, 1263–1275.
Lagory, K. E. (1986). Habitat, group size, and the behaviour of white-tailed deer. Behaviour, 98(1),
168-179.
Laundre, J. W., Hernandez, L., & Altendorf, K. B. (2001). Wolves, elk, and bison: re-establishing the
‘‘landscape of fear’’ in Yellowstone National Park, USA. Canadian Journal of Zoology, 79,
1401–1409.
Laundré, J. W., Hernández, L., Medina, P. L., Campanella, A., López-Portillo, J., González-Romero,
A., Browning, D. M. (2014). The landscape of fear: The missing link to understand top-down
and bottom-up controls of prey abundance? Ecology, 95, 1141-1152.
Lima, S. L., & Dill, L. M. (1990). Behavioural decisions made under the risk of predation: review and
prospectus. Canadian Journal of Zoology, 68, 619–640.
Lima, S. L. (1998a). Non-lethal effects in the ecology of predator-prey interactions. BioScience, 48,
25–34.
Lingle, S. (2002). Coyote predation and habitat segregation of white-tailed deer and mule deer.
Ecology, 83, 2037–2048.
Lundberg, P., & Astrom, M. (1990). Low nutritive quality as a defence against optimally foraging
herbivores. American Naturalist, 135, 547–562.
MacArthur, R. H., & Pianka, E. R. (1966). On Optimal Use of a Patchy Environment. American
Naturalist, 100, 603-609.

62
Makin, D. F., Hallam, F., Payne, P., Graham, I., Kerley, H., & Shrader, A. M. (2012). Foraging in a
3-D world: how does predation risk affect space use of vervet monkeys? Journal of
Mammalogy, 93, 422-428.
Manser, M. B., & Brotherton, P. N. M. (1995). Environmental constraints on the foraging behavior of
a dwarf antelope (Madoqua kirkii). Oecologia, 102, 404–412.
Marino, A., & Baldi, R. (2008). Vigilance patterns of territorial guanacos (Lama guanicoe): the role
of reproductive interests and predation risk. Ethology, 114, 413–423.
McNaughton, S. J., & Tarrants, J. L. (1983). Grass leaf silicification: natural selection for an inducible
defense against herbivores. Proceeding of the National Academy of Science USA, 80, 790–
791.
McNaughton, S. J. (1979). Grazing as an Optimization Process: Grass-Ungulate Relationships in the
Serengeti. American Naturalist, 113, 691-703.
Meik, J. M., Jeo, R. M., Mendelson, J. R., & Jenks, K. E. (2002). Effects of bush encroachment on an
assemblage of diurnal lizard species in central Namibia. Biological Conservation, 106, 29-36.
Milewski, A. V., Young, T. P., & Madden, D. (1991). Thorns as induced defenses: experimental
evidence. Oecologia, 86, 70-75.
Moles, A. T., et al. (2013). Correlations between physical and chemical defences in plants: trade-offs,
syndromes, or just many different ways to skin herbivorous cat? New Phytologist, 198, 252–
263.
Molvar, E. M., & Bowyer, R. T. (1994). Costs and benefits of group living in a recently social
ungulate: the Alaskan moose. Journal of Mammalogy, 75, 621-630.
Moorcroft, P. R., Lewis, M. A., & Crabtree, R. L. (2006). Home range analysis using a mechanistic
home range model. Ecology, 80, 1656–1665.
63
Myers, J. H., & Bazaley, D. (1991). Thorns, spines, prickles, and hairs: are they stimulated by
herbivory and do they deter herbivores? In D. J. Tallamy & M. J. Raupp (eds.) Phytochemical
Induction by Herbivores (pp. 326–343). New York, USA, Academic Press.
O'Brien, T. G., & Kinnaird, M. F. (2011). Density estimation of sympatric carnivores using spatially
explicit capture-recapture methods and standard trapping grid. Ecological Applications, 21,
2908-2916.
Odadi, W. O., Abdulrazak, S. A., Karachi, M. M., & Young, T. P. (2011a). African wild ungulates
compete with or facilitate cattle depending on season. Science, 333, 1753-1755.
Odadi, W. O., Jain, O. M., Van Wieren, S. E., Prins, H. H. T., & Rubenstein, D. I. (2011b). Facilitation
between bovids and equids on an African savannah. Evolutionary Ecology Research, 13, 237-
252.
Oksanen, L., Fretwell, S. D., Arruda, J., & Niemela, P. (1981). Exploitation ecosystems in gradients
of primary productivity. American Naturalist, 118, 240-261.
Palo, R. T., Gowda, J., & Hogberg, P. (1993). Species height and root symbiosis, two factors
influencing antiherbivore defense of woody plants in East African savanna. Oecologia, 93,
322–326.
Périquet, S., Todd-Jones, L., Valeix, M., Stapelkamp, B., Elliot, N., Wijers, M., & Macdonald, D. W.
(2012). Influence of immediate predation risk by lions on the vigilance of prey of different
body size. Behavioral Ecology, 23, 970-976.
Pinheiro, J., Bates, D., DebRoy, S., Sarkar, D., & R Core Team. (2015). nlme: Linear and Nonlinear
Mixed Effects Models. R package version 3.1-121, <URL: http://CRAN.R-
project.org/package=nlme>.
64
Power, M. E. (1984a). Depth distributions of armored catfish: predator-induced resource avoidance?
Ecology, 523-528.
Power, M. E. (1984b). Habitat quality and the distribution of algae-grazing catfish in a Panamanian
stream. The Journal of Animal Ecology, 357-374.
Prins, H. T., Grootenhuis, J. G., & Dolan, T. T. (2000). Wildlife conservation by sustainable use.
Boston, Kluwer Academic Publishers.
Prins, H. T., & Douglas-Hamilton, I. (1990). Stability in a multi-species assemblage of large
herbivores in East Africa. Oecologia 83, 392–400.
R Core Team. (2015). R: A language and environment for statistical computing. R Foundation for
Statistical Computing, Vienna, Austria. URL https://www.R-project.org/.
Radloff, F. G., & du Toit, J. T. (2004). Large predators and their prey in a southern African savannah:
a predator’s size determines its prey size range. Journal of Animal Ecology, 73, 410–423.
Riginos, C. (2015). Climate and the landscape of fear in an African savanna. Journal of Animal
Ecology, 84, 124–133
Riginos, C., & Grace, J. B. (2008). Savanna tree density, herbivores, and the herbaceous community:
Bottom-up vs. top-down effects. Ecology, 89, 2228-2238.
Ritchie, M. E., & Olff, H. (1999). Spatial scaling laws yield a synthetic theory of biodiversity. Nature,
400, 557-560.
Robbins, C. T. (1993). Wildlife Feeding and Nutrition. San Diego: Academic Press.
Robbins, C. T., Mole, S., Hagerman, A. E., & Hanley, T. A. (1987). Role of tannins in defending
plants against ruminants: reduction in dry matter digestion. Ecology, 68, 1606–1615.
65
Roques, K. G., O’Connor, T. G., & Watkinson, A. R. (2001). Dynamics of shrub encroachment in an
African savannah: relative influences of fire, herbivory, rainfall and density dependence.
Journal of Applied Ecology, 38, 268–280.
Rosenzweig, M. L. (1973). Exploitation in Three Trophic Levels. The American Naturalist, 107, 275-
294.
Sala, O., Chapin, F., Armesto, J., Berlow, E., Bloomfield, J., Dirzo, R. Section of Biological and Earth
Sciences. (2000). Biodiversity - global biodiversity scenarios for the year 2100. Science, 287,
1770-1774.
Scheel, D. (1993). Watching for lions in the grass: the usefulness of scanning and its effects during
hunts. Animal Behaviour, 46(4), 695-704.
Schmitz, O. J. (2003). Top predator control of plant biodiversity and productivity in an old-field
ecosystem. Ecology Letters, 6, 156–163.
Schmitz, O. J., Krivan, V., & Ovadia, O. (2004). Trophic cascades: the primacy of trait‐mediated
indirect interactions. Ecology Letters, 7(2), 153-163.
Sargeant, B. L., Wirsing, A. J., Heithaus, M. R., & Mann, J. (2007). Can environmental heterogeneity
explain individual foraging variation in wild bottlenose dolphins (Tursiops sp.)? Behavioural
Ecology and Sociobiology, 61, 679–688. DOI 10.1007/s00265-006-0296-8
Sheriff, M. J., Krebs, C. J., & Boonstra, R. (2009). The sensitive hare: sublethal effects of predator
stress on reproduction in snowshoe hares. Journal of Animal Ecology, 78(6), 1249-1258.
Sih, A. (1980). Optimal Behavior: Can Foragers Balance Two Conflicting Demands? Science, 210,
1041-1043.
Sinclair, A. R. E., & Arcese, P. (1995). Population consequences of predation-sensitive foraging: the
Serengeti wildebeest. Ecology, 76, 882–891.
66
Sinclair, A. R. E., Mduma, S., & Brashares, J. S. (2003). Patterns of predation in a diverse predator–
prey system. Nature, 425, 288–290.
Taraborelli, P., Ovejero, R., Torres, M. M., Schroeder, N. M., Moreno, P., Gregorio, P., &
Carmanchahi, P. (2014). Different factors that modify anti-predator behaviour in guanacos
(Lama guanicoe). Acta Theriologica, 59(4), 529-539.
Thaker, M., Vanak, A. T., Owen, C. R., Ogden, M. B., Niemann, S. M., & Slotow, R. (2011).
Minimizing predation risk in a landscape of multiple predators: effects on the spatial
distribution of African ungulates. Ecology, 92, 398-407.
Trolliet, F., Huynen, M., Vermeulen, C., & Hambuckers, A. (2014). Use of camera traps for wildlife
studies. A review. Base, 18, 446-454. URL: http://popups.ulg.ac.be/1780-
4507/index.php?id=11542.
Underwood, R. (1982). Vigilance behavior in grazing African antelopes. Behaviour, 79, 81–104.
Valeix, M., Loveridge, A. J., Chamaille´-Jammes, S., Davidson, Z., Murindagomo, F., Fritz, H., &
Macdonald, D. W. (2009). Behavioral adjustments of African herbivores to predation risk by
lions: Spatiotemporal variations influence habitat use. Ecology, 90(1), 23–30.
Valeix, M., Loveridge, A. J., Chamaillé-Jammes, S., Davidson. Z., Madzikanda, H., MacDonald,
D.W., & Hunt, J. E. (2011). Understanding Patch Departure Rules for Large Carnivores: Lion
Movements Support a Patch-Disturbance Hypothesis. The American Naturalist, 178, 269-275.
van Baalen, M., & Sabelis, M. W. (1993). Coevolution of patch selection strategies of predator and
prey and the consequences for ecological stability. American Naturalist, 646-670.
van der Merwe, M., & Brown, J. S. (2008). Mapping the landscape of fear of the cape ground squirrel
(Xerus inauris). Journal of Mammalogy, 89, 1162-1169.

67
Verdolin, J. L. (2006). Meta-analysis of foraging and predation risk trade-offs in terrestrial systems.
Behavioral Ecology and Sociobiology, 60(4), 457-464.
Ward, D., Spiegel, M., & Saltz, D. (1997). Gazelle herbivory and inter-population differences in
calcium oxalate content of leaves of a desert lily. Journal of Chemical Ecology, 23, 333–346.
Ward, D., & Young, T. P. (2002). Effects of large mammalian herbivores and ant symbionts on
condensed tannins of Acacia drepanolobium in Kenya. Journal of Chemical Ecology, 28, 921-
937.
Whittington, J., Hebblewhite, M., DeCesare, N. J., Neufeld, L., Bradley, M., Wilmshurst, J., &
Musiani, M. (2011). Caribou encounters with wolves increase near roads and trails: a time‐to‐
event approach. Journal of Applied Ecology, 48(6), 1535-1542.
Willems, E. P., & Hill, R. A. (2009). Predator-specific landscapes of fear and resource distribution:
effects on spatial range use. Ecology, 90, 546–555.
Wirsing, A. J., Heithaus, M. R., Frid, A., & Dill, L. M. (2008). Seascapes of fear: evaluating sublethal
predator effects experienced and generated by marine mammals. Marine Mammal Science, 24,
1–15.
Woodroffe, R. (2011). Demography of a recovering African wild dog (Lycaon pictus) population.
Journal of Mammalogy, 92, 305-315.
Young, T. P., Okello, B., Kinyua, D., & Palmer, T. M. (1998). KLEE: a long-term multi-species
herbivore exclusion experiment in Laikipia, Kenya. African Journal of Range and Forage
Science, 14, 92-104.
Young, T. P., Patridge, N., & Maccrae, A. (1995). Long-term glades in acacia bushland and their edge
effects in Laikipia, Kenya. Ecological Applications, 5, 97-108.
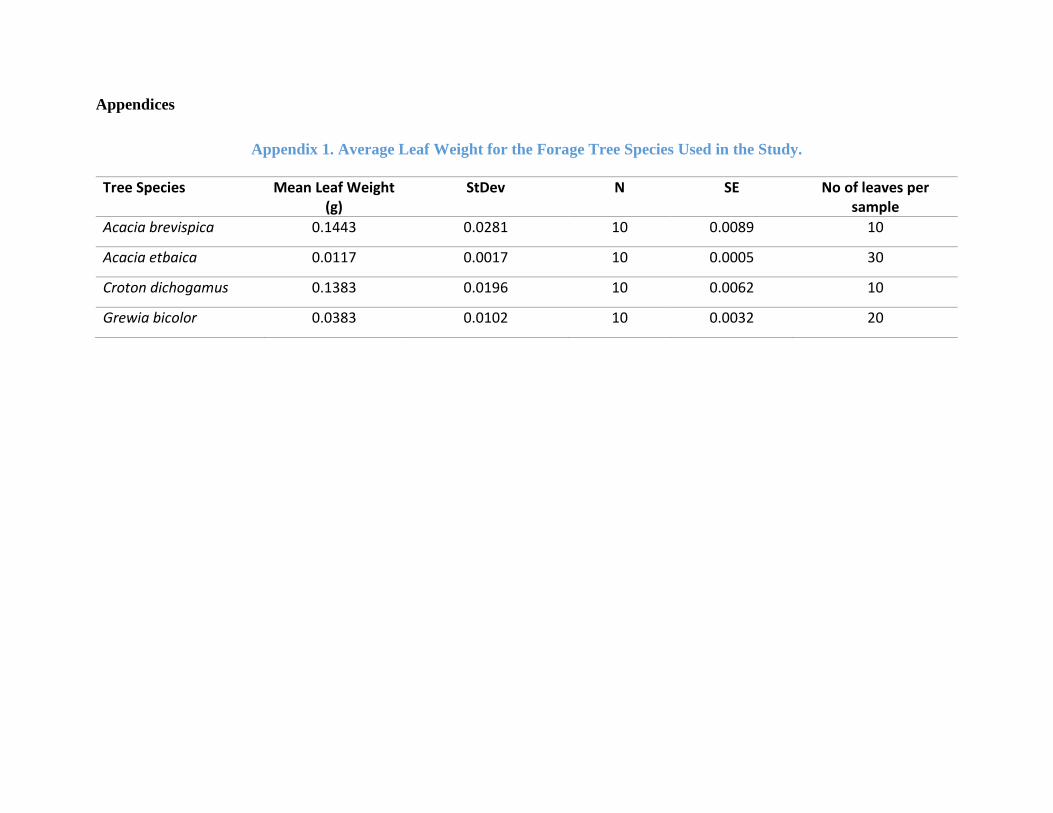
Appendices
Appendix 1. Average Leaf Weight for the Forage Tree Species Used in the Study.
Tree Species Mean Leaf Weight (g)
StDev N SE No of leaves per sample
Acacia brevispica 0.1443 0.0281 10 0.0089 10
Acacia etbaica 0.0117 0.0017 10 0.0005 30
Croton dichogamus 0.1383 0.0196 10 0.0062 10
Grewia bicolor 0.0383 0.0102 10 0.0032 20
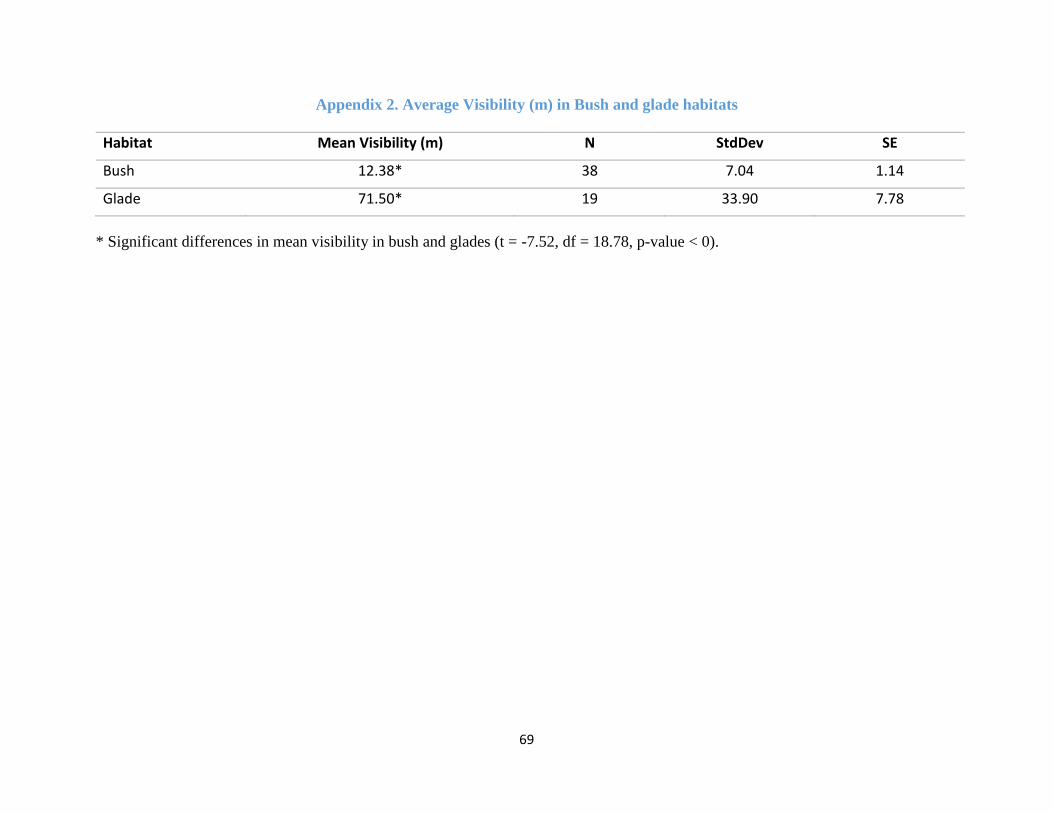
69
Appendix 2. Average Visibility (m) in Bush and glade habitats
Habitat Mean Visibility (m) N StdDev SE
Bush 12.38* 38 7.04 1.14
Glade 71.50* 19 33.90 7.78
* Significant differences in mean visibility in bush and glades (t = -7.52, df = 18.78, p-value < 0).

70
Appendix 3. Summary of Foraging Events Recorded by Camera traps for Impala and Dik-dik.
Impala Mean Count Stdev SE P-value (Tukey test) Bush Open Bush Open Bush Open Bush Open
A. brevispica 51.887 90.673 62 52 78.344 135.954 9.950 18.853 < 0.001
A. etbaica 18.433 68.920 60 50 58.067 132.075 7.496 18.678 < 0.001
Croton dichogamus 27.333 95.188 60 32 29.846 101.197 3.853 17.889 0.037
Grewia bicolor 42.517 116.450 58 40 68.254 138.860 8.962 21.956 0.693
Dik-dik Mean Count Stdev SE
Bush Open Bush Open Bush Open Bush Open
A. brevispica 3.839 0.346 62 52 11.333 1.413 1.439 0.196 0.006
A. etbaica 5.250 1.960 60 50 10.809 6.803 1.395 0.962 0.815
Croton dichogamus 0.717 0.000 60 32 2.248 0.000 0.290 0.000 #
Grewia bicolor 2.431 0.625 58 40 5.252 1.944 0.690 0.307 0.246
# No dik-dik was recorded by the camera traps feeding on Croton dichogamus in the open (glade) habitats.

Appendix 4. Summary Statistics for Biomass Density (g/cm) removed by Impala and Dik-dik
Upper branches (Impala)
Mean Stdev N SE P-Values ANOVA Statistics Bush Open Bush Open Bush Open Bush Open
A. brevispica 0.040 0.059 0.032 0.042 48 26 0.005 0.008 0.036* F(1,59) = 4.592 A. etbaica 0.008 0.009 0.009 0.010 55 28 0.001 0.002 0.549 F(1,67) = 0.363 Croton dichogamus 0.008 0.011 0.012 0.016 45 24 0.002 0.003 0.647 F(1,57) = 0.213 Grewia bicolor 0.032 0.043 0.031 0.032 44 22 0.005 0.007 0.078 F(1,52) = 3.236
Lower Branches (Dik-dik)
Mean Stdev N SE
Bush Open Bush Open Bush Open Bush Open
A. brevispica 0.037 0.049 0.026 0.042 48 26 0.004 0.008 0.194 F(1,59) = 1.730 A. etbaica 0.008 0.008 0.007 0.008 55 28 0.001 0.001 0.848 F(1,67) = 0.037 Croton dichogamus 0.008 0.014 0.014 0.020 45 24 0.002 0.004 0.156 F(1,57) = 2.072 Grewia bicolor 0.026 0.037 0.024 0.028 44 22 0.004 0.006 0.048* F(1,52) = 4.086
Upper & lower branches (Impala & Dik-dik)
Mean Stdev N SE
Bush Open Bush Open Bush Open Bush Open
A. brevispica 0.038 0.053 0.024 0.037 48 26 0.004 0.007 0.028* F(1,59) = 5.093 A. etbaica 0.008 0.008 0.006 0.008 55 28 0.001 0.002 0.817 F(1,67) = 0.054 Croton dichogamus 0.008 0.012 0.012 0.016 45 24 0.002 0.003 0.031* F(1,57) = 1.060 Grewia bicolor 0.029 0.039 0.024 0.025 44 22 0.004 0.005 0.014* F(1,52) = 4.351
* Indicate significant difference at p = 0.05

72
Appendix 5. Statistic Summary for Proportion (%) of Biomass Density removed by Impala and Dik-dik.
Upper branches (Impala)
Mean Stdev N SE P-Values ANOVA Statistics Bush Open Bush Open Bush Open Bush Open
A. brevispica 0.555 0.724 0.348 0.295 48 26 0.050 0.058 0.074 F(1,59) = 3.312 A. etbaica 0.388 0.525 0.277 0.307 55 28 0.037 0.058 0.102 F(1,67) = 2.746 Croton dichogamus 0.079 0.094 0.104 0.128 45 24 0.015 0.026 0.978 F(1,57) = 0.001 Grewia bicolor 0.529 0.744 0.333 0.305 44 22 0.050 0.065 0.014* F(1,52) = 6.415
Lower Branches (Dik-dik)
Mean Stdev N SE
Bush Open Bush Open Bush Open Bush Open
A. brevispica 0.542 0.595 0.362 0.331 48 26 0.052 0.065 0.330 F(1,59) = 0.966 A. etbaica 0.586 0.571 0.288 0.251 55 28 0.039 0.047 0.850 F(1,67) = 0.036 Croton dichogamus 0.098 0.139 0.164 0.179 45 24 0.024 0.037 0.196 F(1,57) = 1.714 Grewia bicolor 0.554 0.734 0.351 0.299 44 22 0.053 0.064 0.069 F(1,52) = 3.447
Upper & lower branches (Impala & Dik-dik)
Mean Stdev N SE
Bush Open Bush Open Bush Open Bush Open
A. brevispica 0.558 0.679 0.322 0.259 48 26 0.046 0.051 0.043* F(1,59) = 4.268 A. etbaica 0.498 0.561 0.234 0.244 55 28 0.032 0.046 0.298 F(1,67) = 1.102 Croton dichogamus 0.089 0.107 0.121 0.129 45 24 0.018 0.026 0.392 F(1,57) = 0.744 Grewia bicolor 0.539 0.739 0.303 0.285 44 22 0.046 0.061 0.032* F(1,52) = 4.871
* Indicate significant difference at p = 0.05
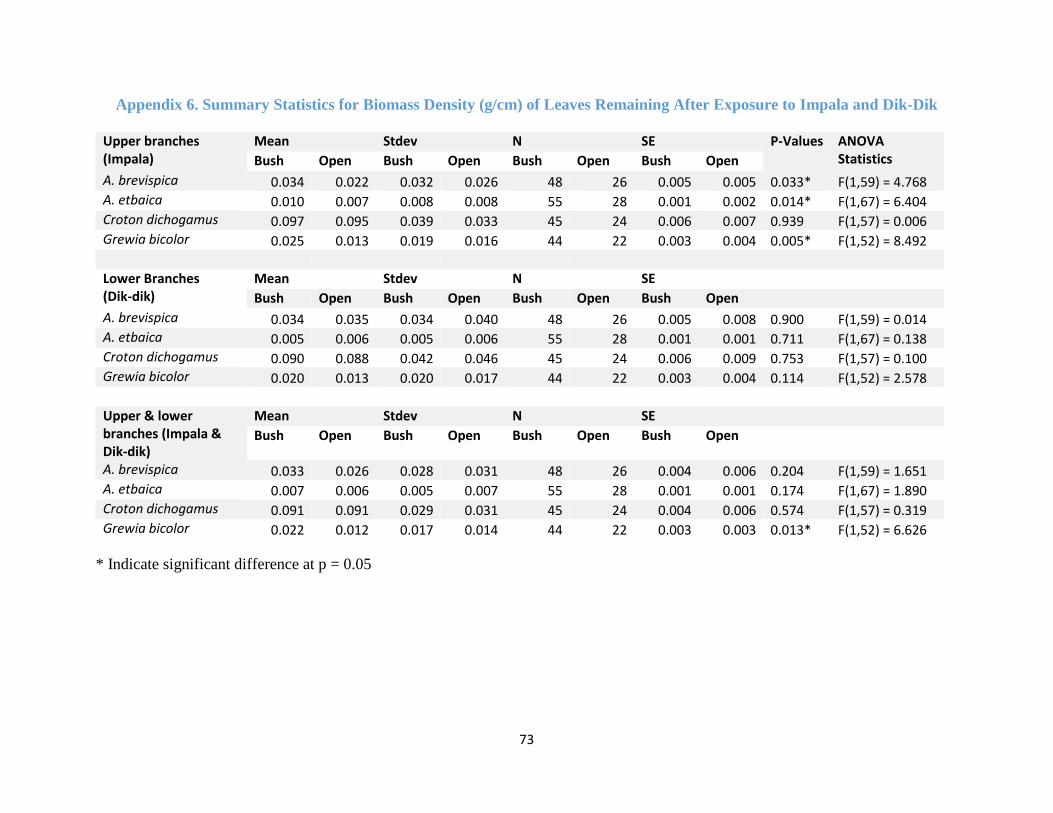
73
Appendix 6. Summary Statistics for Biomass Density (g/cm) of Leaves Remaining After Exposure to Impala and Dik-Dik
Upper branches (Impala)
Mean Stdev N SE P-Values ANOVA Statistics Bush Open Bush Open Bush Open Bush Open
A. brevispica 0.034 0.022 0.032 0.026 48 26 0.005 0.005 0.033* F(1,59) = 4.768 A. etbaica 0.010 0.007 0.008 0.008 55 28 0.001 0.002 0.014* F(1,67) = 6.404 Croton dichogamus 0.097 0.095 0.039 0.033 45 24 0.006 0.007 0.939 F(1,57) = 0.006 Grewia bicolor 0.025 0.013 0.019 0.016 44 22 0.003 0.004 0.005* F(1,52) = 8.492
Lower Branches (Dik-dik)
Mean Stdev N SE
Bush Open Bush Open Bush Open Bush Open
A. brevispica 0.034 0.035 0.034 0.040 48 26 0.005 0.008 0.900 F(1,59) = 0.014 A. etbaica 0.005 0.006 0.005 0.006 55 28 0.001 0.001 0.711 F(1,67) = 0.138 Croton dichogamus 0.090 0.088 0.042 0.046 45 24 0.006 0.009 0.753 F(1,57) = 0.100 Grewia bicolor 0.020 0.013 0.020 0.017 44 22 0.003 0.004 0.114 F(1,52) = 2.578
Upper & lower branches (Impala & Dik-dik)
Mean Stdev N SE
Bush Open Bush Open Bush Open Bush Open
A. brevispica 0.033 0.026 0.028 0.031 48 26 0.004 0.006 0.204 F(1,59) = 1.651 A. etbaica 0.007 0.006 0.005 0.007 55 28 0.001 0.001 0.174 F(1,67) = 1.890 Croton dichogamus 0.091 0.091 0.029 0.031 45 24 0.004 0.006 0.574 F(1,57) = 0.319 Grewia bicolor 0.022 0.012 0.017 0.014 44 22 0.003 0.003 0.013* F(1,52) = 6.626
* Indicate significant difference at p = 0.05
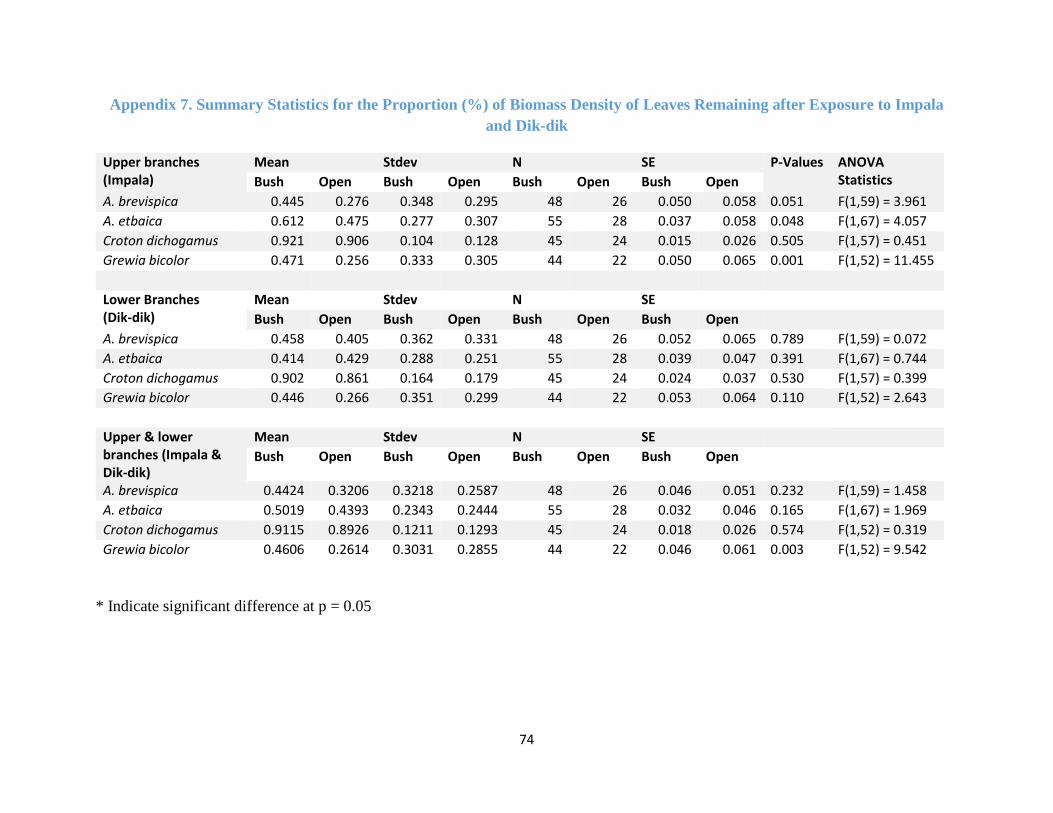
74
Appendix 7. Summary Statistics for the Proportion (%) of Biomass Density of Leaves Remaining after Exposure to Impala
and Dik-dik
Upper branches (Impala)
Mean Stdev N SE P-Values ANOVA Statistics Bush Open Bush Open Bush Open Bush Open
A. brevispica 0.445 0.276 0.348 0.295 48 26 0.050 0.058 0.051 F(1,59) = 3.961
A. etbaica 0.612 0.475 0.277 0.307 55 28 0.037 0.058 0.048 F(1,67) = 4.057
Croton dichogamus 0.921 0.906 0.104 0.128 45 24 0.015 0.026 0.505 F(1,57) = 0.451
Grewia bicolor 0.471 0.256 0.333 0.305 44 22 0.050 0.065 0.001 F(1,52) = 11.455
Lower Branches (Dik-dik)
Mean Stdev N SE
Bush Open Bush Open Bush Open Bush Open
A. brevispica 0.458 0.405 0.362 0.331 48 26 0.052 0.065 0.789 F(1,59) = 0.072
A. etbaica 0.414 0.429 0.288 0.251 55 28 0.039 0.047 0.391 F(1,67) = 0.744
Croton dichogamus 0.902 0.861 0.164 0.179 45 24 0.024 0.037 0.530 F(1,57) = 0.399
Grewia bicolor 0.446 0.266 0.351 0.299 44 22 0.053 0.064 0.110 F(1,52) = 2.643
Upper & lower branches (Impala & Dik-dik)
Mean Stdev N SE
Bush Open Bush Open Bush Open Bush Open
A. brevispica 0.4424 0.3206 0.3218 0.2587 48 26 0.046 0.051 0.232 F(1,59) = 1.458
A. etbaica 0.5019 0.4393 0.2343 0.2444 55 28 0.032 0.046 0.165 F(1,67) = 1.969
Croton dichogamus 0.9115 0.8926 0.1211 0.1293 45 24 0.018 0.026 0.574 F(1,52) = 0.319
Grewia bicolor 0.4606 0.2614 0.3031 0.2855 44 22 0.046 0.061 0.003 F(1,52) = 9.542
* Indicate significant difference at p = 0.05