Digitization of Colorimetric Measurements for quantitave ...
47
OPEN UNIVERSITY OF CATALONIA DIGITIZATION OF COLORIMETRIC MEASUREMENTS FOR QUANTITAVE ANALYSES USING A SMARTPHONE By MANUEL AGUDO ACEMEL Proffesors Co-directing the Thesis: Enrique Guaus Termens Asun Munoz Fernandez A Master Thesis submitted to the Department of Computer Science in partial fulfillment of the requirements for the degree of Master in Multimedia Applications 2017 Copyright c 2017 Manuel Agudo Acemel. All Rights Reserved.
Transcript of Digitization of Colorimetric Measurements for quantitave ...

OPEN UNIVERSITY OF CATALONIA
DIGITIZATION OF COLORIMETRIC MEASUREMENTS FOR QUANTITAVE ANALYSES
USING A SMARTPHONE
By
MANUEL AGUDO ACEMEL
Proffesors Co-directing the Thesis:Enrique Guaus TermensAsun Munoz Fernandez
A Master Thesis submitted to theDepartment of Computer Science
in partial fulfillment of therequirements for the degree of
Master in Multimedia Applications
2017
Copyright c© 2017 Manuel Agudo Acemel. All Rights Reserved.

ACKNOWLEDGMENTS
I wish to thank the ECSens research group for helping me with the experiments carried out in this
work. Special thanks to Maria, Alfonso and Fermin to provide me knowledge about this field. I
thank as well the co-directors of my thesis for guiding me through the elaboration.
i

TABLE OF CONTENTS
List of Figures . . . . . . . . . . . . . . . . . . . . . . . . . . . . . . . . . . . . . . . . . . . . iv
List of Tables . . . . . . . . . . . . . . . . . . . . . . . . . . . . . . . . . . . . . . . . . . . . . vi
Abstract . . . . . . . . . . . . . . . . . . . . . . . . . . . . . . . . . . . . . . . . . . . . . . . . vii
1 Introduction 1
1.1 Motivation . . . . . . . . . . . . . . . . . . . . . . . . . . . . . . . . . . . . . . . . . 1
1.2 Objective . . . . . . . . . . . . . . . . . . . . . . . . . . . . . . . . . . . . . . . . . . 2
1.3 Research questions . . . . . . . . . . . . . . . . . . . . . . . . . . . . . . . . . . . . . 2
1.4 Research methodology . . . . . . . . . . . . . . . . . . . . . . . . . . . . . . . . . . . 2
1.4.1 Research Strategy . . . . . . . . . . . . . . . . . . . . . . . . . . . . . . . . . 2
1.4.2 Evaluation . . . . . . . . . . . . . . . . . . . . . . . . . . . . . . . . . . . . . 3
2 State of art 4
2.1 Colorimetry . . . . . . . . . . . . . . . . . . . . . . . . . . . . . . . . . . . . . . . . . 4
2.1.1 What is color? . . . . . . . . . . . . . . . . . . . . . . . . . . . . . . . . . . . 4
2.1.2 Colorimetry . . . . . . . . . . . . . . . . . . . . . . . . . . . . . . . . . . . . . 5
2.1.3 Color Space . . . . . . . . . . . . . . . . . . . . . . . . . . . . . . . . . . . . . 6
2.2 Devices for measuring color . . . . . . . . . . . . . . . . . . . . . . . . . . . . . . . . 8
2.2.1 Ultraviolet-visible spectrophotometer . . . . . . . . . . . . . . . . . . . . . . . 8
2.2.2 Colorimeter . . . . . . . . . . . . . . . . . . . . . . . . . . . . . . . . . . . . . 8
2.2.3 Image sensors . . . . . . . . . . . . . . . . . . . . . . . . . . . . . . . . . . . . 8
2.3 Color Image processing . . . . . . . . . . . . . . . . . . . . . . . . . . . . . . . . . . . 9
2.3.1 Introduction . . . . . . . . . . . . . . . . . . . . . . . . . . . . . . . . . . . . 9
2.3.2 RGB color space . . . . . . . . . . . . . . . . . . . . . . . . . . . . . . . . . . 10
2.3.3 Normalized RGB . . . . . . . . . . . . . . . . . . . . . . . . . . . . . . . . . . 12
2.3.4 HSV color space . . . . . . . . . . . . . . . . . . . . . . . . . . . . . . . . . . 12
2.3.5 White calibration . . . . . . . . . . . . . . . . . . . . . . . . . . . . . . . . . . 13
2.3.6 Thresholding and edge dectectors . . . . . . . . . . . . . . . . . . . . . . . . . 13
ii

2.4 Optical sensors . . . . . . . . . . . . . . . . . . . . . . . . . . . . . . . . . . . . . . . 14
3 Artefact design 18
3.1 Printed sulphide optical sensor . . . . . . . . . . . . . . . . . . . . . . . . . . . . . . 18
3.2 Pattern design . . . . . . . . . . . . . . . . . . . . . . . . . . . . . . . . . . . . . . . 19
3.3 Printing optical sensors . . . . . . . . . . . . . . . . . . . . . . . . . . . . . . . . . . 19
3.4 Optical sensor reaction . . . . . . . . . . . . . . . . . . . . . . . . . . . . . . . . . . . 20
3.5 Evaluation of the reaction using a spectrophotometer . . . . . . . . . . . . . . . . . . 21
3.6 Analysis of the requirements . . . . . . . . . . . . . . . . . . . . . . . . . . . . . . . . 25
4 Results 26
4.1 Image capture . . . . . . . . . . . . . . . . . . . . . . . . . . . . . . . . . . . . . . . . 26
4.2 Image processing . . . . . . . . . . . . . . . . . . . . . . . . . . . . . . . . . . . . . . 26
4.2.1 Normalized RGB . . . . . . . . . . . . . . . . . . . . . . . . . . . . . . . . . . 29
4.2.2 HSV color space . . . . . . . . . . . . . . . . . . . . . . . . . . . . . . . . . . 31
4.2.3 White background calibration . . . . . . . . . . . . . . . . . . . . . . . . . . . 33
5 Conclusions 37
Bibliography . . . . . . . . . . . . . . . . . . . . . . . . . . . . . . . . . . . . . . . . . . . . . 38
iii

LIST OF FIGURES
2.1 The spectral power distribution . . . . . . . . . . . . . . . . . . . . . . . . . . . . . . . 4
2.2 Human spectral sensitivity to color . . . . . . . . . . . . . . . . . . . . . . . . . . . . . 5
2.3 The C.I.E. Chromaticity Diagram . . . . . . . . . . . . . . . . . . . . . . . . . . . . . 6
2.4 Examples of color spaces . . . . . . . . . . . . . . . . . . . . . . . . . . . . . . . . . . 7
2.5 Additive color reproduction RGB . . . . . . . . . . . . . . . . . . . . . . . . . . . . . . 7
2.6 Bayer filter used in Complementary Metal-Oxide Semiconductor (CMOS) image sensor 9
2.7 sRGB space . . . . . . . . . . . . . . . . . . . . . . . . . . . . . . . . . . . . . . . . . . 10
2.8 RGB color space . . . . . . . . . . . . . . . . . . . . . . . . . . . . . . . . . . . . . . . 11
2.9 A 4x3 pixel array . . . . . . . . . . . . . . . . . . . . . . . . . . . . . . . . . . . . . . . 11
2.10 HSV color space [17] . . . . . . . . . . . . . . . . . . . . . . . . . . . . . . . . . . . . . 13
2.11 Cube Light Box [2] . . . . . . . . . . . . . . . . . . . . . . . . . . . . . . . . . . . . . . 15
2.12 Correlation between TNT concentration and RGB values [22] . . . . . . . . . . . . . . 15
2.13 An opto-mechanical attachment installed at the back of the cellphone [23] . . . . . . . 16
3.1 Printed Sensors workflow . . . . . . . . . . . . . . . . . . . . . . . . . . . . . . . . . . 18
3.2 Pattern design . . . . . . . . . . . . . . . . . . . . . . . . . . . . . . . . . . . . . . . . 19
3.3 Printing Optical Sensors . . . . . . . . . . . . . . . . . . . . . . . . . . . . . . . . . . . 20
3.4 Optical sensor reaction . . . . . . . . . . . . . . . . . . . . . . . . . . . . . . . . . . . 21
3.5 RGB values for each reaction using a spectrophotometer . . . . . . . . . . . . . . . . . 23
3.6 Complementary colors diagram . . . . . . . . . . . . . . . . . . . . . . . . . . . . . . . 24
4.1 Light box and ROI . . . . . . . . . . . . . . . . . . . . . . . . . . . . . . . . . . . . . . 27
4.2 RGB values comparison among devices . . . . . . . . . . . . . . . . . . . . . . . . . . 29
4.3 Normalized RGB values comparison among devices . . . . . . . . . . . . . . . . . . . . 30
4.4 H parameter representation . . . . . . . . . . . . . . . . . . . . . . . . . . . . . . . . . 32
4.5 H parameter comparison . . . . . . . . . . . . . . . . . . . . . . . . . . . . . . . . . . 33
iv

4.6 Normalized blue for each reaction . . . . . . . . . . . . . . . . . . . . . . . . . . . . . 34
4.7 Blue Ratio values from the three devices . . . . . . . . . . . . . . . . . . . . . . . . . . 36
v

LIST OF TABLES
3.1 RGB values for each reaction using a spectrophotometer . . . . . . . . . . . . . . . . . 22
3.2 Blue intensity for each reaction . . . . . . . . . . . . . . . . . . . . . . . . . . . . . . . 24
4.1 RGB values and number of pixels for each reaction (Samsung) . . . . . . . . . . . . . 27
4.2 RGB values and number of pixels for each reaction (LG) . . . . . . . . . . . . . . . . 28
4.3 RGB values and number of pixels for each reaction (Iphone) . . . . . . . . . . . . . . 28
4.4 H values collected by the three smartphones . . . . . . . . . . . . . . . . . . . . . . . 32
4.5 RGB values of the nylon substrate . . . . . . . . . . . . . . . . . . . . . . . . . . . . . 34
4.6 Blue ratio of each reaction . . . . . . . . . . . . . . . . . . . . . . . . . . . . . . . . . 35
vi

ABSTRACT
A programmable smartphone connected to a built-in image sensor is a portable and low cost instru-
ment for analysis based on chromogenic reagents. The RGB values collected from an image are used
to quantify concentrations in colorimetric tests. Measuring color demands a sufficient and constant
illumination to report results with great accuracy and repeatability. However, a smartphone cap-
turing an image is involved in issues related to ambient light variability. A smartphone application
may be supported by a wide variety of devices, employing different camera technologies. The color
pixels values are expressed in different ways depending on the software used for processing the
image. This research is attempting to identify and evaluate existing image processing techniques
in order to design a Mobile Sensing System (MSS) to quantify the concentration of an analyzed
substance by collecting the color information contained in the image pixels.
vii

CHAPTER 1
INTRODUCTION
1.1 Motivation
The smartphone applications developed for quantitative analysis purposes based on colorimetric
detection are increasing in the latest years. These applications are based on correlations between
the RGB values of an image and the concentrations of a substance in a specific environment.
Basically this type of analysis use a membrane containing a chromogenic reagent that experiments
a color change while the concentration of a specific substance is varying, typically classified as
optical sensors.
This research is motivated by a previous personal experience working on optical sensors. The
results of these previous works, made in collaboration with other authors, are summarized in two
published papers [1] [2]. As described in these publications, the presence or absence of substances
such us heavy metals and sulphide in water can be quantified by collecting the color pixels from
a digital image. This quantification method simplifies the analytical procedure through allowing
analyses of colorimetric tests in situ and out of lab. The images analyzed are captured using a
digital camera. Then, the images are processed by an ad hoc developed PC software that allows
the user to quantify the concentration.
This procedure opens the door to the design of a mobile sensing system capable to quantify a
concentration by gathering the color information of an image captured by a smartphone camera.
Therefore, there is a need to further research this topic to explore its use employing a smartphone
as a color measuring device. Their advantages include the portable capability of the artefact and
the reduction of costs. However, a smartphone application may be used by a wide variety of devices.
The mobile devices technology vary in depend on price, date of acquisition, brand, operative system,
and so on. This fact requires applications with inter-phone repeatability. Moreover, capturing
images from a mobile device involves a great variability on parameters such as pixel resolution, ISO
number, white calibration, and every configurable setting in a color camera. This variability has a
direct and profound impact on color quantification.
1

1.2 Objective
This research is attempting to identify the existing algorithms used for color image processing
and evaluate them through designing a prototype able to quantify the concentration of an analyzed
substance by a correlation to the color information of the image pixels. A color quantification is
required, the application needs to be able to obtain colorimetric values that describe the measured
color and determine the concentration of a substance after the reaction of an optical sensor.
1.3 Research questions
The main questions that required responses are:
• Is a smartphone a capable device for quantifying the concentration of a substance in colori-
metric tests?
• How an image can be processed in order to report results with inter-phone repeatability?
1.4 Research methodology
Color image pixels and substance concentration are the two variables in the research data
generation. The pixels collection provides numerical data that can be used in a quantitative analysis.
The result obtained after correlate the two variables provides relevant information for designing
the artefact. The improvement of the artefact requires both, the manipulation of the pixel data
and the evaluation of the results obtained after the action.
1.4.1 Research Strategy
The research is involved in the following process:
• Analyze the quantification procedure in a colorimetric test.
• Design a prototype to solve the problems described.
• Evaluate the design.
• Provide results.
2

1.4.2 Evaluation
The application needs to be evaluated to demonstrate that the artefact designed meets the
objective established. In this way, the results will show if the artifact is able or not to solve the
problem described. The accuracy of the artefact will be qualified by the comparison with a reference
measuring instrument. On the other hand, the inter-phone repeatability will be qualified trough a
comparison among images captured from different smartphones technologies.
1. Evaluate the accuracy of the quantification: the reaction of the chromogenic reagents are
measured using both, a spectrophotometer as a measuring instrument and the smartphone
application. The data is compared to qualify the artefact and evaluate the accuracy.
2. Evaluate the inter-phone repeatability: different images obtained from different devices are
tested in an equal environment in order to evaluate the behavior of the artifact facing problems
described such as image size or device technologies variability.
3

CHAPTER 2
STATE OF ART
2.1 Colorimetry
2.1.1 What is color?
Color is a sensation created in response to excitation of our visual system by electromagnetic
radiation or light. In other words, color is the perception generated in the brain when the light
reach the retina. The light perceived is constrained by the visible region of the electromagnetic
spectrum with wavelengths in an approximated range from 400nm to 700nm. Color can be de-
scribing accurately by measuring the physical power or radiance of the incident light. The result
is a spectral power distribution (SPD), commonly divided into 31 areas, each representing a 10nm
band (figure 2.1). [3]
Figure 2.1: The spectral power distribution
The human retina contains cones, three types of color photo-receptor cells which respond to
radiation at different spectral sensitivity peaks in short (S, 420 nm to 440 nm), middle (M, 530
nm to 540 nm), and long (L, 560 nm to 580 nm), represented in figure 2.2. A fourth type of
4

photo-receptor cells, called rods, are also present in the retina. Rods cells are more numerous and
sensitive than cone cells. However their functions are focused on vision with low light intensity,
having almost no role in color vision.
Figure 2.2: Human spectral sensitivity to color
2.1.2 Colorimetry
In color science, colorimetry is the area responsible of giving a description and a specification
of a color. Based on the fact that the human eye use three types of color photo-receptor cone
cells, three numerical values are needed to describe a color. The figure 2.3 shows the Commission
internationale de l’clairage (CIE) chromaticity diagram, where any visible color can be mapped by
defining the tristimulus value [4] [5].
5

Figure 2.3: The C.I.E. Chromaticity Diagram
Nonetheless, a color can be described by the combination between brightness and chromaticity.
For instance, a color white is a bright version of a color grey, being equal in chromaticity and
different in brightness. In the CIE XYZ color space the Y parameter is a measure of luminance.
The chromaticity of a color is then specified by the two derived parameters x and y, two of the
three normalized values being functions of all three tristimulus values X, Y, and Z [6]
x = X/(X + Y + Z) (2.1)
y = Y/(X + Y + Z) (2.2)
z = Z/(X + Y + Z) = 1 − x+ y (2.3)
2.1.3 Color Space
A color space or color model is formed by a set of numerical values able to define a singular
color. The three components of a color can be defined as many different ways as color spaces
existing. Color in multimedia applications demands a suitable method for representing the color
signal perceived by a device. Selecting a color representation must to take into account how the
6
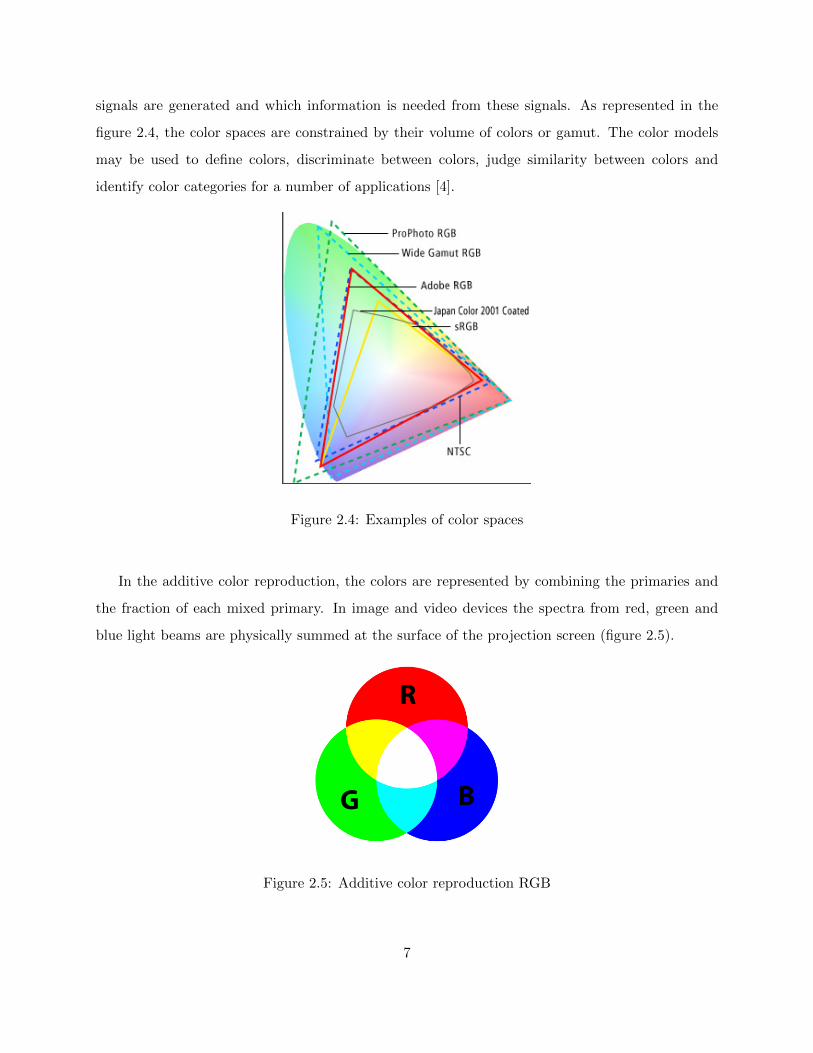
signals are generated and which information is needed from these signals. As represented in the
figure 2.4, the color spaces are constrained by their volume of colors or gamut. The color models
may be used to define colors, discriminate between colors, judge similarity between colors and
identify color categories for a number of applications [4].
Figure 2.4: Examples of color spaces
In the additive color reproduction, the colors are represented by combining the primaries and
the fraction of each mixed primary. In image and video devices the spectra from red, green and
blue light beams are physically summed at the surface of the projection screen (figure 2.5).
Figure 2.5: Additive color reproduction RGB
7

2.2 Devices for measuring color
2.2.1 Ultraviolet-visible spectrophotometer
Ultraviolet-visible spectroscopy or ultraviolet-visible spectrophotometry (UV-Vis or UV/Vis)
refers to absorption spectroscopy or reflectance spectroscopy in the ultraviolet-visible spectral re-
gion, using light in the visible and adjacent (near-UV and near-infrared) ranges. The absorption
or reflectance in the visible range directly affects the perceived color of the chemicals involved [7].
2.2.2 Colorimeter
A colorimeter is a device used in colorimetry. The device measures the absorbance of particular
wavelengths of light by a specific solution. This device is most commonly used to determine the
concentration of a known solute in a given solution by the application of the Beer-Lambert law,
which states that the concentration of a solute is proportional to the absorbance. [8].
2.2.3 Image sensors
The spectacular growth of the mobile application development converts a smartphone in a
multitask device. Cameras, GPS, microphone, accelerometer... are embedded sensors that bring
an opportunity to develop new applications useful to society. Nowdays we can find apps used
for social networks, healthcare, entertainment, education, safety, data analysis, not only using the
built-in sensors but also external ones. The advance of technology allows to reduce the unit build
cost of the embedded sensors and the devices is becoming in a low cost way to report or take
actions by managing the behavior of a sensor[9]. All these circumstances give rise to the area of
mobile phone sensing research. A MSS requires a user level application running on the phone for
reading an internal phone sensor, or external sensors, reporting sensed data. For this purpose,
the phone operating system must offer an Application Programming Interface (API) to manage
the data reading and reporting [10]. During the latest years smartphone cameras have been used
across a wide variety of domains in computer vision researches trying to emulate the basic functions
of the human vision system. The analysis of the user environment through images and videos is
a very interesting point in safety applications [11] and also in applications for users suffering from
visual impairment [12].
Smartphone cameras can be used as well for colorimetric detection through processing the RGB
values from the pixels of an image. In that case, mobile devices can be used in bioanalysis with a
8

wide variety of Cellphone-based quantitative analysis [13]. Today smartphones come with at least
one camera to get images and videos. The method used to digitize images is a Bayer filter mosaic,
a color filter array for arranging RGB color filters on a square grid of photosensors. Its particular
arrangement of color filters is used in most single-chip digital image sensors installed in cameras and
scanners to create a color image. The figure 2.6 is representing the pattern formed by 50 percent of
green, 25 percent of red and 25 percent of blue, hence is also called RGBG, GRGB, or RGGB[14].
Figure 2.6: Bayer filter used in Complementary Metal-Oxide Semiconductor (CMOS)image sensor
2.3 Color Image processing
2.3.1 Introduction
The common used smartphones operative systems provide a software to manage different camera
settings such as white balance, focus, zoom, flash and in some cases (smartcameras) time exposure
and aperture parameters. Once the image has been captured is digitalize and compressed usually
in a JPG format with an embedded sRGB ICC profile represented in figure 2.7. Images are formed
by a matrix of pixels, each pixel contain values for each canal R G B.
9

Figure 2.7: sRGB space
2.3.2 RGB color space
Basically, an RGB color model is a set of colors defined by the chromaticity of red, green and
blue. It can be represented in a cube containing as many colors as possible primaries combinations,
where the brightest point corresponds to the coordinate (1,1,1) and (0,0,0) to the darkest one. Each
color contains the intensity of each channel and are expressed from 0 to 1 (when the values are
normalized), integer values (i.e: 0-255) and percentage per channel among others.
10

Figure 2.8: RGB color space
A digital image can be described as a set of digital values or pixels. A pixel is the smallest
individual element in an image containing the color information for each position inside a two
dimensional array (figure 2.9). The amount of pixels inside an image vary in depend on the image
acquisition resolution. The resolution of an image is expressed as an NxM matrix, where N is the
number of pixels columns (image width) and M is the number of pixels rows (image heigth).
Figure 2.9: A 4x3 pixel array
11

2.3.3 Normalized RGB
Normalized RGB is a representation which is easily obtained from the RGB values by a simple
normalization procedure:
r = R/(R+G+B) (2.4)
g = G/(R+G+B) (2.5)
b = B/(R+G+B) = 1 − r + g (2.6)
Since the sum of the three normalized components is known, the third component can be omitted,
reducing the space dimensionality. The normalized values or pure colors, do not take into account
the brightness parameter, they are only defining the chromaticity of r and g. Normalizing RGB
values is an interesting point to avoid the effects of illuminant variability on matte surfaces[15][16].
2.3.4 HSV color space
HSL, HSV, HSI, or related models are commonly used in computer vision and image analysis
for colorimetric detection or image segmentation. It is very useful in applications focused on object
detection, object recognition and image analysis among others. The R, G, and B intensities in a
digital image are depending on the intensity of light reflected by an object. For that reason, image
analysis are better described using parameters such as hue, lightness and saturation. The hue is
the parameter representing the chromaticity of the color perceived (yellow, red, blue...), lightness
is the brightness relative to the brightness of a similarly illuminated white and saturation is the
perceived intensity of a specific hue (figure 2.10) [1] [17] [18].
12
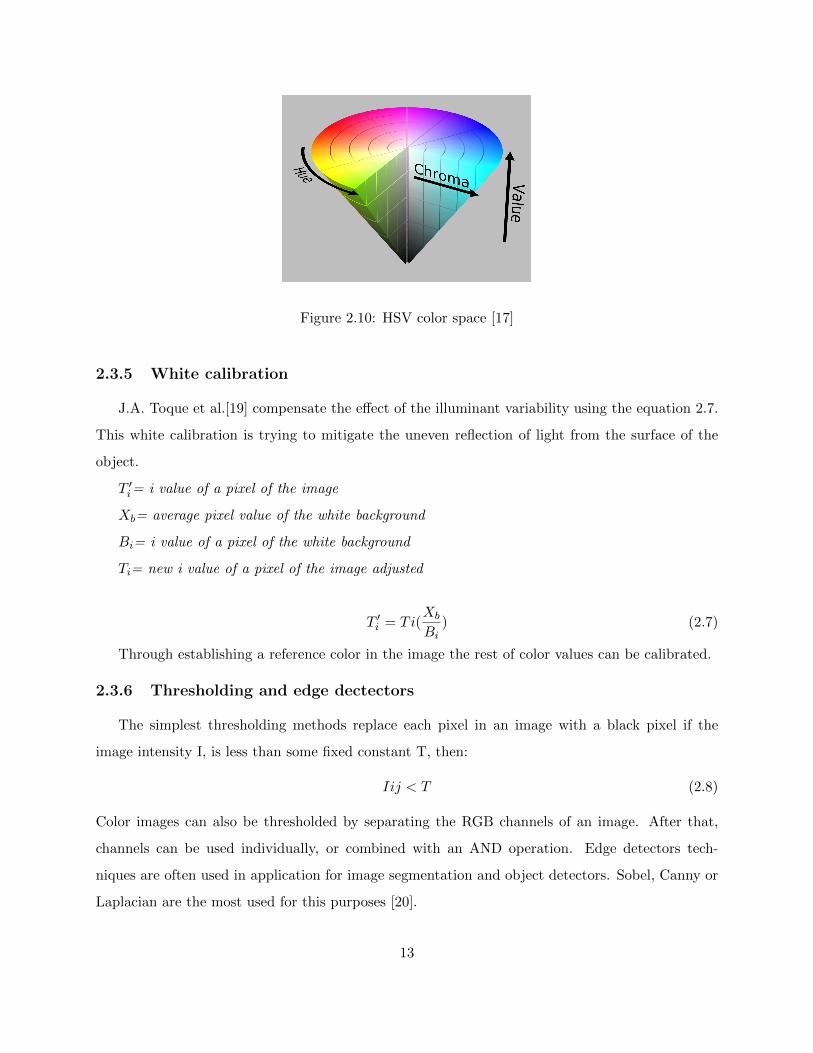
Figure 2.10: HSV color space [17]
2.3.5 White calibration
J.A. Toque et al.[19] compensate the effect of the illuminant variability using the equation 2.7.
This white calibration is trying to mitigate the uneven reflection of light from the surface of the
object.
T ′i= i value of a pixel of the image
Xb= average pixel value of the white background
Bi= i value of a pixel of the white background
Ti= new i value of a pixel of the image adjusted
T ′i = Ti(Xb
Bi) (2.7)
Through establishing a reference color in the image the rest of color values can be calibrated.
2.3.6 Thresholding and edge dectectors
The simplest thresholding methods replace each pixel in an image with a black pixel if the
image intensity I, is less than some fixed constant T, then:
Iij < T (2.8)
Color images can also be thresholded by separating the RGB channels of an image. After that,
channels can be used individually, or combined with an AND operation. Edge detectors tech-
niques are often used in application for image segmentation and object detectors. Sobel, Canny or
Laplacian are the most used for this purposes [20].
13

2.4 Optical sensors
There is an increasing demand to measure the physical and chemical properties of an environ-
ment. For that reason there is a need to change the classical analytical methods with more robust
and modular sensors that simplify the analytical procedure. A sensor is a device capable of record-
ing directly, continuously, and reversibly a physical parameter (physical sensor) or the presence or
concentration of a chemical species (chemical sensor). A chemical sensor system consists of a sensi-
tive layer, a transducer, a data-acquisition process, and an evaluation. This research is focused on
optical sensors that basically consist in the interaction of electromagnetic radiation with a sample
after a recognition event that modifies different optical parameters that may be recorded [21]. The
increasing interest in chemical analysis based on color changes bring advantages such as simplicity
of use, facility to combine with portable and widely distributed imaging devices and friendly an-
alytical procedures in out-of-lab applications for in situ and real-time monitoring [18]. The main
inconvenience analyzing images from a portable device is the variability of the environment where
the picture is captured. Variable conditions such as focal distance, angle, illumination from the
camera to the object have to be taken into consideration in order to obtain the best accuracy and
repeatability for color measurements.
Ariza-Avidad et al [1][2], employ computer vision-based analytical procedures to determine
a concentration of substances such as heavy metals or sulphide in water. The change in color
measured from the image of a disposable membrane acquired by a digital camera using the hue
coordinate (H) of the HSV color space as the analytical parameter is able to sense the substances
in aqueous solution. The chemical sensor is photographed before and after the reaction. Then,
the images are processing using thresholding techniques that allow to isolate the region of interest
(ROI). The H parameter is obtained from the image pixels and is correlated to a concentration.
Although the color space used is the HSV, only the information related to chromaticity is used
(H), ignoring the saturation and brightness values that are closely related to the intensity of light.
Furthermore, the images are captured using a cube light box (figure 2.11) that ensures an optimal
image capture in terms of illumination, angle and focal distances.
14
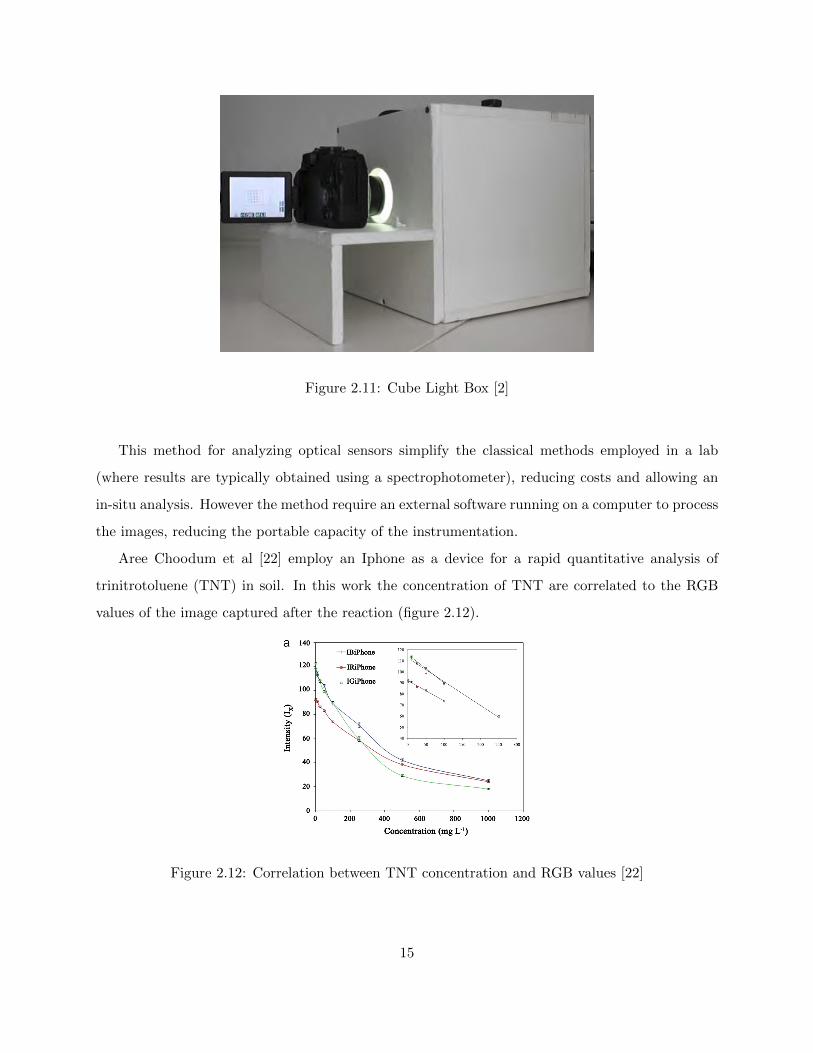
Figure 2.11: Cube Light Box [2]
This method for analyzing optical sensors simplify the classical methods employed in a lab
(where results are typically obtained using a spectrophotometer), reducing costs and allowing an
in-situ analysis. However the method require an external software running on a computer to process
the images, reducing the portable capacity of the instrumentation.
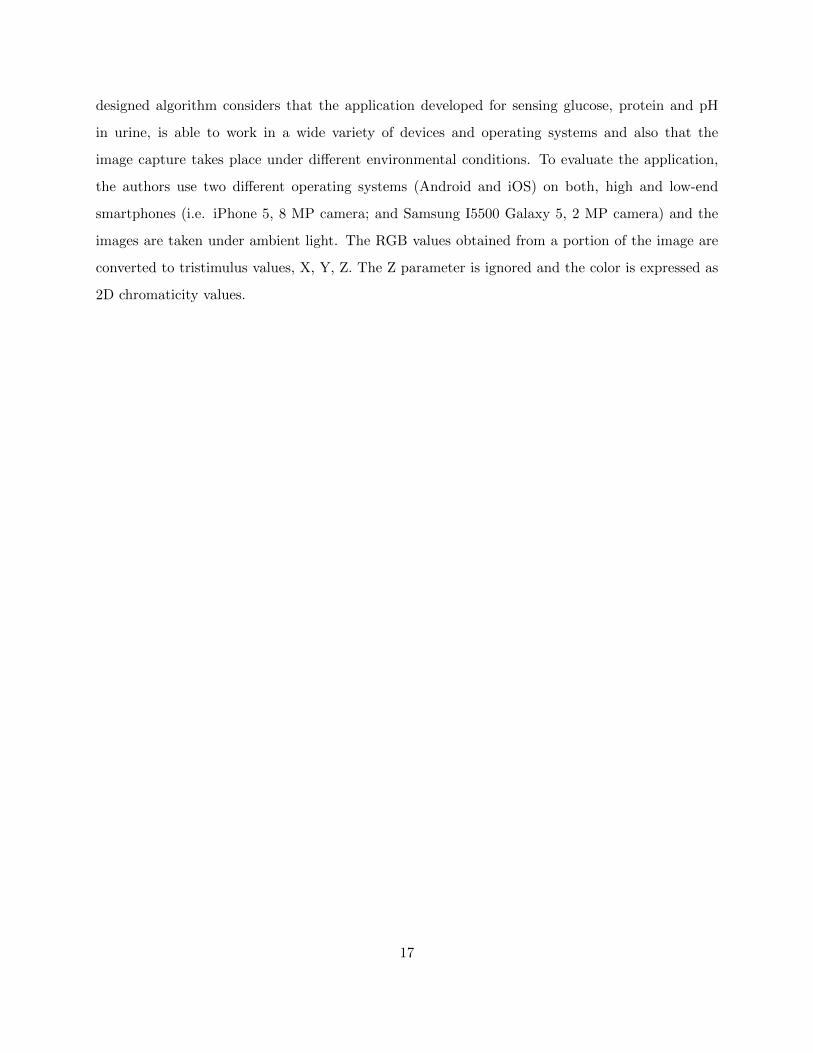
Aree Choodum et al [22] employ an Iphone as a device for a rapid quantitative analysis of
trinitrotoluene (TNT) in soil. In this work the concentration of TNT are correlated to the RGB
values of the image captured after the reaction (figure 2.12).
Figure 2.12: Correlation between TNT concentration and RGB values [22]
15

To evaluate the accuracy of the color measured using the smartphone, a comparison between
an image captured by an Iphone and another one captured by a DSRL camera was carried out,
obtaining satisfactory results that allows an user to determine the concentration of TNT in soil using
an Iphone. However, in this research there is no information about the image capture conditions
and there is no evaluations explaining the behavior of the application running in different devices.
The camera software of the smartphones tries to compensate the ambient light. They are
basically designed to improve the image quality, but do not take into account the color fidelity of
the photographed object. Therefore, this kind of investigations are suitable for an unique device.
Attempting to avoid the capture of images under ambient light and trying to maintain the
portability of the instrumentation, the research carried out by Ahmet F. Coskun et al [23] brings
a possible solution to the problem described. As represented in figure 2.13, an opto-mechanical
attachment installed at the back of the cellphone eliminates possible image artefacts due to the
hand motion of the user, creating a more repeatable, reliable and sensitive platform for personal
use.
Figure 2.13: An opto-mechanical attachment installed at the back of the cellphone [23]
Obviously, this solution requires the manufacture of one attachment for each existing device
model. Therefore, the given solution is not focused on the use of multiple devices but to convert a
smartphone in a reliable tool for colorimetric detection.
An approach for an application able to ensure the inter-phone repeatability for the analysis
of colorimetric sensors is described in the research carried out by Ali K. Yetisen et al [24]. The
16
designed algorithm considers that the application developed for sensing glucose, protein and pH
in urine, is able to work in a wide variety of devices and operating systems and also that the
image capture takes place under different environmental conditions. To evaluate the application,
the authors use two different operating systems (Android and iOS) on both, high and low-end
smartphones (i.e. iPhone 5, 8 MP camera; and Samsung I5500 Galaxy 5, 2 MP camera) and the
images are taken under ambient light. The RGB values obtained from a portion of the image are
converted to tristimulus values, X, Y, Z. The Z parameter is ignored and the color is expressed as
2D chromaticity values.
17
CHAPTER 3
ARTEFACT DESIGN
3.1 Printed sulphide optical sensor
In order to find out which are the requirements for designing an artefact able to quantify the
concentration of a substance using an optical sensor, a set of experiments were carried out employing
a sulphide sensing membrane, following and replicating the same procedure than in previous work
published by Ariza-Avidad et al.[1].
The experiments were carried in collaboration with the ECsens research group [27], in the
labs of the Analytical Chemistry Department, University of Granada. As described in the related
paper, a chromogenic reagent that experiment a hue shift in the presence of sulphide in water can
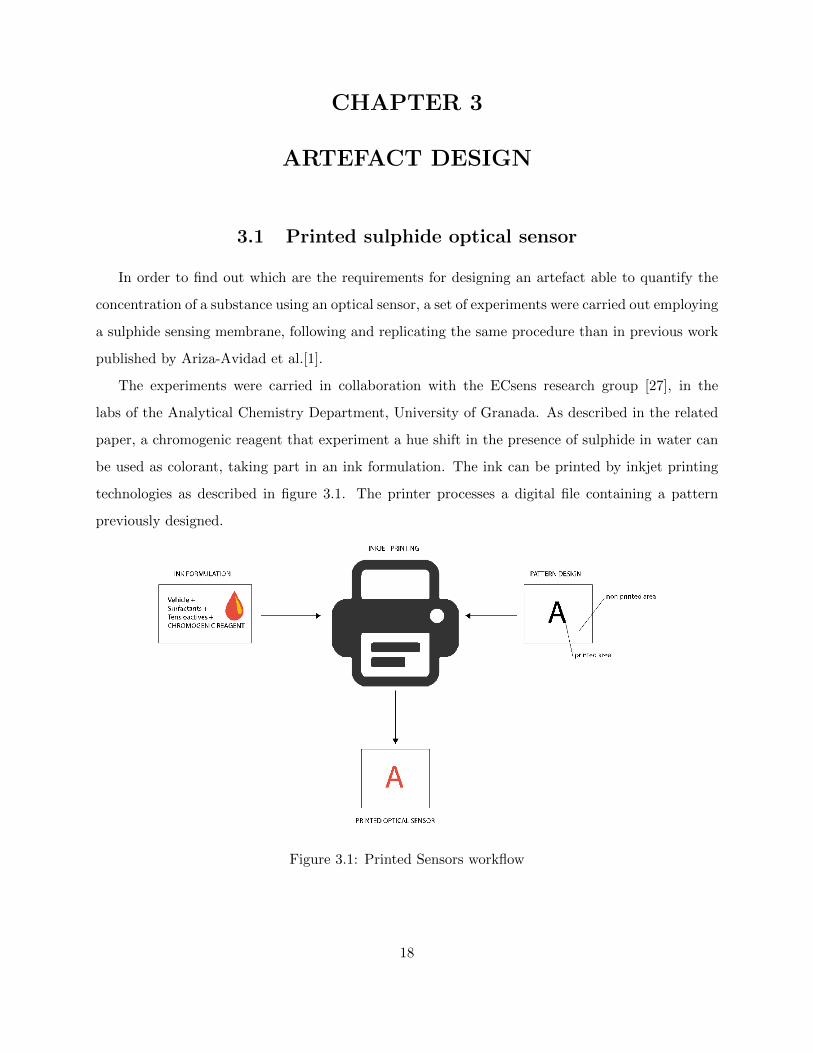
be used as colorant, taking part in an ink formulation. The ink can be printed by inkjet printing
technologies as described in figure 3.1. The printer processes a digital file containing a pattern
previously designed.
Figure 3.1: Printed Sensors workflow
18

3.2 Pattern design
The pattern was designed using Adobe Illustrator CS6 software (Adobe Systems Inc., San Jose,
CA, USA). It consists in a circular shape with a diameter of 3mm with four repetitions. The digital
file generated is a monochrome bitmap file of 1-bit per pixel (1bpp). That means that the values
of those pixels defining the printed area is 1, being 0 for the ones defining the non-printed area
(figure 3.2).
Figure 3.2: Pattern design
3.3 Printing optical sensors
The sulphide disposable sensing membranes were printed using a Fujifilm Dimatix DMP-2831
printer (Fujifilm Dimatix, Inc., Santa Clara, CA, USA) on a white Biodyne A nylon membrane
(Pall Corporation, Port Washington, New York,USA). The cartridge of the printer is containing
the chemical sensor ink and the pattern designed is processed by the printer to generate the final
plot (figure 3.3).
19

Figure 3.3: Printing Optical Sensors
3.4 Optical sensor reaction
The response of sensing membranes to sulphide was evaluated from different sulphide standard
solutions from 10−7M to 10−4M by adding the volume of each standard to a 10 mL polyethylene
plastic tube with pH adjusted 2 mL of 0.5 M buffer phosphate solution pH 7.4. The membrane
was introduced for 5 min into the tube without shaking (figure 3.4). Nine concentrations were
tested and the color information was collected for four replicates each one. The corresponding
concentrations from 1-9 were the following: 10−7M , 5 ∗ 10−7M , 10−6M , 2.5 ∗ 10−6M , 5 ∗ 10−6M ,
7 ∗ 10−6M , 8.5 ∗ 10−6M , 10−5M and 10−4M respectively.
20

Figure 3.4: Optical sensor reaction
3.5 Evaluation of the reaction using a spectrophotometer
A Colormunki spectrophotometer from X-Rite (Grand Rapids, Michigan, USA) was used as
reference measuring instrument in order to measure the reflectance of the sensing membranes before
and after the reaction. The illuminant was D65, with an observer angle of 2 degrees. The range of
the spectrum was 380 nm to 730 nm and the spectral interval was 10 nm. We collected the spectral
sensitivity curves of three linear detectors providing the CIE tristimulus values X, Y and Z, known
as the CIE standard observer.
With reference to the standard observer, the equations 3.1, 3.2, and 3.3 represent the tristimulus
values for a color with a spectral power distribution where is the wavelength of the equivalent
monochromatic light (nm).
X =
∫ 730
380I(λ)x(λ)d(λ) (3.1)
Y =
∫ 730
380I(λ)y(λ)d(λ) (3.2)
Z =
∫ 730
380I(λ)z(λ)d(λ) (3.3)
21

To achieve a universal measurement and in order to compare it to images captured by a smart-
phone, a transformation from the tristimulus XYZ values to sRGB color space (equation 3.4) was
needed.
RlinearGlinearBlinear
=
3.2406 −1.5372 −0.4986−0.9689 1.8758 0.04150.0557 −0.2040 1.0570
XYZ
(3.4)
The RGB values converted from the XYZ values collected before and after the reaction are
shown in table 3.1.
Table 3.1: RGB values for each reaction using a spectrophotometer
SULPHIDE CONCENTRATION Red intensity Green Intensity Blue Intensity
Blank (no reaction) 213 168 206
1 211 164 205
2 211 165 201
3 213 165 197
4 225 174 184
5 244 202 163
6 254 214 154
7 254 211 148
8 255 213 148
9 255 217 157
These RGB values corresponding to each sulphide concentration are represented in figure 3.5.
22

Figure 3.5: RGB values for each reaction using a spectrophotometer
As we can observe, the color of the chromogenic reagent experiments a hue shift from violet
to yellow while the sulphide concentration in water is increasing. In a closer look at the case we
can notice that the intensity of the blue channel is decreasing while the intensity of red and green
increases. In an additive color mode sRGB the sum of R and B results in color yellow. In other
words, violet color is complementary to yellow color (figure 3.6).
23
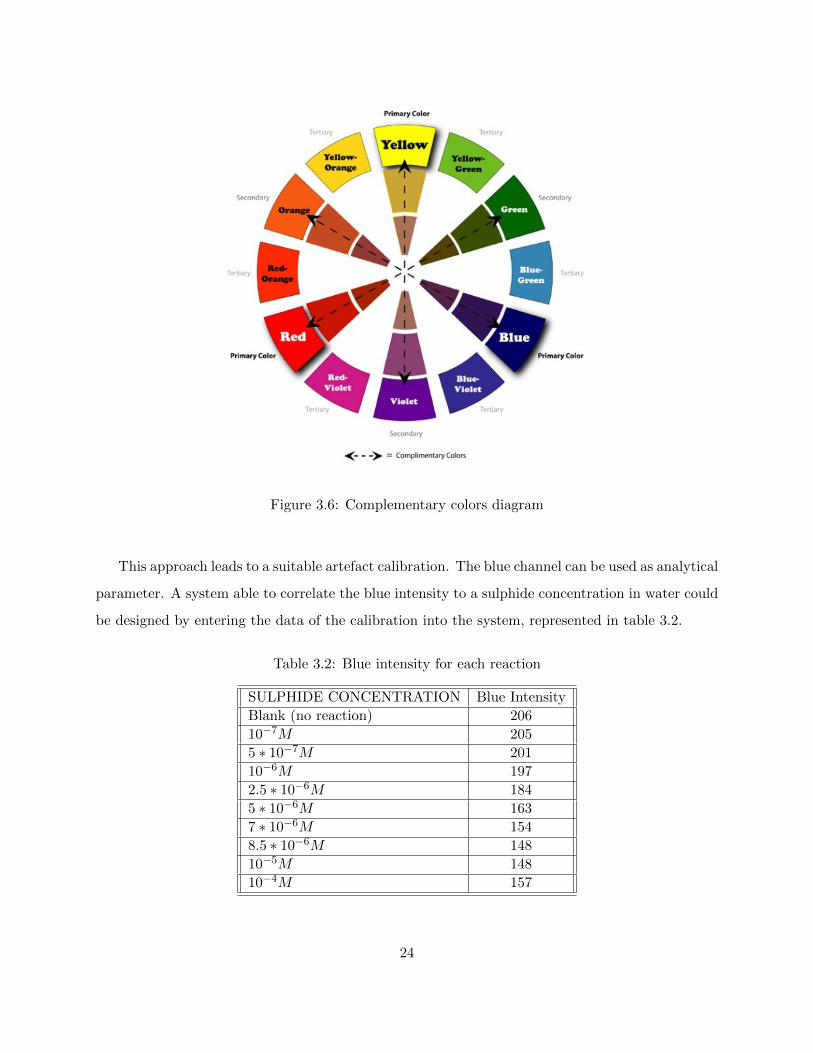
Figure 3.6: Complementary colors diagram
This approach leads to a suitable artefact calibration. The blue channel can be used as analytical
parameter. A system able to correlate the blue intensity to a sulphide concentration in water could
be designed by entering the data of the calibration into the system, represented in table 3.2.
Table 3.2: Blue intensity for each reaction
SULPHIDE CONCENTRATION Blue Intensity
Blank (no reaction) 206
10−7M 205
5 ∗ 10−7M 201
10−6M 197
2.5 ∗ 10−6M 184
5 ∗ 10−6M 163
7 ∗ 10−6M 154
8.5 ∗ 10−6M 148
10−5M 148
10−4M 157
24

For instance, Bi = Blue intensity measurement of the optical sensor by the spectrophotometer
If Bi < 201 and Bi > 197 then
Concentration < 106 M
However, the repeatability of the system has a strong dependence on the measuring instrument
employed in the process. In this case, the instrument is a spectrophotometer that can be successfully
calibrated, also the intensity and color temperature of the illuminant are controlled and furthermore,
the distance to the object and angle are known. The use of a smartphone as a color measuring
instrument involves a great variability as mentioned in the introduction and as we will see in the
following experiments carried out.
3.6 Analysis of the requirements
Once the case has been analyzed using a traditional color measuring instrument, the require-
ments for designing the artifact can be defined:
• Capture an image using a smartphone: After the optical sensor reaction, the application must
allow the user to capture the image of the sensing membrane. For this purpose, the camera
software of the device will be used.
• ROI setection: In order to both, isolate the ROI of the image and reduce the image size.
• Color image processing: Collect and process the color values of the ROI.
• Quantification: Correlate the concentration of the substance to the color values gathered
previously by the device.
• Share results: Allow the user to know the concentration of the sulphide in water.
25

CHAPTER 4
RESULTS
4.1 Image capture
Three different smartphones were used for capturing images of the optical sensor through repli-
cating the previous process, an iPhone 5s (Apple Inc., Cupertino, CA, USA), a Samsung Galaxy S4
Zoom (Samsung Electronics, Suwon, South Korea) and a LG Optimus L5 (LG electronics, Seoul,
South Korea). A light box was used in order to both, isolate the sensing membranes of the ambient
light and place the smartphones in an equal position while capturing the image. In this way, the
distance from the smartphone camera to the optical sensor was 5 cm. The illuminant inside the box
was provided by an array of D65 led (figure 4.1). The images were captured using the automatic
mode available in the camera software of the devices. The dimensions expressed in pixels of the
images acquired by the three smartphones were 2448x3264 (iPhone), 4608x3456 (Samsung) and
1920x2560 (LG). The color space embedded in the image is the sRGB for the three cases.
4.2 Image processing
For selecting the ROI, Adobe Photoshop CS6 software (Adobe Systems Inc., San Jose, CA,
USA) was used.
26

Figure 4.1: Light box and ROI
The color information from the images captured after the reaction was collected. The average
of the RGB values of the ROI was obtained and are shown in tables 4.1, 4.2 and 4.3.
Table 4.1: RGB values and number of pixels for each reaction (Samsung)
SULPHIDE CONCENTRATION Red intensity Green Intensity Blue Intensity No. Pixels
1 129,18 85,75 127,2 5450
2 127,98 84,75 124,25 5530
3 125,95 81,09 123,04 5346
4 126,29 90,13 123,56 5486
5 126,45 94,22 118,01 5501
6 125,91 84,51 96,57 4969
7 130,97 98,26 82,97 4877
8 144,36 132,3 44,9 4855
9 141,51 131,1 47,33 4867
27
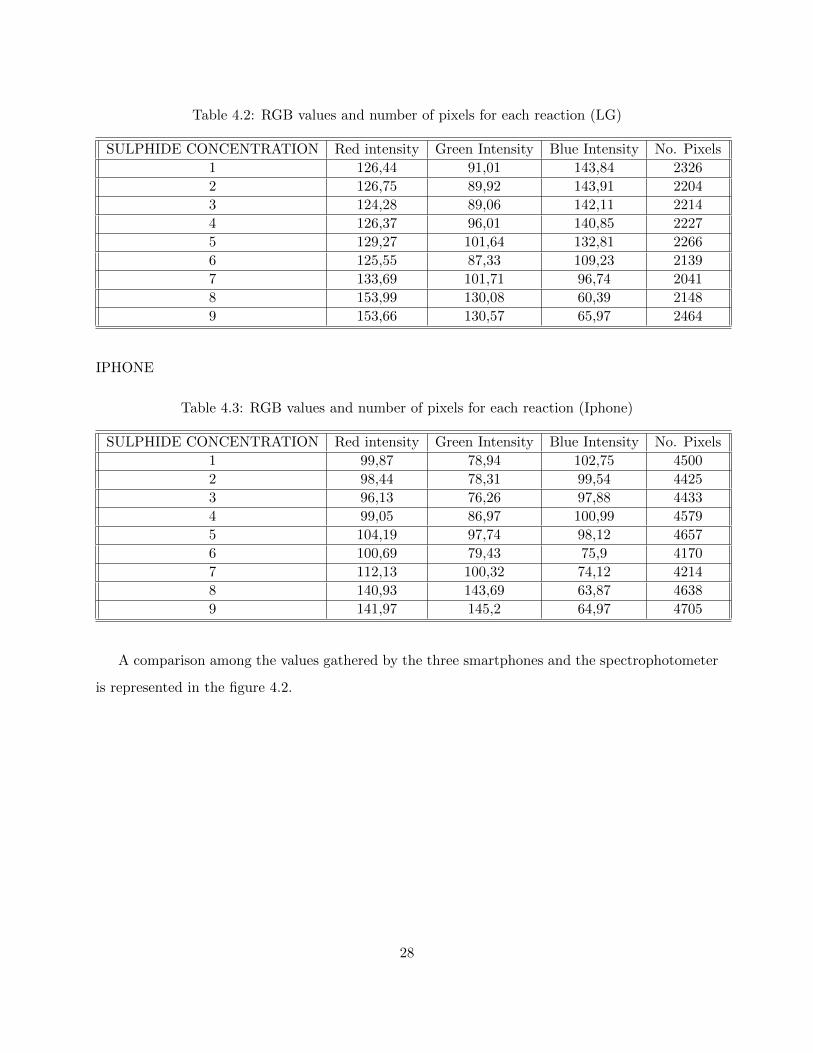
Table 4.2: RGB values and number of pixels for each reaction (LG)
SULPHIDE CONCENTRATION Red intensity Green Intensity Blue Intensity No. Pixels
1 126,44 91,01 143,84 2326
2 126,75 89,92 143,91 2204
3 124,28 89,06 142,11 2214
4 126,37 96,01 140,85 2227
5 129,27 101,64 132,81 2266
6 125,55 87,33 109,23 2139
7 133,69 101,71 96,74 2041
8 153,99 130,08 60,39 2148
9 153,66 130,57 65,97 2464
IPHONE
Table 4.3: RGB values and number of pixels for each reaction (Iphone)
SULPHIDE CONCENTRATION Red intensity Green Intensity Blue Intensity No. Pixels
1 99,87 78,94 102,75 4500
2 98,44 78,31 99,54 4425
3 96,13 76,26 97,88 4433
4 99,05 86,97 100,99 4579
5 104,19 97,74 98,12 4657
6 100,69 79,43 75,9 4170
7 112,13 100,32 74,12 4214
8 140,93 143,69 63,87 4638
9 141,97 145,2 64,97 4705
A comparison among the values gathered by the three smartphones and the spectrophotometer
is represented in the figure 4.2.
28

Figure 4.2: RGB values comparison among devices
The intensity of the RGB values collected by the spectrophotometer are significantly higher
than the smartphone ones. This is because of the illumination provided by the instrument. It is
specifically designed for this purpose and it results in a better performance of the color reflected.
Moreover, the intensity of the values collected by the smartphones are different among them.
Although the images were captured under equal circumstances by using a light box, the results
are strongly affected by the color interpretation from different devices technologies. Furthermore,
the automatic mode used for capturing images employs algorithms designed mainly to improve the
image quality, but not to preserve the color fidelity of the environment.
4.2.1 Normalized RGB
As we are interested in the chromaticity of a measured color, we can overlook the brightness
value (that is closely related with the intensity of light perceived) through normalizing the RGB
29

values. All the previous values from each one of the four devices were normalized following the
equations 4.1, 4.2 and 4.3
r = R/R+G+B (4.1)
g = G/R+G+B (4.2)
b = 1 − r − g (4.3)
The results are represented in figure 4.3
Figure 4.3: Normalized RGB values comparison among devices
After normalizing RGB values the intensity responses are more similar. However the results
are not sufficiently satisfactory to create a common calibration data for the three smartphones.
30
The design needs to improve the performance of the artefact in order to ensure the inter-phone
repeatability.
4.2.2 HSV color space
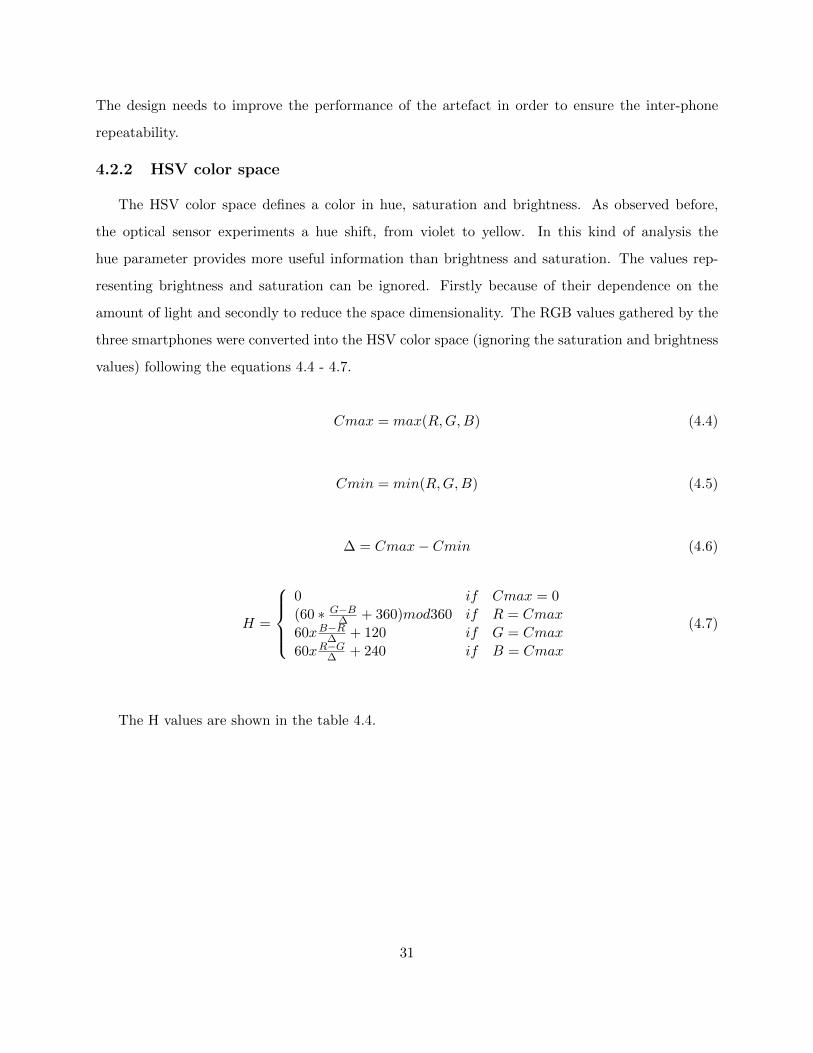
The HSV color space defines a color in hue, saturation and brightness. As observed before,
the optical sensor experiments a hue shift, from violet to yellow. In this kind of analysis the
hue parameter provides more useful information than brightness and saturation. The values rep-
resenting brightness and saturation can be ignored. Firstly because of their dependence on the
amount of light and secondly to reduce the space dimensionality. The RGB values gathered by the
three smartphones were converted into the HSV color space (ignoring the saturation and brightness
values) following the equations 4.4 - 4.7.
Cmax = max(R,G,B) (4.4)
Cmin = min(R,G,B) (4.5)
∆ = Cmax− Cmin (4.6)
H =
0 if Cmax = 0
(60 ∗ G−B∆ + 360)mod360 if R = Cmax
60xB−R∆ + 120 if G = Cmax
60xR−G∆ + 240 if B = Cmax
(4.7)
The H values are shown in the table 4.4.
31

Table 4.4: H values collected by the three smartphones
SULPHIDE CONCENTRATION H Samsung H LG H Iphone
1 302,74 280,24 292,74
2 305,18 280,93 296,89
3 303,89 279,83 295,14
4 304,53 280,62 291,70
5 315,71 293,19 356,47
6 342,52 325,62 8,54
7 19,11 8,07 41,36
8 52,72 44,67 62,07
9 53,37 44,20 62,42
The H parameter values are represented in a circular range from 0 to 360 (figure 4.4). That
explains for example, the reaction no. 6 where the color is close to 360 (a red color varying from
342 to 8).
Figure 4.4: H parameter representation
The comparison is represented in figure 4.5
32
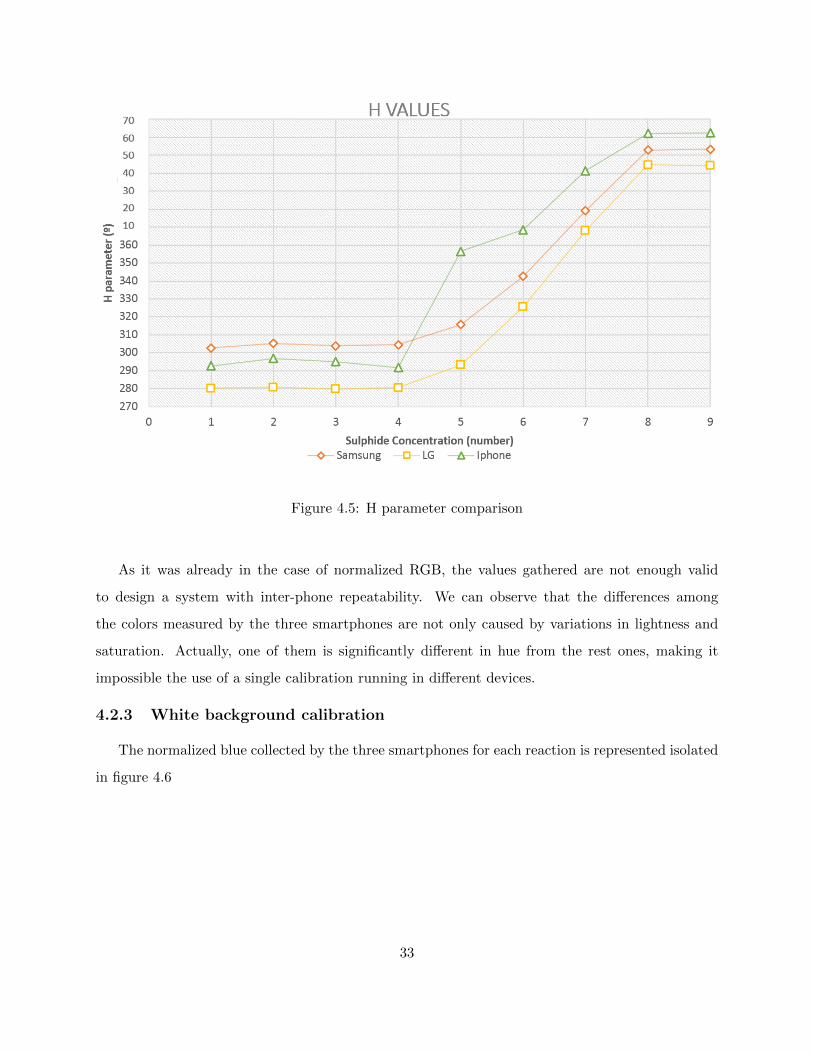
Figure 4.5: H parameter comparison
As it was already in the case of normalized RGB, the values gathered are not enough valid
to design a system with inter-phone repeatability. We can observe that the differences among
the colors measured by the three smartphones are not only caused by variations in lightness and
saturation. Actually, one of them is significantly different in hue from the rest ones, making it
impossible the use of a single calibration running in different devices.
4.2.3 White background calibration
The normalized blue collected by the three smartphones for each reaction is represented isolated
in figure 4.6
33
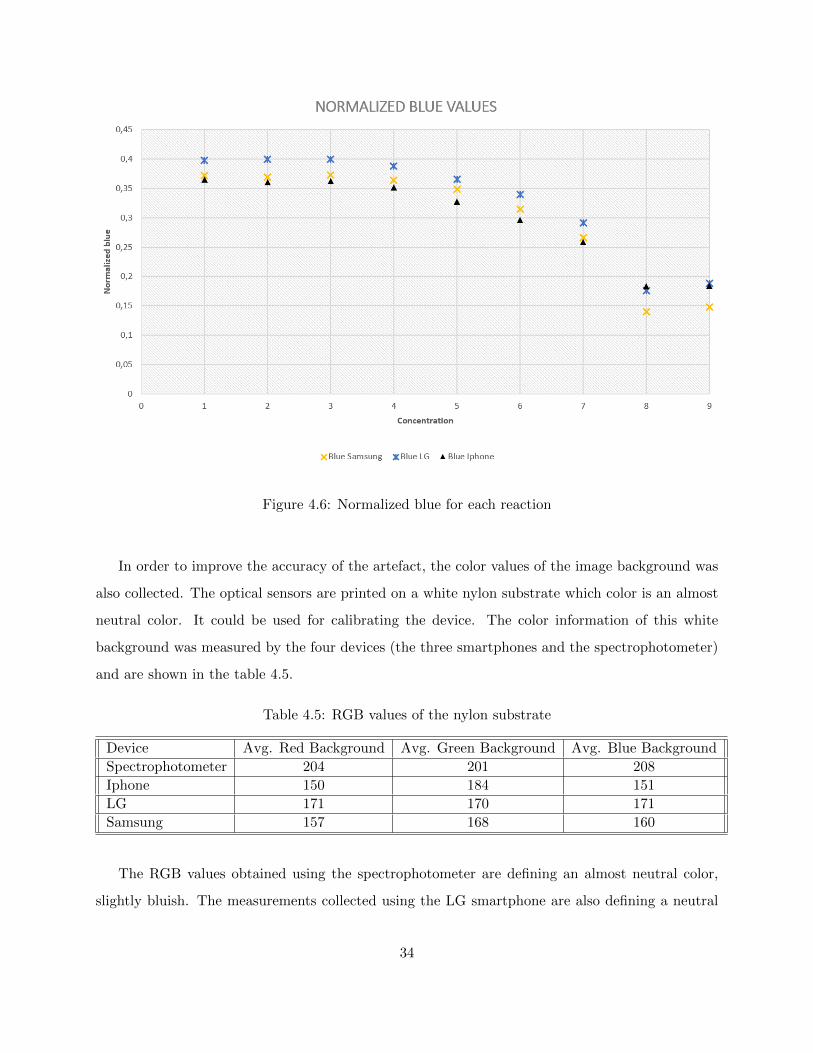
Figure 4.6: Normalized blue for each reaction
In order to improve the accuracy of the artefact, the color values of the image background was
also collected. The optical sensors are printed on a white nylon substrate which color is an almost
neutral color. It could be used for calibrating the device. The color information of this white
background was measured by the four devices (the three smartphones and the spectrophotometer)
and are shown in the table 4.5.
Table 4.5: RGB values of the nylon substrate
Device Avg. Red Background Avg. Green Background Avg. Blue Background
Spectrophotometer 204 201 208
Iphone 150 184 151
LG 171 170 171
Samsung 157 168 160
The RGB values obtained using the spectrophotometer are defining an almost neutral color,
slightly bluish. The measurements collected using the LG smartphone are also defining a neutral
34

color. However, the iPhone and the Samsung are defining a greenish color.
The normalized blue of the white background was used as reference value for the calibration.
The content of blue of the optical sensor was obtained by establishing a ratio between the blue
intensity of the white background and the blue intensity of the sensor.
Blue ratio = AVG. Normalized blue of the background / AVG. Normalized blue of the sensor
This ratio was obtained using the measurements of all the reactions for each of the smartphones.
The results are showed in table 4.6.
Table 4.6: Blue ratio of each reaction
Concentration Blue Ratio Samsung Blue Ratio LG Blue Ratio Iphone Blue Min. Blue Max.
1 1,13 1,19 1,17 1,13 1,19
2 1,12 1,19 1,16 1,12 1,19
3 1,13 1,20 1,16 1,13 1,20
4 1,10 1,16 1,13 1,10 1,16
5 1,06 1,09 1,05 1,05 1,09
6 0,95 1,02 0,95 0,95 1,02
7 0,81 0,87 0,83 0,81 0,87
8 0,42 0,52 0,59 0,42 0,59
9 0,45 0,56 0,59 0,45 0,59
The data is represented in figure 4.7
35

Figure 4.7: Blue Ratio values from the three devices
36

CHAPTER 5
CONCLUSIONS
A smartphone can be used as a color measuring device for quantify the concentration of a substance
in colorimetric tests. In this research a set of experiments were carried out in order to evaluate the
artefact designed. The RGB values comparison among the spectrophotometer and the three smart-
phones shows how different is the intensity of the reflected light perceived. This fact, is affecting
the interpretation of color by each device. The color measured for each reaction is indicating a lack
of accuracy in terms of color values. Nevertheless, quantification accuracy is important, but not the
accuracy of the color measured with regard to the spectrophotometer. As described in the previous
work [1], the suplhide optical sensor used in the experiments can be analyzed employing a digital
camera and using the H parameter of the HSV color space. However this method is valid only when
the image is captured by a singular device. The comparison of the results obtained from images
captured by multiple devices is indicating a great range of error in the quantification. This results
are not satisfactory for an application with interphone-repeatability. As observed in the analysis
phase the blue channel can be used as analytical parameter in the quantification. This fact, reduce
the space dimensionality and ease the data processing of the device. Through normalizing the blue
channel, the range of error among the three smartphones is reduced. Furthermore, taking advan-
tage of the neutral color of the surface of the nylon membrane, the color pixels can be calibrated,
compensating the effect of the undesired color dominance in an image, reducing even more the
range of error, leading to a suitable application design with interphone-repeatability. Finally, the
research carried out is describing a method to digitize color measurement in quantitative analyses
and should be applied to multiples analysis of colorimetric tests.
37

BIBLIOGRAPHY
[1] M. Ariza-Avidad, M. Agudo-Acemel, A. Salinas-Castillo, L.F. Capitan-Vallvey. ”Inkjet-printeddisposable metal complexing indicator-displacement assay for sulphide determination in water”.Analytica Chimica Acta, Volume 872, 4 May 2015, Pages 55-62
[2] M. Ariza-Avidad, A. Salinas-Castillo, M. P. Cuellar, M. Agudo-Acemel, M. C. Pegalajar, andL. F. Capitan-Vallvey, ”Printed Disposable Colorimetric Array for Metal Ion Discrimination”.Anal. Chem., 2014, 86 (17), pp 8634-8641 DOI: 10.1021/ac501670f
[3] Sharma, G., Trussel, H.J. (1997): Digital color processing. IEEE Trans. on Image Processing,6(7): 901-932.
[4] K.N. Plataniotis and A.N. Venetsanopoulos. ”Color Image Processing and Applications Engi-neering”, February 18, 2000 Springer-Verlag.
[5] http://hyperphysics.phy-astr.gsu.edu/hbase/vision/cie.html#c2
[6] CIE (1932). Commission internationale de l’Eclairage proceedings, 1931. Cambridge: CambridgeUniversity Press
[7] Jeong-Yeol Yoon (2012): ”Spectrophotometry and Optical Biosensor2. Introduction to Biosen-sors pp 121-139
[8] https://global.britannica.com/science/colorimetry
[9] Nicholas D. Lane, Emiliano Miluzzo, Hong Lu, Daniel Peebles, Tanzeem Choudhury, and An-drew T. Campbell, ”A Survey of Mobile Phone Sensing” Comm. Mag., vol. 48, pp.140 - 150September 2010
[10] Elsa Macias , Alvaro Suarez and Jaime Lloret. ”Review Mobile Sensing Systems ”.Sensors2013, 13, 17292-17321; doi:10.3390/s131217292
[11] E. Koukoumidis, M. Martonosi and P. Li-Shiuan, ”Leveraging smartphone cameras for collab-orative road advisories”, IEEE Trans. Mobile Comput., vol. 11, no. 5, pp. 707-723, 2012
[12] Ruxandra Tapu, Bogdan Mocanu, Andrei Bursuc, Titus Zaharia, ”A Smartphone-Based Ob-stacle Detection and Classification System for Assisting Visually Impaired People”. IT/TelecomSudParis, ARTEMIS DEpartment, UMR CNRS MAP5 8145, Evry, France.
[13] Sandeep Kumar Vashist, Onur Mudanyali, E. Marion Schneider, Roland Zengerle, AydoganOzcan, ”Cellphone-based devices for bioanalytical sciences” Analytical and Bioanalytical Chem-istry May 2014, Volume 406, Issue 14, pp 3263-3277
38

[14] http://www.bluebugle.org/2013/03/smartphone-camera-technology-analysis.html
[15] W. Skarbek and A. Koschan. ”Color Image Segmentation - A Survey -”. Technical report94-32, Computer Science Department, TU Berlin, 1994.
[16] Vladimir Vezhnevets, Vassili Sazonov, Alla Andreeva. ”A Survey on Pixel-Based Skin ColorDetection Techniques” Graphics and Media Laboratory. Faculty of Computational Mathematicsand Cybernetics Moscow State University, Moscow, Russia
[17] Joblove, George H.; Greenberg, Donald (August 1978). ”Color spaces for computer graphics”.Computer Graphics. 12 (3): 2025. doi:10.1145/965139.807362
[18] Luis Fermin Capitan-Vallvey et al. ”Recent developments in computer vision-based ana-lytical chemistry: A tutorial review” ArticleinAnalytica chimica acta 899 October 2015doi:10.1016/j.aca.2015.10.009
[19] Computer Vision, Imaging and Computer Graphics: Theory and Applications: InternationalJoint Conference, VISIGRAPP 2009, Lisboa, Portugal, February 5-8, 2009. Revised SelectedPapers
[20] Debosmit Ray. ”Edge Detection in Digital Image Processing” June 06, 2013.
[21] Mara Ariza Avidad, ”Color and nanomaterials in optical sensors”. PhD Thesis.University ofGranada, July 2014, ISBN: 978-84-9083-168-7 pp.25 - 53
[22] Aree Choodum, Proespichaya Kanatharana, Worawit Wongniramaikul, Niamh NicDaeid, ”Us-ing the iPhone as a device for a rapid quantitative analysis of trinitrotoluene in soil”. Talanta115(2013) 143 - 145.
[23] Coskun AF, Wong J, Khodadadi D, Nagi R, Tey A, Ozcan A. ”A personalized food allergentesting platform on a cellphone”. Lab on a chip. 2013;13(4):636-640. doi:10.1039/c2lc41152k.
[24] Ali K. Yetisen, J.L. Martinez-Hurtado, Angel Garcia-Melendrez, Fernando da Cruz Vascon-cellos, Christopher R.Lowe, ”A smartphone algorithm with inter-phone repeatability for theanalysis of colorimetric tests”. Sensors and Actuators B: Chemical. Volume 196, June 2014,Pages 156 -160. doi:10.1016/j.snb.2014.01.077
[25] David J.You,TuSanPark,Jeong-YeolYoon, ”Cell-phone-based measurement of TSH using Miescatter optimized lateral flow assays”.Biosensors and Bioelectronics 40(2013)180-185.
[26] Byoung-Yong Chang, ”Smartphone-based Chemistry Instrumentation: Digitization of Colori-metric Measurements”. Bull. Korean Chem. Soc. 2012, Vol. 33, No. 2 549 http://dx.doi.org/
10.5012/bkcs.2012.33.2.549
[27] http://ecsens.ugr.es
39