
Digitization and the Music Industry - Télécom...
67
Digitization and the Music Industry Joel Waldfogel Conference on the Economics of Information and Communication Technologies Paris, October 5-6, 2012
Transcript of Digitization and the Music Industry - Télécom...

Digitization and the Music Industry
Joel Waldfogel Conference on the Economics of
Information and Communication Technologies Paris, October 5-6, 2012
Copyright Protection, Technological Change, and the Quality of New Products: Evidence from Recorded
Music since Napster
AND
And the Bands Played On: Digital Disintermediation and the Quality of New
Recorded Music
Intro – assuring flow of creative works
• Appropriability – may beget creative works
– depends on both law and technology
• IP rights are monopolies granted to provide incentives for creation – Harms and benefits
• Recent technological changes may have altered the balance – First, file sharing makes it harder to appropriate revenue…

…and revenue has plunged
0
2000
4000
6000
8000
10000
12000
14000
16000
1994 1995 1996 1997 1998 1999 2000 2001 2002 2003 2004 2005 2006 2007 2008 2009
$ m
illio
ns
RIAA Total Value of US Shipments, 1994-2009
total
digital
physical

Ensuing Research
• Mostly a kerfuffle about whether file sharing cannibalizes sales
• Oberholzer-Gee and Strumpf (2006),Rob and Waldfogel (2006), Blackburn (2004), Zentner (2006), and more
• Most believe that file sharing reduces sales
• …and this has led to calls for strengthening IP protection
My Epiphany
• Revenue reduction, interesting for producers, is not the most interesting question
• Instead: will flow of new products continue?
• We should worry about both consumers and producers

Industry view: the sky is falling
• IFPI: “Music is an investment-intensive business… Very few sectors have a comparable proportion of sales to R&D investment to the music industry.”
• Warner Music: “…piracy makes it more difficult for the whole industry to sustain that regular investment in breaking talent.”
• RIAA: “Our goal with all these anti-piracy efforts is to protect the ability of the recording industry to invest in new bands and new music…”
• RIAA: “this theft has hurt the music community, with thousands of layoffs, songwriters out of work and new artists having a harder time getting signed and breaking into the business.”

File sharing is not the only innovation
• “Compound experiment” – Costs of production, promotion, and distribution
may also have fallen
– Maybe weaker IP protection is enough
• My empirical question: What has happened to the “quality” of new products since Napster? – Contribute to an evidence-based discussion on
adequacy of IP protection in new economy
• And if so, why?

Hard problem
• Quantifying the volume of high-quality new music released over time is hard
• Some obvious candidates are non-starters
– # works released (but skew)
– # works selling > X copies (moving target)

Two Broad Approaches
• Quality index based on critics’ best-of lists
• 2 indices based on vintage service flow
– Airplay by time and vintage
– Sales by time and vintage
Approach #1: critics’ lists
• Want index of the number of works released each year surpassing a constant threshold
• Use critics’ retrospective best-of lists
– E.g. Number of albums on a best-of-the-decade list from each year
– Retrospective: to be on list, album’s quality must exceed a constant threshold

Rolling Stone’s 500 Best Albums (2004) 0
.02
.04
.06
Rolli
ng
Sto
ne
1960 1970 1980 1990 2000 2010Year
from 2004 album list
Rolling Stone Index

“Splice” together to create overall index, covering pre- and post-Napster era.
BETMSN.comNOWQ
Acclaimed AlbumsAcclaimed Songs
American SongwriterAustin Town Hall
Best Ever
BetterPropagandaBillboard
Blender songs
Boom Box, TheBoot, TheCokeMachineGlowComplexComplexConsequence of SoundConsequence of SoundCreative LoafingDaily CalifornianDecibelDelusions of AdequacyeMusicEntertainment WeeklyFACTGhostlyGigwiseGigwiseGlideGuardian, TheHipHopDXIrish TimesKitsap SunThe Line of Best FitLostAtSeaLost At SeaMetacriticMetromix DenverMixmagmusicOMHNMENMENoise CreepNational Public RadioNPROneThirtyBPMonethirtybpmThe Onion A.V. ClubPaste
Pitchfork 1990s (03)
Pitchfork 1990s (99)PitchforkPitchforkPopdosePopdoseResident AdvisorResident AdvisorRhapsodyRhapsodyRock's Back PagesRolling StoneRolling Stone
Rolling Stone
Rate Your Music
SlantSlantSpinnerSpinnerStateStylusStylus DecadeThe BoomboxThe GuardianThe SunThe Sunday TimesThe TimesThe WordTimes, TheTiny Mix TapesTrebleTrebleUncutUnder the RadarVirgin MediaWord, The
Zagat
02
04
06
08
0
Ind
ex
1960 1970 1980 1990 2000 2010Year
Index Availability
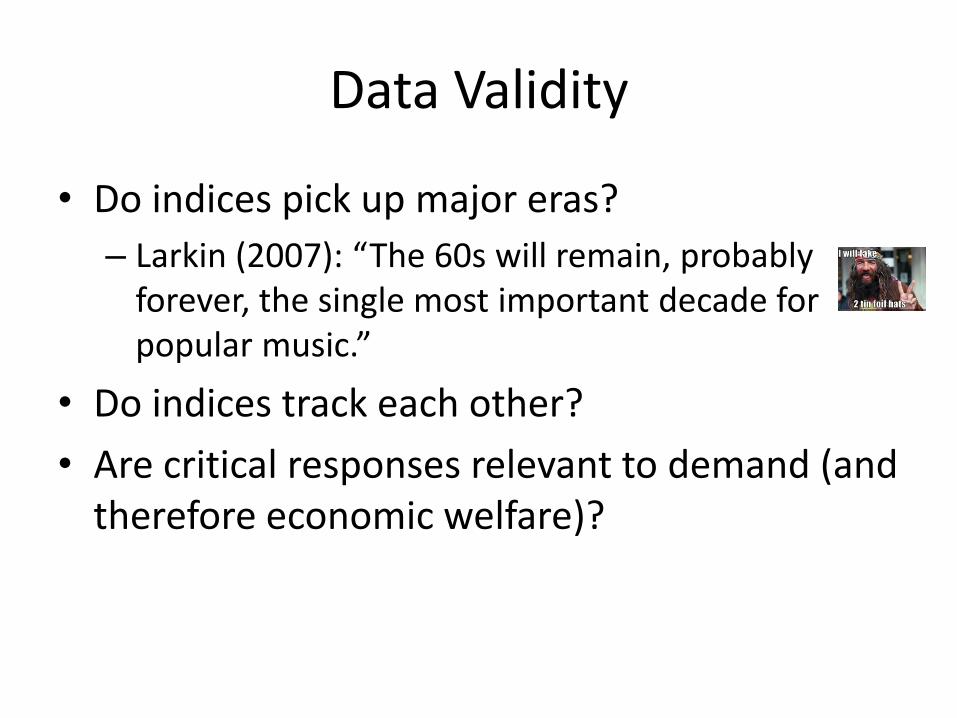
Data Validity
• Do indices pick up major eras?
– Larkin (2007): “The 60s will remain, probably forever, the single most important decade for popular music.”
• Do indices track each other?
• Are critical responses relevant to demand (and therefore economic welfare)?

Concordance of Long Term Indices .0
1.0
15
.02
.025
.03
0
.05
0
.05
0
.02
.04
.06
0
.05
1960 1980 2000 1960 1980 2000 1960 1980 2000
1960 1970 1980 1990 2000 1960 1970 1980 1990 2000
Acclaimed BestEver Rate Your Music
Rolling Stone Zagat
YearGraphs by source
Supply Indices
All correlations exceed 0.7, except with Zagat
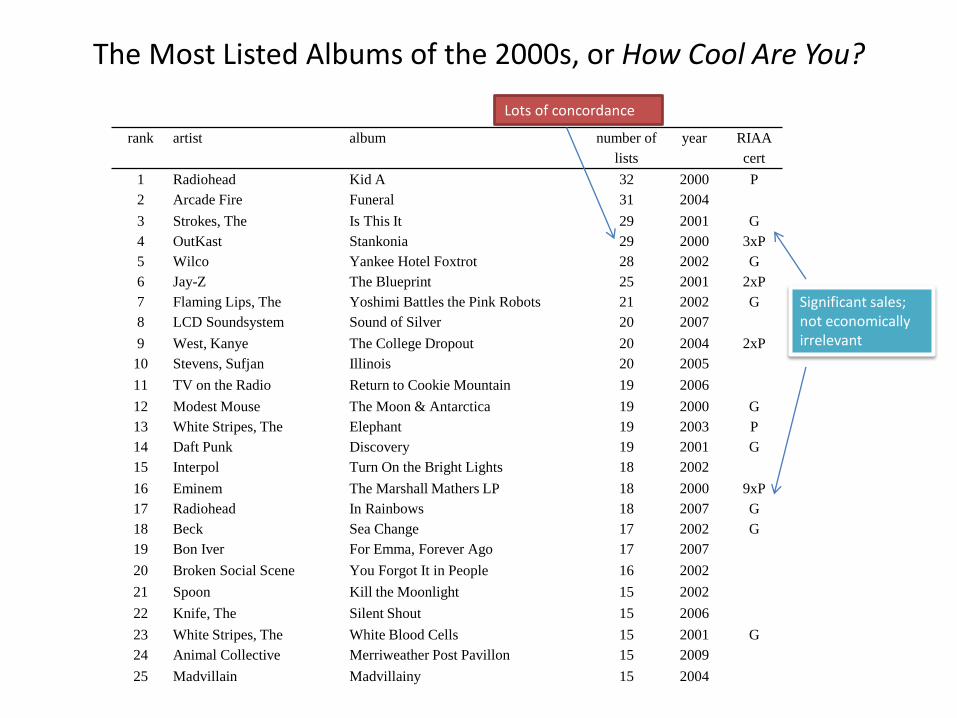
The Most Listed Albums of the 2000s, or How Cool Are You?
rank artist album number of
lists
year RIAA
cert
1 Radiohead Kid A 32 2000 P
2 Arcade Fire Funeral 31 2004
3 Strokes, The Is This It 29 2001 G
4 OutKast Stankonia 29 2000 3xP
5 Wilco Yankee Hotel Foxtrot 28 2002 G
6 Jay-Z The Blueprint 25 2001 2xP
7 Flaming Lips, The Yoshimi Battles the Pink Robots 21 2002 G
8 LCD Soundsystem Sound of Silver 20 2007
9 West, Kanye The College Dropout 20 2004 2xP
10 Stevens, Sufjan Illinois 20 2005
11 TV on the Radio Return to Cookie Mountain 19 2006
12 Modest Mouse The Moon & Antarctica 19 2000 G
13 White Stripes, The Elephant 19 2003 P
14 Daft Punk Discovery 19 2001 G
15 Interpol Turn On the Bright Lights 18 2002
16 Eminem The Marshall Mathers LP 18 2000 9xP
17 Radiohead In Rainbows 18 2007 G
18 Beck Sea Change 17 2002 G
19 Bon Iver For Emma, Forever Ago 17 2007
20 Broken Social Scene You Forgot It in People 16 2002
21 Spoon Kill the Moonlight 15 2002
22 Knife, The Silent Shout 15 2006
23 White Stripes, The White Blood Cells 15 2001 G
24 Animal Collective Merriweather Post Pavillon 15 2009
25 Madvillain Madvillainy 15 2004
Lots of concordance
Significant sales; not economically irrelevant

Splicing via regression
• “Splice” indices
• Plot θ’s

And voila: Index of vintage quality .5
11
.52
2.5
3
1960 1970 1980 1990 2000 2010year
coef top of 95% interval
bottom of 95% interval
weighted
Album Year Dummies and Napster

And voila: Index of vintage quality .5
11
.52
2.5
3
1960 1970 1980 1990 2000 2010year
coef top of 95% interval
bottom of 95% interval
weighted
Album Year Dummies and Napster
Index is falling prior to Napster
Post-Napster constancy is, if anything, a relative increase

Answer #1
• No reduction in quality following Napster
– Cf “The sky is falling.”
• But:
– Elites
– Right tail
– Not consumption data
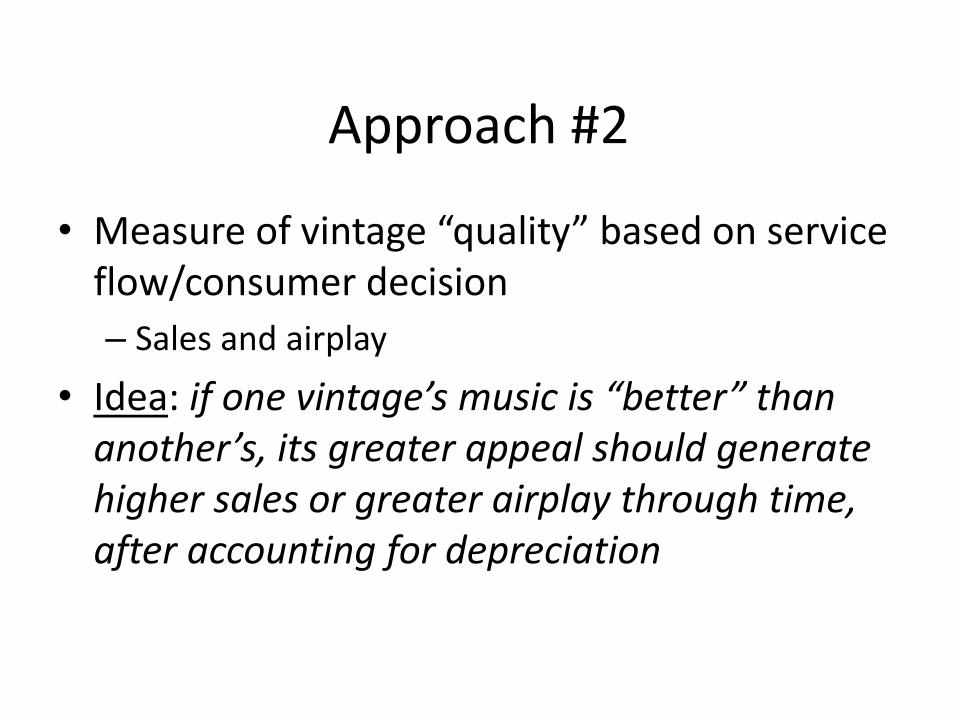
Approach #2
• Measure of vintage “quality” based on service flow/consumer decision
– Sales and airplay
• Idea: if one vintage’s music is “better” than another’s, its greater appeal should generate higher sales or greater airplay through time, after accounting for depreciation

Data: Airplay
• (Describing data first makes empirical approach easier to exposit)
• For 2004-2008, observe the annual share of aired songs originally released in each prior year.
• From Mediaguide
– 2000, over 1 million spins/year
– Lots of data: smooth, precise
05
10
15
me
an
of m
on
th_p
ct
1960
1961
1962
1963
1964
1965
1966
1967
1968
1969
1970
1971
1972
1973
1974
1975
1976
1977
1978
1979
1980
1981
1982
1983
1984
1985
1986
1987
1988
1989
1990
1991
1992
1993
1994
1995
1996
1997
1998
1999
2000
2001
2002
2003
2004
2005
2006
2007
2008
Vintage Distribution for Songs Aired in 2008
0.2
.4.6
.81
me
an
of m
on
th_p
ct
1960
1961
1962
1963
1964
1965
1966
1967
1968
1969
1970
1971
1972
1973
1974
1975
1976
1977
1978
1979
1980
1981
1982
1983
1984
1985
1986
1987
1988
1989
1990
1960 to 1990
Vintage Distribution for Songs Aired in 2008
Direct evidence of depreciation

Data: Sales
• Coarse sales data: RIAA certifications
– See when sales pass thresholds, know when released
• Gold=0.5 million, Platinum=1 million, multi-platinum=X million – Apportion uniformly
• 17,935 album certs; 4428 single certs
• Covers most of music sales
• Tracks known patterns
• Eliminate greatest hits
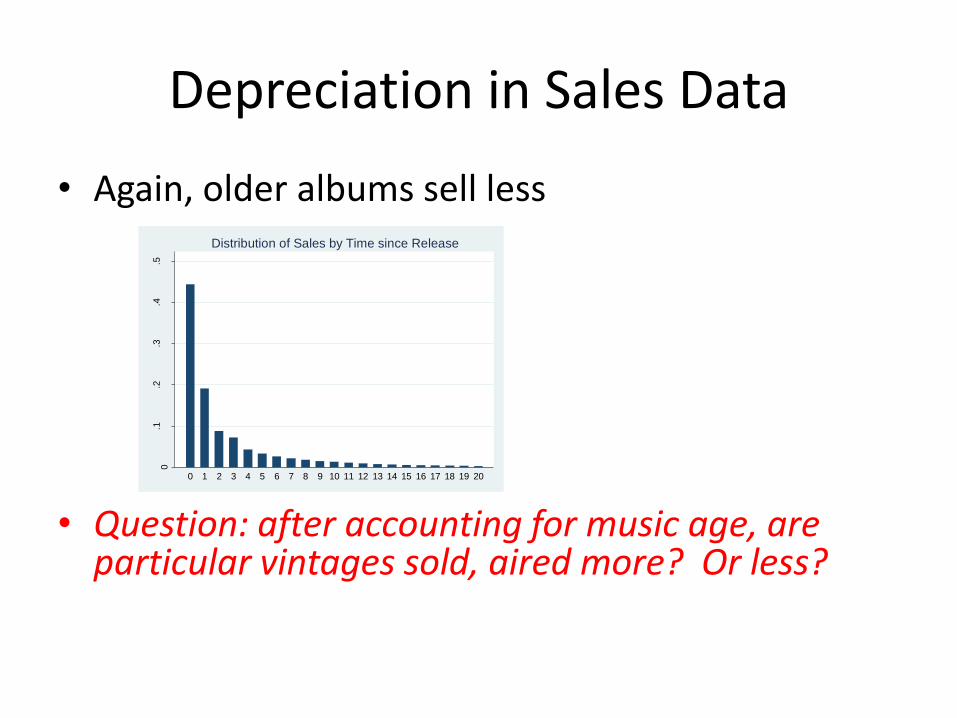
Depreciation in Sales Data
• Again, older albums sell less
• Question: after accounting for music age, are particular vintages sold, aired more? Or less?
0.1
.2.3
.4.5
me
an
of s
0 1 2 3 4 5 6 7 8 9 10 11 12 13 14 15 16 17 18 19 20
Distribution of Sales by Time since Release

Regression approach
• Define st,v = share of vintage v music in the sales or airplay of music in period t. – Observe s for V vintages and T years – For a given year t, s varies across vintages for two
reasons • Depreciation and variation in vintage quality
• Regress ln(st,v) on age dummies, vintage dummies. – Allow flexible depreciation pattern
• Then: vintage dummies are index of vintage “quality”

Resulting Airplay Index
0.5
11.5
22.5
1960 1970 1980 1990 2000 2010Vintage
Index top of 95% interval
bottom of 95% interval
Flexible Nonparametric
Airplay-Based Index
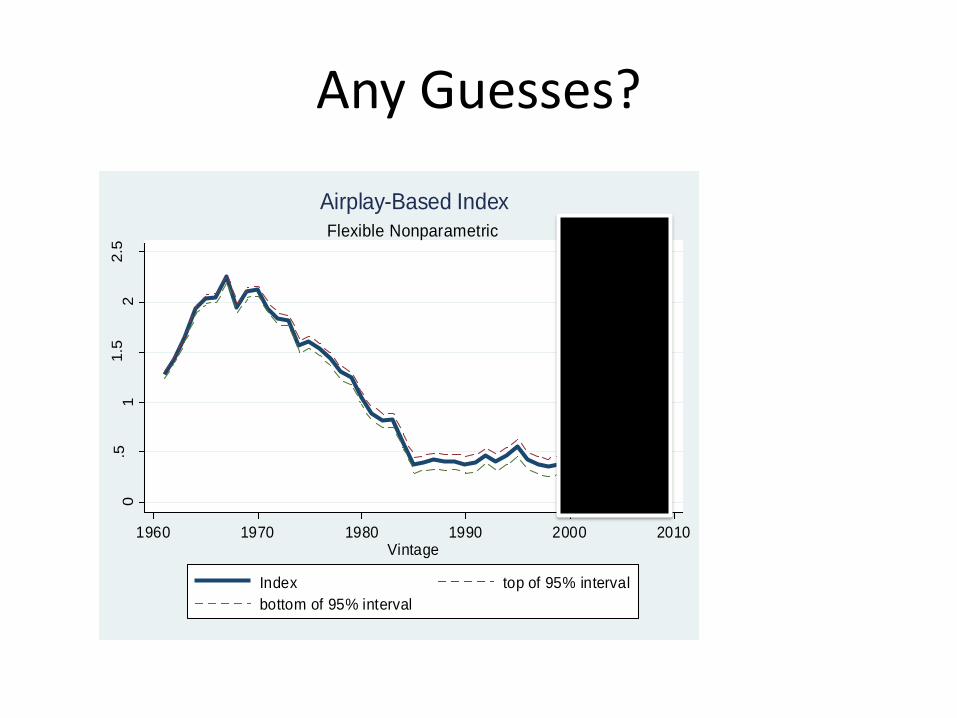
Any Guesses?
0.5
11.5
22.5
1960 1970 1980 1990 2000 2010Vintage
Index top of 95% interval
bottom of 95% interval
Flexible Nonparametric
Airplay-Based Index
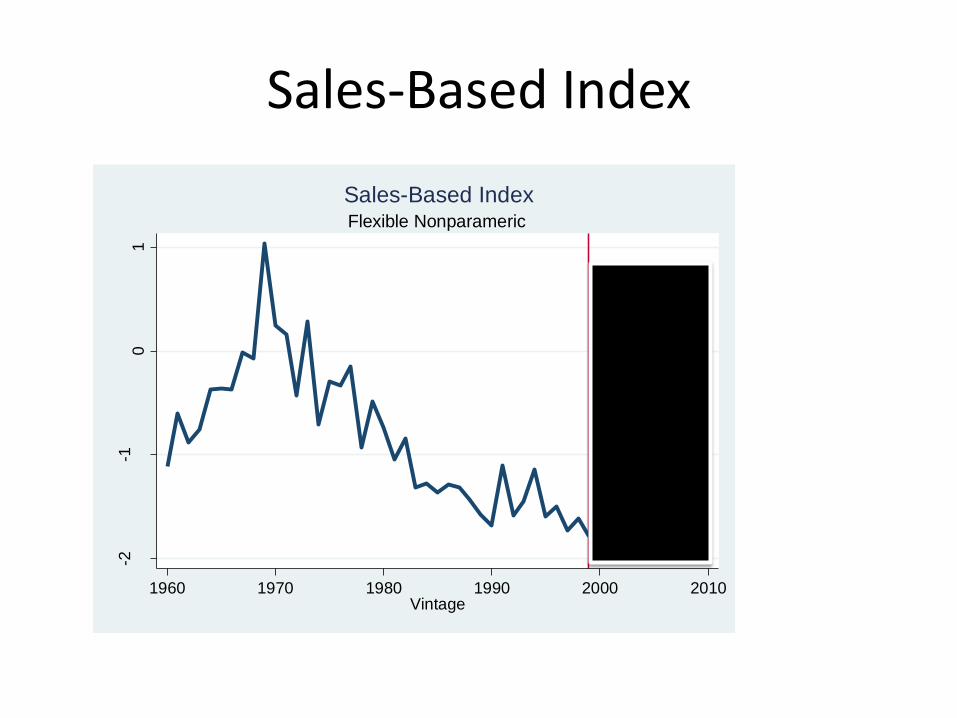
Sales-Based Index
-2-1
01
Ind
ex
1960 1970 1980 1990 2000 2010Vintage
Flexible Nonparameric
Sales-Based Index

Guesses about Sales-Based Index?
-2-1
01
Ind
ex
1960 1970 1980 1990 2000 2010Vintage
Flexible Nonparameric
Sales-Based Index
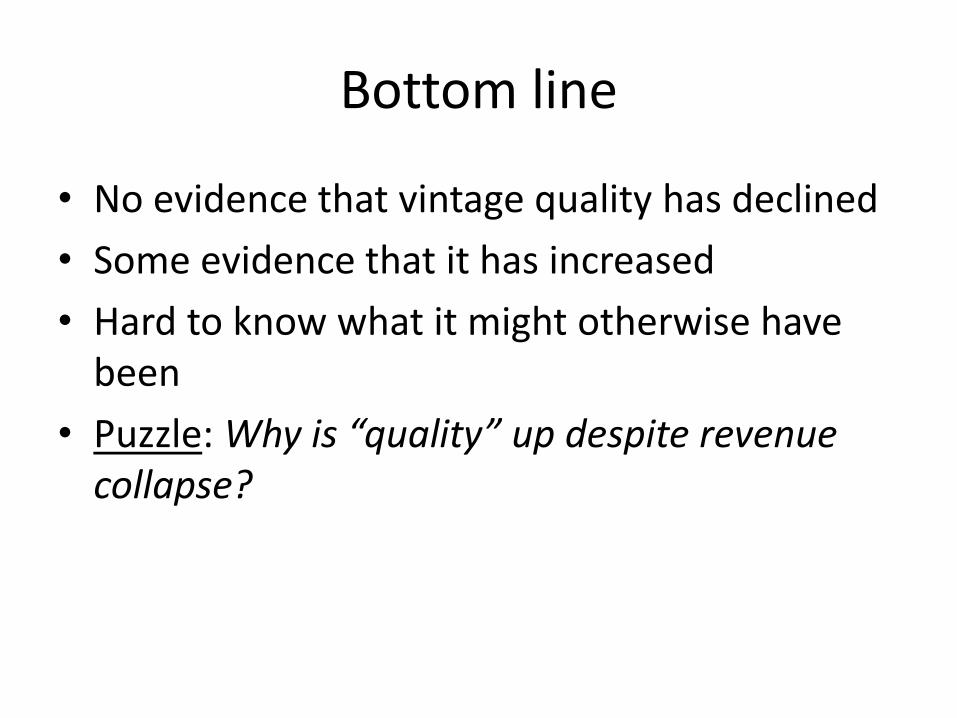
Bottom line
• No evidence that vintage quality has declined
• Some evidence that it has increased
• Hard to know what it might otherwise have been
• Puzzle: Why is “quality” up despite revenue collapse?

And the Bands Played On: Digital Disintermediation and the Quality of New Recorded Music
Joel Waldfogel
University of Minnesota and NBER
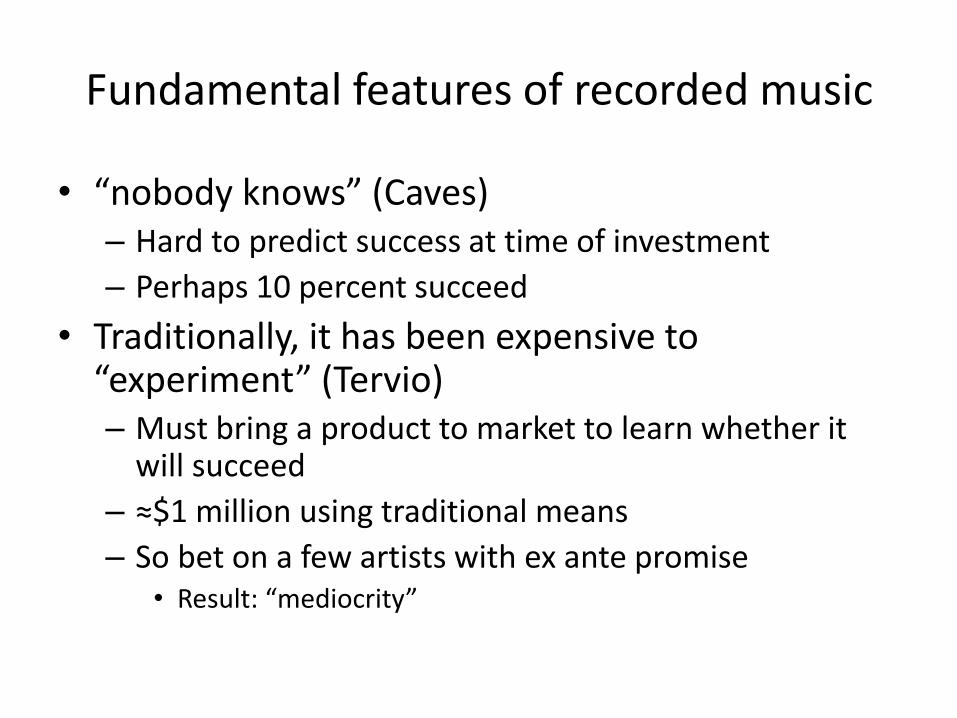
Fundamental features of recorded music
• “nobody knows” (Caves) – Hard to predict success at time of investment
– Perhaps 10 percent succeed
• Traditionally, it has been expensive to “experiment” (Tervio) – Must bring a product to market to learn whether it
will succeed
– ≈$1 million using traditional means
– So bet on a few artists with ex ante promise • Result: “mediocrity”

Along comes digitization
• (…and demand: piracy)
• …and supply – Obvious effects on production and distribution
• Recording, distribution are now inexpensive
– Promotion too? • Traditionally, radio is a bottleneck
• Now Internet radio and online criticism
• It has become cheaper to “experiment” – Do we end up discovering more artists with ex post
value?

Plan for Act II
• “model” rationalizing increased quality
• Questions
• Data
• Results

“Model” inspired by Caves(“nobody knows”) and Tervio (“mediocrity”)
• Label forms estimate of album marketability q’ as truth + error: q’=q + ϵ
• Bring a product to market if q’> T.
• Cost reduction trumps piracy, so that on balance, digitization reduces T, raising the number of projects that can be brought to market.
• Big question: what happens to the volume of “good” work available to consumers?

Suppose marketability were predictable
• Then reduction in T brings more products
• But they are of modest quality: T’ < q < T
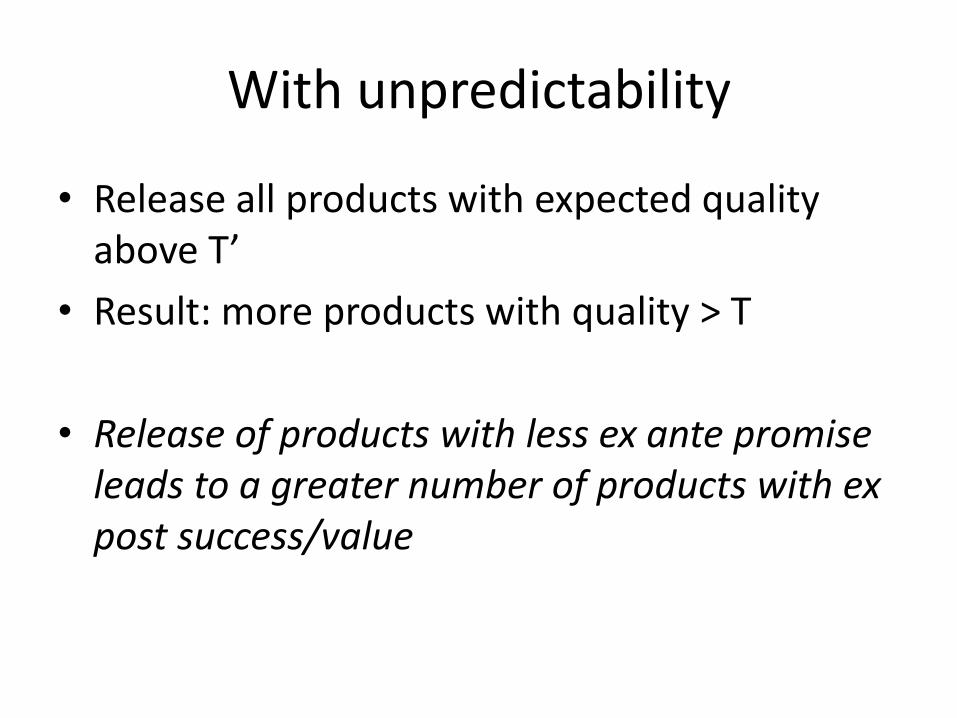
With unpredictability
• Release all products with expected quality above T’
• Result: more products with quality > T
• Release of products with less ex ante promise leads to a greater number of products with ex post success/value

Is this explanation right? Some specific empirical questions
• More new products?
• …including those with less ex ante promise?
– E.g. independent vs major labels
• A changed information/promotion environment?
– Do consumers have ways to learn about the proliferation of new music?

Questions
• Changed paths to commercial success?
– Roles of tradition radio, Internet, and critics
• Is sales concentration rising or falling?
– Do additional products draw share?
• Do the products with less ex ante promise – e.g. indie artists who would not have been released before digitization – account for a rising share of ex post success?

Illustrative Anecdote: Arcade Fire’s The Suburbs
• Released by indie Merge Records August, 3, 2011
• Critical acclaim – Metascore=87 (top 5%)
• Little conventional airplay – Not on BB Airplay Chart
– But big on Internet radio
• Success – Sold >0.5 million copies
– Best Album Grammy for 2011 1
00
00
200
00
300
00
400
00
liste
ners
01jul2010 01oct2010 01jan2011 01apr2011 01jul2011ddate
Arcade Fire – Ready to Start on Last.fm

On to more systematic evidence: Two Broad Data Sets
• Albums released in the US 1980-2010 – By label type
• major, independent, self-released
– Physical vs digital
• list of commercially successful albums – from top-selling album charts
• (and my estimates of the albums’ actual sales)
– linked with • measures of traditional radio airplay • promotion on Internet radio • coverage by music critics • whether on independent label

…from 9 underlying sources
• Recordings
– Discogs, 1980-2011
• Albums (including vinyl, CD, “files”)
• Singles excluded
• Hand-matching of labels to label codes from Thomson (2010) – Plus… “underground”, “independent”,…
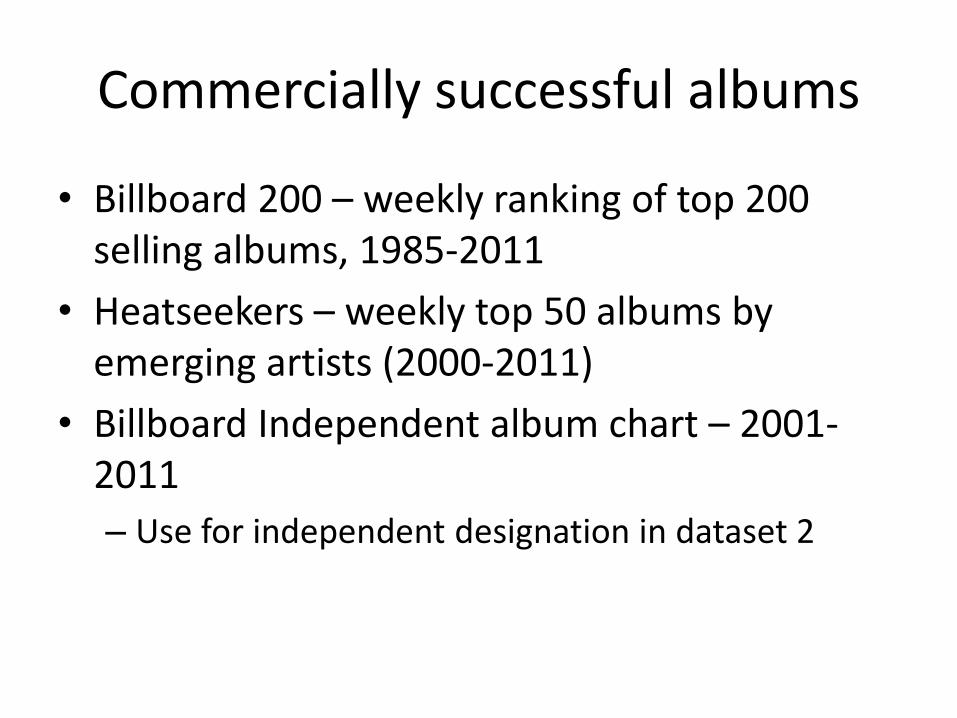
Commercially successful albums
• Billboard 200 – weekly ranking of top 200 selling albums, 1985-2011
• Heatseekers – weekly top 50 albums by emerging artists (2000-2011)
• Billboard Independent album chart – 2001-2011
– Use for independent designation in dataset 2

Promotion
• Airplay – Billboard 100 – 75 top songs of the week, 1990-
2011
– Top 200 airplay – 2009-2011
– Last.fm – top 420 songs of the week, 2006-2011
• Critics – Metacritic – coverage if 3+ critics review
– Appeared in 2000; growth to roughly 1000 albums per year in 2010

Sales Certifications
• RIAA – Gold, Platinum database
– 1970-2010
– I use to translate BB album rankings into sales estimates

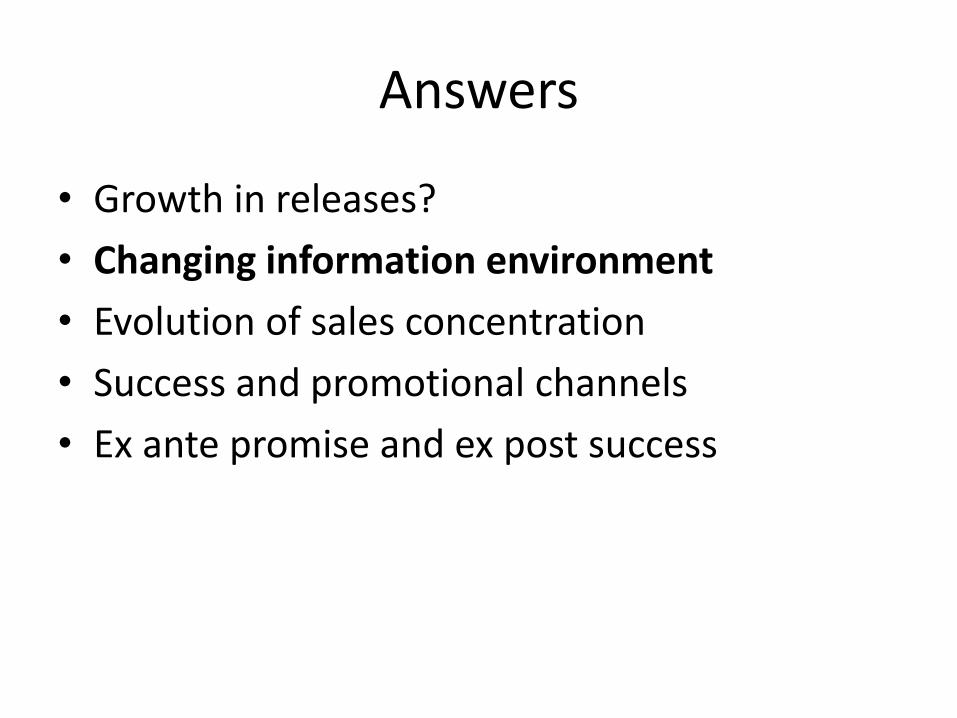
Answers
• Growth in releases?
• Changing information environment
• Evolution of sales concentration
• Success and promotional channels
• Ex ante promise and ex post success

Growth in releases over time
0
2,0
00
4,0
00
6,0
00
8,0
00
10,0
00
198019
8119
8219
8319
8419
8519
8619
8719
8819
8919
9019
9119
9219
9319
9419
9519
9619
9719
9819
9920
0020
0120
0220
0320
0420
0520
0620
0720
0820
0920
10
including unknowns
Releases by Type
sum of self sum of indie
sum of unknown sum of major
(Continued)
Nielsen: 30,000 in 2000 to about 100,000 in 2010
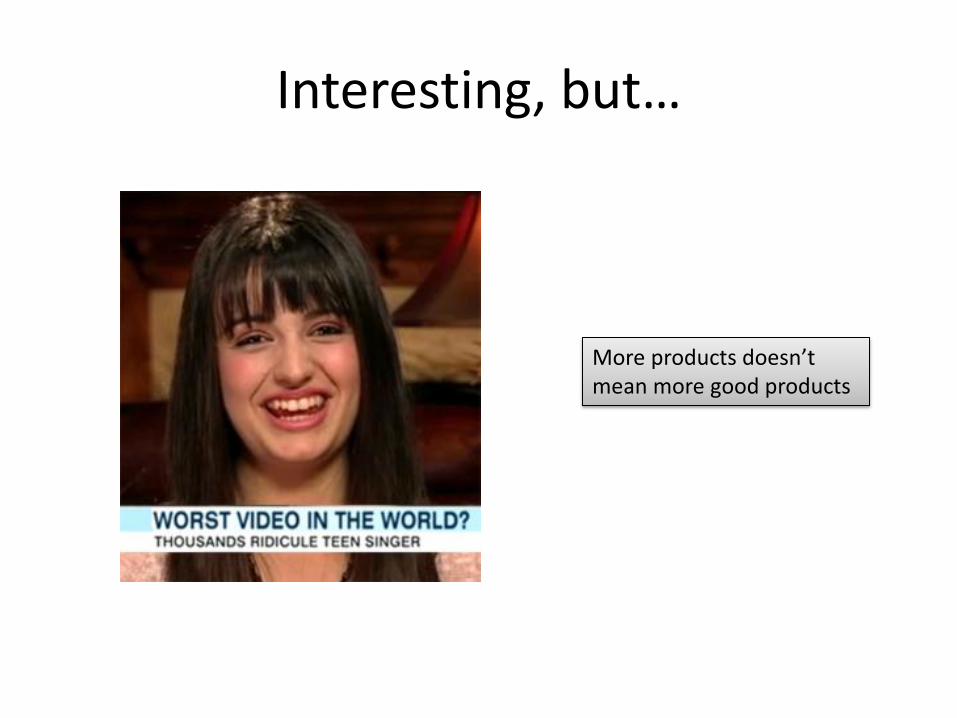
Interesting, but…
More products doesn’t mean more good products
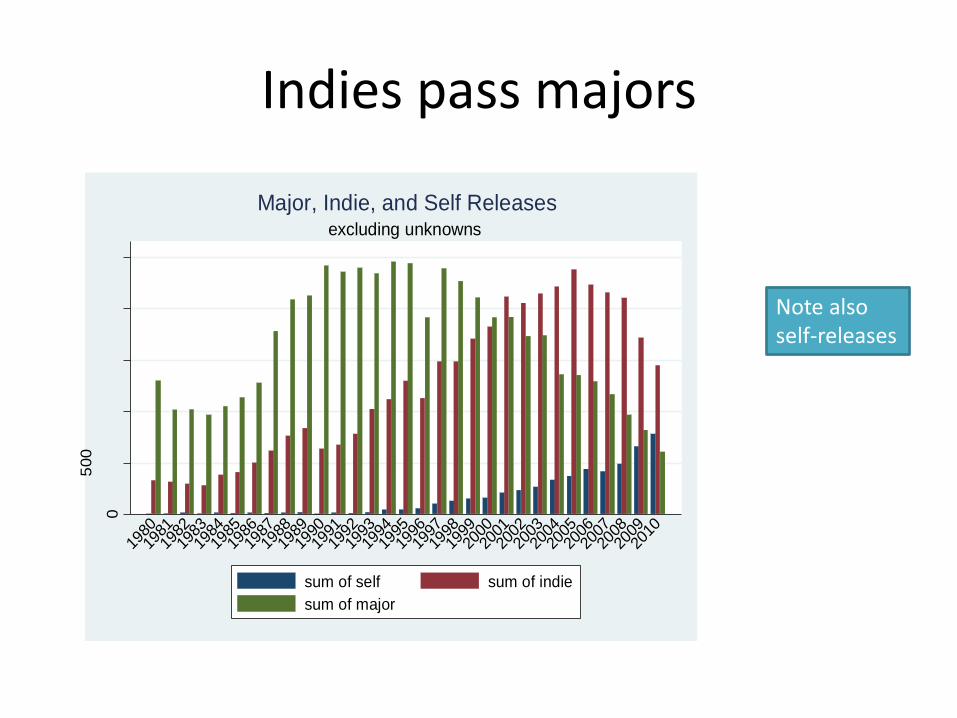
Indies pass majors 0
500
1,0
00
1,5
00
2,0
00
2,5
00
1980
1981
1982
1983
1984
1985
1986
1987
1988
1989
1990
1991
1992
1993
1994
1995
1996
1997
1998
1999
2000
2001
2002
2003
2004
2005
2006
2007
2008
2009
2010
excluding unknowns
Major, Indie, and Self Releases
sum of self sum of indie
sum of major
Note also self-releases
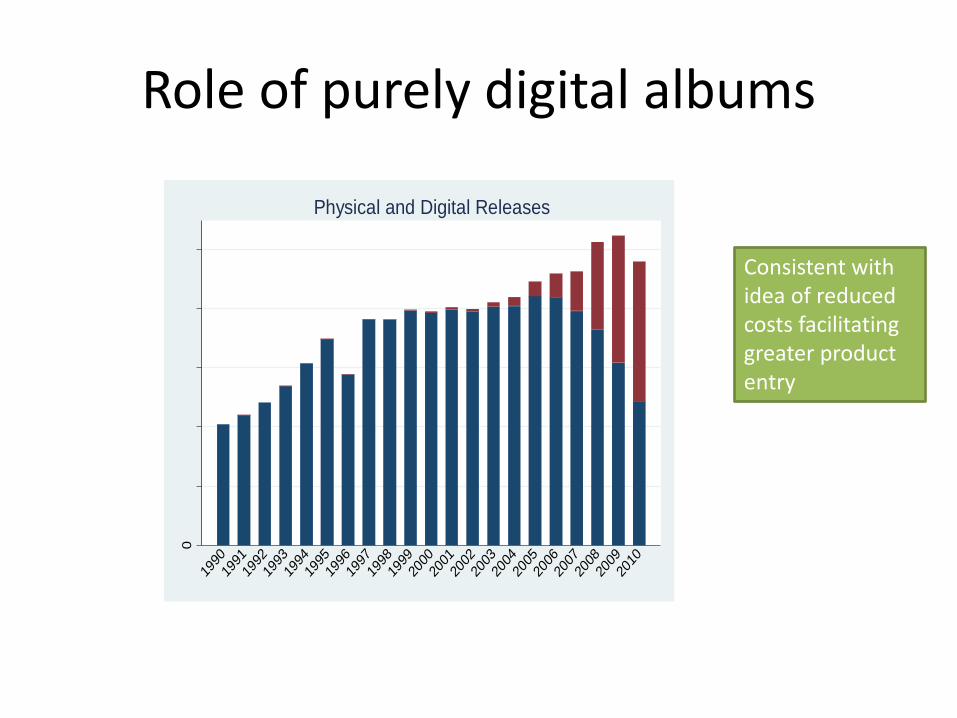
Role of purely digital albums
0
2,0
00
4,0
00
6,0
00
8,0
00
10,0
00
1990
1991
1992
1993
1994
1995
1996
1997
1998
1999
2000
2001
2002
2003
2004
2005
2006
2007
2008
2009
2010
Physical and Digital Releases
Consistent with idea of reduced costs facilitating greater product entry
Answers
• Growth in releases?
• Changing information environment
• Evolution of sales concentration
• Success and promotional channels
• Ex ante promise and ex post success

Changing Information Environment
• Traditional radio
– BB airplay – top 75 songs by week
• 3,900 listings per year
– But only about 300 distinct artists
• Traditional vs Internet radio
– Compare BB list with last.fm top 420 songs of the week
– Little overlap – 10 percent
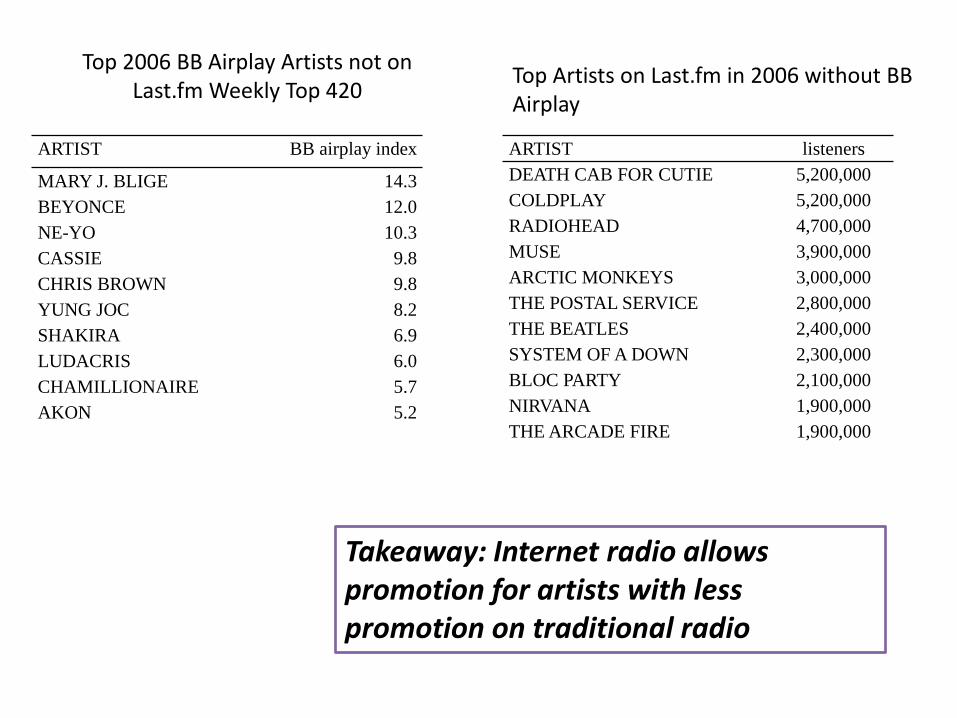
Top 2006 BB Airplay Artists not on Last.fm Weekly Top 420
ARTIST BB airplay index
MARY J. BLIGE 14.3
BEYONCE 12.0
NE-YO 10.3
CASSIE 9.8
CHRIS BROWN 9.8
YUNG JOC 8.2
SHAKIRA 6.9
LUDACRIS 6.0
CHAMILLIONAIRE 5.7
AKON 5.2
ARTIST listeners
DEATH CAB FOR CUTIE 5,200,000
COLDPLAY 5,200,000
RADIOHEAD 4,700,000
MUSE 3,900,000
ARCTIC MONKEYS 3,000,000
THE POSTAL SERVICE 2,800,000
THE BEATLES 2,400,000
SYSTEM OF A DOWN 2,300,000
BLOC PARTY 2,100,000
NIRVANA 1,900,000
THE ARCADE FIRE 1,900,000
Top Artists on Last.fm in 2006 without BB Airplay
Takeaway: Internet radio allows promotion for artists with less promotion on traditional radio

Second, growth in criticism
• Much of it online
Rolling Stone
Alternative PressSpin
Q MagazineEntertainment Weekly
All Music GuideMojo
The A.V. Club
Pitchfork
Uncut
PopMatters
Drowned In Sound
Under The Radar
0
200
00
400
00
600
00
800
00
100
00
0
Cum
ula
tive M
eta
cri
tic R
evie
ws 2
00
0-2
01
1
1970 1980 1990 2000 2010Founding Year
sources founded since 1980 with over 2000 reviews in Metacritic
Growth in Reviews

Answers
• Growth in releases?
• Changing information environment
• Evolution of sales concentration
• Success and promotional channels
• Ex ante promise and ex post success

Evolution of sales concentration
• More products available
• Do more products achieve (relative) commercial success?
– Do more albums enter the weekly BB200?
– Not the dumb question it sounds like
• 200 listings/week x 52 weeks = 10,400 listings/year
• Could be anywhere between 200 and 10,400 distinct artists per year
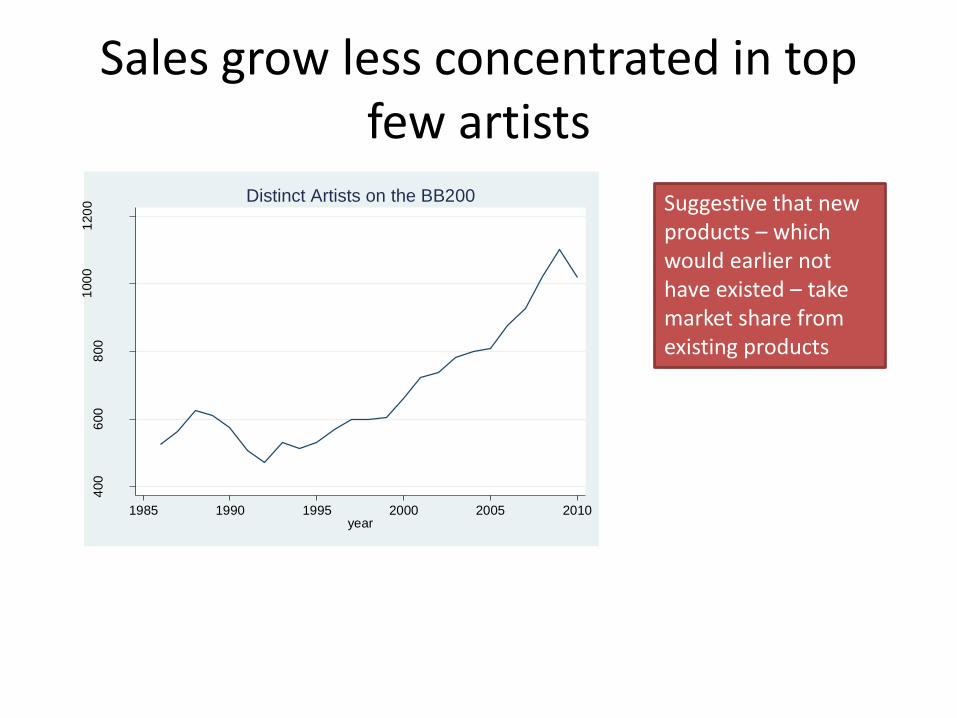
Sales grow less concentrated in top few artists
400
600
800
100
01
20
0
Num
ber
1985 1990 1995 2000 2005 2010year
Distinct Artists on the BB200 Suggestive that new products – which would earlier not have existed – take market share from existing products

Answers
• Growth in releases?
• Changing information environment
• Evolution of sales concentration
• Success and promotional channels
• Ex ante promise and ex post success

Success and promotional channels
• What’s happening to the role of traditional airplay among successful artists?
• What’s happening to the role of critics?

Declining role of traditional radio 0
.1.2
.3
mea
n o
f d
air
1991
1992
1993
1994
1995
1996
1997
1998
1999
2000
2001
2002
2003
2004
2005
2006
2007
2008
2009
2010
Share of BB200 with Billboard Airplay
Declining share with airplay, especially since 2000
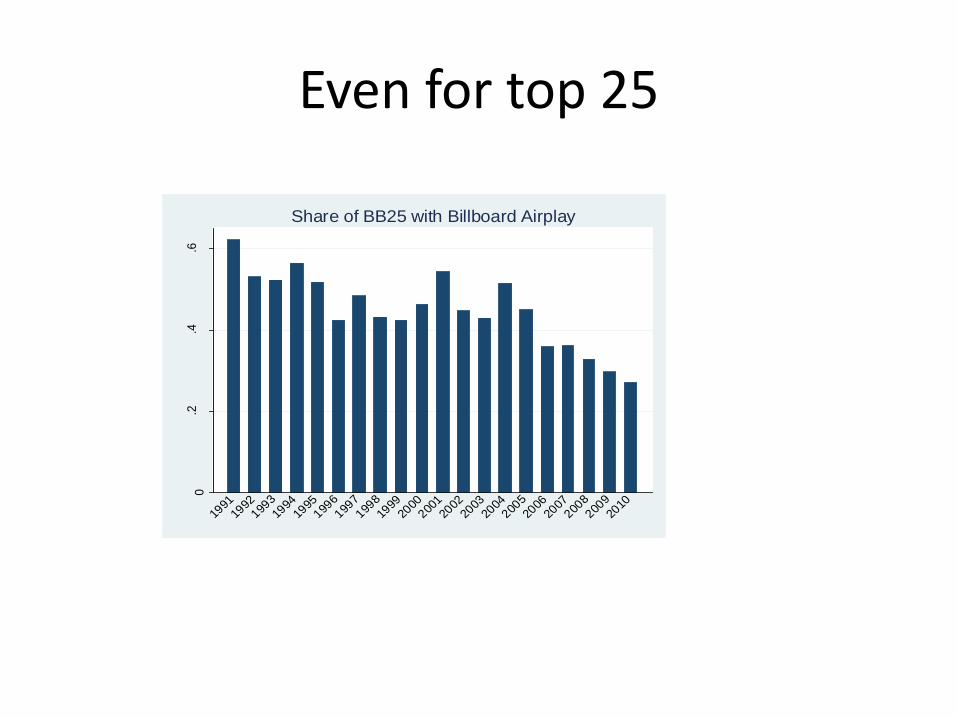
Even for top 25
0.2
.4.6
mea
n o
f d
air
1991
1992
1993
1994
1995
1996
1997
1998
1999
2000
200120
0220
0320
04200
5
2006
2007
2008
2009
2010
Share of BB25 with Billboard Airplay
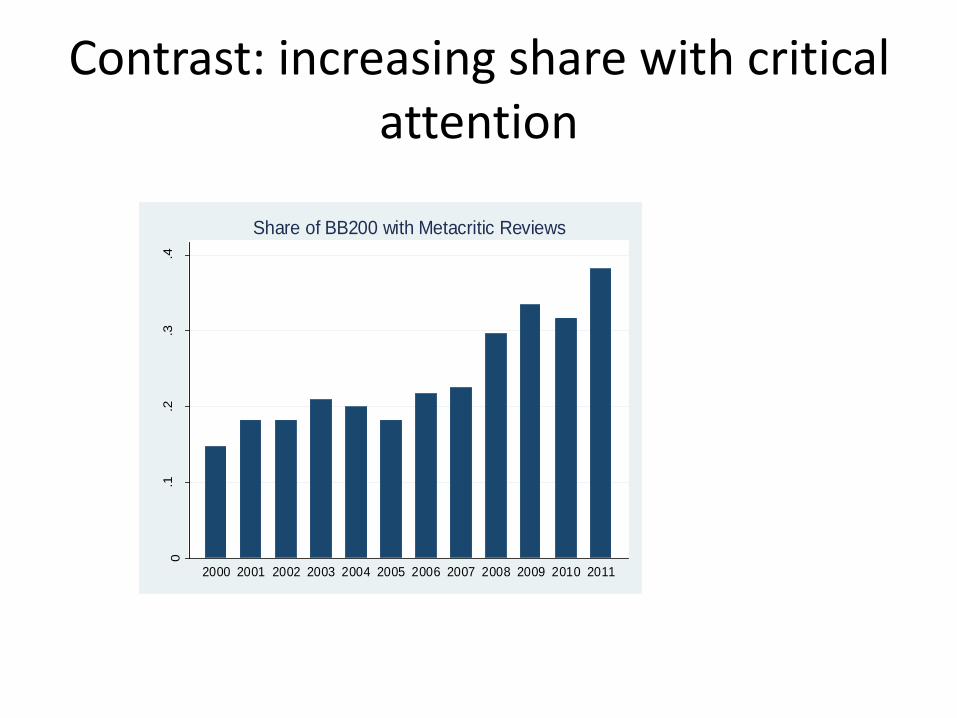
Contrast: increasing share with critical attention
0.1
.2.3
.4
mea
n o
f d
me
ta
2000 2001 2002 2003 2004 2005 2006 2007 2008 2009 2010 2011
Share of BB200 with Metacritic Reviews

Answers
• Growth in releases?
• Changing information environment
• Evolution of sales concentration
• Success and promotional channels
• Ex ante promise and ex post success
And, finally:
Ex ante promise and ex post success
• Do artist with less ex ante promise – who would not have made it to market prior to digitization – now achieve sales success?
• Specifically, do indies account for a growing share of sales?

Yes 0
.1.2
.3.4
me
an
of din
die
2001 2002 2003 2004 2005 2006 2007 2008 2009 2010
Indie Share among Billboard 200
0
.05
.1.1
5.2
me
an
of din
die
2001 2002 2003 2004 2005 2006 2007 2008 2009 2010
Indie Share among Billboard 25

Conclusion
• Despite revenue reduction, “quality” is up
• Digital disintermediation provides possible explanation for increased “quality”
• Given unpredictability, more “experimentation” leads to discovery of additional “good” music
• Much of which would not have come to market before digitization
The changing face of “digitization”
to