Digital - Speech and VIsion Lab
26
2s . _- __ ii!!3 SPEECH cow ELSEVIER Speech Communication 18 (1996) 21-46 Word boundary hypothesization for continuous speech in Hindi based on F, patterns S. Rajendran *, B. Yegnanarayana Speech and Vision Laboratory, Department of Computer Science and Engineering, Indian Institute of Technology, Madras 600 036, India Received 3 February 1994; revised 4 November 1994 Abstract - This paper proposes an algorithm based on F, patterns to hypothesize word boundaries and function words in continuous speech in Hindi. It makes use of the properties of F, contour such as declination tendency, resetting and fall-rise patterns in Hindi. The syllabic units are identified by using the energy contour, pitch and the first order LP coefficient. Each syllabic unit is assigned an accent value L (Low), H or h (High) by (i) comparing the F, value at the mid point of each syllabic nucleus with that of the previous syllabic unit and (ii) comparing the F,, values at two different points within each syllabic unit in a sequence having an accent value L. Word boundaries are placed between the adjacent syllabic units (i) H and L, (ii) h and L, (iii) L and L, (iv) L and h and (v) H and h. An evaluation conducted on a corpus of 50 sentences in Hindi read aloud by five native speakers in an ordinary office environment showed that about 74 percent of the word boundaries and about 28 percent of the function words were correctly identified. The results of the word boundary hypothesization can be used to improve the performance of the acoustic-phonetic, lexical and syntactic modules in a speech-to-text conversion system. Robustness of the algorithm in handling noisy speech input conditions and telephone speech are also discussed. Zusammenfassung Dieser Beitrag beschreibt einen auf Grundfrequenzverllufen basierenden Algorithmus zur Prsdiktion von Wortgrenzen und FunktionswGrtern in kontinuierlich gesprochenem Hindi. Er beniitzt Eigenschaften von Grundfre- quenzverlgufen wie Deklinationstendenz, Riicksetzung und Abfall-Anstiegs-Muster des Hindi. Die silbischen Grundeinheiten werden aufgrund des Energieverlaufs, der Tonhijhe und des LP-Koeffizienten erster Ordnung ermittelt. Jeder silbischen Grundeinheit wird ein Akzentwer L (tief), H oder h (hoch) zugeordnet (i) durch Vergleich des F,-Wertes in der Mitte jedes Silbenkerns mit demjenigen der vorhergehenden silbischen Einheit und (ii) durch Vergleich der F,-Werte an zwei verschiedenen Punkten innerhalb jeder silbischen Einheit in einer Sequenz mit Akzentwert L. Wortgrenzen werden zwischen den angrenzenden silbischen Einheiten (i) H und L, (ii) h und L, (iii) L und L, (iv) L und h und (v) H und h gesetzt. Eine Bewertung basierend auf einem Korpus von 50 Hindi-Sltzen, die von fiinf muttersprachlichen Sprechern in einer normalen Biiroumgebung vorgelesen wurden, hat gezeigt, dalj ungefihr 74 Prozent der Wortgrenzen und ungefihr 28 Prozent der Funktionswijrter korrekt identifiziert worden sind. Die Ergebnisse der Wortgrenzenhypothetisierung kiinnen dazu beniitzt werden, die Leistungsftihigkeit des * Corresponding author. 0167-6393/96/$15.00 0 1996 Elsevier Science B.V. All rights reserved SSDI 0167-6393(95)00022-4
Transcript of Digital - Speech and VIsion Lab

2s . _- __ ii!!3 SPEECH cow ELSEVIER Speech Communication 18 (1996) 21-46
Word boundary hypothesization for continuous speech in Hindi based on F, patterns
S. Rajendran *, B. Yegnanarayana
Speech and Vision Laboratory, Department of Computer Science and Engineering, Indian Institute of Technology, Madras 600 036, India
Received 3 February 1994; revised 4 November 1994
Abstract
-
This paper proposes an algorithm based on F, patterns to hypothesize word boundaries and function words in continuous speech in Hindi. It makes use of the properties of F, contour such as declination tendency, resetting and fall-rise patterns in Hindi. The syllabic units are identified by using the energy contour, pitch and the first order LP coefficient. Each syllabic unit is assigned an accent value L (Low), H or h (High) by (i) comparing the F, value at the mid point of each syllabic nucleus with that of the previous syllabic unit and (ii) comparing the F,, values at two different points within each syllabic unit in a sequence having an accent value L. Word boundaries are placed between the adjacent syllabic units (i) H and L, (ii) h and L, (iii) L and L, (iv) L and h and (v) H and h. An evaluation conducted on a corpus of 50 sentences in Hindi read aloud by five native speakers in an ordinary office environment showed that about 74 percent of the word boundaries and about 28 percent of the function words were correctly identified. The results of the word boundary hypothesization can be used to improve the performance of the acoustic-phonetic, lexical and syntactic modules in a speech-to-text conversion system. Robustness of the algorithm in handling noisy speech input conditions and telephone speech are also discussed.
Zusammenfassung
Dieser Beitrag beschreibt einen auf Grundfrequenzverllufen basierenden Algorithmus zur Prsdiktion von Wortgrenzen und FunktionswGrtern in kontinuierlich gesprochenem Hindi. Er beniitzt Eigenschaften von Grundfre- quenzverlgufen wie Deklinationstendenz, Riicksetzung und Abfall-Anstiegs-Muster des Hindi. Die silbischen Grundeinheiten werden aufgrund des Energieverlaufs, der Tonhijhe und des LP-Koeffizienten erster Ordnung ermittelt. Jeder silbischen Grundeinheit wird ein Akzentwer L (tief), H oder h (hoch) zugeordnet (i) durch Vergleich des F,-Wertes in der Mitte jedes Silbenkerns mit demjenigen der vorhergehenden silbischen Einheit und (ii) durch Vergleich der F,-Werte an zwei verschiedenen Punkten innerhalb jeder silbischen Einheit in einer Sequenz mit Akzentwert L. Wortgrenzen werden zwischen den angrenzenden silbischen Einheiten (i) H und L, (ii) h und L, (iii) L und L, (iv) L und h und (v) H und h gesetzt. Eine Bewertung basierend auf einem Korpus von 50 Hindi-Sltzen, die von fiinf muttersprachlichen Sprechern in einer normalen Biiroumgebung vorgelesen wurden, hat gezeigt, dalj ungefihr 74 Prozent der Wortgrenzen und ungefihr 28 Prozent der Funktionswijrter korrekt identifiziert worden sind. Die Ergebnisse der Wortgrenzenhypothetisierung kiinnen dazu beniitzt werden, die Leistungsftihigkeit des
* Corresponding author.
0167-6393/96/$15.00 0 1996 Elsevier Science B.V. All rights reserved
SSDI 0167-6393(95)00022-4
22 S. Rajendran, B. Yegnanarayana /Speech Communication 18 (1996) 21-46
akustisch-phone&hen, des lexikalischen und des syntaktischen Moduls eines Sprache-Text-Umsetzungssystems zu verbessern. Die Robustheit des Algorithmus beziiglich der Behandlung verrauschter Eingabesprachsignale und von Telefonsprache werden ebenfalls diskutiert.
R&urn6
Cet article propose un algorithme de prtdiction, sur la base des contours de F,, des front&es de mots et des mots grammaticaux en Hindi. 11 utilise des propri&& des contours de F,, comme la tendance ?I la diclinaison, la remise B niveau, et les formes de type montant-descendent. Les unit& syllabiques sont identifiies B partir du contour d’Cnergie, de F, et du coefficient de prCdiction lintaire du premier ordre. A chaque syllabe est assignCe une valeur d’accent L (has), H ou h (haut) en (i) comparant la valeur de F, au centre de chaque noyau syllabique avec celle de I’unitC syllabique prCcCdente et (ii) en comparant les valeurs de F, en deux points diffirents au sein de chaque unit6 syllabique dans une sCquence ayant une valeur d’accent L. Les frontitres de mots sont plactes entre les unit& syllabiques adjacentes H et L, h et L, L et L, L et h, H et h. Une kaluation menCe sur un corpus de 50 phrases en Hindi lues par cinq locuteurs natifs dans un environment de bureau montre que environ 74% des front&es de mots et environ 28% des mats grammaticaux sont identifiCs correctement. Les rCsultats de cette prtdiction peuvent &tre utilisCs pour amCliorer les performances des modules de dtcodage acoustico-phonttique, d’analyse lexicale ou syntaxique d’un systhme de transcription parole-texte. La robustesse de l’algorithme dans le cas de parole bruitCe est Cgalement disc&e.
Keywords: Word boundary; F, pattern; Prosody
1. Introduction prosodic features would help reduce the complex- ity in the later stages of knowledge processing.
Several knowledge sources are used in contin- Several factors motivate prosodic analysis for uous speech recognition system for placing word word boundary hypothesization. They can be boundaries besides lexical matching. Some of summarized as follows. (1) The prosodic parame- these knowledge sources are phonotactic con- ters (duration, intensity and pitch) reflect impor- straints (Harrington et al., 19871, durational clues tant knowledge sources used in the production of (Wightman and Ostendorf, 1991), language clues speech by human beings. Features of intonation (Ramana Rao and Yegnanarayana, 1991), syntac- such as declination/rising tendency of F, con- tic constraints, etc. Use of these knowledge tour, F, resetting, F, range and F, rules repre- sources presupposes availability of output text sent important discourse information (Lieberman symbols from the acoustic-phonetic module. Al- and Pierrehumbert, 1984). Similarly, durations of gorithms for hypothesizing word boundaries from the word final phonemes are used to assess the phonological constraints and dictionary matching syntactic relation between adjacent words (Price are time consuming. They may also give unreli- et al., 1990; Klatt, 1975). (2) The stressed syllables able results since these algorithms have to deal are considered islands ofphonetic reliability (Lea, with the ambiguity in the output of the acoustic- 1980). Recognition of the stressed syllables can phonetic decoding block. It is also possible that improve the reliability and reduce the error rate several alternative word sequences may result in the output of the acoustic-phonetic module due to several possible valid combinations of the considerably. It may be possible to design prosod- symbolic units in the lattice. The hypothesized ically guided word boundary hypothesizers based words are usually passed onto syntactic and se- on differences in stress patterns in continuous mantic analyzer modules to eliminate the wrong speech (Martin, 1979). Thus prosodically guided alternatives. Thus, the errors produced by the word boundaries provide scope for top-down acoustic-phonetic module due to variability in the analysis and this, along with the bottom-up ap- input speech propagate to the higher modules. proach, enhances recognition capability (Cutler, Word boundary hypothesization based on 1990).
S. Rajendran, B. Yegnanarayana /Speech Communication 18 (1996) 21-46 23
Lea (1980) and Waibel (1988) have discussed application of prosodic knowledge for word boundary hypothesization. These studies have es- tablished the usefulness of prosodic clues in hy- pothesizing word boundaries for English speech. In this paper we discuss an approach for hypothe- sizing word boundaries in continuous speech in Hindi based on F, pattern.
The paper is organized as follows. Section 2 deals with F, patterns in Hindi. An algorithm for hypothesizing word boundaries is described in Section 3. The results are discussed in Section 4.
2. F, patterns in Hindi
The F0 contour of speech utterances produced by a normal human being is determined by lin- guistic factors such as phonology, morphology, syntax and semantics, extralinguistic factors such as social and psychological characteristics and physiological factors such as the inherent charac- teristics of speech production mechanism and coarticulatory constraints. The domain of perva- siveness of these factors on F,, contour and their interactions are very complex.
We have conducted a study to analyse the F, patterns in Hindi speech utterances. A speech database consisting of about 500 sentences read aloud by two male adult native Hindi speakers in
an ordinary office environment was used. Read- ing style was chosen for the study. However, a few sentences in conversation style were also included in the speech data to examine the F, patterns. The speakers were advised to read at their comfortable speaking rate. Speech was digi- tized to 12 bits/sample at a sampling rate of 10 kHz. Analysis frames each of size 256 samples and a shift of 64 samples between successive frames were used for extracting pitch. The algo- rithm for pitch extraction was based on the prop- erties of group delay functions (Yegnanarayana et al., 1991).
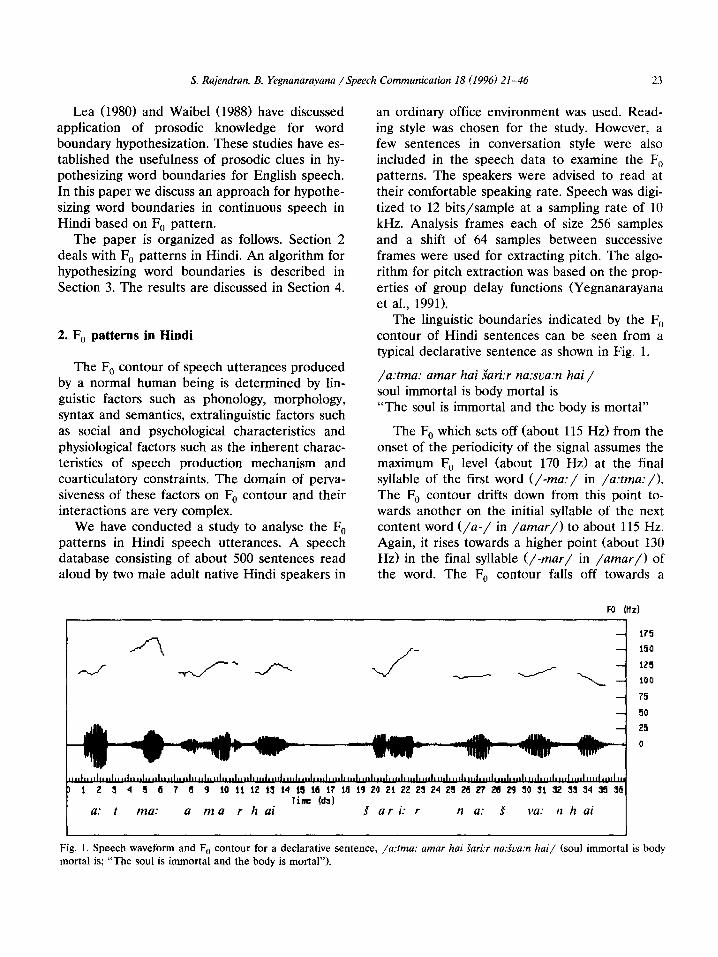
The linguistic boundaries indicated by the F,, contour of Hindi sentences can be seen from a typical declarative sentence as shown in Fig. 1.
/a:tma: amar hai Sari:r na:sva:n hai / soul immortal is body mortal is “The soul is immortal and the body is mortal”
The F, which sets off (about 115 Hz) from the onset of the periodicity of the signal assumes the maximum F, level (about 170 Hz) at the final syllable of the first word (/-ma:/ in /a:tma:/). The F, contour drifts down from this point to- wards another on the initial syllable of the next content word (/a-/ in /amar/) to about 115 Hz. Again, it rises towards a higher point (about 130 Hz) in the final syllable (/-mar/ in /amar/) of the word. The F0 contour falls off towards a
175
4 150
-t--L/-- J---- J- - “/\
:
125
100
75
50
1 2 !i 4 5 6 7 6 9 10 11 12 13 14 15 15 17 13 19 20 21 22 23 24 25 25 2? 23 29 30 31 32 33 34 35 36 Tine (da]
a: t ma: a m a r h ai S a r i: r n a: S bja: II h ai
Fig. 1. Speech waveform and F, contour for a declarative sentence, /a:tma: amar hai Zaritr na.5a.x hai/ (soul immortal is body
mortal is; “The soul is immortal and the body is mortal”).
24 S. Rajendran, B. Yegnanarayana /Speech Communication 18 (1996) 21-46
lower point (about 105 Hz) and rises towards another point within the same word (/hai/) and finally it tapers off to about 110 Hz.
The F, contour of the utterance is character- ized by a few target points. The target points are the local maxima and minima of F, which result in rise and fall of F, movements. The local min- ima and maxima are called valleys and peaks, respectively. If two imaginary grid lines are drawn, one connecting all the peaks and the other all the valleys, it is possible to say that the F,, contour drifts down as a function of time till the occur- rence of a major syntactic or semantic break (at the end of /a:trna: amar hai/ and at the end of the sentence), which is also marked by a signifi- cant pause duration (of about 300 ms). The grid lines show an upward trend in the case of inter- rogative sentences. The declination of the F, con- tour in declarative sentences in Hindi is similar to that of many other languages, such as English (Pierrehumbert, 1981>, French (Delgutte, 1978), Japanese (Fujisaki and Hirose, 19851, German (Kohler, 19901, Dutch (Gussenhoven and Ri- etweld, 1988), Danish (Thorsen, 1980), etc.
The declining or rising pattern of F, contour is reset at some points which coincide with major syntactic or semantic boundaries. The resetting corresponds to breathing or pauses employed by the speaker for linguistic reasons. The resetting is indicated by silence and subsequent rise in F,, contour (Madhukumar et al., 1993). Other effects that indicate resetting are changes in amplitude, phrase final lengthening and phonetic features. The resetting events in the speech signal have to be captured because the resetting forms a hierar- chy of boundaries within which other rules relat- ing to lower level linguistic boundaries like phrase, word or morpheme boundaries are applied. The part of the utterance delimited by such a pause is called intonational phrase (Ladd, 1986).
Physiologically, the target points are indica- tions of onset-offset changes in nerve cells which cause attention sharpening effects (Garding, 1991). The occurrence of target points, namely the valleys and peaks, have a definite correlation with the phonological pattern and class of words in Hindi.
F, is also an important correlate of stress in
Hindi (Ohala, 1986). Stress in Hindi is not phone- mic. It does not cause any change in the meaning of a word. Earlier studies of Hindi stress suggest that stress in Hindi is weight sensitive (Mehrotra, 1965; Kelkar, 1968; Sharma, 1969) and the sylla- bles are obligatorily classified into light or heavy before assigning stress rules. The classification of syllables into light and heavy is based on (i) whether or not the syllable is closed and (ii) the quantity of the vowel. A syllable is light when the vowel in the syllable is short and the syllable is open, and heavy in all other cases. Kelkar (1968) prefers a three way classification namely, light, medium and heavy. In this classification, medium corresponds to long open vowel or short vowel followed by a consonant and heavy corresponds to closed long vowel. Stress in disyllabic words, for example, is assigned to the heavy syllable if there is only one. If both syllables are heavy or light, then the penultimate syllable is assigned stress. However, there are differences in the stress assignment rules proposed in these studies. Most of these studies were impressionistic and were unsupported by any instrumental evidence.
Experimental verification of stress conducted by Ohala suggests that the heavy syllable does not always receive stress (Ohala, 1986). Nevertheless, the stress pattern in isolated word is not the same for the word in the context of a sentence. The stressed syllable in a polysyllabic word is charac- terized by either a high or a rising pitch with a falling pitch on the following syllable. Experi- ments on synthetic data also suggest that Hindi listeners accept far more variation in pitch (Ohala, 1986, 1991).
If F, is an important acoustic correlate of stress in Hindi, and stress is predictable based on the syllabic pattern of words as suggested by the earlier studies, then we expect high F, in the initial syllable in words with syllable patterns like (i) CqC.CqC, (ii) C%C.CvC and (iii) Cq.C?. We have conducted an experiment to find out the correlation between syllabic weight and F, pat- tern using disyllabic words. Several sentences with disyllabic words with different syllabic sequences were read aloud by two native speakers. The F,, value at the mid point of syllabic nucleus (vowel) is measured. The results are shown in Table 1.

S. Rajendran, B. Yegnanarayana /Speech Communication 18 (1996) 21-46 25
FO Wr)
FO (Hz) FO (Hz)
_____//_ :i: 1 200
125
100
75
50
25
0
P 10 20 30 40
Time (CJ)
h a n a: r a s
FO (Hz)
0 10 20 30 40 50 60 70 Time (cc)
s vu t an t ra t a:
1
C
FG (tir)
(b)
:
175
- :z
100
75
50
.,.“,,:‘-jF’.:‘“f’
II
0
(4 FO (Hz)
I
0 Time (CJ)
(4 (0 Fig. 2. F, target points (valleys and peaks) for (a) monosyllabic word /dharm/ “charity”, (b) disyllabic word /kr:val/ “only”, (c) trisyllabic word /bana:ras/ “Banaras (name of a town)“, Cd) trisyllabic word /samudr&/ “seas”, (e) tetrasyllabic word /suatantrata:/ “freedom”, (f) tetrasyllabic word /anuSa:san/ “forebearance”, (g) pentasyllabic word /samajhnetua:lat/ “pertain- ing to understanding”.

S. Rajendran, B. Yegnanarayana /Speech Communication 18 (1996) 21-46
FO (Hz)
I ,
50
25
0
s a m a: 1”’ n e: v a: 1 e:
k) Fig. 2. Continued.
The results indicate that F, is higher in the final syllable of all disyllabic words. The syllabic weight based on the length of the vowel and the pres-
Table 1 Syllabic weight and Fa pattern in Hindi
Syllabic Syllabic Word Gloss Fa value measured at the middle pattern weight of vowel (Syllable nuclei)
for Speaker 1 for Speaker 2
Vl v2 Vl v2
ence of coda does not modify the F, contour significantly.
These invariant features of F, pattern are ex- ploited for hypothesizing word boundaries. A dis- tinction has to be made between content word and function word for explaining prosodic varia- tion in continuous speech. Fig. 2(a-g) shows the F, patterns of the content words in Hindi.
Monosyllabic content words show a valley fol- lowed by a peak within the same syllable (Fig. 2(a)). The FO contour rises from the beginning of the voiced region of the syllable towards the middle or the end of the voiced region of the syllable. In disyllabic words the valley occurs on the initial syllable and the peak occurs on the final syllable with a straight transition of F, (Fig. 2(b)). Trisyllabic words show two types of F,, pat- terns: (a) The valley occurs on the initial sylla-
c+c.c~c HH bandar monkey 110 139 130 164 band ban relationship 141 169 115 127 kasrat exercise 110 135 128 152 garbat beverage 111 130 130 147 patt bar stone 118 135 125 149 karvat circle 122 130 133 141 daldal quicksand 116 143 125 162 k handan deny 115 123 137 139 darSan worship 116 135 133 149
(C)V(C).CWC) HH na:na grandfather 114 139 127 150 sa:la: wife’s brother 111 139 125 154 k ha:na: meal 115 133 115 137 ga:na: to sing 100 116 134 152 da:lna: to put 109 137 128 132 ma:rna: to kill 104 120 116 119 a:spa:s nearby 112 119 143 192
c+.c+ LL gum teacher 139 154 156 185 mati acumen 156 185 161 174 kavi poet 152 175 147 161 Iaahu short 128 159 143 192
C = consonant; V = vowel; L,H = light and heavy syllables, respectively. VllV2 = vowel of first and second syllable, respectively. V,V = short and long vowel, respectively.

S. Rajendran, B. Yegnanarayana /Speech Communication 18 (I 996) 21-46 27
ble and the peak occurs on the final syllable with a straight transition line as in disyllabic words (Fig. 2(c)). In some cases the transition between the first and the final syllable is not straightforward. In this case, the valley occurs on the initial syllable and the peak occurs on the final syllable with a sagging transition line. The F, rises from the initial syllable rather slowly into the middle syllable and now with a steep rise into the final syllable. (b) The valley occurs on the middle syllable and a peak on the final syllable. The initial syllable falls on the transition line between the peak of the previous word and the valley of the current word (Fig. 2(d)). Less known are all the factors that decide the patterns (a) and (b). It varies across speakers and contexts. However, type (a> is preferred to type (b) when the trisyllabic word has a long vowel in the initial syllable.
4. Tetrasyllabic words have two F, patterns: (a> a valley on the initial syllable and a peak on the final syllable (Fig. 2(e)); (b) a valley and a peak occur on alternate syllables (Fig. 2(f)), and hence a tetrasyllabic word is characterized by two valleys and two peaks.
5. Pentasyllabic words also show a complex F, pattern. There are three subtypes: (a) Valleys occur on the initial and the third syllables and the corresponding peaks occur on the second and the final syllables, respectively. (b) Valleys occur on the initial and the fourth syllable and peaks on the third and the final syllables (Fig. 2(g)). (c) Valleys occur on the initial, the third and the final syllables and peaks occur on the second, the fourth and the final syllables. The FO pattern in these three subtypes are combi- nation of monosyllabic, disyllabic and trisyl- labic patterns.
The tetrasyllabic and pentasyllabic words are usu- ally derivatives and compounds. A derivative is composed of a word and bound allomorphs of one or more morphemes. In Hindi some com- pound nouns are optionally written as single or two words. For example, /gu:nd% nagur/ “Gandhi Nagar” is also written as a single word. The F, patterns as described above suggest that peak to valley transition coincides with a word or phrase boundary. When more than one peak oc-
curs in words like tetrasyllabic words and penta- syllabic words the transition coincides with mor- phemic boundary. This does not, however, mean that every morpheme in polysyllabic words coin- cides with a boundary. The free morpheme in polysyllabic words, in general, coincides with the prosodic break in the word.
The function words have a unique F, pattern when they occur in continuous speech. The func- tion words are a class of words which bear only grammatical information. These are different from the content words which are semantically important. The function words in Hindi include case markers, post positions, complimentizers, negative markers, conjunctions, relative pro- nouns, emphatic markers, etc. The function words are very few but they recur frequently in speech. Most function words in Hindi are monosyllabic though a few are disyllabic. Some of the function words, such as case markers, post positions and emphatic marker, always occur after a noun phrase. The function words like relative pronoun /jo:/ occur before a noun phrase, and conjunc- tions like /aur/ and /~a:/ are used to conjoint two or more noun phrases.
There are two types of function words based on the F, patterns. (i> Function words which are prosodically independent, that is, a valley and a peak occur within the syllable as in the case of monosyllabic content words. The disyllabic func- tion word is also similar to that of disyllabic content words. The pronouns and the disyllabic function words belong to this type. (ii) Function words which are prosodically dependent on the adjacent content word form the second type. The function words of this type are listed below:
Type Function words Case markers /-ne: /
/ka: ke: ki:/ “of” /se:/ “from”, /ko:/ “to” /me:/ “in”, /par/ “on”
Complimentizer /ki/ “that” Negative marker /na/ “not” Conjunctions /aur/ “and”, /ya:/ “or” Relative pronoun /jo: / “that” Particle /hi: / “only”,
/bhi:/ “also”, /tak/ “until”
28 S. Rajerzdrun, B. Yegnanarayana /Speech Communication 18 (1996) 21-46
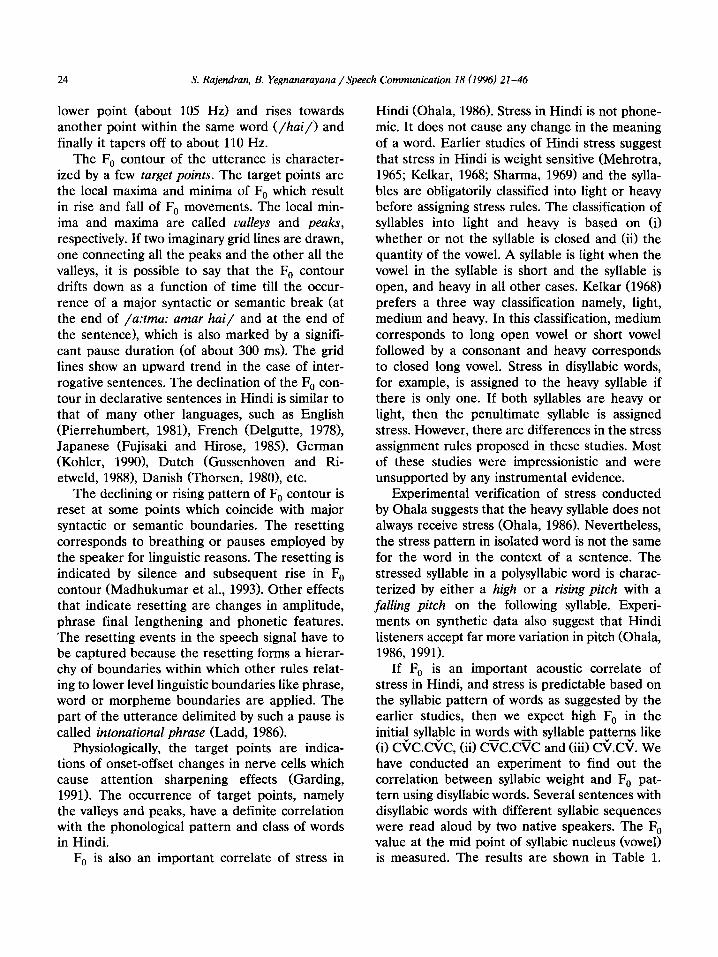
The function words in this case prosodically conjoin with the preceding or the following noun phrase. For example, in a phrase /mi:na: ko:/ “to Mina” the valley occurs on the first syllable /mi:/ and the peak occurs on the case marker /ko:/. A possible explanation is that the F,, peak of the disyllabic word /mi:na:/ gets shifted to the following monosyllabic function word. In some other cases, which are more predominant, the monosyllabic function words are prosodically in- significant and the F, contour forms a transition line between the peak of the preceding word and the valley of the following word.
FO (Hz) 1
0 10 20 30 40 50 60 70 Time (oa)
s an k ar
(4 FO (Hz)
- 175
- 150
__________L_____________cL__~. y;
- 75
- 50
- 25
0
In a sequence of monosyllabic content words in continuous speech the F, pattern differs. Prosodically a sequence of two monosyllabic con- tent words may conjoin to form a single unit. The F, pattern in this case is similar to that of a disyllabic word with a valley on the syllabic nuclei of the first word and the peak on the syllabic nuclei of the second word. Repetitives like /ba:r ba:r/ “again and again”, echo words, etc. form this type.
We have shown that in Hindi the F, pattern can be correlated with the lexical class and the phonological patterns of words. Supporting evi-
FO (Hz)
- 175
- 150
____________ _7 ; 125 __ __________________
- 100
- 75
- 50
- 2s
wm+- +##+W-O
Ill,,,,
0 10 20 30 40 Time (CJ)
s un k a r
(b)
(4 Fig. 3. Waveform and F, pattern for the word /&znkur/ when it occurs at three different positions (a), (b) and (cl in sentences (8, (ii) and (iii), respectively. (if /Gznkar ne: rame.2 ko: kitu:b di:/ (Shankar NOM Ramesh to book gave). (ii) /rame.+S ko: Sunkar ne: kiratb di:/. (iii) /rume:s’ ko: kiru:b Sankar ne: di:/ (“Shankar gave a book to Ramesh”). The F, pattern for the word /Sankar/ in (a), (b) and (c) remains the same even when it occurs in different positions of a sentence. The F, range, however, varies in these words. The dotted line indicates a reference point in F,,.

S. Rajendran, B. Yegnanarayana /Speech Communication 18 (1996) 21-46 29
dences can be shown from data on word order and second language acquisition.
(a) /$ankar ne: rame:s’ ko: kita:b di: / Shankar NOM Ramesh to book gave
(i) Word order Hindi is a free word order language. Sentences
(b) /rame:S ko: Zankar ne: kita:b di: / Cc) /kita:b rame:s’ ko: Sankar ne: di: / “Shankar gave the book to Ramesh”
can be formed by changing the position of the grammatical constituents. Consider the following sentences:
The grammatical constituents in the above sentences refer to the subject (Shankar), direct
25
0
Tile tea clt er praised r?ty Wti ring
FO (Hz1
175
150
125
100
75
50
25
Cl
Fig. 4. Waveform and F, pattern for the following sentence in English uttered by (a) a Hindi speaker and (b) a native speaker of
English: The teacher praised my writing. In utterance (a) the F, patterns of the constituent words correspond to the F,, patterns of
Hindi, but in utterance (b) spoken by a native speaker of English the F0 patterns of the words are different.

30 S. Rajendran, B. Yegnanarayanu /Speech Communication 18 (1996) 21-46
Table 2 Mapping of F, target points into accent values
Type of word F, targets Accent pattern
Monosyllabic Disyllabic Trisyllabic
Tetrasyllabic
Pentasyllabic
VP VP VP VP VP VP VP VPVP VP VP
H LH LHlH2 LLH LHlH2H3 LHLH LHlH2LH LHLHlH2
V,P = valley and peak, respectively. L,H = low and high, respectively.
object (book) and indirect object (Ramesh). These are arranged in three different sequences in the sentences mentioned above to highlight the dif- ference in the thematic organization. Fig. 3 shows the F, pattern of the word /iankar/ in the above sentences. The F, pattern remains the same in all three cases. But the F, patterns of the words differ in the range of F0 between the and the peak. In Fig. 3(a) the F, range is mum and in Fig. 3(c) it is minimum.
(ii) Evidence from second language data
three valley maxi-
Errors in the F, patterns from a second lan- guage provide important sources of external evi- dence. Fig. 4(a) shows the speech waveform and F, contour of the following sentence in English spoken by a native speaker of Hindi:
“The teacher praised my writing”
The waveform and F, contour of the same sentence spoken by a native speaker of English is shown in Fig. 4(b) (the data for English were taken from a commercially available audio cas- sette for practicing listening tests in English for TOEFL). The F, pattern of words in both these sentences are quite different. The word “teacher”, for example, has a valley followed by a peak in the first and second syllables, respec- tively, for Hindi speaker, whereas the initial sylla- ble has a high pitch (peak) followed by a low pitch in the second syllable (valley) of the English utterance spoken by the native speaker. If the norms for correctness for English is that of the native speaker, then the F, pattern shown by the
native speaker of Hindi is an “error”. This “er- ror” is due to the reflection of the grammatical system of the first language, namely Hindi.
2.1. Tapering effect
The F, pattern of words in speech utterance in Hindi was shown to be invariant. The F, range, however, is controlled by syntactic, semantic and paralinguistic factors. In declarative sentences the F, movement assumes significant changes to- wards the end. The F, value at major syntactic boundaries like clause or sentence final position is usually much less than the F, value at the beginning of the sentence. Towards the end of speech utterance of declarative sentences the vo- cal cords assume their resting state. A significant measure of pause usually ensues such effect. It is important to note that the tapering of F, begins from various points. In normal speech the taper- ing effect takes place immediately after the onset of the vowel in the final syllable. In some cases the tapering begins two or three syllables in ad- vance. A disyllabic word, therefore, may have a low F, in the final syllable. The tapering effect may even begin one or two words in advance. Prolonged tapering effects are more common in casual style of speech. The fact that the F, pat- tern of words is modified only by tapering effect in the final position can be easily verified by having these words in the nonfinal position. Iso- lated utterances of words show a different F, pattern than the words in sentence non-final po- sition in continuous speech.
2.2. Segmental effects
We have assumed that the transition line be- tween the valley and the peak, and vice versa, is straight forward. Segmental factors cause F, per- turbations (House and Fairbanks, 1953; Lehiste and Peterson, 1961; Madhukumar et al., 1993). For example, the immediately adjacent consonant has an impact on the production of a vowel. When a voiceless obstruent (stop or fricative) occurs in the prevocalic position, the F, contour in the vowel onset region is higher by 4-15 Hz
S. Rajendran, B. Yegnanarayana /Speech Communication 18 (1996) 21-46 31
than the F, in the adjacent regions of the vowel. However, in the case of voiced consonants, the F, contour rises gradually from the vowel onset. The variation caused by the segmental factors does not obscure the patterns as these variations are limited to a brief duration in the vowel onset and the offset regions.
2.3. Accent patterns
It is possible to make some generalization so that the boundary information indicated by the F, contour can be exploited both for placing word boundaries in continuous speech and for locating function words as well. Locating function words directly from the speech signal based on the prosodic parameters may help in improving the performance of a speech recognition system. For this purpose we need to identify the syllable nuclei and the F0 movement. We assign each syllable nuclei one of the accent values, namely Low (L) or High (H or h) based on the following criteria: 1. The relative F, value at the syllable nucleus
(vowel) with respect to the F,, value at the nucleus of the immediately preceding syllable in an utterance.
2. The direction of F, movement within the vowel region, that is, whether there is a pitch rise or pitch fall in the syllable nucleus.
The first criterion is based on comparing the F, value at the mid point of the syllable nucleus to that of the previous syllable, that is, whether the pitch is high or low compared to the previous syllable. The average F, value of the frames in the vowel region can also be considered, but spurious F, values for one or two frames of speech signal can cause the average value vary so much. Therefore, the F, value for a single frame at the middle region of the syllabic nuclei was considered in the present implementation. An- other advantage in choosing the mid point of the syllable nucleus is that this region is not much affected by the coarticulatory phenomena such as the impact of the preceding and the following consonants like obstruents (Ohman, 1966). The second criterion is based on comparing the F, values at two different points within each syllable
nucleus. There is a hierarchy in the application of rules. The second criterion is applied after the first. It modifies the output of the first criterion. Also, the second criterion is not applied to all syllables.
The accent values for the syllables in content words are shown in Table 2. The accent values for the syllables in a disyllabic word is LH. Con- sider the case of a trisyllabic word (Type I>. The accent value for the initial syllable is L and for the final syllable it is H. The F,, value of the second syllable is higher than the first syllable and hence the syllable is assigned H. Syllables of the same type are marked by ascending indices of Li or Hi. Thus, the accent pattern for a trisyllabic word is represented by LHlH2. The trisyllabic words of Type II are assigned the accent pattern LlL2H to the syllables. The tetrasyllabic words are assigned LHlH2H3 (for Type I1 or LHLH (for Type II). Pentasyllabic words are assigned LHlH2LH (for Type I> or LHLHlH2 (for Type II>.
The accent pattern of a monosyllabic content word can be considered as a unique case. The F(, value of such a syllable may be less than the F,, value of the previous syllable due to declination of the overall contour. Hence, the F,, pattern of a monosyllabic word would be assigned L based on the first criterion. As discussed earlier, the F,, pattern of a monosyllabic content word shows a valley followed by a peak within the same sylla- ble, hence this has a steadily rising pitch. There- fore, based on the second criteria, an accent value of “h” is assigned to this syllable. Monosyl- labic function words of Type II will be assigned a value of L by application of the first criterion, and this remains unchanged by the application of the second criterion when the syllable has a falling pitch.
3. The algorithm
The proposed algorithm works in three stages. In the first stage, the major pauses are detected in order to mark the intonational phrases using pauses and resetting of F, contour. In the second stage, the syllabic nuclei are detected from the
32 S. Rajendran, B. Yegnanarayana /Speech Communication 18 (1996) 21-46
L Ii L LH L
h-4
-Q..- - 161)
-
-9 -100 ‘;;
IA
6 6 6 6 4 6 6 66 6 6 6 6 SN
L H H L H L h L H Ii LH L AC # (t n n # # I-IS
$ FW
pa: rt” n a: t 0: a: t ma: k o: s a:f kame: k a: j”a: @u: hai TX * * * * * * * * AS
(b)

S. Rajendran, B. Yegnanarayana /Speech Communication 18 (1996) 21-46
speech signal. In the final stage the word bound- aries and function words are hypothesized. The algorithm for word boundary hypothesization is given below. Algorithm for word boundary hypothesization Let m be the number of intonational phrases and n be the number of syllables in an utterance 1.
2.
3.
4.
Identify intonational phrases by detecting si- lence region in the utterance using a threshold for the energy contour. If duration (silence) 300 msec then identify it as a pause. Let Pl, P2 , . . . ,Pm - 1 be the pauses. Split the utter- ance into intonational phrases Cl, C2,. . . ,Cm using the pauses. For each intonational phrase Cj (for j = 1, 2, . . . ,m) do Steps 2 through 4. Apply 7 point median smoothing to energy contour. Find peaks in the energy contour. Identify “hats” in energy contour by marking two points 1 dB below on either side of each energy peak (energy hats more or less coincide with pottential syllabic nuclei). Find out the mid point frame of each “hat” and if the pitch is nonzero and LPl is less than a threshold value then mark these midpoint of syllable nuclei as Ml, M2,. . . ,Mn. Mark syllable nuclei as “L”, “H” or “h” as follows: for i: = 1 to n - 1 do
begin 1. if FO(Mi) > FO(Mi - 1) then mark Mi as
accent “H” else mark Mi as accent “L” 2. if Mi is L and Mi - 1 is L (slope of FO at
Mi - 1 > 0) then change Mi - 1 to accent “h”
end Place word boundary (#) using the following rules: 4.1. Place word boundary between any two
adjacent “H” and “L”
4.2. Place word boundary adjacent “h” and “L”
4.3. Place word boundary adjacent “L” and “L”
4.4. Place word boundary adjacent “L” and “h”
4.5. Place word boundary adjacent “H” and “h”
33
between any two
between any two
between any two
between any two
Mark the syllable as function word ($1 using the following rules: 4.6. In a sequence of two or more “L”s mark
all the “L”s except the last one as “func- tion word”
4.7. In a sequence of “L” and “h” mark “L” as the function word.
(i) Intonational phrase detection Major intonational phrases are marked by de-
tecting the silence region based on the energies in the unvoiced and voiced regions. A threshold on the duration of silence region is applied to distinguish the silence region (from the speech regions), which are the events of geminated stop consonants.
(ii) Syllabic nuclei detection Energy is computed for every 6.4 ms using a 25
ms Hamming window. The energy is smoothed using a 7-point median filter to reduce spurious peaks in the energy contour. The peaks in the energy contour correspond to the potential syl- labic nuclei, that is, the vowel. About 1 dB below each peak two points are identified on both sides along the contour. By doing this it is possible to mark the middle region of the vowel, even if the onset or the offset of the vowel does not change abruptly as in the case of the phrase final vowels. The mid point between these two points on the
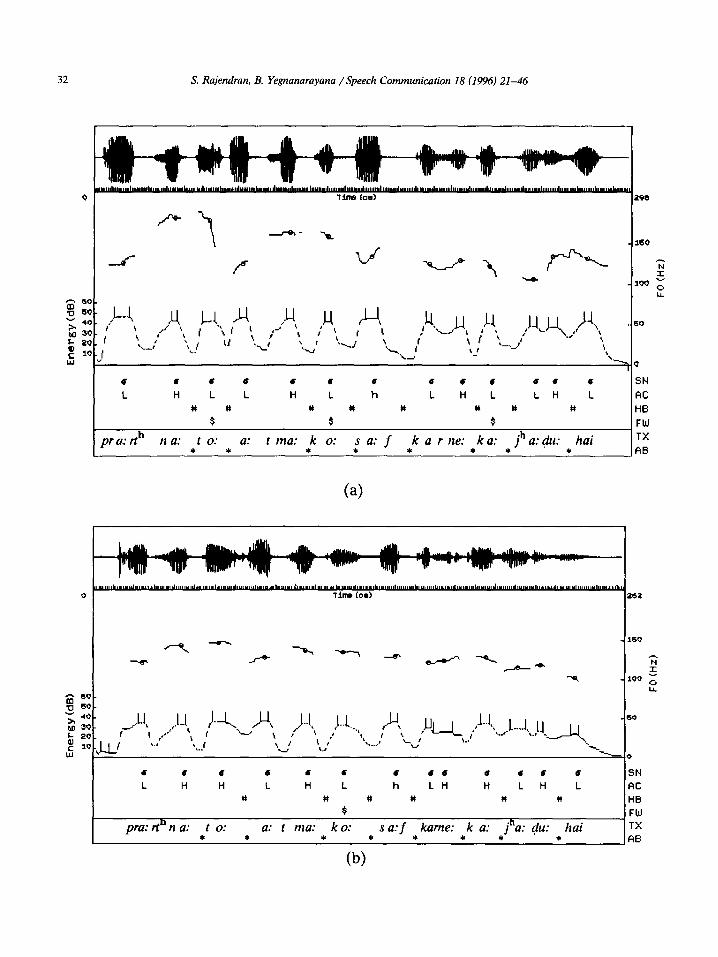
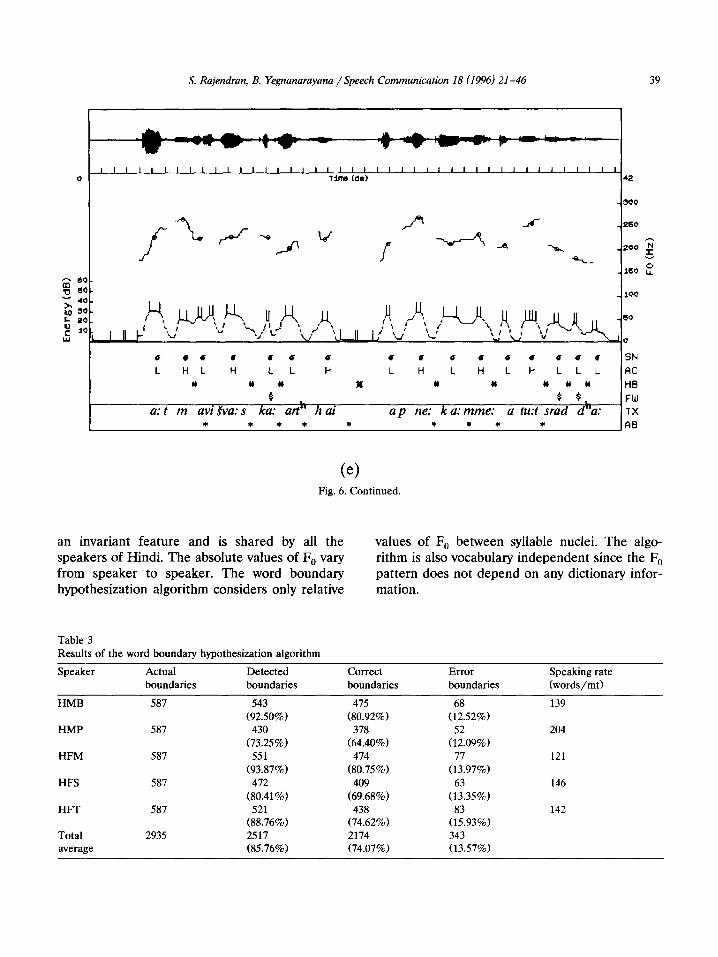
Fig. 5. (a-e) Sample output of word boundary hypothesization algorithm for a single sentence uttered by five speakers, HMB,
HMP, HFM, HFS and HFT, respectively. /pra:rt%a: to: a:tma: ko: sa:f kame: ka: jha:du: hai/ (prayer means soul to cleans do of
broomstick is; “Prayer is broomstick to cleans the soul”). The dotted line indicates energy contour; each pair of vertical bars on the energy contour corresponds to approximate region of syllabic units; solid lines indicate Fa contour and every small circle on the
contour corresponds to a single frame of speech data used for determining the syllabic nuclei and accent values; u-syllabic nuclei;
L, H: accent values, Low and High, respectively; #: word boundary placed by the algorithm; $: function word located by the
algorithm; TX: transcription; AB: actual word boundary indicated manually.

34 S. Rajendran, B. Yegnanarayana / Speech Communication 18 (1996) 21-46
6 6 6 6 6 6 6 6 6 6 6 6 6 SN L H L L H L L L H L L H L ac
# % n # I # # I4 HB $ $ s $ FW
pr a: rth na: t o: a: t ma: k o: * * *
s a: f ka r ne: ka: jh a: $u: * * * * *
hai Ai
(4
0 Tin6 [co) 248
I I
-I 260
A - s\, WY--- 2OQ - -g
- 160 0 LA
s 60.
u 6Q- -100
‘: 40. ho =o- ,A,
5 20. \ *- /l-I, ,4..
\ j-1, $4
I ; f
A, #k...w !'t
‘c \
_$.,q -60 \/ ‘I \ 1
\
: 30 - I i.../’ ‘..I -. L..’ ‘,. # 1 L.-t \ I -..I /“’ ‘“\.. -\
b..., k_ *
6 6 6 6 6 6 6 6 6 6 6 6 SN L H H L H H h L l-l H L H AC
R x # I( HB
FW
p ra: r th na: t o: a: t ma: ko: s a: f ka rne: ka: jh a: gu: hai TX
* * *
* cd)
* * * * FIB
Fig. 5. Continued.

S. Rajendran, B. Yegnanarayana /Speech Communication 18 (1996) 21-46 35
I I I I I I I I I I I II I I I I I I I I I I I I II I l II I II Q Tina Iad 34
_26Q
v
d _/--
-2QQ 2
I
-16Q g IA.
z 60.
u 6Q- _iQQ
; 40.
on 3Q- b 20.
-69
I5 10 r’ : : -_
’ L.0
6 6 6 6 6 6 6 6 6 6 6 6 6 SN
L H L L H L H L L H LH H AC
Y # bi Y Y # HB
$ $ FW
p ra: r t” na: t 0: a: t ma: ko: s a:f ka me: ka: j”a: (iu: hai TX
* * *
* * * *
A0
Fig. 5. Continued.
energy contour is identified. The mid point of the vowel is further checked for spurious syllabic detection by a fricative detection module. It checks if the mid points genuinely correspond to vowels or any fricative or aspiration regions by means of the first order LP coefficient and the ratio of the energies in the high and low frequen- cies. Also the voicing of the mid points is verified to weed out any spurious syllabic units.
As the syllable detection program uses knowl- edge of abrupt changes in the vowel onset and offset in the energy parameter, other sonorants like lateral and nasals may cause some problems when they are in the adjacent positions of the vowels. In such contexts, the syllable is missed.
The syllabic units are categorized and assigned a value L, H or h. If the F, value of the mid point of the nucleus (Mi) is greater than the mid point of the preceding nucleus (i’M,_i) the current syl- labic unit (Mi> is marked H, otherwise the sylla- ble is marked L. When there is more than one L in a sequence of syllables, all the syllables with label L are checked for the nature of slope of the
F, contour within the nucleus. If the slope is positive, the syllabic unit with L is replaced with h, otherwise L is retained. This process is re- peated till the end of an intonational phrase boundary.
(iii) Word boundary hypothesization The final part of the algorithm hypothesizes
word boundaries and function words based on the F, patterns. A word boundary is placed be- tween two syllables if the F, value of a syllable is greater than the F, value of its following syllable. Thus, a word boundary is placed between 61 H, and L, (ii) h and L, (iii) L and L, (iv) L and h, and (v) H and h. If more than one consecutive syllable (M,) has L, then all the syllables preceding the last syllable (M - 1) are marked “function word”. In a sequence of L and h the syllable with L is marked a function word since h has essentially a valley and a peak. As discussed earlier, in the F, pattern LlL2, Ll corresponds to a function word. The F, contour for unaccented function words is monotonously decreasing, and hence the slope of
36
z bC
P 6C ‘: 4c
bn 3c = 2c
: 1e
2 E f c w
S. Rajendran, B. Yegnanarayana /Speech Communication 18 (1996) 21-46
66 8 8 0 46 6 6 6 4 666 6664 6 6 SN
LH L H L LH II L H L H L L HHLLH L AC
# t+ Y 0 x Y # 1 0 w # HB
$ $ $ FW
b”o.jan sub ke: I iye: a: vu Syak hai t o: pra:rth na:bhi: s ab ke:liye: a:vaJy ak hai TX * * * * * * * * * * * AB
(a)
*---- --A--
60. 60-
c 6 6 6 6 6 6 6 6 6 6 6 6 6
L H L H LHH L H L h LH L +I I) n n n II n
$
Sra dd”a: h i: h a me: * * *
tu: f a: ni:*samudti: *
ke; p a:r, 1 e: ja: *
ti: hrfi
33
- 16’
- 10
-60
LO
St
A(
HI
FI
1:
Al

S. Rajendran, B. Yegnanarayana /Speech Communication 18 (1996) 21-46 37
the F, pattern at syllable nucleus is negative. In Name Sex Age Nativity order to separate function words from monosyl- HMB M 33 Lucknow, Uttar Pradesh labic content words, we consider the slope of the HMP M 28 Bhopal, Madhya Pradesh F, contour at the syllabic nucleus. If the slope is HFM F 24 Sagar, Madhya Pradesh negative, then hypothesize the corresponding HFS F 26 Karnal, Haryana monosyllabic word as function word. HFT F 25 New Delhi
The sample output of the word boundary algo- rithm for a simple sentence uttered by five native speakers of Hindi is given in Fig. 5(a-e). Fig. 6(a-el shows the performance of the algorithm for different sentences for all the five speakers.
An advantage of the proposed algorithm for word boundary hypothesization is that it works even under adverse input conditions. The robust- ness of the algorithm is primarily because only gross parameters like energy and pitch are used in its implementation. The algorithm works fast since it needs to extract the F, values for only a single frame of speech data around each syllabic nucleus.
HMB is a Ph.D student, and HMP and HFS are M.Tech students in Engineering. HFM and HFT are Ph.D students in Linguistics. All are native speakers of Hindi and learned English as second language. HFM speaks Punjabi besides Hindi and English.
The speakers were instructed to read out the text at a stretch at their usual speaking rate. They were research students but they were non-profes- sional readers. The speaking rate varied from person to person. Table 3 shows the performance of the word boundary hypothesization algorithm. The percentage of detected boundaries gives the proportion of the total boundaries hypothesized. Accuracy rate was calculated as the ratio of num- ber of correct boundaries to the total number of hypothesized word boundaries. The error rate is the ratio of the total number of incorrectly hy- pothesized boundaries to the total number of hypothesized boundaries. The algorithm hypothe- sized on an average 74.07% of the total number of boundaries correctly. This accuracy was main- tained more or less the same for all speakers. 13.57% of hypothesized boundaries were wrong.
4. Results and discussion
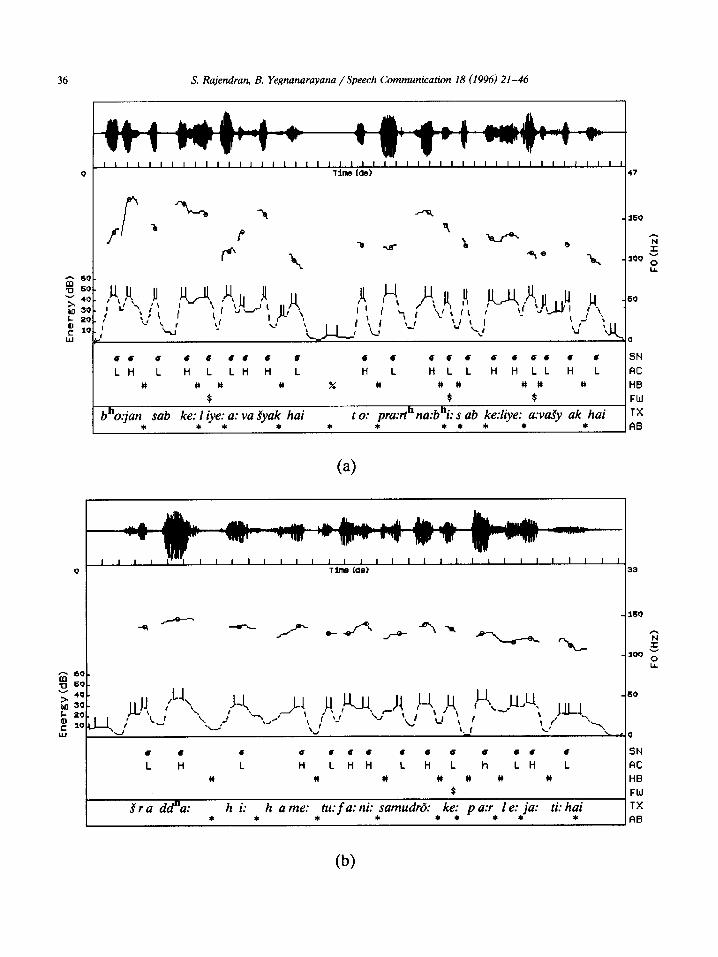
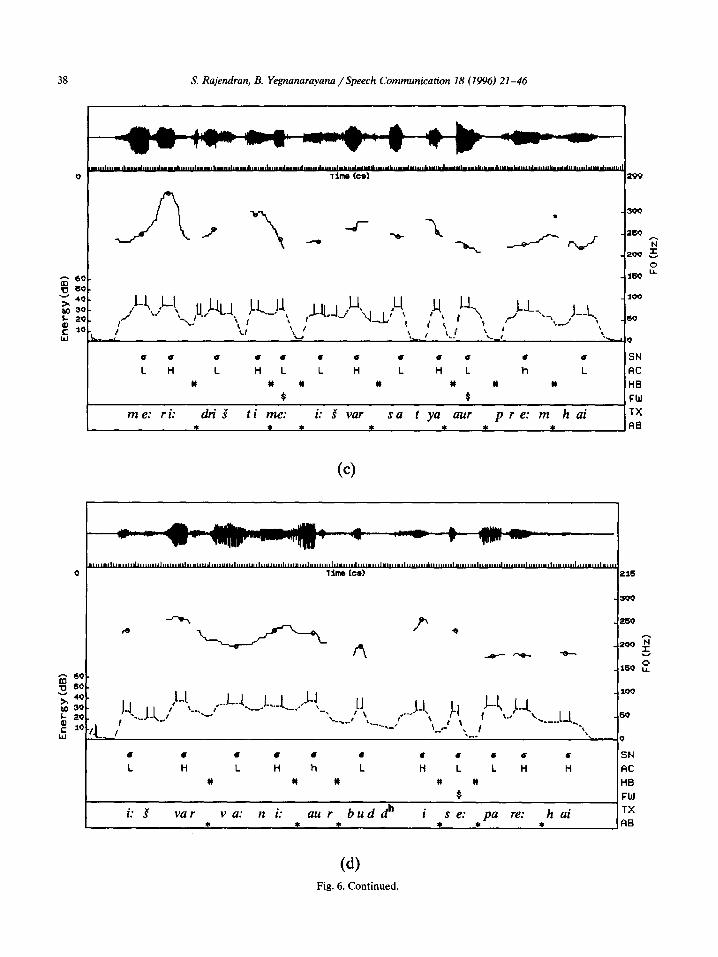
The word boundary hypothesization algorithm was evaluated on a set of 50 sentences taken from a Hindi text book. The text is about a single theme and the sentences are of different lengths with different syntactic complexities. The text was read aloud by 5 native speakers (3 female and 2 male) of Hindi. Personal details of the speakers are given below: The results also confirm that the F, pattern is
Fig. 6. (a-e) Sample output of word boundary hypothesization algorithm for the following utterances. (a) /bho:jan sabke: liye: a:uajrak hai to: pra:&na: bhi: sab ke: Lye: a:ua&ak hai/ (Speaker = HMB) (food all for essential is then prayer also all for essential is; “If food is essential for all, then prayer is also essential for all”. (b) /‘: I ivar ua:$ aur buddhi se: pare: hai/ (Speaker = HMP) (God expression and wisdom from beyond is; “God is beyond wisdom and expression”). (c) /me:ri: dri$i”met i:iuar satya aur pre:m hai/ (Speaker = HFM) (my opinion in God truth and love is; “In my opinion God is truth and love”). (d) /a:tma ui&a:s ka: arth hai apne: ka:m me: atu:t Sraa’dha:/ (Speaker = HFS) (self confidence of meaning is own work in uncompromising faith; “The meaning of self confidence is the uncompromising faith in the work itself’). (e) /cradd’a: hi: hame: tu:fa:ni: samudr5: ke: pa:r le: ja:ti: hai/ (Speaker = HFT) (faith alone us tempestuous seas of across takes is; “Faith alone takes us across tempestuous seas”). The dotted line indicates energy contour; each ‘pair of vertical bars on the energy contour corresponds to approximate region of syllabic unit; solid lines indicate F, contour and every small circle on the contour corresponds to a single frame of speech data used for determining the syllabic nuclei and accent values; (T: syllabic nuclei; L, H: accent values Low and High, respectively; #: word boundary placed by the algorithm; %: intonational phrase boundary placed by the algorithm; $: function word located by the algorithm; TX: transcription; AB: actual word boundary indicated manually.
38 S. Rajendran, B. Yegnanarayana /Speech Communication 18 (I 996) 21-46
0 0 0 # a u a l u 0 a U SN L H L H L L H L H L h L AC
Y # Y 0 R 0 # HB $ S FW
m e: r i: drib time: i: S vur sa t ya aur p r e: m h ai TX
* * * * * * * AB
-- J-7
p‘ d -260
I+
-200 G
-w - E
_ 160 i? 60. 60. 40- 30 -
J-1
J-?.,_J.(_,/ ‘--La, ---1--.l.,__!-..-~._..)-?
_ 100
20 . -.
Jl, ,___J_J
\
1 , \ - L-k l__/ I \.#’ -\
If
--,_.’ - 60
lo -fl._ ‘.-.,_a t \
‘_r- L-11,*
=... I ‘,
0
Cc)
0 1 im 216
- 300
U l U l U U l l l 6 U SN L H L H h L H L L H H FIG
n * R a n HB t FW
i: S va r v a: n i: aur buddh i se: pa re: h ai TX * * * * * * AS
(4
Fig. 6. Continued.
S. Rajendran, B. Yegnanarayana /Speech Communication 18 (I 996) 21-46 39
I I I I I I I I I I I I I I I I I I I I I I I I I I I I I I I I I I I I I I I I I I Q limb Id@ 42
i
260
200
160 i?
8 60-
u IO- -100
0 Q i 6 0 6 6 6 6 6 6 6 4 a66 SN
L I-IL H L L H L H L HLH L L L AC
Y 1) Y x (I 0 0 Y # H8
$ $ $, FW a: t m aw Sva: s ka: art” h ar ap ne: ka:mme: a tu:t srad d’a: TX
* * * * * * * * * A0
(e> Fig. 6. Continued.
an invariant feature and is shared by all the speakers of Hindi. The absolute values of F, vary from speaker to speaker. The word boundary hypothesization algorithm considers only relative
values of F,, between syllable nuclei. The algo- rithm is also vocabulary independent since the F, pattern does not depend on any dictionary infor- mation.
Table 3 Results of the word boundary hypothesization algorithm
Speaker Actual Detected boundaries boundaries
Correct boundaries
Error boundaries
Speaking rate (words/m0
HMB
HMP
HFM
HFS
HFT
Total average
587 543 (92.50%)
587 430 (73.25%)
587 551 (93.87%)
587 472 (80.41%)
587 521 (88.76%)
2935 2517 (85.76%)
475 (80.92%)
378 (64.40%)
474 (80.75%)
409 (69.68%)
438 (74.62%) 2174 (74.07%)
(1628.52%) 139
$09%) 204
$974) 121
63 146 (13.35%) $93%) 142
343 (13.57%)

40 S. Rajendran, B. Yegnanarayana /Speech Communication 18 (1996) 21-46
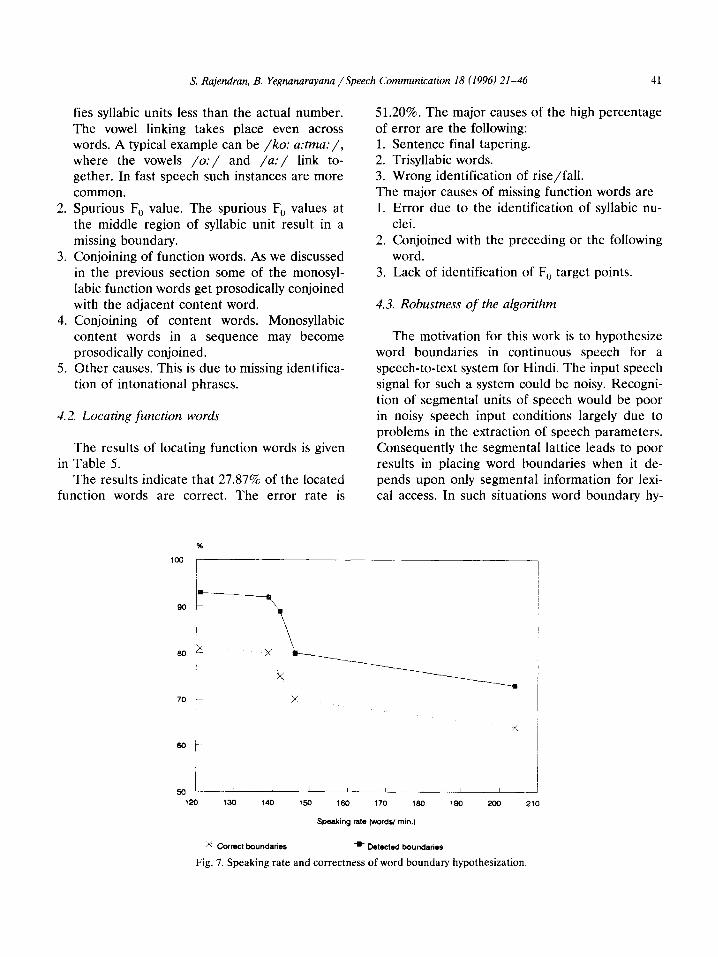
The speaking rate is an important factor that determines the number of word boundaries de- tected by the algorithm. Fig. 7 shows the correla- tion between speaking rate and the number of hypothesized word boundaries. The faster the rate of speech, the lower the number of bound- aries detected. However, the total number of correct boundaries remains constant, that is, the error rate remains the same. This study shows that the monosyllabic words, particularly the function words, get prosodically conjoined with the preceding or the following word.
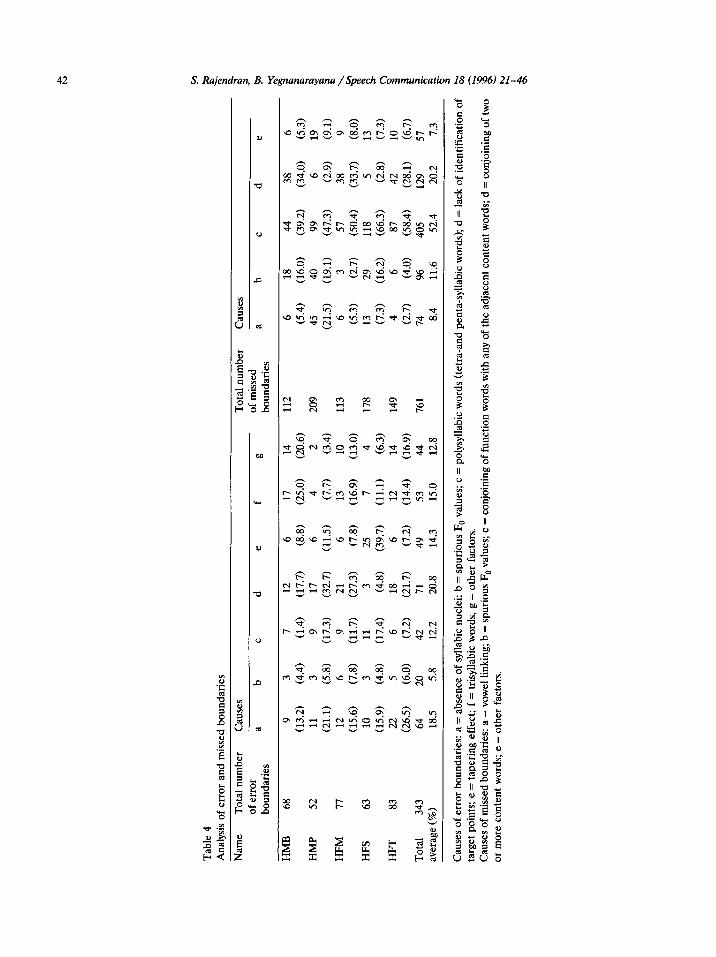
4.1. Analysis of errors in word boundary hypothe- siza tion
The errors in the word boundary hypothesiza- tion can be classified into two types: (i) incorrect boundaries placed where there are no bound- aries, and (ii) undetected (missed) boundaries.
The classification of these errors is given in Table 4. The incorrect boundaries can be due to one of the following reasons: 1. Erroneous syllabic unit identification. The
word boundary hypothesization depends upon the correct identification of the syllabic units. The subroutine which identifies the syllabic units uses the acoustic parameters, energy, pitch and LP coefficient. Though the un- stressed syllables in Hindi are not reduced to the extent they are as in stress languages like English, for some speakers, the syllabic units are not identified towards the end of sentence when the input signal is feeble. Absence of pitch is used for disqualifying peaks in the energy contour at fricative and voiceless aspi- rated regions as possible candidates of syllabic units. Therefore, reliable extraction of F,, be- comes critical. Any spurious F, value at the unvoiced fricative region indicated by peak at the energy contour leads to an error. The fricative and the aspirated regions are avoided by setting a threshold value on the 1st LP coefficient (Eswar, 1990). The threshold value becomes critical in some cases causing an er- ror.
2. Spurious F,, value. The presence of spurious
F, value at the mid point of the syllabic nuclei region leads to error.
3. Polysyllabic words. As discussed in the previ- ous section, for tetrasyllabic words of Type II (LHLH) and the pentasyllabic words of Types I and II, the algorithm places wrong boundaries at LH#LH, LHlH2#LH and LH#LHlH2, respectively. Though in the case of tetrasyllabic words of Type II and pentasyl- labic words of Types I and II the algorithm places an additional boundary, it coincides with the morpheme boundary and they are consid- ered as errors in the present analysis.
4. Lack of identification of the F,, target points. The algorithm is based on the F, value at the middle region of the syllabic nuclei, though the target points may occur at any part of the vowel region or in the voiced consonant region of the syllable. The F, of the syllable for a disyllabic word in a sentence final position, for example, tapers off right from the vowel onset region, and the F, at the middle region of vowel would be less even when the syllable has a high falling pitch. This also causes an error.
5. Tapering effect. Towards the end of a long speech utterance in continuous speech the F, contour tends to taper off indicating the vocal cords assuming resting state. The tapering of F, contour begins, depending upon individual speaking style and other language factors, even two to three words ahead of the end of the utterance. This may result in a wrong place- ment of a boundary.
6. Trisyllabic words. For trisyllabic words of Type II (LlL2H) the algorithm places an additional (wrong) boundary at L#LH.
7. Other causes. This includes missing identifica- tion of the intonational phrase boundary (re- setting), etc.
The missed boundaries are the actual word boundaries undetected by the algorithm. These boundaries can be due to one of the following reasons: 1. Vowel linking. In continuous speech the am-
plitude of the vowels in a sequence often merge so much that at 1 dB below the peak in the energy contour the vowels may become insepa- rable. In such instances the algorithm identi-
S. Rajendran, B. Yegnanarayana /Speech Communication 18 (1996) 21-46 41
fies syllabic units less than the actual number. The vowel linking takes place even across words. A typical example can be /ko: a:tma:/, where the vowels /o:/ and /a:/ link to- gether. In fast speech such instances are more common. Spurious F, value. The spurious F0 values at the middle region of syllabic unit result in a missing boundary. Conjoining of function words. As we discussed in the previous section some of the monosyl- labic function words get prosodically conjoined with the adjacent content word. Conjoining of content words. Monosyllabic content words in a sequence may become prosodically conjoined. Other causes. This is due to missing identifica- tion of intonational phrases.
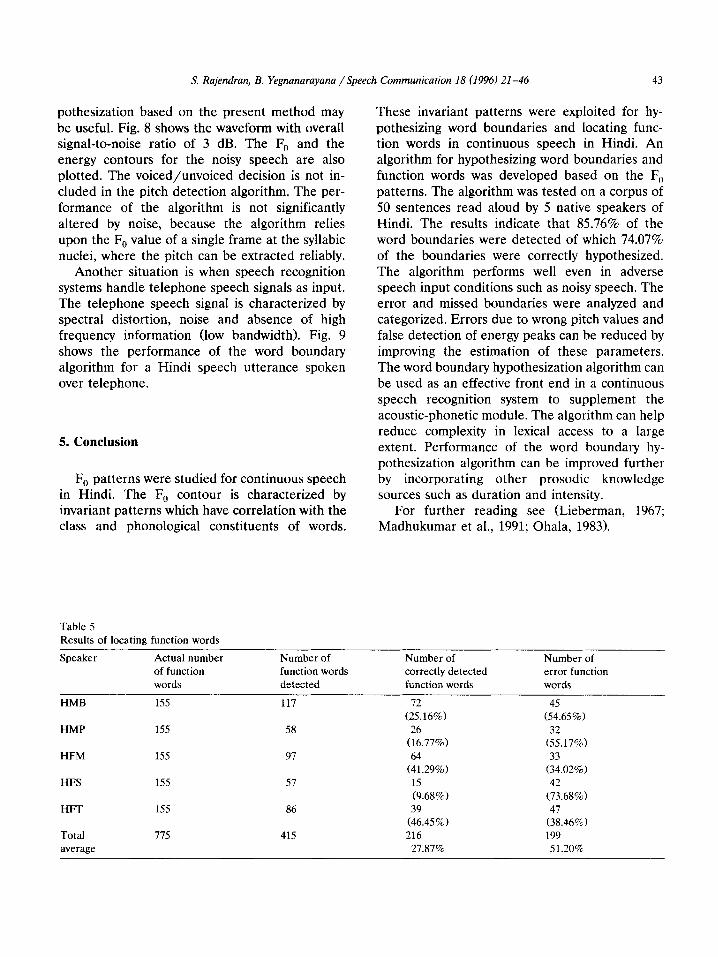
4.2. Locating function words
The results of locating function words is given in Table 5.
The results indicate that 27.87% of the located function words are correct. The error rate is
51.20%. The major causes of the high percentage of error are the following: 1. Sentence final tapering. 2. Trisyllabic words. 3. Wrong identification of rise/fall. The major causes of missing function words are 1. Error due to the identification of syllabic nu-
clei. 2. Conjoined with the preceding or the following
word. 3. Lack of identification of F,, target points.
4.3. Robustness of the algorithm
The motivation for this work is to hypothesize word boundaries in continuous speech for a speech-to-text system for Hindi. The input speech signal for such a system could be noisy. Recogni- tion of segmental units of speech would be poor in noisy speech input conditions largely due to problems in the extraction of speech parameters. Consequently the segmental lattice leads to poor results in placing word boundaries when it de- pends upon only segmental information for lexi- cal access. In such situations word boundary hy-
60
t
501--- 120 130 140
l i 150 160 170 180 180 200 210
Speaking rate (wordf/ min.)
,f Correct boundaries * Detected boundaries
Fig. 7. Speaking rate and correctness of word boundary hypothesization.
lo
Tab
le 4
ti
Ana
lysi
s of
err
or
and
mis
sed
boun
dari
es
c. 3 ti
Nam
e T
otal
num
ber
Cau
ses
Tot
al n
umbe
r C
ause
s a
of e
rror
.a
b
of m
isse
d bo
unda
ries
a
C
d e
f 8
boun
dari
es
a b
C
d e
@
HM
B
68
HM
P 52
HFM
77
HFS
63
(Z
.9,
Z.8
) $4
) (A
) $.
7)
(l:.l
) (L
3)
178
13
G.2
) 11
8 (i
.0)
$ 13
(7
.3)
(66.
3)
&I
HF
T
83
$5)
(i.0
) C
F.2
1 $.
7)
tt.2
1 (E
.4)
(E.9
, 14
9 (l
.7)
(f;.O
) (Z
s7.4
, &
(7.3
) ;
10
(6.7
) :
Tot
al
343
64
20
42
71
49
53
44
761
74
96
405
129
57
f
aver
age
(%)
R
18.5
5.
8 12
.2
20.8
14
.3
15.0
12
.8
8.4
11.6
52
.4
20.2
7.
3 8
Cau
ses
of e
rror
bo
unda
ries
: a
= a
bsen
ce
of s
ylla
bic
nucl
ei;
b =
spu
riou
s Fa
val
ues;
c =
pol
ysyl
labi
c w
ords
(t
etra
-and
pe
nta-
sylla
bic
wor
ds);
d
= l
ack
of i
dent
ific
atio
n of
2
targ
et
poin
ts;
e =
tap
erin
g ef
fect
; f
= t
risy
llabi
c w
ords
, g
= o
ther
fa
ctor
s.
2 C
ause
s of
mis
sed
boun
dari
es:
a =
vow
el l
inki
ng;
b =
spu
riou
s Fa
val
ues;
c =
con
join
ing
of f
unct
ion
wor
ds w
ith a
ny o
f th
e ad
jace
nt
cont
ent
wor
ds;
d =
con
join
ing
of t
wo
or
mor
e co
nten
t w
ords
; e
= ot
her
fact
ors.
8 ? h
S. Rajendran, B. Yegnanarayana /Speech Communication 18 (1996) 21-46 43
pothesization based on the present method may be useful. Fig. 8 shows the waveform with overall signal-to-noise ratio of 3 dB. The F, and the energy contours for the noisy speech are also plotted. The voiced/unvoiced decision is not in- cluded in the pitch detection algorithm. The per- formance of the algorithm is not significantly altered by noise, because the algorithm relies upon the F, value of a single frame at the syllabic nuclei, where the pitch can be extracted reliably.
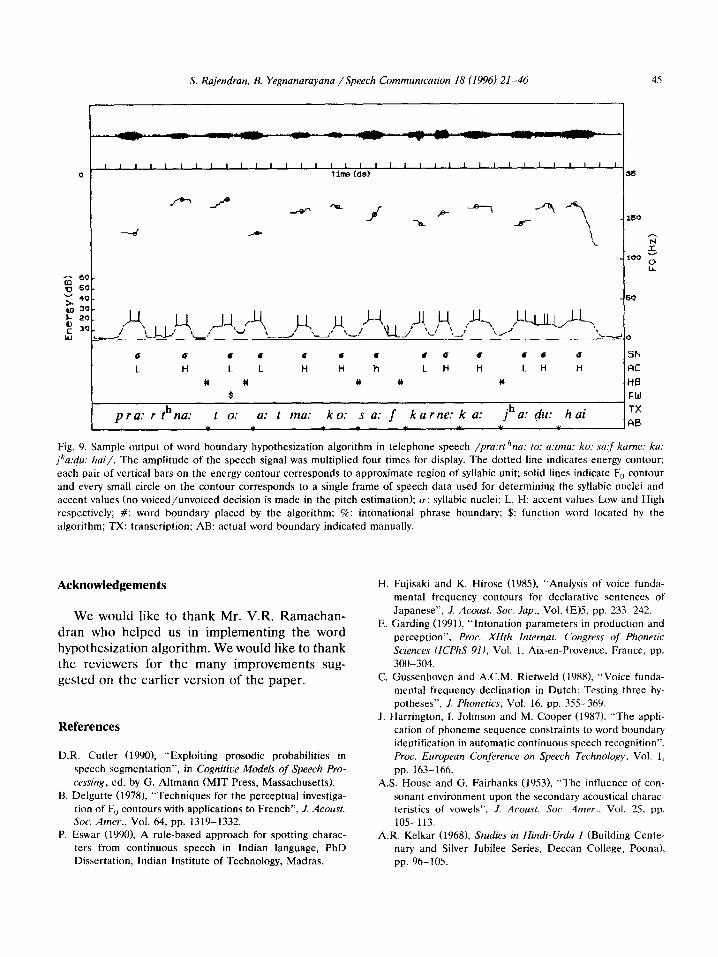
Another situation is when speech recognition systems handle telephone speech signals as input. The telephone speech signal is characterized by spectral distortion, noise and absence of high frequency information (low bandwidth). Fig. 9 shows the performance of the word boundary algorithm for a Hindi speech utterance spoken over telephone.
5. Conclusion
F, patterns were studied for continuous speech in Hindi. The F, contour is characterized by invariant patterns which have correlation with the class and phonological constituents of words.
Table 5
Results of locating function words
Speaker Actual number
of function
words
HMB 155
HMP 155
HFM 155
HFS 155
HFT 155
Total 775
average
These invariant patterns were exploited for hy- pothesizing word boundaries and locating func- tion words in continuous speech in Hindi. An algorithm for hypothesizing word boundaries and function words was developed based on the F, patterns. The algorithm was tested on a corpus of 50 sentences read aloud by 5 native speakers of Hindi. The results indicate that 85.76% of the word boundaries were detected of which 74.07% of the boundaries were correctly hypothesized. The algorithm performs well even in adverse speech input conditions such as noisy speech. The error and missed boundaries were analyzed and categorized. Errors due to wrong pitch values and false detection of energy peaks can be reduced by improving the estimation of these parameters. The word boundary hypothesization algorithm can be used as an effective front end in a continuous speech recognition system to supplement the acoustic-phonetic module. The algorithm can help reduce complexity in lexical access to a large extent. Performance of the word boundary hy- pothesization algorithm can be improved further by incorporating other prosodic knowledge sources such as duration and intensity.
For further reading see (Lieberman, 1967; Madhukumar et al., 1991; Ohala, 1983).
Number of
function words
detected
117
58
97
57
86
415
Number of
correctly detected
function words
72
(25.16%)
$.77%)
(:;1.29%)
15
(9.68%)
39
(46.45%)
216
27.87%
Number of
error function
words -
$65%)
$.17%)
$.02%,
42
(73.68%)
~~~.46%~
199
51.20%

S. Rajendran, B. Yegnanarayana /Speech Communication 18 (1996) 21-46
166
-60
I ,____J-1 -.._________d-c*’ S--L.,____ J-1 J-4.
-____--me .-.___A .______Ca- J__._J. ..--_.__J_______lJ_._l_l_ .___----. _J I o
6 ‘ Q 6 6 6 i SN
L H L H L h L AC
% Y % # Y 0 HB $ FW
San k ar j a: t a: h ai TX * * I AR
,1-l, J-l_., ,J- J, .1--I.. , ---._. /I ‘---\\__ * \ / \ ,..l---A._ -.
,__----’ ‘\ \ / ‘\
\ -__’ ._a’ \ f L-a’ -\ --__, ‘~~..L.__lJ__.___..._ ____ I
8 c c 6 6
L H L H L R #
Sank ar j a: t a: h ai * *
60
0
SN AC HB
FW
TX
Fig. 8. Sample output of word boundary hypothesization algorithm in (a) noisy speech input condition (clean speech is mixed with random noise (SNR = 3 dB)) /Sankar ja:ta: hai/ (Shankar go is; “Shankar goes”); (b) clean speech corresponding to (a).
S. Rajendran, B. Yegnanarayana /Speech Communication 18 (1996) 21-46
G 6 u 6 0 l a 4 a a 0 l 0 SN
L H L L H H h LH H L H H AC
w # # # Y HE
$ FW
pra: r thna: t o: a: t ma: ko: s a: f karne: k a: jha: &u: h ai I,”
Fig. 9. Sample output of word boundary hypothesization algorithm in telephone speech /pra:rfhna: to: a:tma: ko: satf karne: ka: jha:&: hai/. The amplitude of the speech signal was multiplied four times for display. The dotted line indicates energy contour;
each pair of vertical bars on the energy contour corresponds to approximate region of syllabic unit; solid lines indicate F,, contour
and every small circle on the contour corresponds to a single frame of speech data used for determining the syllabic nuclei and
accent values (no voiced/unvoiced decision is made in the pitch estimation); u: syllabic nuclei; L, H: accent values Low and High
respectively; #: word boundary placed by the algorithm; o/c: intonational phrase boundary: $: function word located by the
algorithm; TX: transcription; AB: actual word boundary indicated manually.
Acknowledgements
We would like to thank Mr. V.R. Ramachan- dran who helped us in implementing the word hypothesization algorithm. We would like to thank the reviewers for the many improvements sug- gested on the earlier version of the paper.
References
D.R. Cutler (1990), “Exploiting prosodic probabilities in
speech segmentation”, in Cognitive Models of Speech Pro- cessing, ed. by G. Altmann (MIT Press, Massachusetts).
B. Delgutte (19781, “Techniques for the perceptual investiga- tion of F,, contours with applications to French”, J. Acoust.
Sot. Amer., Vol. 64, pp. 1319-1332. P. Eswar (19901, A rule-based approach for spotting charac-
ters from continuous speech in Indian language, PhD
Dissertation, Indian Institute of Technology, Madras.
H. Fujisaki and K. Hirose (19851, “Analysis of voice funda-
mental frequency contours for declarative sentences of
Japanese”, J. Acoust. Sot. Jap., Vol. (E)5, pp. 233-242.
E. Garding (1990, “Intonation parameters in production and
perception”, Proc. XIIth Internal. Congress of Phonetic Sciences (ICPhS 91), Vol. I, Aix-en-Provence, France, pp.
300-304.
C. Gussenhoven and A.C.M. Rietweld (1988), “Voice funda-
mental frequency declination in Dutch: Testing three hy-
potheses”, J. Phonetics, Vol. 16, pp. 355-369. J. Harrington, 1. Johnson and M. Cooper (1987). “The appli-
cation of phoneme sequence constraints to word boundary
identification in automatic continuous speech recognition”,
Proc. European Conference on Speech Technology. Vol. I,
pp. 163-166.
A.S. House and G. Fairbanks (19531. “The influence of con-
sonant environment upon the secondary acoustical charac- teristics of vowels”, .I. Acoust. Sot. Amer., Vol. 25, pp.
105-113.
A.R. Kelkar (19681, Studies in Hindi-Urdu I (Building Cente-
nary and Silver Jubilee Series, Deccan College, Poona),
pp. 96-105.

46 S. Rajendran, B. Yegnanarayana /Speech Communication 18 (1996) 21-46
D.H. Klatt (1975), “Vowel lengthening is syntactically deter- mined in connected discourse”, J. Phonetics, Vol. 3, pp. 129-140.
K.J. Kohler (1990), “Macro and micro F,, in the synthesis of intonation”, in Papers in Laboratory Phonology I: Between Grammar and Physics of Speech ed. by J. Kingstone and M.E. Beckman (Cambridge University Press, Cambridge), pp. 115-138.
D.R. Ladd (19861, “Intonational phrasing: The case for recur- sive prosodic structure”, Phonology Yearbook, Vol. 3, pp. 311-340.
W. Lea (1980), “Prosodic aids to speech recognition”, Trends in Speech Recognition (Prentice-Hall, New Jersey).
I. Lehiste and G.E. Peterson (19611, “Some basic considera- tions in the analysis of intonation”, J. Acoust. Sot. Amer., Vol. 33, pp. 419-425.
P. Lieberman (1967), Intonation, Perception and Language (M.I.T. Press, Massachusetts).
M. Lieberman and J. Pierrehumbert (1984), “Intonational invariance under changes in pitch range and length”, in Language Sound Structure, ed. by M. Aronoff and R.T. Oehrle (M.I.T. Press, Massachusetts), pp. 157-233.
A.S. Madhukumar, S. Rajendran and B. Yegnanarayana (1991), “Significance of prosodic knowledge in a text-to- speech system for Hindi”, Proc. International Congress on Phonetic Sciences, Aix-en-Provence, France, Vol. 3, pp. 494-497.
A.S. Madhukumar, S. Rajendran and B. Yegnanarayana (19931, “Intonation component of a text-to-speech system for Hindi”, Computer Speech and Language, Vol. 7, pp. 283-301.
P. Martin (1979), “Automatic location of stressed syllable in French”, Current Issues in Linguistic Inquiry, Vol. 9, pp. 1091-1094.
R.C. Mehrotra (19651, “Stress in Hindi”, Indian Linguistics, Vol. 26, pp. 96-105.
M. Ohala (1983), Aspects of Hindi Phonology (Motilal Banar- sidass, Delhi).
M. Ohala (1986), “A search for the phonetic correlates of Hindi stress”, in Structure, Conuergence and Diglossia, ed. by Bh. Krishnamurti (Motilal Banarsidass, Delhi), pp. 81- 92.
M. Ohala (1991), “Phonological area1 features of some Indo- Aryan languages”, Language Sciences, Vol. 13, pp. 107- 124.
S.E.G. Ohman (1966), “Coarticulation in VCV utterances: Spectrographic measurements”, J. Acoust. Sot. Amer., Vol. 39, pp. 151-168.
P. Pierrehumbert (1981), “Synthesizing intonation”, J. Acoust. Sot. Amer., Vol. 70, pp. 985-995.
P.J. Price, C.W. Wightman, M. Ostendorf and J. Bear (1990), “The use of relative duration in syntactic disambiguation”, Proc. Internat. Conf Spoken Language Processing, Kobe, Japan, Vol. 1, pp. 13-16.
G.V. Ramana Rao and B. Yegnanarayana (1991), “Word boundary hypothesization in Hindi speech”, Computer Speech and Language, Vol. 5, pp. 379-392.
A. Sharma (19691, “Hindi word accent”, Indian Linguistics, Vol. 30, pp. 115-118.
N.G. Thorsen (1980), “A study of perception of sentence intonation - Evidence from Danish”, J. Acoust. Sot. Amer., Vol. 67, pp. 1014-1030.
Alex Waibel (1988), Prosody in Speech Recognition (Morgan Kaufmann, London).
C.W. Wightman and M. Ostendorf (1991), “Automatic recog- nition of prosodic phrases”, Proc. Internat. Conf Acoust. Speech Signal Processing, Toronto, Vol. 1, pp. 321-324.
B. Yegnanarayana, Hema A. Murthy and V.R. Ramachan- dran (19911, “Speech processing using modified group delay functions”, Proc. Internat. Conf Acoust. Speech Sig- nal Processing, Toronto, Vol. 2, pp. 945-948.