Digital Salary Insights 5th edition
60
Digital Salary & Industry Insights propellondon.com 0207 432 6340 [email protected] @propellondon.com 5th Edition
-
Upload
alex-straw -
Category
Documents
-
view
159 -
download
2
Transcript of Digital Salary Insights 5th edition

DigitalSalary &IndustryInsights
propellondon.com0207 432 [email protected]@propellondon.com
5th Edition

2 | Digital Salary and Industry Insights
ContentsPrefaceMethodologyDemographics
Industry OverviewJob satisfactionJob securityWillingness to move rolesFactors that drive job changeHow professionals find a roleBonusesSalary overviewGender pay gap
MarketingHighlights & Key demographicsFactors that drive job changeJob satisfactionSalaries
Contract rates
Digital marketing
Analytics
Social
Content
Search
eCRM
eCommerce
Affiliates
Product
Project management
Account management
Sales
AdvertisingHighlights & Key demographicsFactors that drive job changeJob satisfactionSalaries
456
7810111213151616
171819202122
23
23
24
24
25
25
26
26
27
27
28
28
2930313233
Campaign delivery
Planning & buying
Biddable
Analytics
Solutions / Pre-sales
Product management
Account management
Sales
Creative ServicesHighlights & Key demographicsFactors that drive job changeJob satisfactionSalaries
Creative technologists
Contract rates
Artwork
Design
Creative
Strategy
UX
Project management
Account management
Sales
TechnologyHighlights & Key demographicsFactors that drive job changeJob satisfactionSalaries
Contract rates
Back-end
Front-end
Testing
Dev ops
Business intelligence
Data scientist
Project management
Sales
34
34
35
35
36
36
37
37
394041424343
44
45
45
46
46
47
47
48
48
495051525354
55
55
56
56
57
57
58
58
Digital Salary and Industry Insights | 3
This edition sees an entirely new dynamic of information that puts readers in touch with the thoughts of the people working in our industry.
“”
Welcome,
Now on its fifth edition, our ‘Salary & Industry Insights’ report has become an extremely valuable tool for employers and candidates alike. This year however, our data and research are more comprehensive than ever.
Until now we have always aggregated data from our own records and relationships with employers. This edition sees an entirely new dynamic of information that puts readers in touch with the thoughts of the people working in our industry.
We have intertwined results from an online survey (with over 2,000 respondents) with the data we normally use. This allows us to examine people’s opinions about the digital industry at large.
Do people feel secure and satisfied with their role? How do employees in the industry feel about bonuses? What makes people move to a new job?
All of these are questions we can now answer thanks to this extensive research.
So, whether you are looking to hire, get hired or just have an interest in the results, we hope you enjoy reading this report as much as we have enjoyed making it.
Melina JacovouCEO & FounderPropel

4 | Digital Salary and Industry Insights
PrefacePropel’s fifth annual ‘Digital Salary & Industry Insights’ has a much larger dataset than ever before. It combines our own internal data with that of over 2,000 respondents to a survey we conducted in January and February of 2014. This additional level of data was inspired by the lack of such information available to the digital industry. It provides granular industry insight into opportunities available to both employers and employees.
We still retain the core salary benchmarking information, but also analyse the perception of the industry and its employment conditions from the people working within it. Areas we delve into include job security, job satisfaction, what drives people to change roles, how willing they are to move and more.
Our booklet is broken down into a number of main sections allowing readers to quickly flick to relevant areas of interest - they are Industry Overview, Marketing, Advertising, Creative Services and Technology. Within each of those we include subsections that go into more detail on the various topics.
Throughout the report you will see data broken down into four levels of seniority. Whilst the particulars of each level may shift slightly depending on the skill set, the levels can generally be considered as:
Junior: 0 - 3 years experience, non management role
Mid-level: 3 - 7 years experience, mid management level
Senior: 8+ years experience, senior management level
C-level: Country Manager, Director or Board level status
We also include a short description of our methodology and an overview of the main demographics for those who would like a little more insight into what data we have and how it was accumulated.
This document has been produced entirely by Propel. Thanks go to:
Stuart McClure - Head of MarketingTheodora Luca - Digital Marketing Executive
Any queries regarding the contents of this report, as well as any media queries, can be directed to our Head of Marketing on 0207 432 6340 or by emailing us [email protected].
Digital Salary and Industry Insights | 5
MethodologyOur research was primary, quantitative and descriptive, with the scope of pointing out the main co-ordinates of the investigated issues.
We used three sets of data overall - an online survey, our own placed candidates and job specifications received from our clients.
Online survey
We gathered the data through a pre-tested and then revised questionnaire throughout January and February of 2014. The responses were collected online and hosted on SurveyMonkey, then analysed in Microsoft Office Excel and IBM SPSS.
We received an exceptional number of responses - 2,073. To ensure consistency of data, we invalidated 178 of the results. This was to excise partial responses, irrelevant respondents and errors. Our final sampling data consists of 1,895 respondents - all working in the digital sector and coming from a wide range of job positions and skill sets.
The questionnaire structure took into consideration a number of factors regarding respondents behaviour, namely:
Direct influences - demographic variables (age, gender, seniority, job title and salary)
Behavioural variables - career level, years in industry, skill
Deduced influences - job satisfaction, security, attitudes, lifestyle, career patterns
Internal data
We took a total of 2,671 records from our own administrative database - this includes a mixture of job specifications and placed candidates from 2013 up to May 2014. These two datasets give us access to salary information at a variety of seniority levels.
Final data total
In total we have 4,566 individual data records to form the basis of our analysis.

6 | Digital Salary and Industry Insights
DemographicsWe have broken down the main demographical data of the respondents to our survey. As can be seen from the charts below, we have a good representation across all areas, with a close to expected spread of results.
In terms of geography, 61% of respondents are from Central and Greater London. 33% are from across all other regions of the UK and the remaining 6% are from overseas (predominantly Europe and USA).
63.6%
36.4% MenWomen
11%5.3%
26%
56.9%
<2526-35
36-45
46-55
56-65 (0.6%)65+ (0.2%)
9.2%
38.6%
10.9%
41.3%
JuniorMid-level
Senior
C-level
15.3%
49.1%19.2%
16.4%
MarketingAdvertising
Creative
Technology
33.5%26%
10.2%21.8%
<1 y (5.3%)1-2 y
2-5 y
5-10 y10-20 y
20+ y (3.2%)
26.3%
41.7%
5.9%
23.7%
<1 y1-2 y
2-5 y
5-10 y10-20 y (2%)
20+ y (0.4%)
Demographics overview: Gender Demographics overview: Age
Demographics overview: Seniority Demographics overview: Sector
Demographics overview: Time in industry Demographics overview: Time in role

Industry Overview
Section 1:
Before we look at each of our four core areas in detail, we break down some of the wider trends we have seen across the digital industry. This offers an all encompassing view of the market and gives perspective to the rest of the report.

8 | Digital Salary and Industry Insights
Industry Overview
Job satisfactionKeeping staff happy and engaged is a key factor in ensuring the best employees remain part of your business. Our survey questioned respondents on their level of job satisfaction.
The results show that 64% of professionals are satisfied in their roles, with C-level respondents showing a higher level of job satisfaction (38.9% are ‘very’ satisfied) compared to only 23.3% of juniors and 17.4% of mid-level professionals. When broken down by gender, however, there is no discernable split in levels of satisfaction.
Length of tenure is a key metric that can effect the level of satisfaction in a job, with the main concern for employers being the loss of those in a role for many years (often valuable employees). Our research found that the highest levels of satisfaction were amongst those in their first year of a role. Most dissatisfied, however, are those with between two and five years’ service, with 27.7% expressing dissatisfaction. 17.7% of respondents in a role for 5 years or more are dissatisfied.
We also asked respondents what elements of a role influenced their levels of satisfaction, and found that personal interest in the role and career progression were the biggest factors by far. Analysing further reveals that those most interested in their role are professionals with many years of experience. Having competent colleagues and being recognised for their achievements are the next most important factors according to 6 out of every 10 respondents.
When it comes to company success, 60% of juniors feel this isn’t relevant to their level of satisfaction, compared with long standing employees - 80% of those serving for 10 to 20 years mention this as a very important factor in their satisfaction. Seniority has the same mindset.
Recommendations
- Monitor staff with 2 - 5 years in the role - increase their satisfaction- Engage juniors in business values and success - get them to buy in- Make career progression opportunities clear

Digital Salary and Industry Insights | 9
Industry Overview
39%C-level
Women63% satisfied
21% very satisfied
Junior Mid-level Senior C-level
81% 72% 63% 53%
Junior: 69% satisfied
Mid-level: 60% satisfied
C-level: 76% satisfied
Senior: 64% satisfied
Creative
AdvertisingTech
Marketing
JOB SATISFACTION by discipline
64% of respondents are SATISFIED in their roles
40% Junior
44% Mid-level
50% Senior
74% C-level
MOST SATISFIED LEAST
Importance of COMPANY SUCCESS to job satisfaction
28% dissatisfied / 2-5 years in role
27% dissatisfied / 1-2 years in role
11% dissatisfied / <1 year in role
Importance of CAREER PROGRESSION to job satisfaction
VERY
IMPORTANT
VERYSATISFIED
Men65% satisfied23% very satisfied
62%
60%64%
72%

10 | Digital Salary and Industry Insights
Industry Overview
Job securityJob security is another relevant factor in regard to employees. Those who don’t feel secure are likely to jump ship for a role that seems safer. This is demonstrated by the fact that 84.4% of respondents who are insecure in their jobs want to move, compared to only half of those who feel secure.
Overall, 75.4% of respondents are secure in their roles - a great testament to the UK digital industry. When breaking this down between people in agency positions versus those in client-side ones, there is a slight nod towards individuals in agencies being more secure (40.9% respondents are very secure compared to 33.6% of in-house professionals).
Interestingly, almost half of the respondents under 25 said they are very secure (47.6%) - feelings not shared by their elders (only 27.1% of the age group 36-45 feel very secure). Furthermore, job security is highest in the respondent groups that have been in their role for 1-2 years (41.6%) and 5-10 years (43.9%), compared to 35.7% of employees in their roles for less than a year.
Seniority breakdown points to C-level and junior professionals feeling most secure - mid-level and senior are the most insecure, likely due to the natural evolution of careers at that level.
Unsurprisingly, the survey also reveals that job security is far lower within companies that made redundancies, only 24% of respondents being very secure compared to 45.4% of the respondents in firms that didn’t make redundancies..
0 20 40 60 80 100
Junior
Mid-level
Senior
C-level 43.5%
37.6%
37.4%
40.5%
30.6%
36.7%
38.1%
41.4%
21.1%
15.9%
13.8%
12.1%
very secure somewhat secure neutral somewhat insecure very insecure
Graphic: Job security by seniority (Overall)

Digital Salary and Industry Insights | 11
Industry Overview
Willingness to move rolesWith today’s highly dynamic and ever changing digital landscape, there are constant opportunities for professionals to move roles. New technology, new best practices and new businesses abound. Losing good talent is a serious concern for employers.
Overall, 59% of respondents see themselves changing roles in the next year. Intention is slightly higher amongst men (60.3% vs 56.3% of women). Across levels of seniority however, numbers vary more widely. Least intention to move sits with C-level employees (44.5%), with mid-level being the most likely to move (63.3% are considering a move in the next year).
Refining our data across client-side employees and agencies shows agency professionals have a higher intention of moving, although only 4% more than their client-side counterparts.
Bonus and paid overtime hours heavily impact people’s willingness to move - 10% more respondents, who don’t receive a bonus or paid overtime, say they would move.
Organisational change can also be highlighted as a significant driver of people wanting to leave. Unsurprisingly, 72.4% of people working in companies reducing in size intend to move on, alongside 67.2% of those working in a company making redundancies.
In terms of willingness to leave, the most concerning figure we unearthed is that those in their second year of employment are by far the most likely to move in the next twelve months (71%).
Recommendations
- Engage closely with 2nd year staff - they are the most likely to move- Consider bonus and / or paid overtime to increase loyalty- Effectively communicate company change to soothe employees’ concerns- Redundancies scare people - be transparent about why they happen
12 | Digital Salary and Industry Insights
Industry Overview
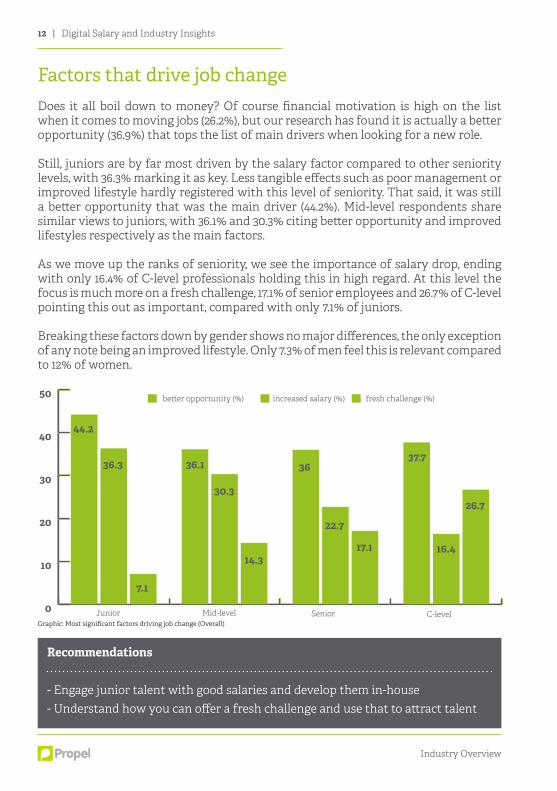
Factors that drive job changeDoes it all boil down to money? Of course financial motivation is high on the list when it comes to moving jobs (26.2%), but our research has found it is actually a better opportunity (36.9%) that tops the list of main drivers when looking for a new role.
Still, juniors are by far most driven by the salary factor compared to other seniority levels, with 36.3% marking it as key. Less tangible effects such as poor management or improved lifestyle hardly registered with this level of seniority. That said, it was still a better opportunity that was the main driver (44.2%). Mid-level respondents share similar views to juniors, with 36.1% and 30.3% citing better opportunity and improved lifestyles respectively as the main factors.
As we move up the ranks of seniority, we see the importance of salary drop, ending with only 16.4% of C-level professionals holding this in high regard. At this level the focus is much more on a fresh challenge, 17.1% of senior employees and 26.7% of C-level pointing this out as important, compared with only 7.1% of juniors.
Breaking these factors down by gender shows no major differences, the only exception of any note being an improved lifestyle. Only 7.3% of men feel this is relevant compared to 12% of women.
0
10
20
30
40
50
Junior Mid-level Senior C-level
44.2
36.3
7.1
36.1 3637.7
30.3
22.7
16.414.3
17.1
26.7
be�er opportunity (%) increased salary (%) fresh challenge (%)
Recommendations
- Engage junior talent with good salaries and develop them in-house- Understand how you can offer a fresh challenge and use that to attract talent
Graphic: Most significant factors driving job change (Overall)

Digital Salary and Industry Insights | 13
Industry Overview
How professionals find a roleVarious people adopt different methods of finding themselves a new job. Some look on the website of companies they want to work for, others hit job boards. Some consult their peers for opportunities and yet more contact their preferred recruiter. We questioned individuals in the industry on their preference.
When it comes to how professionals intend to find their next role, it seems people like to cast their net wide. Recruitment consultancy (50.6%), LinkedIn (60.1%), Headhunter (42%), employer’s website (30.7%), job boards (37%) and word of mouth (38%) were all marked as methods that would be used. Print is very low on people’s radar and social has yet to make a significant impact on job search practices.
Analysing these trends across the levels of seniority highlights a potentially expected result, but one worthy of mention none the less. Whilst junior, mid-level and senior professionals are happy using all methods of job hunting, C-level professionals show a clear preference for using more personal methods. Generic sources of roles such as job boards (11.76%) and company websites (21.07%) score very low. Face to face methods, on the other hand, have much more importance. Word of mouth (46.56%), Headhunter (50.49%) and LinkedIn (51.47%) were the most common for C-level job seekers.
Interestingly, there is a striking difference between the number of C-level people who opt to use a recruitment consultancy (36.27%) versus headhunters / executive search (50.49%). This suggests professionals at this level not only understand the recruitment process well, but prefer to entrust their career move with specialist executive recruitment teams (headhunters) rather than standard recruitment practitioners.
0
10
20
30
40
50
60
70
80
Recruitment consultancy LinkedIn Headhunter Word of mouth
47.3
54.9
27.1
5550.9
36.2
75.3
59
51.4
38.8
45.950.4
Junior (%) Mid-level (%) C-level (%)
Company website
32.936.6 38
46.5
35.2
34.9
28.4
21
Senior (%)
Graphic: Methods of finding a role by seniority (Overall)

14 | Digital Salary and Industry Insights
Industry Overview
Recommendations
- Ensure good social presence for attracting candidates, especially on LinkedIn- Develop strong relationships with a proven recruitment consultancy- Avoid print advertising, but consider job boards- Engage with a reputable headhunter / executive search firm for senior roles
Finally, we asked respondents how they found their current role. The most common method by far is through a recruitment consultancy (38.6%). Behind that come a number of methods, all hovering around the same levels of occurence - 14.4% applied directly through an employer’s website, 11.9% were referred by someone in their network and 11.2% applied through job boards. Social media is still looking to make a foothold as a method of sourcing a new job, with only 3.2% of respondents gaining their current employment in this way. And it seems we have eventually seen the long drawn out death of print as a medium for job advertising - only 0.3% use this medium.
When it comes to the industry breakdown, recruitment consultancies and LinkedIn are by far the most commonly used methods for job searching. Both advertising and marketing respondents are more willing to use these job seeking techniques compared to the other disciplines. Our data also points out that trade and company websites are the least used mediums for coming across a new job, a trend that can be seen across all disciplines.
0
10
20
30
40
50
60
70
80
Recruitment consultancy LinkedIn Headhunter Word of mouth
56
66.9
41.3
58.7
44.4 45.6
69.7
52.1 51.3 51
34.9
41.3
Marketing(%) Advertising (%) Technology (%)
Company website
38.2
47.9
39.534.8 35.2
29.1 29.726.9
Creative (%)
Graphic: How roles were found by seniority (Overall)

Digital Salary and Industry Insights | 15
Industry Overview
BonusBonuses form part of the remuneration package for 50.1% of all respondents - good news for professionals working in digital. However, being more senior counts - only one third of juniors receive a bonus compared to just over 60% of C-level employees. Generally, a bonus equates to between 6% and 10% of a person’s salary.
Gender split shows no real difference in regard to bonuses. Slightly more men receive one (51.6%) than women (47.5%).
Another interesting piece of information is in relation to how bonuses affect the levels of job satisfaction and loyalty. Those who receive a bonus demonstrate significantly higher levels of job satisfaction (69.8% compared to 57.4% of those who don’t receive one), as well as a much lower intention of changing roles (54.2% would change jobs compared to 64.7% of those who don’t have a bonus).
The same influence can be seen in relation to job tenure. The longer someone has worked in a role, the more important bonus becomes to their overall job satisfaction (43.5% naming it as very important at the 5-10 years in a role level, compared to 27% in their first year, 28.6% at 1-2 years and 32.2% at 2-5 years).
Paid overtime work also affects bonus distribution, with half of the respondents who aren’t paid for their overtime receiving one (50.8%), unlike 30% of those who are paid. However, our data reveals that a staggering 93.4% of respondents aren’t paid for their overtime work, the extra hours ranging from 1-5 hours per week (51.7%) to 6-10 hours per week (34.4%), with 7.8% doing 10-15 hours extra and 4.5% doing more than a whopping 20 hours or more a week.
0
10
20
30
40
50
60
70
80
33.6
66.4
48.351.7
47.9
60.1
52.1
39.9
yes (%) no (%)
Junior Mid-level Senior C-levelGraphic: Receipt of bonus by seniority (Overall)

16 | Digital Salary and Industry Insights
Industry Overview
Salary overviewBefore we break down salaries across the various specialisms, let’s look at the overall average industry salaries.
Our data shows a split across salaries that can be commanded between agency and client-side roles. It seems the client-side world pays more at all levels, although senior roles are pretty much in line. The overall column also shows average day rates for contractors (a split between agency and client-side is not relevant for contracts).
Junior
Mid-level
Senior
C-level
Overall
£24,761 / £151
£37,915 / £298
£61,565 / £406
£102,966
Agency
£23,310
£35,766
£60,830
£95,212
Client-side
£26,161
£39,486
£61,873
£114,199
These figures make positive reading for the industry. The UK national average wage is estimated at around £26,500, meaning that juniors working in digital can command near the average wage, let alone aim well beyond it.
Gender pay gapA burning question for any industry has to be ‘is there a gender pay gap?’. UK wide, and across all industries, the gap is 19%. This puts the UK way down the list of EU nations as one of the worst offenders. So, how does digital compare?
It actually compares very well. Our data shows that the gender pay gap across digital is only 4% - reassuring to know.
If we break this down across the four levels of seniority, we can see the main culprit for gender disparity is at C-level - here the pay gap stands at 7%. Issues around the number of women at board level, or lack thereof, is well discussed in the wider industry press and beyond.
Across the other levels of seniority the pay gap is far less - junior is only 1%, with mid-level and senior both coming in at 3%.

Marketing
Section 2:
Marketeers are at the coal face of the challenges that organisations encounter to sell their products and services. This section of our report is dedicated to the mix of skills across both agency and client-side.

18 | Digital Salary and Industry Insights
Marketing
Marketing highlightsThe following pages outline a variety of trends and information relating specifically to those professionals working within marketing. Before you read on though, here are a few key findings from our research, alongside a breakdown of the specialisms demographics.
60.5% of C-level marketers and 66.7% of respondents with 10-20 years experience in the same role are reluctant to change their job.
C-level professionals are motivated far more by a fresh challenge (32%) than juniors (4.8%). Juniors are mostly interested in better opportunities (46%).
The vast majority of professionals working in Account Management would change roles in the following 12 month period (70.5%), whereas only half of the Digital Marketing respondents would follow the same path.
The more senior one is, the more secure one feels in their job.
51.4% of marketers receive a bonus, but 94.6% of professionals are not paid for their overtime.
57.3%
42.7%
Men Women
11%4.9%
22.7%
60.7%
<2526-3536-45
46-5556-65 (0.5%)65+ (0.2%)
9.8%9.9%
36% 44.3%
JuniorMid-level
SeniorC-level
Key demographicsAs seen from the graphics below, marketing is represented well across the three key demographics. The number of men versus women is far more even than other sections.

Digital Salary and Industry Insights | 19
Marketing
Factors that drive job changeThose working in marketing have a slightly higher than average likelihood of moving roles in the next year - 59.2% of respondents said they would, compared with an overall average of 55.3%. Seniority and length of service make for a different breakdown. Both those who are more senior and those who have been a in a role for many years show very little intention of moving.
More reassuringly though, 73% of people believe they will still work within the same industry in 5 years’ time. So, a bit of a fluid market place for talent right now, but still a strong pull on candidates to remain within the sector.
Regarding the main factors that drive people to move to a new role, marketing professionals stay in line with the general industry consensus. Better opportunity is the predominant driver, over financial reward. Similarities to the rest of digital remain consistent across all seniority levels (see page 12), with the exception of people looking for a ‘fresh challenge’. One third of seniors list this as a main consideration (compared to an industry average of 27%) and less than 5% of juniors (compared to an average of 7%).
One potential area of concern uncovered by our research relates specifically to the agency world. Over 70% of Account Managers say they intend to change roles within the next year.
0
10
20
30
40
50
60
70
80
Junior Mid-level Senior C-level
51.6
65.258.7
51.2
39.5
48.7
70.3
33.3
67.7
<1 y 1-2 y 2-5 y 5-10 y 10-20 y
Graphic: Intention of changing roles by seniority and tenure (Marketing)

20 | Digital Salary and Industry Insights
Marketing
Women62% satisfied
20% very satisfied
42%C-level
Men65% satisfied24% very satisfied
Junior Mid-level Senior C-level
77% 75% 69% 53%
Junior: 73% satisfied
Mid-level: 56% satisfied
C-level: 78% satisfied
Senior: 66% satisfied
Content
SocialDigital Marketing
Analytics
JOB SATISFACTION by skill
64% of marketing respondents are SATISFIED in their roles
35% Junior
44% Mid-level
46% Senior
74% C-level
MOST SATISFIED LEAST
Importance of COMPANY SUCCESS to job satisfaction
34% dissatisfied / 2-5 years in role
23% dissatisfied / 1-2 years in role
13% dissatisfied / <1 year in role
Importance of CAREER PROGRESSION to job satisfaction
VERYSATISFIED
VERY
IMPORTANT
62%
44%63%
65%

Digital Salary and Industry Insights | 21
Marketing
Job satisfactionFor an overview of job satisfaction within the marketing skill set, take a look at our infographic to the left. If you would like to compare it to the overall industry, the relevant graphic can be found on page 9.
SalariesThe following pages break down salary averages across the digital marketing skill sets. Covering both client-side and agency professionals, the information makes for interesting reading.
At junior and mid-level seniority we can see that client-side roles offer the best remuneration for professionals. On average, a person working in-house at this level can expect to receive an average of around 10% more than an agency counterpart’s salary.
Senior and C-level are a different picture however. At senior levels, professionals assume a greater responsibility for a higher number of projects or clients, and so salaries start to smooth out and even increase in some areas at C-level. This is not the case in all specialisms however, so we have pointed out the most significant variations from the norm.
Below are average salaries for marketing across the four levels of seniority and how they compare to the industry average.
0
20000
40000
60000
80000
100000
120000
24,761
61,565
37,915
marketing (£) industry average (£)
Junior Mid-level Senior C-level
102,966
25,123
38,102
62,544
100,257
Graphic: Average sector salaries compared to industry averages (Marketing)

22 | Digital Salary and Industry Insights
Marketing
Contract rates
A flexible workforce is widely recognised as a great asset for organisations, not only on a short term basis, but also for plugging gaps and hitting deadlines that loom. It is particularly useful in a situation where employers may not wish to make permanent hires, but require additional workforce.
Although perhaps not as commonly used as in other areas of digital, marketing certainly has a healthy pool of contract workers.
Here is a breakdown of the average contract rates we have seen across the variety of marketing skill sets.
Skill
Digital Marketing
Analytics
Social
Content
Search
eCRM
eCommerce
Product Management
Project Management
Junior
£151
£139
£115
£140
£142
-
£142
-
£137
Mid-level
£293
£301
£285
£286
£330
£275
£350
£420
£248
Senior
£464
£392
£500
£550
£500
£490
-
-
-

Digital Salary and Industry Insights | 23
Marketing
Digital marketing
Professionals working across a mixed skill set remain well remunerated, with salaries higher than the overall marketing average at all levels apart from C-Level. Interestingly, client-side roles pay an average of 8.25% more at all seniority levels.
Analytics
Analytical roles within marketing show a large demand for the most senior people with the ability to help businesses crunch the numbers - as can be seen from the big leap to C-level salaries. Agency salaries are lower than client-side for lower level roles, but senior and C-level salaries see a much higher return than client-side.
£39,592
£25,647
C-level
£0k
£65,540
£98,875
Senior
Mid-level
Junior
£10k £20k £30k £40k £50k £60k £70k £80k £90k £100k £110k ....... £200k
£37,088
£24,750
C-level
£0k
£69,917
£113,250
Senior
Mid-level
Junior
£10k £20k £30k £40k £50k £60k £70k £80k £90k £100k £110k £120k £130k

24 | Digital Salary and Industry Insights
Marketing
Social
Salaries for professionals working within social have a very consistent increase across all levels of seniority, but as social still looks to cement itself as a skill with C-level representation, remuneration at the highest bracket remains below the norm.
Content
As with social, content is still clawing out its place at the very top levels of responsibility and, although very much recognised as a stand alone skill within digital marketing, it does not have sufficient representation at the most senior level yet.
£33,776
£22,854
C-level
£0k
£57,000
£73,333
Senior
Mid-level
Junior
£10k £20k £30k £40k £50k £60k £70k £80k £90k £100k £110k £120k £130k
£36,717
£24,438
£0k
£59,937Senior
Mid-level
Junior
£10k £20k £30k £40k £50k £60k £70k £80k £90k £100k £110k £120k £130k

Digital Salary and Industry Insights | 25
Marketing
Search
It is well recognised that search is one of the core skill sets within digital marketing. As such, it has a wide range of salaries at the higher levels. Board representation is strong and the crossover of salary bands at mid, senior and C-level means there are lots of opportunities for professionals to be suitably rewarded, with the highest band of salary going up to £200k.
eCRMSecond only to Product Management, salaries at mid-level responsibility in eCRM have a high average. A lack of representation at the highest levels though, means senior salaries don’t share that benefit as much. And with a very small band at junior level, eCRM as a skill set may struggle to attract the best professionals out there.
£36,408
£25,389
C-level
£0k
£56,397
£104,429
Senior
Mid-level
Junior
£10k £20k £30k £40k £50k £60k £70k £80k £90k £100k £110k ....... £200k
£41,871
£28,026
£0k
£55,000Senior
Mid-level
Junior
£10k £20k £30k £40k £50k £60k £70k £80k £90k £100k £110k £120k £130k

26 | Digital Salary and Industry Insights
Marketing
eCommerce
eCommerce and merchandising professionals are in strong demand. With digital commerce being a mainstay for many businesses now, the professionals capable of delivering in this field are being rewarded with excellent salaries. We are also seeing a big leap to C-level remuneration which is very attractive to senior professionals looking for the next step.
Affiliates
Agency roles dominate the landscape of affiliate professionals in all areas except mid-level. As retailers bring more affiliate professionals in house we see that client-side salaries are most competitive there. Salary bandings are quite small at all levels though, so there is little room for individuals to build on their remuneration without a direct promotion.
£44,990
£29,000
C-level
£0k
£57,385
£120,000
Senior
Mid-level
Junior
£10k £20k £30k £40k £50k £60k £70k £80k £90k £100k £110k £120k £130k
£34,870
£24,136
C-level
£0k
£52,100
£70,000
Senior
Mid-level
Junior
£10k £20k £30k £40k £50k £60k £70k £80k £90k £100k £110k £120k £130k

Digital Salary and Industry Insights | 27
Marketing
Product
With the exception of C-level, product management is comfortably the most rewarding skill set in Marketing. That said, C-level remains very competitive. All companies need to ensure good product though, so this is not unexpected.
Project management
Unsurprisingly, PM roles within marketing agencies are more competitive than client-side. This is mainly due to the nature of business, with many brands allocating PM responsibility to their marketing professionals rather than making specific PM hires. When it comes to agencies, roles are rife, but narrow salary bands mean clawing your way to the top as a candidate could be hard work.
£45,968
£29,000
C-level
£0k
£72,844
£117,500
Senior
Mid-level
Junior
£10k £20k £30k £40k £50k £60k £70k £80k £90k £100k £110k £120k £130k
£37,832
£21,250
C-level
£0k
£68,000
£95,000
Senior
Mid-level
Junior
£10k £20k £30k £40k £50k £60k £70k £80k £90k £100k £110k £120k £130k

28 | Digital Salary and Industry Insights
Marketing
Account management
Another core skill set of the agency world, AM professionals are very highly represented in our data. There is a lot of scope for professionals in this area of digital marketing, with top salaries heading well north of £200k in the largest of agencies. Junior level is a great feeder for mid-level and senior jobs, which both have a good range of possible salaries, with C-level offering a massive range and opportunity.
SalesTraditionally sales is a very competitive industry, and this remains the case in marketing. Huge salary bands and steady averages suggest people in sales can command a good salary if they perform well.
£36,364
£24,567
C-level
£0k
£56,964
£115,625
Senior
Mid-level
Junior
£10k £20k £30k £40k £50k £60k £70k £80k £90k £100k £110k ....... £250k
£41,694
£22,000
C-level
£0k
£67,413
£96,364
Senior
Mid-level
Junior
£10k £20k £30k £40k £50k £60k £70k £80k £90k £100k £110k ....... £170k
Advertising
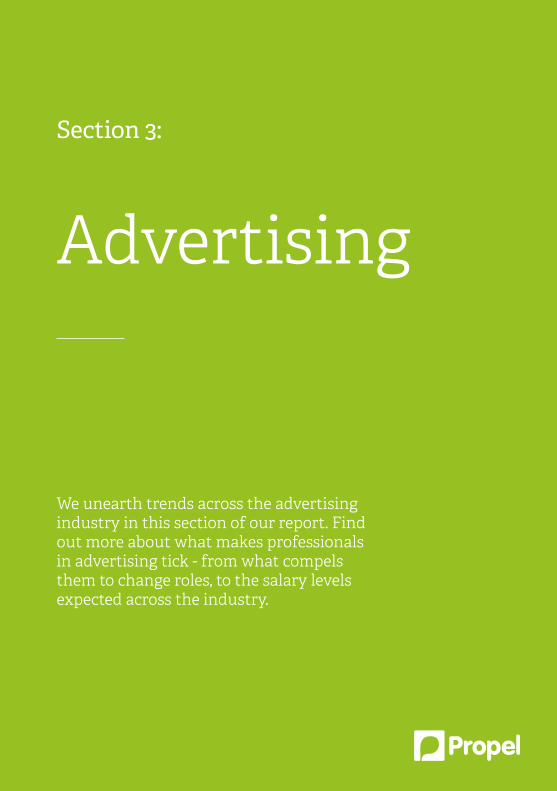
Section 3:
We unearth trends across the advertising industry in this section of our report. Find out more about what makes professionals in advertising tick - from what compels them to change roles, to the salary levels expected across the industry.

30 | Digital Salary and Industry Insights
Advertising
Advertising highlightsOur research on the advertising industry gave us some great insight into salaries and people’s opinions of the industry. You can read a few of the most important results below, as well as a view the demographic breakdown. There is a more comprehensive review on the following few pages.
Advertising respondents are the most likely to move roles in the year to come, but the second most likely to stay within their industry in 5 years’ time.
For employees between their 1st and 2nd year in the job, salary rise is the most important factor when looking for another job.
Company success heavily impacts job satisfaction - the most important across the whole digital industry.
Career progression - most respondents pick ‘very important’ across the whole of the digital industry.
More professionals in advertising receive a bonus than professionals in any other sector. They also have the highest number of respondents selecting bonus as ‘very important’.
61.5% of advertising respondents had their salaries increased in the past year, the highest number across the digital industry.
55.4%44.6%
Men Women
14%5.1%
24.3%
56.2%
<2526-3536-45
46-5556-65 (0.4%)
11.2%
37.3%
10.5%
41%
JuniorMid-level
SeniorC-level
Key demographicsAs with marketing, advertising has a very good spread of representation across the main demographics. If anything, it is slightly over represented at senior level, but not to such an extent that it effects the data processed in the report.
Digital Salary and Industry Insights | 31
Advertising
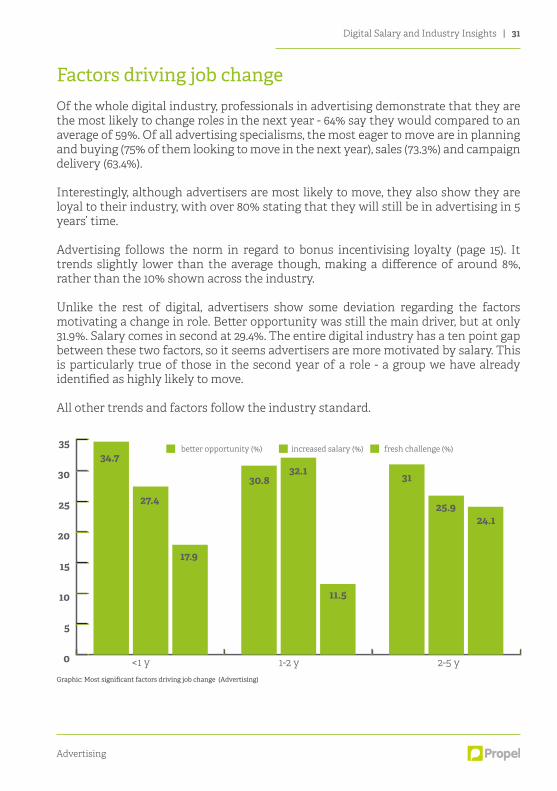
Factors driving job changeOf the whole digital industry, professionals in advertising demonstrate that they are the most likely to change roles in the next year - 64% say they would compared to an average of 59%. Of all advertising specialisms, the most eager to move are in planning and buying (75% of them looking to move in the next year), sales (73.3%) and campaign delivery (63.4%).
Interestingly, although advertisers are most likely to move, they also show they are loyal to their industry, with over 80% stating that they will still be in advertising in 5 years’ time.
Advertising follows the norm in regard to bonus incentivising loyalty (page 15). It trends slightly lower than the average though, making a difference of around 8%, rather than the 10% shown across the industry.
Unlike the rest of digital, advertisers show some deviation regarding the factors motivating a change in role. Better opportunity was still the main driver, but at only 31.9%. Salary comes in second at 29.4%. The entire digital industry has a ten point gap between these two factors, so it seems advertisers are more motivated by salary. This is particularly true of those in the second year of a role - a group we have already identified as highly likely to move.
All other trends and factors follow the industry standard.
0
5
10
15
20
25
30
3534.7
27.4
17.9
30.8
25.9
32.1 31
11.5
24.1
be�er opportunity (%) increased salary (%) fresh challenge (%)
<1 y 1-2 y 2-5 yGraphic: Most significant factors driving job change (Advertising)
32 | Digital Salary and Industry Insights
Advertising
Women62% satisfied
20% very satisfied
47%C-level
Men65% satisfied24% very satisfied
Junior Mid-level Senior C-level
92% 74% 73% 60%
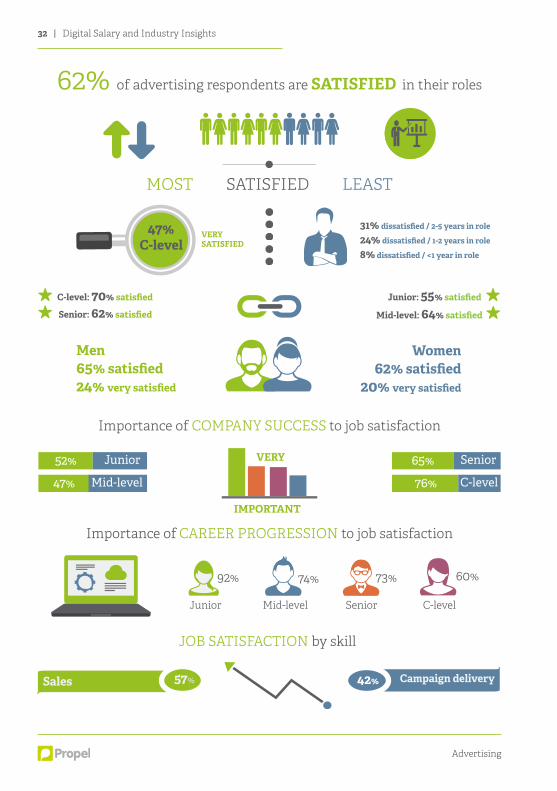
Junior: 55% satisfied
Mid-level: 64% satisfied
C-level: 70% satisfied
Senior: 62% satisfied
Campaign delivery Sales
JOB SATISFACTION by skill
62% of advertising respondents are SATISFIED in their roles
52% Junior
47% Mid-level
65% Senior
76% C-level
MOST SATISFIED LEAST
Importance of COMPANY SUCCESS to job satisfaction
31% dissatisfied / 2-5 years in role
24% dissatisfied / 1-2 years in role
8% dissatisfied / <1 year in role
Importance of CAREER PROGRESSION to job satisfaction
VERYSATISFIED
VERY
IMPORTANT
57% 42%

Digital Salary and Industry Insights | 33
Advertising
Job satisfactionFor an overview of job satisfaction within advertising, take a look at our infographic to the left. If you would like to compare it to the overall industry, the relevant graphic can be found on page 9.
SalariesOn the following pages we have included a breakdown of salary averages at the four main levels of responsibility for all skill sets within advertising.
Across the industry Product Management tends to be one of the most lucrative career choices, topping salaries at mid and senior levels, and remaining extremely competitive at junior and C-level. Other top paying roles in advertising are sales, solutions & pre-sales and, at the most senior levels, client services roles.
If we look specifically at the highest levels of seniority, we can see that Client Services Directors and Sales Directors are the top earners - the only two with averages over the £100k mark.
In regard to contracts within advertising, we tend to see a lot more in the way of Fixed Term Contracts (FTC), rather than the traditional day rate, freelance type of contracts used elsewhere. To this end, we do not have a separate page dedicated to contract salaries as with the other sections - FTC uses permanent salaries as a base for remuneration.
0
20000
40000
60000
80000
100000
120000
24,761
61,565
37,915
advertising (£) industry average (£)
Junior Mid-level Senior C-level
102,966
24,319
37,436
60,842
101,553
Graphic: Average sector salaries compared to industry averages (Advertising)

34 | Digital Salary and Industry Insights
Advertising
Campaign delivery
Ad Ops and Campaign Delivery professionals are core requirements of advertising. As such, the very best people can command good salaries at all levels of responsibility. Large salary bands offer a lot of opportunities for professionals to move through the ranks.
Planning & buyingPerhaps surprisingly, salaries in planning and buying at junior and mid-level have very close averages, suggesting the cross over between the two is far narrower than most other skill sets. In contrast, salary averages at senior and C-level are some of the highest - top candidates within this area are clearly sought after by employers.
£35,845
£23,837
C-level
£0k
£62,246
£92,096
Senior
Mid-level
Junior
£10k £20k £30k £40k £50k £60k £70k £80k £90k £100k £110k £120k £130k
£33,786
£23,375
C-level
£0k
£63,833
£89,062
Senior
Mid-level
Junior
£10k £20k £30k £40k £50k £60k £70k £80k £90k £100k £110k £120k £130k

Digital Salary and Industry Insights | 35
Advertising
Biddable
Senior level vacancy remuneration within the Biddable skill set has a wide range, due most likely to the high demand from agencies to employ people who can truly deliver in this field. Other than this, salaries remain as expected throughout all other seniorities.
AnalyticsAs data becomes ever more important to digital functions, analytical people have seen a significant demand for their talents. Our data reflects this with a broad range of salaries in senior and mid-level roles. C-level, on the other hand, remains under represented as this area of expertise still looks to embed itself within organisations at the highest level.
£34,746
£24,607
C-level
£0k
£59,956
£85,000
Senior
Mid-level
Junior
£10k £20k £30k £40k £50k £60k £70k £80k £90k £100k £110k £120k £130k
£33,302
£23,750
C-level
£0k
£60,502
£82,500
Senior
Mid-level
Junior
£10k £20k £30k £40k £50k £60k £70k £80k £90k £100k £110k £120k £130k

36 | Digital Salary and Industry Insights
Advertising
Solutions / Pre-sales
Roles in this field are fairly constant, as displayed by tight salary bands. The only area with any real flexibility is for people moving into mid-level management roles where the bands overlap considerably.
Product managementAnother area of consistent salary data is shown here. The need for product professionals is already very well established within advertising and a steady increase across levels of seniorities was to be expected.
£45,176
£27,250
C-level
£0k
£66,200
£75,000
Senior
Mid-level
Junior
£10k £20k £30k £40k £50k £60k £70k £80k £90k £100k £110k ....... £160k
£45,547
£25,000
C-level
£0k
£66,250
£90,000
Senior
Mid-level
Junior
£10k £20k £30k £40k £50k £60k £70k £80k £90k £100k £110k £120k £130k

Digital Salary and Industry Insights | 37
Advertising
Account management
Clients services and AM professionals are a mainstay of the advertising industry. The last year has witnessed huge competition for the very best talent, as can be seen from the salary data below. The contrast between C-level and senior salaries is distinct, as agencies look to defend their client base in the face of increased competition.
SalesAs expected, sales professionals have numerous opportunities to gain higher remuneration or responsibility in their field. Junior salaries are tight as employers cautiously bring new recruits into the fold, but once you deliver the prospects increase dramatically, with salary bands overlapping each other significantly.
£36,519
£23,612
C-level
£0k
£53,182
£113,545
Senior
Mid-level
Junior
£10k £20k £30k £40k £50k £60k £70k £80k £90k £100k £110k ....... £180k
£43,422
£27,185
C-level
£0k
£70,578
£104,880
Senior
Mid-level
Junior
£10k £20k £30k £40k £50k £60k £70k £80k £90k £100k £110k ....... £160k

38 | Digital Salary and Industry Insights
Advertising
- Intentionally blank -
CreativeServices
Section 4:
The digital industry is aglow with compelling copy, beautifully crafted adverts, intuitive interfaces and all manner of creative brilliance. Here we get to the heart of what drives the more artistic amongst us in relation to career and opportunity.

40 | Digital Salary and Industry Insights
Creative
Creative highlightsThis section of our report looks at the creative services industry and breaks it down by skill set to analyse the salaries available. It also delves into the perceptions of the industry according to the professionals working within it, including how dissatisfied they are, how likely they are to move and more. First though, a few highlights.
More than three quarters of creative employees in their second year of a role are looking to leave.
Employees in their first 2 years in the job are the least satisfied group.
Employees working in creative and UX are the most satisfied in their current job.
Only 37.2% receive a bonus, the lowest percentage across the digital industry.
22% on contract – the highest in the digital industry.
65%
35%
Men Women
9.5%5.5%
32.9%
50.3%
<2526-3536-45
46-5556-65 (1.4%)65+ (0.4%)
7.8%
31.4%
9%
51.7%
JuniorMid-level
SeniorC-level
Key demographicsThe most striking aspect of demographics for creative services is that there is a notable under representation of women. Interestingly, this tallies up with reports we have seen elsewhere concerning the industry, which suggest there are significantly less women in creative roles than men.

Digital Salary and Industry Insights | 41
Creative
Factors driving job change60.7% of respondents working in the creative services industry say they are seeking a workplace change in the year to come. Unlike other industries though, creative services includes a significantly higher volume of men (a staggering 67.8%) looking to move than women (48.9%). This is consistently high across junior, mid-level and senior roles, but sees a large drop at C-level, which is a positive sign.
It also seems that people in creative services look to move fairly quickly from roles too. Well over 50% of people in their second year or more of a role say they will change in the coming year.
Fortunately, bonus has a large impact on desire to move. 52.1% of those who receive one say they would move, compared with 66.9% of those who don’t.
Interestingly, for all this potential movement from creative services professionals, it seems money is not a major issue. This industry has by far the lowest interest in moving for a salary increase (only 21.1% marked this as relevant compared to 27% in marketing and technology and 30% in advertising).
0
10
20
30
40
50
60
Junior Mid-level Senior C-level
50
33.3
8.3
38.8
32.5
52.2
22.519.3
21.7
12.5
20.2
13
be�er opportunity (%) increased salary (%) fresh challenge (%)
Graphic: Most significant factors driving job change (Creative Services)

42 | Digital Salary and Industry Insights
Creative
Women65% satisfied22% very satisfied
30%C-level
Men58% satisfied
17% very satisfied
Junior Mid-level Senior C-level
92% 70% 45% 43%
Junior: 54% satisfied
Mid-level: 64% satisfied
C-level: 74% satisfied
Senior: 55% satisfied
Design
Strategy61%Creative
JOB SATISFACTION by skill
60% of creative respondents are SATISFIED in their roles
25% Junior39% Mid-level
48% Senior74% C-level
MOST SATISFIED LEAST
Importance of COMPANY SUCCESS to job satisfaction
30% dissatisfied / 1-2 years in role
16% dissatisfied / 2-5 years in role
12% dissatisfied / <1 year in role
Importance of CAREER PROGRESSION to job satisfaction
VERY
IMPORTANT
VERYSATISFIED
44%UX 67%
69%

Digital Salary and Industry Insights | 43
Creative
Job satisfactionFor an overview of job satisfaction within creative services, take a look at our infographic to the left. If you would like to compare it to the overall industry, the relevant graphic can be found on page 9.
SalariesSalaries see a deviation from the norm in creative services as C-level roles have a large jump between them and senior (in most other fields there is more of a natural progression). This suggests that getting to the top is a bit of a challenge, but well worth the effort once you get there.
Creative technologist
Before we have a look at the range of creative services salaries, we wanted to highlight a trend in the industry that has become ever more important to many agencies - creative technologists.
We have recently filled a number of these vacancies for our clients and, although early days in regard to any sort of norm, we can deliver some guidance on salary.
Junior roles tend not to be available due to the years of experience required, but mid-level and senior can command anything between £55,000 and £80,000. In regards to C-level positions, our recent placements have been between £100,000 and £150,000.
0
20000
40000
60000
80000
100000
120000
24,761
61,565
37,915
creative (£) industry average (£)
Junior Mid-level Senior C-level
102,966
22,871
36,963
59,966
107,550
Graphic: Average sector salaries compared to industry averages (Creative Services)

44 | Digital Salary and Industry Insights
Creative
Contract rates
The creative services industry is alive with contract or ‘freelance’ workers. Skills possessed by these exceptionally talented individuals are in strong demand, but in many cases they are not required on a permanent basis - often dependant on the project being undertaken. Indeed, teams often work contracts together and move from client to client as a group.
Below, you can see a breakdown of the rates of pay for contractors across seniority levels and through each skill set that makes up part of the creative process.
Skill
Artwork
Design
Creative
Strategy
UX
Project Management
Junior
-
£167
£183
-
£190
-
Mid-level
£293
£261
£260
£343
£350
£276
Senior
£475
£379
£396
£490
£446
£390

Digital Salary and Industry Insights | 45
Creative
Artwork
Artwork has a very structured set of boundaries and rarely deviates from the norm. Moving from one level of seniority to the next can be a challenge, but rewarding when it happens. This is especially so at the most senior levels where some of the highest salaries in the industry are seen.
DesignDesigners are the lifeblood of many a campaign and our data reflects the need for exceptional people at senior levels. Whilst representation at the very highest level is somewhat under represented, senior and mid-level roles show a lot of opportunity for candidates.
£32,375
£21,000
C-level
£0k
£70,000
£125,000
Senior
Mid-level
Junior
£10k £20k £30k £40k £50k £60k £70k £80k £90k £100k £110k £120k £130k
£34,349
£21,258
C-level
£0k
£60,856
£110,500
Senior
Mid-level
Junior
£10k £20k £30k £40k £50k £60k £70k £80k £90k £100k £110k £120k £130k

46 | Digital Salary and Industry Insights
Creative
Creative
The copywriters and art directors of the creative world are seeing quite a lot of crossover between salaries and responsibilities throughout all levels of seniority, apart from the very top level. As content and creative become more central to most businesses, we can see a clear rise in the demand for these skills.
StrategyA small exception to the rest of the industry, strategy roles have quite a large overlap in salaries across the levels of seniority at the top end. Average salaries are higher than their counterparts and the very best strategists can earn in excess of £200k per annum.
£36,344
£25,333
C-level
£0k
£56,539
£103,714
Senior
Mid-level
Junior
£10k £20k £30k £40k £50k £60k £70k £80k £90k £100k £110k £120k £130k
£42,428
£23,500
C-level
£0k
£75,000
£109,476
Senior
Mid-level
Junior
£10k £20k £30k £40k £50k £60k £70k £80k £90k £100k £110k ....... £211k

Digital Salary and Industry Insights | 47
Creative
UX
The last few years have seen an absolute boom in the demand for UX professionals and representation at the very highest level has become the norm - the importance of which is demonstrated by very high average salaries at C-Level.
Project management
With project management often being a hybrid role alongside account management and client services, the higher levels of the role are not represented here. The data we do have from PM dedicated professionals though, suggests a fairly bouyant market for candidates.
£41,632
£24,089
C-level
£0k
£60,983
£120,250
Senior
Mid-level
Junior
£10k £20k £30k £40k £50k £60k £70k £80k £90k £100k £110k ....... £165k
£39,830
£23,643
£0k
£66,233Senior
Mid-level
Junior
£10k £20k £30k £40k £50k £60k £70k £80k £90k £100k £110k £120k £130k
48 | Digital Salary and Industry Insights
Creative
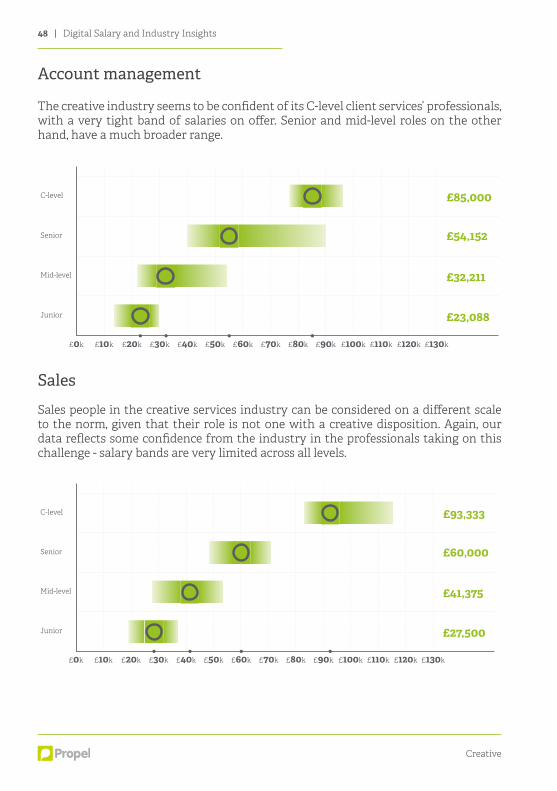
Account management
The creative industry seems to be confident of its C-level client services’ professionals, with a very tight band of salaries on offer. Senior and mid-level roles on the other hand, have a much broader range.
Sales
Sales people in the creative services industry can be considered on a different scale to the norm, given that their role is not one with a creative disposition. Again, our data reflects some confidence from the industry in the professionals taking on this challenge - salary bands are very limited across all levels.
£32,211
£23,088
C-level
£0k
£54,152
£85,000
Senior
Mid-level
Junior
£10k £20k £30k £40k £50k £60k £70k £80k £90k £100k £110k £120k £130k
£41,375
£27,500
C-level
£0k
£60,000
£93,333
Senior
Mid-level
Junior
£10k £20k £30k £40k £50k £60k £70k £80k £90k £100k £110k £120k £130k

Technology
Section 5:
Where would digital be without the technical know-how that makes it all tick? At the core of every aspect of modern business, technology is arguably the most important facet of all. Read on to discover more about this all-important element.

50 | Digital Salary and Industry Insights
Technology
Technology highlightsOur final section focuses on technology and the key trends throughout the field. The following pages break down salary trends, as well as information relating to satisfaction, job movement and more. First though, here are a few highlights to whet your appetite.
Technology respondents have the highest level of workplace satisfaction, and 8 out of 10 feel secure or very secure in their role.
Less than half of technology respondents would change their jobs in the next year - the lowest across the industry.
Far fewer women see themselves still working in technology in 5 years’ time (69.6% compared to 85.3% of men)
Back-end respondents are the most likely to move in the next year
13.2% tech respondents are paid for their overtime work, the highest number across the industry to be paid for their overtime.
89.5%
10.5%
Men Women
10%5.1%
28.3%
56.2%
<2526-3536-45
46-5565+ (0.4%)
6.1%
33.6%
9.7%
50.5%
JuniorMid-level
SeniorC-level
Key demographicsThe obvious issue with technology demographics is the distinct lack of women in roles. Although expected, it underlines the concerns across the industry about this trend. Other than that, we also see a slight under representation of juniors compared with the other three sectors.

Digital Salary and Industry Insights | 51
Technology
Factors driving job changeLess than half of the respondents working in technology would change their jobs in the next year. That makes technology the discipline with the least likely employees to leave in the following 12 months, with 49.7% choosing yes. Of all seniorities, C-level are the least likely to move jobs.
Technology is also the sector with the highest likelihood of people remaining within it in 5 years’ time (83.4% respondents see themselves working in the same field in 5 years).
Great news for the technology industry. Not only is it abuzz with roles and start ups, but it has some of the most motivated and dedicated employees across the whole digital landscape.
Gender split shows that men are far more likely to move than women (51.2% compared to 39.1% women). However, far fewer women see themselves still working in the tech industry in 5 years’ time (69.6% yes compared to 85.3% for men).
Bonus, paid overtime work and time spent in a job clearly impact the desire of looking for other roles. Only 40.2% of respondents who receive a bonus would change jobs compared to 59.8% of those that don’t, while 69% of employees in their second year on the job seek to change roles.
On closer inspection of skills within technology, the data shows that back-end respondents are the most likely to move in the next year - 61.4%.
The main factors driving technology respondents into looking for other jobs are better opportunities (36.6%) and an increased salary (27.3%). A fifth of the respondents are also highly motivated by a fresh challenge, the highest percentage across the whole digital industry.
52 | Digital Salary and Industry Insights
Technology
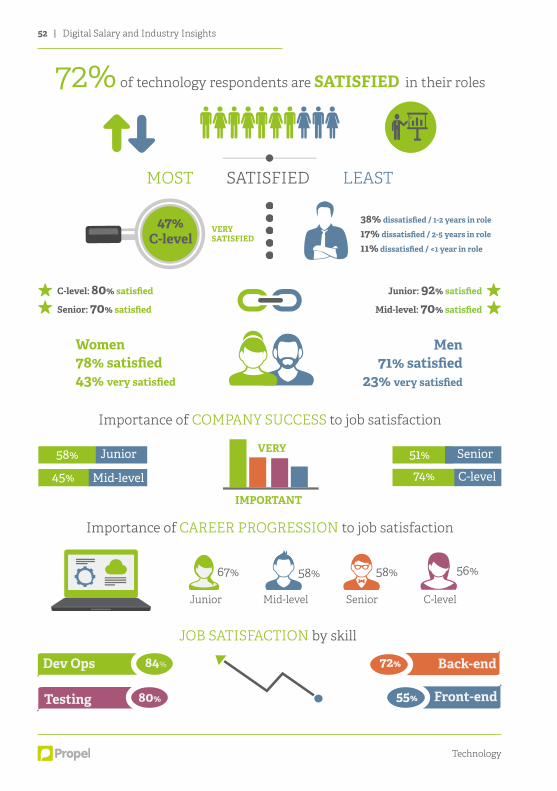
Women78% satisfied43% very satisfied
47%C-level
Men71% satisfied
23% very satisfied
Junior Mid-level Senior C-level
67% 58% 58% 56%
Junior: 92% satisfied
Mid-level: 70% satisfied
C-level: 80% satisfied
Senior: 70% satisfied
Front-end
Back-endDev Ops
Testing
JOB SATISFACTION by skill
72% of technology respondents are SATISFIED in their roles
58% Junior
45% Mid-level
51% Senior
74% C-level
MOST SATISFIED LEAST
Importance of COMPANY SUCCESS to job satisfaction
38% dissatisfied / 1-2 years in role
17% dissatisfied / 2-5 years in role
11% dissatisfied / <1 year in role
Importance of CAREER PROGRESSION to job satisfaction
VERY
IMPORTANT
VERYSATISFIED
72%
55%
84%
80%
Digital Salary and Industry Insights | 53
Technology
Job satisfaction
For an overview of job satisfaction within technology, take a look at our infographic to the left. If you would like to compare it to the overall industry, the relevant graphic can be found on page 9.
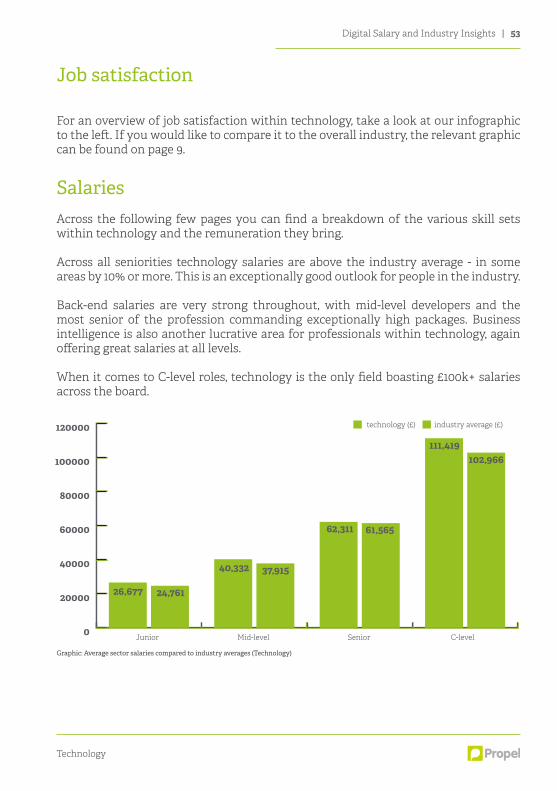
SalariesAcross the following few pages you can find a breakdown of the various skill sets within technology and the remuneration they bring.
Across all seniorities technology salaries are above the industry average - in some areas by 10% or more. This is an exceptionally good outlook for people in the industry.
Back-end salaries are very strong throughout, with mid-level developers and the most senior of the profession commanding exceptionally high packages. Business intelligence is also another lucrative area for professionals within technology, again offering great salaries at all levels.
When it comes to C-level roles, technology is the only field boasting £100k+ salaries across the board.
0
20000
40000
60000
80000
100000
120000
24,761
61,565
37,915
technology (£) industry average (£)
Junior Mid-level Senior C-level
102,966
26,677
40,332
62,311
111,419
Graphic: Average sector salaries compared to industry averages (Technology)

54 | Digital Salary and Industry Insights
Technology
Contract rates
Technology is awash with contractors and employment of this flexible workforce is commonplace amongst businesses. As a result, it has very well established contractor practices. Below are the average day rates for contractors within technology roles.
Skill
Back-end
Front-end
Testing
Dev Ops
Business Intelligence
Data Scientist
Project Management
Junior
£213
£178
£125
£132
-
-
£196
Mid-level
£327
£297
£310
£325
£320
-
£383
Senior
£490
£422
-
£505
£469
£540
£558
Digital Salary and Industry Insights | 55
Technology
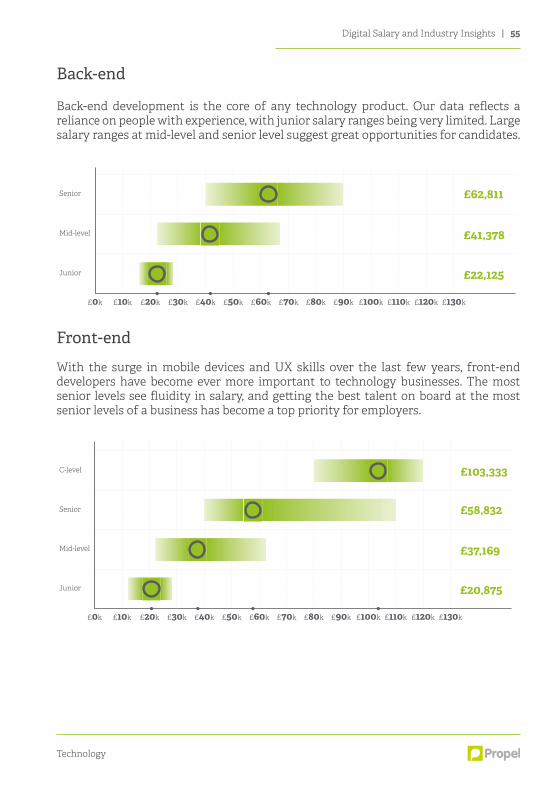
Back-end
Back-end development is the core of any technology product. Our data reflects a reliance on people with experience, with junior salary ranges being very limited. Large salary ranges at mid-level and senior level suggest great opportunities for candidates.
Front-end
With the surge in mobile devices and UX skills over the last few years, front-end developers have become ever more important to technology businesses. The most senior levels see fluidity in salary, and getting the best talent on board at the most senior levels of a business has become a top priority for employers.
£41,378
£22,125
£0k
£62,811Senior
Mid-level
Junior
£10k £20k £30k £40k £50k £60k £70k £80k £90k £100k £110k £120k £130k
£37,169
£20,875
C-level
£0k
£58,832
£103,333
Senior
Mid-level
Junior
£10k £20k £30k £40k £50k £60k £70k £80k £90k £100k £110k £120k £130k

56 | Digital Salary and Industry Insights
Technology
Testing
Testing and assurance is a fairly well organised area of technology. As such, there is no great excitment in salary movements. Mid-level management roles have a higher range, but senior players are very stable and entry to the field is challenging.
Dev ops
Technology is all about consistency, uptime and maintenance. Dev ops has seen a lot of fluidity in salaries recently and employers are trying hard to attract top talent to their senior positions. Senior and C-level salaries are some of the highest in the industry.
£40,607
£29,681
C-level
£0k
£67,108
£108,333
Senior
Mid-level
Junior
£10k £20k £30k £40k £50k £60k £70k £80k £90k £100k £110k £120k £130k
£38,000
£24,486
£0k
£56,250Senior
Mid-level
Junior
£10k £20k £30k £40k £50k £60k £70k £80k £90k £100k £110k £120k £130k

Digital Salary and Industry Insights | 57
Technology
Business intelligence
Business intelligence is a reasonably stable area of the tech industry. Salary ranges remain fairly consistent at most levels, but many companies are now looking to get representation of this skill set at the very top of their organisation - hence the very competitive ranges at C-level.
Data scientistArguably part of business intelligence, data science is a fairly new term coined for big data. Still in its infancy as a stand alone skill, our data reflects a very tight market where only the best will reach the top.
£39,075
£24,667
C-level
£0k
£67,667
£105,107
Senior
Mid-level
Junior
£10k £20k £30k £40k £50k £60k £70k £80k £90k £100k £110k ....... £160k
£47,844
C-level
£0k
£50,000
£100,000
Senior
Mid-level
Junior
£10k £20k £30k £40k £50k £60k £70k £80k £90k £100k £110k £120k £130k
58 | Digital Salary and Industry Insights
Technology
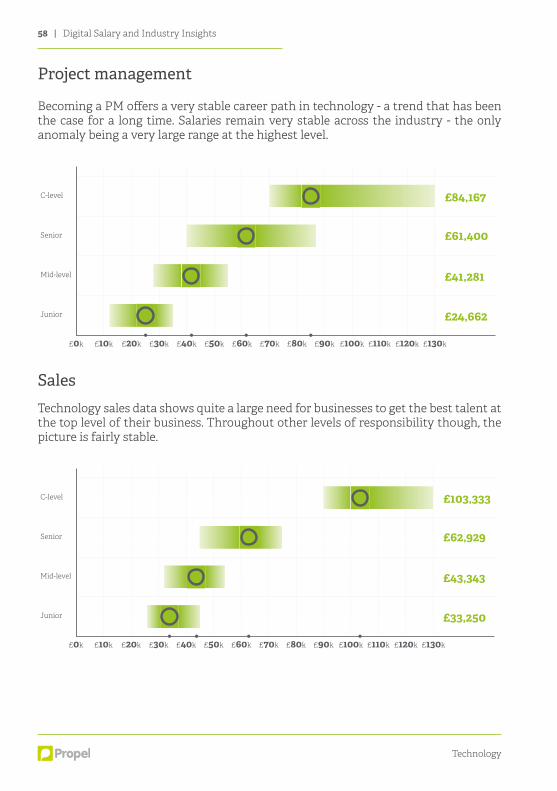
Project management
Becoming a PM offers a very stable career path in technology - a trend that has been the case for a long time. Salaries remain very stable across the industry - the only anomaly being a very large range at the highest level.
SalesTechnology sales data shows quite a large need for businesses to get the best talent at the top level of their business. Throughout other levels of responsibility though, the picture is fairly stable.
£41,281
£24,662
C-level
£0k
£61,400
£84,167
Senior
Mid-level
Junior
£10k £20k £30k £40k £50k £60k £70k £80k £90k £100k £110k £120k £130k
£43,343
£33,250
C-level
£0k
£62,929
£103,333
Senior
Mid-level
Junior
£10k £20k £30k £40k £50k £60k £70k £80k £90k £100k £110k £120k £130k

Digital Salary and Industry Insights | 59
Until next time....Thank you for taking the time to read the fifth edition of our ‘Digital Salary & Industry Insights’ report. We hope you found it useful.
Our report is an annual undertaking produced for the digital talent industry, so we will be back in the future with our sixth edition full of more insight and information.
In the meantime, you can get in touch with any questions or queries you have on 0207 432 6340, or by emailing [email protected].
About PropelPropel are an award winning recruitment consultancy supporting marketing, advertising, creative and technology in the digital world. We offer traditional contingency and executive search recruitment services to organisations within the UK, to organisations looking to settle in the UK and to organisations based overseas.
Our belief is that the digital industry is dependent entirely on the professionals that work within it. Their skills, their imagination and their insight are what makes the UK digital landscape the most exciting in the world.
Our job is to match talented professionals with opportunities from digital employers, be they industry stalwarts or the next big thing. Whether you are in technology, agency, client-side or creative, we are here to help digital people and digital employers build great employment relationships.
Overall, we make talent count.