Digital Matatus: Using Mobile Technology to … Matatus_Using...Chapter Title ACSA ill comlete) 1...
9
Chapter Title (ACSA will complete) 1 Digital Matatus: Using Mobile Technology to Visualize Informality INTRODUCTION Access to data is essenal for generang urban plans for rapidly developing cies in the global south, however it is oſten challenging to acquire. This is because it either does not exist or is ghtly controlled by those in power.[1] However, data does exist—locked away in records of everyday interacons such as cell phones and credit card transacons. My research team, Digital Matatus, set out to test whether it is possible to capture this data by leveraging the ubiquitous nature of mobile technologies in developing countries, to collect data on an essenal infra- structure, and open that data up for anyone to use. The results show that devel - oping strategies that allow the public to interact with data through the creaon of civic tools and visualizaons helps to improve civic life while also helping to generate new planning strategies. Focusing on Nairobi’s semi-formal bus system, or Matatus as they are com- monly known, the project was not only successful in generang data but also in transforming it into tools that could be acquired by civic actors to develop urban change. Distributed using the open data standard GTFS, the local technology community used the data to develop mobile phone routing applications. Non- governmental Organizaons (NGOs) used it to develop Bus Rapid Transit Plans (BRT) plans. The downloadable paper transit map allowed Nairobi’s residents and the government to visualize, for the first me, the comprehensive system that serves their city, which generated a debate about its future amongst the vari - ous stakeholders. The implicaons of the research go beyond Kenya as it shows how we can leverage the power of “Big Data” to generate urban change through active data collection, data sharing and the development of visualizations and civic tools with that data. SARAH WILLIAMS MIT JACQUELINE KLOPP Columbia University DANIEL ORWA & PETER WAIGANJO University of Nairobi ADAM WHITE GROUPSHOT “Big data” will not transform the world unless it is col - lated and synthesized into tools that can activate change. Digital Matatus
Transcript of Digital Matatus: Using Mobile Technology to … Matatus_Using...Chapter Title ACSA ill comlete) 1...

Chapter Title (ACSA will complete) 1
Digital Matatus: Using Mobile Technology to Visualize Informality
INTRODUCTIONAccess to data is essential for generating urban plans for rapidly developing cities in the global south, however it is often challenging to acquire. This is because it either does not exist or is tightly controlled by those in power.[1] However, data does exist—locked away in records of everyday interactions such as cell phones and credit card transactions. My research team, Digital Matatus, set out to test whether it is possible to capture this data by leveraging the ubiquitous nature of mobile technologies in developing countries, to collect data on an essential infra-structure, and open that data up for anyone to use. The results show that devel-oping strategies that allow the public to interact with data through the creation of civic tools and visualizations helps to improve civic life while also helping to generate new planning strategies.
Focusing on Nairobi’s semi-formal bus system, or Matatus as they are com-monly known, the project was not only successful in generating data but also in transforming it into tools that could be acquired by civic actors to develop urban change. Distributed using the open data standard GTFS, the local technology community used the data to develop mobile phone routing applications. Non-governmental Organizations (NGOs) used it to develop Bus Rapid Transit Plans (BRT) plans. The downloadable paper transit map allowed Nairobi’s residents and the government to visualize, for the first time, the comprehensive system that serves their city, which generated a debate about its future amongst the vari-ous stakeholders. The implications of the research go beyond Kenya as it shows how we can leverage the power of “Big Data” to generate urban change through active data collection, data sharing and the development of visualizations and civic tools with that data.
SARAH WILLIAMS
MIT
JACQUELINE KLOPP
Columbia University
DANIEL ORWA & PETER WAIGANJO
University of Nairobi
ADAM WHITE
GROUPSHOT
“ B i g d a t a ” w i l l n o t t r a n s f o r m t h e w o r l d u n l e s s i t i s c o l -
l a t e d a n d s y n t h e s i z e d i n t o t o o l s t h a t c a n a c t i v a t e c h a n g e .
Digital Matatus

2 The Expanding Periphery and the Migrating Center
THE NEEDS FOR DATA IN DEVELOPING COUNTRIESData is essential for developing infrastructure models, and one of the biggest challenges for transportation systems is acquiring data that accurately represents these systems. [2] Data for para-transit or semi-formal bus systems rarely exist. [3] This is particularly true in developing countries and makes it difficult for resi-dents to know how to navigate their city, and, more importantly, makes it difficult for cities to know how to route and manage traffic flows.
Semi-formal transit, including Nairobi’s Matatus, often constitute the backbone of mass transit for the majority of citizens in the rapidly growing cities of Africa, Asia, and Latin America. [4] This is true in Nairobi, where the Matatus system is the main form of transit [5] serving over 3.1 million people in Nairobi metro-politan area on 130 routes. The Matatu system is run by hundreds of privately-owned companies licensed by Nairobi’s City Government. Matatus range from small vans that can hold up to 9-14 passengers to 32-seat vehicles. [6] Matatus often clog the already overstrained roadways and knowledge of the routes and schedules are essential for developing models of traffic flows as they represent a significant portion of the vehicles on the roadway.
Collecting data on semi-formal bus systems is challenging because hundreds of different operators individually set route and schedules. Governments are often unwilling to collect data on these systems as they find them too “chaotic” or do not want to sanction their existence by providing data. [7] Operators of semi-for-mal systems often collect data about the individual routes they provide, but the data is rarely shared with others since the information is primarily used to opti-mize their own business operations.[8] Often in analog form, these data sets are typically incomplete and hard to use for planning proposes.
At the onset of the project, data on Nairobi’s Matatus system was incomplete and difficult to use for planning purposes. The City Council records only identified 90 of the 130 routes. These government files, only noted the start and end loca-tion of the Matatus. Which made it difficult to know how the Matatu navigates the city and where a passenger might be able to find a stop. The research team found a stylized paper based map created in 2010 by Kenya Buzz, a Nairobi-based media company. [9] While informative, the map was no longer publicly available, and the data used to create it was never released. While performing our work we found several incomplete sources of the data collected by private actors; how-ever, none were usable for developing a comprehensive data set. [10]
USING MOBILE TECHNOLOGY TO COLLECT TRANSPORT DATAResearch studies in which cell phone users actively collect data on their mobile devices have greater potential for use in planning urban infrastructure as the collector owns the data and can decide how it will be distributed. Investigations into the geo-locative capabilities of cell phone records to develop data on tran-sit flows have been successful, but acquiring this data from telecommunication companies is extremely difficult because of privacy concerns. [11] Other research projects have used the geo-registration provided by mobile devices to capture transit data on formal systems, but the majority of these projects look at capacity and transit flows. [12] Often used to evaluate existing routes or identify unserved communities they rarely identify the location of transit infrastructure
Few projects use cell phones to capture the route location of the transit infra-structure by asking study participants to crowd source the location of vehicles in real-time on formal transit systems. [13] Some formal transit agencies have
Figure 1: Matatu bus in Nairobi. Matatu operators
develop elaborate designs on their vehicles to
attract customers. Image Credit: Sarah Williams
1

Chapter Title (ACSA will complete) 3
modeled routes by attaching GPS devices to transit vehicles.[14] Several Matatu operators in Nairobi have tested this method. However, the data is limited to the routes they operate, is not consistent, and is rarely shared. [15] Active collec-tion projects have been more successful for planning purposes but have not been applied to semi-formal systems in a comprehensive way, our research project set out to test the ability to collect data for an entirely unmapped system.
THE UBIQUITOUS USE OF CELL PHONES IN NAIROBICell phones are widely used in Nairobi. They provide essential services such as buying products, transferring funds, and providing health education. The devel-opment of these kinds of cell phone applications has exploded in Africa, and Kenya has become a center for some of these developments. [16] One of the biggest exports is the M-Pesa application, which allows users to send cell phone minutes for payment of everything from a cup of coffee to tickets to a movie. M-Pesa was started in 2007 by Safaricom, the local telecommunications network. After two years of operation, M-Pesa had adopted 8.5 million Kenyan users and transferred US $3.7 billion in funds (equivalent to 10 percent of Kenyan’s GDP) through the system. [17] In sub-Saharan Africa, there are ten times as mobile phones as mobile phones and between 2002 and 2007 cell phone subscriptions have increased by 49 percent annually while in Europe the increase has only been 17 percent. [18] Our research project sought to test whether we could leverage the widespread use of cell phones in cities like Nairobi to collect essential data for planning.
COLLECTING THE DATA ON THE MATATU SYSTEM While data collection is still ongoing, the initial process was performed dur-ing 2012-2013 in coordination with our research team, which was comprised of a partnership between the University of Nairobi School of Computing and Informatics, Columbia Universities Earth Institute, and Groupshot. The pro-cess involved identifying the current routes; developing technology to collect
Figure 2: Image of Universtiy of Nairobi student
collecting data on a Matatu.
Image Credit : Adam White
Digital Matatus
2

4 The Expanding Periphery and the Migrating Center
geo-registered data on routes and stops; translating the data in the General Transit Feed Specification (GTFS); developing unique numeric identifiers neces-sary for the specification; validating the data with the local transit community; and ultimately openly releasing the data by posting it on the GTFS Exchange.
Working with our team at the University of Nairobi, we tested and modified various mobile applications for data collection. Tool development was based in Nairobi to ensure that the technology would work on local mobile devices and cell networks and would remain a local resource. The team modified an open source mobile application to perform the data collection, developing a unique interface. [19] The application allowed University of Nairobi students riding the Matatus to collect latitude and longitude data trails of the Matatu routes. When the Matatus made a stop, they used the mobile tool to mark the stop and gener-ate a unique identifier for use in the GTFS data protocol. Students collected the data by riding the Matatus, but in some of the more dangerous areas in Nairobi they followed the Matatus in a private car.
Once collected, the route data was translated into the GTFS data specification. This specification was chosen to help facilitate the development of mobile appli-cations since many open-source transit applications already use this data speci-fication as their base. The GTFS data specification was developed in 2005 by Portland’s Tri-Met transit agency in partnership with Google. [20] This format is now widely used by transit agencies across the world to openly share their data and is the basis for transit routing directions provided by Google Maps. The open-ness with which GTFS data is distributed has encouraged its use for transit appli-cations beyond trip planning by creating tools to improve transit operations and planning overall. [21] Once transformed into this common standard, the data was
MOMBASA ROAD
THIKA R
OAD
LANGATA R
OAD
BOMA ROAD
KIA
MB
U R
OA
D
WAIYAKI WAY
OUTER RING ROAD
KANGUNDO ROAD
MOMBASA ROAD
NGONG ROAD
JUJA ROAD
JOGOO ROAD
ARWINGS KODHEK RD
EAST
ERN
BYP
ASS
NORTHERN BYPASS
LIMURU ROAD
KIAMBU ROAD
RUIRU KAMITI ROAD
LOWER KABETE ROAD
DAGORETTI ROAD NGONG ROAD
SOUTHERN BYPASS
MAGADI R
OAD
KIAMBU ROAD
20
118
11910
3
107
106
116
116
11F
11A
116
108
100
120
121
121
120
44
4549
44
25
43
115
25A
25A
49
145
45
42
42
31
103
38/39
14
45
4344
4618
C
14
3218C
106107
116
32146
18C
17A
3132
31 18C
3132
36
23
10
5836
6
2336 58
69
19C
19C218
C
19C
34B
34B
17A
33
33
33PM33F
34
33F
3333F
33F
70/71 3433F
34
11
33
12C
33
12D
12C
12D
33F
33PM
405
14B
16
1512
6
125
14A16
3424C
2433
328
7C32
15 34
125
126
126
2411
1
24C
24C
111
126
4W
2102
2
1
102
105
115
105
30 115105 1053023 48
46
48 48B
48A
4848
B
48B
48A
115
119
118
48C
20
239
129
119
118
11B
11
120
103
17A
33F 33PJ 33PM70/71
33PJ33PM
33PM
23
26
26
3433F
33PJ 33PM
33
3914
539
145
33
107D
107D107D
25A25
2222
4514
5
145
145
49
36
10
36
26
145
17B
24
2020
22
17B
17B 17B
17B
44
1960
110KIT110ATH
110KIT110ATH
KARURA FOREST
NGONG ROAD FOREST
NAIROBI NATIONAL PARK
CITY PARK
GIGIRI FOREST
BOMAS OFKENYA
JKIA
WILSONAIRPORT
UHURUPARK
MUTHAIGAHURUMA
KIAMBU
BLUE SKY/T-MALL
NAKUMATTJUNCTION
KITENGELA
ATHIRIVER
KANGEMI
BEE CENTRE
KOMAROCKSROUNDABOUT
SAIKA
DONHOLM
KAYOLE
JACARANDA
TOTAL PETROL
BURUBURUMARINGO
KARIOBANGI SOUTH
GENERALMOTORS
CALTEX
KARIOBANGI N
FEDHA ESTATE GATE A / EMBAKASI
PIPELINE
AIRPORT
KISERIAN
GITHUNGURI
BOMAS INTERCHANGE/NAKUMATT GALLERIA
CITY STADIUM
CABANAS
IMARA DAIMA
HAZINA
SOUTH B/MCHUMBI RDNYAYO
NAIROBI HOSPITAL
NGUMO STAGE
NGUMO/KENYATTA MKT
STRATHMORE
NGONG
KAREN
GASOLINA/GICHAGI
KARURA
BANANA TERMINUS
HIGH RIDGE
REDHILL
KWAHERI
NDUMBERI
RUIRU TOWN
GITHURAI
KENYATTA UNIVERSITY
CAR WASH/ZIMMERMAN ESTATE
KAHAWA WEST
SUNTON
MWIKI
NGUMBA
KARIOBANGIROUNDABOUT
BABA NDOGO
LUCKY SUMMER
ALLSOPSDANDORA
WESTLANDS/SANKARA
WANGIGE
KWA NGWACII
KIKUYU
DAGORETTIKABERIA
KREP EQUITY
KAWANGWARE
UTHIRU
ABC PLACE
STRATHMORE SCHOOL
CHIROMO
VALLEY ARCADE
LAVINGTON
GITANGA
AYANI / KIBERIA
ST MARY’S HOSPITAL
HIGHWAY ESTATE
SOUTH C
MATHARE NORTH
CALTEXJOSTER
RIKANA
EASTLEIGH
NAKUMATTPRESTIGE
THIKA TOWN
YAYACENTRE
ONGATARONGAI
LIMURU
UTAWALAJUNCTION
RUAI
RUAKA
BYPASS
UMOJA
NJIRU
MASIMBA
KWA CHIEF
CIVIL SERVANTS
GIRAFFE CENTER
KARENBLIXENMUSEUM
UoN
KNH
UN
REDHILL ROAD
MATER HOSPITAL
UTAWALA
RUAIBYPASS
NDUMBUINI
ROYSAMBU/KASARANI
DONHOLM
MAMA LUCYCITY
CENTER
Route
Stop Terminus
Outbound From City Center
Inbound To City Center
Junction
46
Kawangware
46
Yaya
19C
Komarocks
34B
Jacaranda
1960
Kayole
1961C
Kayole
1961CK
KayoleCaltex
12C
South C
12D
KPA
33
Utawala**
110ATH
Athiriver
110KIT
Kitengela
7C
KNH
8
Kiberia
24
Karen
24C
Hardy
32
Ayani
33
Ngumo
111
Ngong
4W
Kaberia2
Dagoretti
102
Kikuyu
25A
Lucky Summer
43
Ngumba
44
Kahawa West
145
Ruiru Town
45
Githurai
49
Sunton
29/30
Mathare N
25
Baba Ndogo
119
Wangige
103
WangigeNakumatt
11B
Banana
118
Wangige
**33 lines also to Fedha, Imara Daima, Highway, South
37383738
33PJ
Pipeline Jogoo
34
JKIA
70/71
Lunga Lunga
33PM
Pipeline Mombasa
33F
Fedha Estate
3738
11F
Ruaka
106
Banana
107
Ndenderu
116
Limuru
11A
Highridge
120
Githunuri
121
Ndumberi
100
Kiambu
14
Kariobangi N
17A
KayoleRoundabout
17AKY
KayoleEastleigh
18C
EastleighKomarocks Roundabout
31
DandoraGikomba
32
Dandora
46
Huruma***
3738
RuaiRoundabout
6
Eastleigh
F lin
eH
line
J lin
eG
line
I lin
e
14B
Deep West
15
Langata
16
Highrise
34
KenyattaNairobi Hospital
125
Rongai
126
Kiserian
14A
Strathmore
48A
Lavington
48B
Othaya
48
Othaya
33
Ngumo South B
Z lin
e
1
DagorettiKaren
MwikiMama Lucy
20
6
JosterRikana
42
DandoraAllsops
405
NyayoCity Stadium
48
KawangareWestlands
69
GMCity Stadium48C
YayaWestlands
24
Bomas Dagoretti
129
KikuyuWangige
108
GasolinaRedhill
11
Hazina
239
ThikaRuiru
110AK
KitengelaAthiriver
36 33 48B48B
L lin
eK
line
O li
neP
line
M li
neN
line
115
Limuru105
Kikuyu30
Uthiru23
Kangemi22
UthiruChiromo
10
Maringo
23
Kariobangi S
36
DandoraCity Stadium
58
Buruburu
26
Kariobangi N
B li
neA
line
C li
neD
line
E lin
e
Umoja
35/60
38/39
Ruai
38/39KomarocksUmoja/Donholm
19C2
17B
MwikiMuthurwa
107D
MaruruiRuaka
*44 lines also to Mwiki, Sunton,Zimmerman,and Githurai***36 line also to Kariobangi Roundabout
17B
Mwiki
Terminus City Center
Data developed through a research collaboration between the Civic Data Design Lab, MIT; Center for Sustainable Urban Development, Columbia University; School of Computing and Informatics, University of Nairobi; Groupshot. Research funded by the Rockefeller Foundation.
NAIROBI MATATU ROUTES
Data Collected by:University of Nairobi School of Computing and InformaticsPaper Maps Illustrated by:Wenfei Xu and Sarah Williams (Civic Data Design Lab)
24
29/3029/30
17Aky
17A
ky
17Aky
1960
1960
1961
K
1961
CK
1960
1961
K
17Aky
35/60
38/39
19C2
38/39
110ATH110KIT11
0AK
17Aky
38/3
919
C2
FOR FEEDBACK & MORE INFORMATION:http://www.digitalmatatus.comBeta Release : Created January 23, 20143
Figure 3: Front of the official Matatu map of Nairobi
developed by the project team.
Image Credit : Sarah Williams and Wenfei Xu

Chapter Title (ACSA will complete) 5
uploaded to the GTFS exchange, a common repository for openly sharing GTFS data; anyone can use the site to download the data our team created for Nairobi.[22]
One of the biggest challenges of the project was modifying the GTFS specifica-tion to semi-formal transit since it was initially developed for more formalized systems with less chaotic scheduling and fare changes. However, storing the data in GTFS proved beneficial as it allowed the local technology community to eas-ily generate mobile applications as detailed information was provided for the protocol.
VISUALIZING THE DATA: PUTTING THE MATATU SYSTEM ON THE MAPThe GTFS data, when plotted in the map in its raw form, was too complex to read. The mess of latitude and longitude points representing overlapping routes and stops was hard to comprehend. Order was given to this complex network using the visual language of traditional subway maps seen in Paris, London, and New York. The map structured the Matatu data, and the visual cues provided by the style of organized transit systems made map readers contextualize Nairobi’s Matatus as one organized system.
Maps are powerful as they can expose a system or idea by clearly representing it, thereby giving it a form of legitimacy .[23] Nairobi’s Matatus mostly follow the few main road corridors heading out of the city’s center with routes splitting off onto smaller tributaries as they move away from the city. In the map, each cor-ridor’s routes were grouped and color coded, as seen on more formal transit sys-tem. Identifying major stops and points of interest including parks, airports, and landmarks allowed users to position themselves on the visualization.
4649
46
19C19C
58
35/6019C
7 33PM
33F19
C58
44
7464
6
33
33PM
11
33PJ
1023
26
49
25A
25
45
44
4349
48A
46
48B
48
107
34
106
106 10711F11
6
19C34B
100
120
121
466
11F
11A
116
11B
118
116 25
A
256
46
119
118B1
130
115
1516
32
100
120
121
33
4544
43
24
14
8
102
4W
2
111
126
125
24C
14B
14A
12D
12C
3214
105
23
35/60
38/39
19601961K
29/30
110K
IT
1110
ATH
29/30
TUK
Uon Main Campus
NairobiRailway
UhuruPark
Wakulima Market
Pangani PoliceStation
STIM
A
GIK
OM
BA
MURANG'A ROAD
KENYATTA
AVE
MOI
AVE
HAILE SELASSIE AVE
UHURU HIGHWAY
Parliament
Holy FamilyBasilica
KICC
Supreme CourtCity
Hall
Way
CityHall
Jogoo House
Ministry of ForeignAffairs
Office of the President
SheriaHouse
Intercontinental
32
7C
24C
4646
Harambee
Ave
Lifestyle
33
33
33
Wakulima Rd
LANDHIES ROAD
DR
GNI
R 100
120
121
4544
43
1960
1961
K
3214
DR ES
RU
OCE
CA
R
PANGANI
KARIOKORROUNDABOUT
KOJA
OTC
RAILWAYS
ODEON
BUS STATION
33F
1069
33PJ70/71
MUTHURWAFACTORY ST
NGARA
119
LIM
UR
U R
OA
D
11ATERMINAL
14
43
44
45
TOM MBOYA ST
33F
33PM
MAIN STAGE
7
7
46
KINYANJUI ST
PUMWANI RD
KENCOM
AMBASSADEUR
625
A52
03/92
29/30
191
FORREST ROAD
NairobiGymkhana
JamuhuriHigh School
Pangani GirlsSecondary School
New Ngara Hawkers Market
KahamaHotelNairobi
Murang’a RdPrimarySchool
River BankPrimary School
Ngara SecondarySchool
Ngara RdRing Rd
Park
Rd
MuslimAcademy
Nairobi TechnicalTrainingInstitute
JUJA RD
Hombe Rd
46
17B
145
145
58
36
STIM
A
17B
17B
17B
17B
MATATU STATION LIST CITY CENTRE
110ATH
38/39
14 32
25A2532
35/605836
31
23
19C 34B48
18C17Aky633F33
10869
48A
33PM33F110KIT110ATH
48B
3331
46
1960
1961CK1961K 33F 33PJ 33PM 34 70/71
29/3034
110ATH
15 34 125 126
43
2433 33D 33F 33PM
44
1961K19C 34B 1960
26 3658
23 105 11530111
231034 70/71
24C241024W211610710611F11A
34
14
6 46
36
125 126 2433 14B 15 16 34 125 126 24 24C
1062325 25A32
116
23
44
10
38/39
45
120100116107106
34
424945
11F
110KIT
118
49
11B
125 12658
19C
14B 15 16 125 126
110KIT110ATH12C 12D 33
37/38
2
33F 33PM5849 463346
4W
110ATH
196019C 1961CK
1961CK
34B 1961K
196019C 34B 1961K
45
102 8 24 24C
44
32 111
31 3236
49
422 1
11610710611F11A6 46
44
4614
4325A
35/60 58 19C 33F33PM
25
110KIT
44 45 14 3243121120100
19C 18C
46
19C2
37/38313623 37/38323118C 42
145
32 4618C17Aky17A26
49454443196034B19C38/3935/605836
145
3433PM33PJ33F11
12D494544
46
19C
46323118C17Aky
11
17A141113224C2481024W2
331961K196034B19C
64W
43 441113224C248
116105
2 4W 102
304544
115105302318C17Aky17A1960
24111124C24421426
1961CK
48A
19C2 38/39
25A115116
125 126 24C
24C1261253415
48 48A 48B 23 30 105 115
18C1022103
11A103129115105121120100116
24126
7
1253415
11B119 11A 25A25 49
126126
145
105 129 102
120 1214516 34 24 24C 3325 25A 29/30 43 44 45 49
1960 1961K 17A 17Aky
46 4244 49
118
1267 33F 33PM 58
33
32
25A
17Aky
25A
26
4929/3025A25
25121120100116
126110ATH33
125
33
12D
16
24C
15
38/39
33F14A
37/38
16
12611143
33243433
2014B 40533PM 110KIT12C
11911811B
1960 1961K
10
24C29/3019C2
11911811B11610710611F
25A4443 4945
70/7133PJ69102644
111333224C248 7C16119
11124C241024W2103
1113224C2481024W2120
494544121
33PM
29/30
33PJ33F33D
2017Aky17A34B19C1124 111
145
116 100 120 121
44 49
14537/38
116107106
4544 49
6120 121100116
33F 33PM33PJ
33PM
33F 33PJ
7 4544
145
1961K
1960
11818C
48A
12C
118
14A
45
1146
19C
44
34B
118
36
15
10
44
25
34
119
12D337C49
25A
11937/38
30
17A120
125
49
48
119
3629/30
119
32
38/39
17Aky
121
105
126
5843
24C
35/60
4438/39
115 48
4519C
23
1960
48B4846
11911811B48126
129
115125
119
10534
11811930
48C
15
46
23
46
118103
2317A 17Aky 19C2 38/39 20
38/3935/6019C21961K196034B19C
11F 106 107 116
2
3325
48
3033
25A4W48A
10539
29/3010248B
1151454324
23
103
4424C
30
45111
105
49
115
34B
38/39 39 14533
19C 34B 1960 1961K
35/60 38/39
4345
44100 120 121
494544
7
145 237
110AK
22
145
4945444329/3025A25 6
24 24C
110KIT110ATH
24C23 105 1153022
69 405
23 105 1153022
145
48
1961K
145
145145
107D
22
2219C
4242
17B 17A145
33
33
24C
24
48
145145145
17B
17B
341024W2
145145145
145145145
145145145
110ATH
26 36
121145145145
46321433 33D 33F 33PM33PJ33
14A
10811611F 107106116 120100 121
116 120100 121106
14522
30 105 115 48232211610710611F11A29/30
2623
14526
1961K
24
33
35/60
22
145
22
11F 106 107 116
24C2414B 16
Donholm / Caltex
GitangaGikombaGeneral Motors
EastleighDrive In
Deloitte
DaystarDandora
DagorettiCorner Stone AcademyChoaka
Clayworks
City StadiumChiromoCarnivoreCarbanasCar Wash / Zimmerman
Fedha Estate Gate A
BuruburuBrookhouse School
Bomas Interchange/Blue Sky / T-MallBanana TerminusBahati
Baba Dogo
Bus Station / Railways
ABCAdamsAga Khan HospitalAirportAirport JunctionAllsops
AyanyAmbassadeur / Kencom
Athiriver
GithuraiGreenfield EstateGreenspan Mall
EastleighGasolina / Gichagi
Nakumatt Galleria
Kariobangi S
Kariokor Roundabout
Komarocks Roundabout
Kariobangi RoundaboutKariobangi N
GSUHamza
HazinaHighway Estate
HomelandHurlingham
HurumaUchumi - Hyper / iHubImara DaimaJacarandaJosterKaberiaKabeteKahawa WendaniKahawa WestKangemi
KanisaniKaren
Terminal / Main Stage
Traffic Police HQTotal PetrolThindigwa
Uchumi Hyper Langata Rd
Uchumi
St MarksStimaStrathmoreStrathmore School
SuntonSukari / Kwale
Runda
Spring Valley Police StaSpring ValleySouth CSouth B/Mchumbi RdSerenaSeasonsSaritSaikaSafaricomSafari Park
Ruiru Town
Uchumi / Nairobi West
UmojaUhuru
Umoja / Donholm
UoN Chiromo CampusUoN Science CampusUtaliiUtawalaUthiru
Yaya Centre
Wilson AirportWestlandsWestgateWangigeVillage MarketValley Road
UN
RuaiRuaka
Roysambu / KasaraniRock City
Rikana
Valley Estate
Kitengela
Lavington
Lucky SummerMama Lucy
Limuru
Langata Cemetary /Kenya Wildlife Service
Langata Police Station
Langata BarracksKwaheri
Kwa NgwaciiHigh RidgeKrep EquityKomarocks Roundabout
Koja / Odeon
Kiserain
Kasarani PoliceKawangwareKayole
KCAKNHKenyatta University
KiambuKikuyu
Ongata RongaiOTC
Muthaiga (2)
NjiruNgumo/Kenyatta MktNgumo Stage
NgumbaNgong
Nyayo
Ngara
Masimba / Bee CentreMaringo
Mater HospitalMeteorological HQ
Mathare NorthMowlemMuseumMuthaiga (1)
Muthaiga Police Station
MuthurwaMutindwa
MwikiMwimutoNairobi Hospital
NaivasNakumatt JunctionNakumatt Prestige
NdumberiNew Naivas
Pangani
PipelineRedhillRidgeways
Ridgeways
Umoja
20
20
20
4
Figure 4: Back of the official Matatu map of Nairobi
developed by the project team. This image shows
the location matrix which allowed users to more
easily find the route they needed.
Image Credit : Sarah Williams and Wenfei Xu
Digital Matatus
6 The Expanding Periphery and the Migrating Center
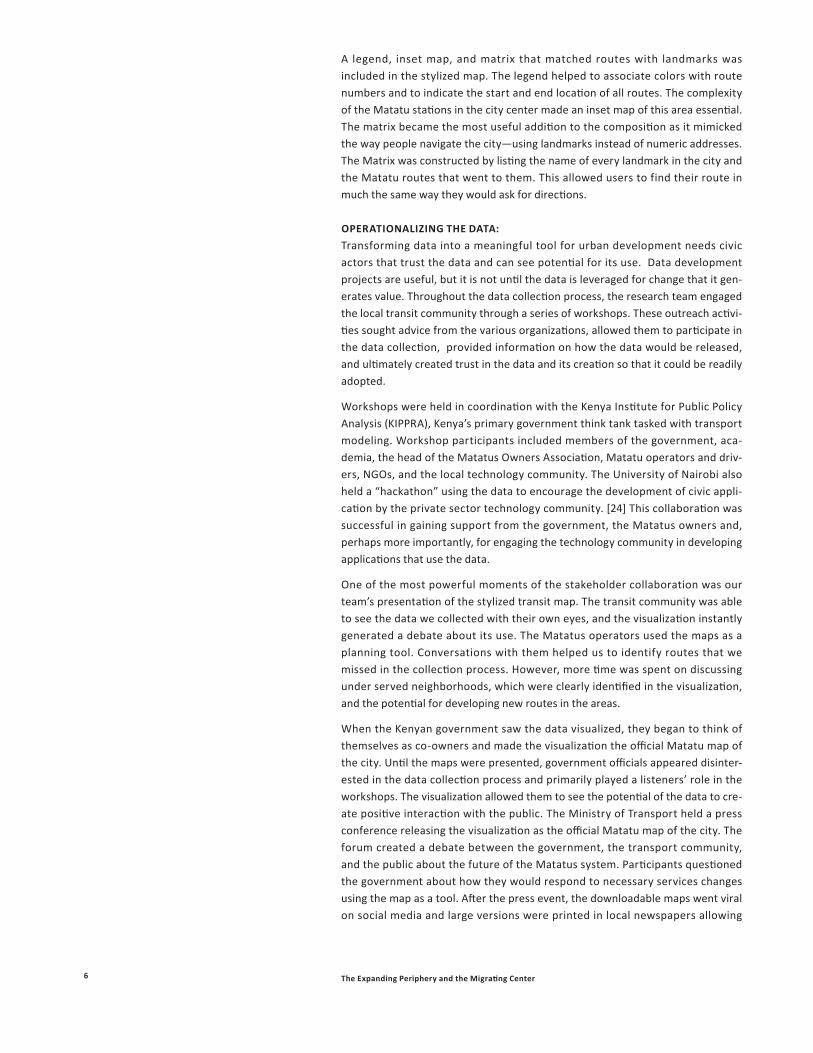
A legend, inset map, and matrix that matched routes with landmarks was included in the stylized map. The legend helped to associate colors with route numbers and to indicate the start and end location of all routes. The complexity of the Matatu stations in the city center made an inset map of this area essential. The matrix became the most useful addition to the composition as it mimicked the way people navigate the city—using landmarks instead of numeric addresses. The Matrix was constructed by listing the name of every landmark in the city and the Matatu routes that went to them. This allowed users to find their route in much the same way they would ask for directions.
OPERATIONALIZING THE DATA: Transforming data into a meaningful tool for urban development needs civic actors that trust the data and can see potential for its use. Data development projects are useful, but it is not until the data is leveraged for change that it gen-erates value. Throughout the data collection process, the research team engaged the local transit community through a series of workshops. These outreach activi-ties sought advice from the various organizations, allowed them to participate in the data collection, provided information on how the data would be released, and ultimately created trust in the data and its creation so that it could be readily adopted.
Workshops were held in coordination with the Kenya Institute for Public Policy Analysis (KIPPRA), Kenya’s primary government think tank tasked with transport modeling. Workshop participants included members of the government, aca-demia, the head of the Matatus Owners Association, Matatu operators and driv-ers, NGOs, and the local technology community. The University of Nairobi also held a “hackathon” using the data to encourage the development of civic appli-cation by the private sector technology community. [24] This collaboration was successful in gaining support from the government, the Matatus owners and, perhaps more importantly, for engaging the technology community in developing applications that use the data.
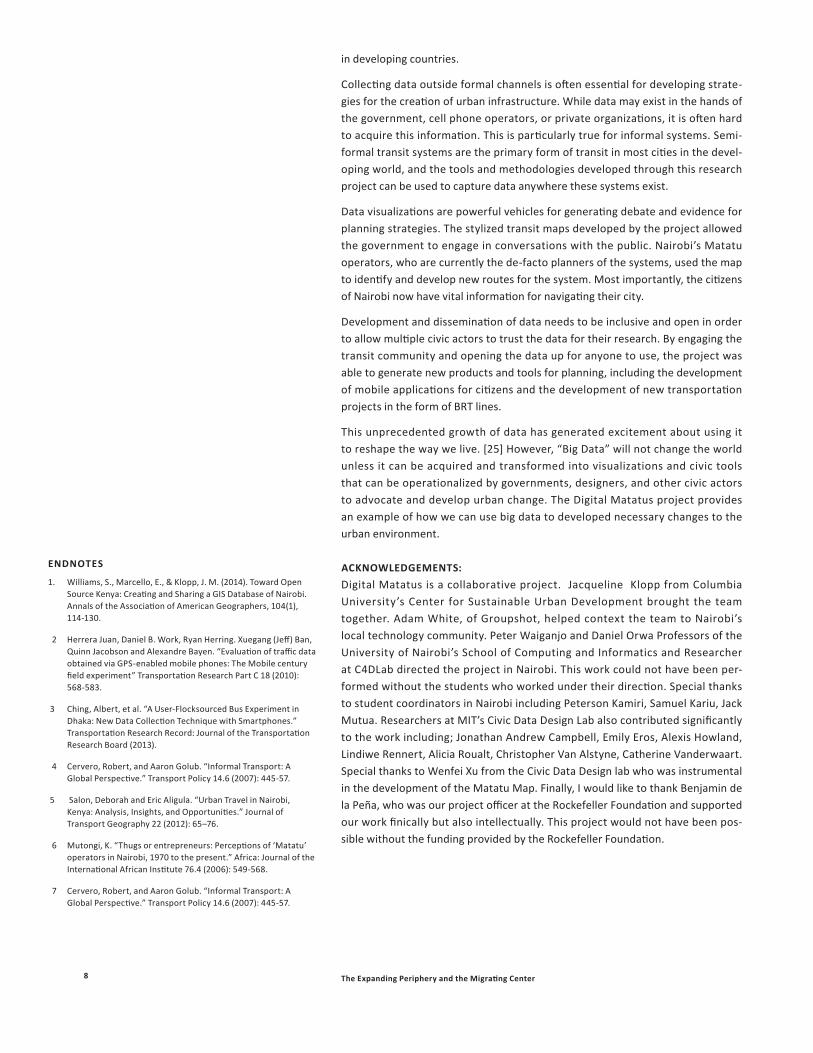
One of the most powerful moments of the stakeholder collaboration was our team’s presentation of the stylized transit map. The transit community was able to see the data we collected with their own eyes, and the visualization instantly generated a debate about its use. The Matatus operators used the maps as a planning tool. Conversations with them helped us to identify routes that we missed in the collection process. However, more time was spent on discussing under served neighborhoods, which were clearly identified in the visualization, and the potential for developing new routes in the areas.
When the Kenyan government saw the data visualized, they began to think of themselves as co-owners and made the visualization the official Matatu map of the city. Until the maps were presented, government officials appeared disinter-ested in the data collection process and primarily played a listeners’ role in the workshops. The visualization allowed them to see the potential of the data to cre-ate positive interaction with the public. The Ministry of Transport held a press conference releasing the visualization as the official Matatu map of the city. The forum created a debate between the government, the transport community, and the public about the future of the Matatus system. Participants questioned the government about how they would respond to necessary services changes using the map as a tool. After the press event, the downloadable maps went viral on social media and large versions were printed in local newspapers allowing
Chapter Title (ACSA will complete) 7
everyone to access the data we created.
The local technology community saw the potential of the data before it was visu-alized and developed two mobile applications using the data before the map was officially released. Laban Okune developed Ma3Route, a mobile app that pro-vided routing information using the data as a base. The tool allows users to share real-time, crowd-sourced data about Matatu route changes, accidents, and traffic congestion. Ma3Route is widely used in Nairobi and won the Kenya’s Vision 2030 ICT Innovation award in April of 2014. Sonar is another routing application devel-oped by Jeremy Gordon of Flashcast.
UN-Habitat/Institute for Transportation and Development Policy (ITDP) used the data as the basis for creating the Bus Rapid Transit (BRT) Service Plans for the city. The data allowed them to identify the location of existing routes along potential BRT service lines proposed for the Thika highway corridor. It also allowed them to identify the location of overlapping routes, showing the potential for other BRT lines in the city.
The conversations generated during the engagement process allowed stakehold-ers to come together, edit the data, and generate a debate on how the data could be leveraged to create change in the city. These conversations were essential for operationalizing the data to develop important changes to an infrastructure most citizens depend upon.
GIVING MEANING TO DATALeveraging “big data” to develop informed urban strategies often needs active data collection, data sharing, and ultimately the synthesis of data into visualiza-tions and civic tools. The Digital Matatus project shows that anyone can leverage mobile technology to capture hard-to-find data, transform that data into repre-sentations that can expose informal systems, and use the data and its visualiza-tions to help develop conversations for the future of infrastructure development
5
Figure 5: Identify locations for new Matatu routes
with transit stakeholders in Nairobi.
Image Credit : Adam White
Digital Matatus
8 The Expanding Periphery and the Migrating Center
in developing countries.
Collecting data outside formal channels is often essential for developing strate-gies for the creation of urban infrastructure. While data may exist in the hands of the government, cell phone operators, or private organizations, it is often hard to acquire this information. This is particularly true for informal systems. Semi-formal transit systems are the primary form of transit in most cities in the devel-oping world, and the tools and methodologies developed through this research project can be used to capture data anywhere these systems exist.
Data visualizations are powerful vehicles for generating debate and evidence for planning strategies. The stylized transit maps developed by the project allowed the government to engage in conversations with the public. Nairobi’s Matatu operators, who are currently the de-facto planners of the systems, used the map to identify and develop new routes for the system. Most importantly, the citizens of Nairobi now have vital information for navigating their city.
Development and dissemination of data needs to be inclusive and open in order to allow multiple civic actors to trust the data for their research. By engaging the transit community and opening the data up for anyone to use, the project was able to generate new products and tools for planning, including the development of mobile applications for citizens and the development of new transportation projects in the form of BRT lines.
This unprecedented growth of data has generated excitement about using it to reshape the way we live. [25] However, “Big Data” will not change the world unless it can be acquired and transformed into visualizations and civic tools that can be operationalized by governments, designers, and other civic actors to advocate and develop urban change. The Digital Matatus project provides an example of how we can use big data to developed necessary changes to the urban environment.
ACKNOWLEDGEMENTS:Digital Matatus is a collaborative project. Jacqueline Klopp from Columbia University’s Center for Sustainable Urban Development brought the team together. Adam White, of Groupshot, helped context the team to Nairobi’s local technology community. Peter Waiganjo and Daniel Orwa Professors of the University of Nairobi’s School of Computing and Informatics and Researcher at C4DLab directed the project in Nairobi. This work could not have been per-formed without the students who worked under their direction. Special thanks to student coordinators in Nairobi including Peterson Kamiri, Samuel Kariu, Jack Mutua. Researchers at MIT’s Civic Data Design Lab also contributed significantly to the work including; Jonathan Andrew Campbell, Emily Eros, Alexis Howland, Lindiwe Rennert, Alicia Roualt, Christopher Van Alstyne, Catherine Vanderwaart. Special thanks to Wenfei Xu from the Civic Data Design lab who was instrumental in the development of the Matatu Map. Finally, I would like to thank Benjamin de la Peña, who was our project officer at the Rockefeller Foundation and supported our work finically but also intellectually. This project would not have been pos-sible without the funding provided by the Rockefeller Foundation.
ENDNOTES
1. Williams, S., Marcello, E., & Klopp, J. M. (2014). Toward Open Source Kenya: Creating and Sharing a GIS Database of Nairobi. Annals of the Association of American Geographers, 104(1), 114-130.
2 Herrera Juan, Daniel B. Work, Ryan Herring. Xuegang (Jeff) Ban, Quinn Jacobson and Alexandre Bayen. “Evaluation of traffic data obtained via GPS-enabled mobile phones: The Mobile century field experiment” Transportation Research Part C 18 (2010): 568-583.
3 Ching, Albert, et al. “A User-Flocksourced Bus Experiment in Dhaka: New Data Collection Technique with Smartphones.” Transportation Research Record: Journal of the Transportation Research Board (2013).
4 Cervero, Robert, and Aaron Golub. “Informal Transport: A Global Perspective.” Transport Policy 14.6 (2007): 445-57.
5 Salon, Deborah and Eric Aligula. “Urban Travel in Nairobi, Kenya: Analysis, Insights, and Opportunities.” Journal of Transport Geography 22 (2012): 65–76.
6 Mutongi, K. “Thugs or entrepreneurs: Perceptions of ‘Matatu’ operators in Nairobi, 1970 to the present.” Africa: Journal of the International African Institute 76.4 (2006): 549-568.
7 Cervero, Robert, and Aaron Golub. “Informal Transport: A Global Perspective.” Transport Policy 14.6 (2007): 445-57.

Chapter Title (ACSA will complete) 9
Kemei, K. (2014) ‘Move on night transport won’t end accidents, Says Former TLB Chairman
Hassan Kamwaro’ East African Standard January 3, 2014. Retrieved from: <http://www.standardmedia.co.ke/?articleID=2000101376&story_title=kamwaro-move-on-night-transport-won-t-end-accidents>
8 Eros, Emily Jean. Transportation data as disruptive innovation in Mexico City. Diss. Massachusetts Institute of Technology, 2014.
9 Last Accessed 10/9/2014 (http://www.globalpost.com/dispatch/kenya/100127/kenyas-wild-matatus-captured-map)
10 The “Living in Nairobi” blog published a highly stylized route map in 2012 after we had begun our work, but they also did not publish any of the data collected to create the map, and have not maintained the map. (Last Accessed 10/9/2014 (http://www.jambonairobi.co.ke/services/public-transport/nairobi-route-maps/nairobi-matatu-route-map-eastlands/)
Panga Safari, formally Matatus Online, developed a private matatu route database that covered parts of the city, but did not include standardized routing information or consistent stop documentation, making it difficult to upgrade this data to a stan-dardized format such as GTFS. The database has been expanded, and can be searched through a web interface, but the back-end data was never made public. Last Accessed 10/9/2014 (http://www.matatuonline.com/)
11 Ratti, Carlo, Dennis Frenchman, Riccardo Maria Pulselli, and Sarah Williams. “Mobile Landscapes: Using Location Data from Cell Phones for Urban Analysis” Environment and Planning B 33.5 (2006): 727-748.
Gonzalez, Marta C., Cesar A. Hidalgo, and Albert-Laszlo Barabasi. “Understanding individual human mobility patterns.” Nature 453.7196 (2008): 779-782.
Caceres, Noelia, et al. “Traffic flow estimation models using cellular phone data.” Intelligent Transportation Systems, IEEE Transactions on 13.3 (2012): 1430-1441.
Talbot, David. “African Bus Routes Redrawn Using Cell-Phone Data” MIT Technology Review 30 April (2013) Web. 6 October 6 2014. <http://www.technologyreview.com/news/514211/african-bus-routes-redrawn-using-cell-phone-data/>
Wakefield, Jane. “Mobile Phone Data Redraws Bus Routes in Africa.” BBC 30 Apr. 2013. Web. 30 Sept. 2014. <http://www.bbc.com/news/technology-22357748>.
12 Caceres, Noelia, et al. “Traffic flow estimation models using cellular phone data.” Intelligent Transportation Systems, IEEE Transactions on 13.3 (2012): 1430-1441.
Herrera Juan, Daniel B. Work, Ryan Herring. Xuegang (Jeff) Ban, Quinn Jacobson and Alexandre Bayen. “Evaluation of traffic data obtained via GPS-enabled mobile phones: The Mobile century field experiment” Transportation Research Part C 18 (2010): 568-583.
Wang F. Calabrese, G. Di Lorenzo, and C. Ratti. “Transportation mode inference from anonymized and aggregated mobile phone call detail records”. In Proc. 13th Int. IEEE Conf. Intelligent Transportation Syst. (ITSC 2010), Madeira Island, Portugal, Sep 19-22, (2010): 318-323.
13 Thiagarajan, Arvind, et al. “Cooperative transit tracking using smart-phones.” Proceedings of the 8th ACM Conference on Embedded Networked Sensor Systems. ACM (2010).
14 Farzin, Janine M. “Constructing an automated bus origin-desti-nation matrix using farecard and global positioning system data in Sao Paulo, Brazil.” Transportation Research Record: Journal of the Transportation Research Board 2072.1 (2008): 30-37.
15 Interviews with Matau drivers.
16 Aker, Jenny, and Isaac Mbiti. “Mobile Phones and Economic Development in Africa.” Journal of Economic Perspectives 24.3 (2010): 207-232.
17 Safaricom. Industry Update.12 March 2009. Web. 5 Oct. 2014. http://www.safaricom.co.ke/fileadmin/template/main/down-loads/investor_relations_pdf/Industry%20Update%20120309.pdf
Mbiti, Isaac, and David N. Weil. “Mobile banking: The impact of M-Pesa in Kenya.” National Bureau of Economic Research No. 17129 (2011).
18 UITP (International Association of Public Transport). Public Transport in Sub-Saharan Africa. Trans-Africa Consortium. (2010)
19 We tested the accuracy of this tool with standard GPS units. Towards the end of the study, we tested the application Transit Wand, which had greater accuracy but the data was harder to work with after it was collected. Modifications to Transit Wand, might make it a better resources for the project. We are currently working toward creating a new tool for data collecting that modifies this open source resource.
20 McHugh, Bibiana. “Pioneering Open Data Standards: The GTFS Story.” in Beyond Transparency: Open Data and the Future of Civic Innovation Edited by Brett Goldstein with Lauren Dyson: (2013).
21 Catala, Martin. 2011. Expanding the Google Transit Feed Specification to Support Operations and Planning. Retrieved from: <http://www.dot.state.fl.us/research-center/Completed_Proj/Summary_PTO/FDOT_BDK85_977-15_rpt.pdf>
Lee-Gosselin, Martin and Ron N. Buliung. “The role of ICTs in the transformation and the experience of travel” Transportation 39 (2012): 873–876.
22 We developed several tools to transform the data into GTFS. They are not detailed here as they are very technical in nature including information about the use of a unique coding struc-ture we developed for the data itself.
23 Kitchin, Rob, and Martin Dodge. “Rethinking maps.” Progress in Human Geography 31.3 (2007): 331-344.
24 These workshops should not be confused with collaborative design workshops, rather they asked the key stakeholder to be active participants in the data collection process.
25 Boyd, D., & Crawford, K. (2012). Critical questions for big data: Provocations for a cultural, technological, and scholarly phenomenon. Information, Communication & Society, 15(5), 662-679.
Digital Matatus