Digital Library - A test of the effects of linguistic …/67531/metadc3605/m2/...Trowell, Melody, A...
54
APPROVED: Patricia Cukor-Avila, Major Professor Shobhana Chelliah, Committee Member Jenifer Larson-Hall, Committee Member David Holdeman, Chair of the Department of English Sandra L. Terrell, Dean of the Robert B. Toulouse School of Graduate Studies A TEST OF THE EFFECTS OF LINGUISTIC STEREOTYPES IN CHILDREN’S ANIMATED FILM: A LANGUAGE ATTITUDE STUDY Melody Trowell Thesis Prepared for the Degree of MASTER OF ARTS UNIVERSITY OF NORTH TEXAS May 2007
Transcript of Digital Library - A test of the effects of linguistic …/67531/metadc3605/m2/...Trowell, Melody, A...

APPROVED:
Patricia Cukor-Avila, Major Professor Shobhana Chelliah, Committee Member Jenifer Larson-Hall, Committee Member David Holdeman, Chair of the Department of
English Sandra L. Terrell, Dean of the Robert B. Toulouse
School of Graduate Studies
A TEST OF THE EFFECTS OF LINGUISTIC STEREOTYPES IN CHILDREN’S
ANIMATED FILM: A LANGUAGE ATTITUDE STUDY
Melody Trowell
Thesis Prepared for the Degree of
MASTER OF ARTS
UNIVERSITY OF NORTH TEXAS
May 2007

Trowell, Melody, A test of the effects of linguistic stereotypes in children’s animated
film: A language attitude study. Master of Arts (Linguistics), May 2007, 47 pp., 4 tables, 11
figures, references, 38 titles.
This study examined the claim that animated films influence childrens’ opinions of
accented-English. Two hundred and eighteen 3rd
through 5th
graders participated in a web-based
survey. They listened to speakers with various accents: Mainstream US English (MUSE),
African American Vernacular English (AAVE), French, British, and Arabic. Respondents judged
speakers’ personality traits (Work Ethic, Wealth, Attitude, Intelligence), assigned jobs/life
positions, and provided personal information, movie watching habits, and exposure to foreign
languages. Results indicate: (1) MUSE ranks higher and AAVE lower than other speakers, (2)
jobs/life positions do not correlate with animated films, (3) movie watching habits correlate with
AAVE, French, and British ratings, (4) foreign language exposure correlates with French,
British, and Arabic ratings.

ii
Copyright 2007
by
Melody Trowell
iii
ACKNOWLEDGMENTS
I would like to thank my advisory committee for their hard work and for giving so
generously of their time during this project. I would like to acknowledge Dr. Patricia Cukor-
Avila and thank her for introducing me sociolinguistics. It has opened up an entire world for me,
and I appreciate all she did to assist me in the entire process. I also thank Dr. Jenifer Larson-Hall
for assisting me with the statistics portion of my results in my current study. I would like to
extend my gratitude to Dr. Shobhana Chelliah for her assistance in the reading and revising
process of this paper.
Of course, many thanks must be given to my wonderful friend Brent Wiethoff without
whom this project would still be in process. He not only helped me obtain the SPSS program to
use for my data analyses, but, more importantly, he also did the graphic design of my web-based
survey voluntarily. I cannot thank him enough for being willing to take on this project and
produce such a fantastically fun website in only three days. His gifts of design and friendship are
truly amazing.
And, last but not least, I must thank my family and friends for their tremendous support
the entire two years of my graduate studies. Without them, I would not be as strong as I am
today. Mom and Dad, Noël, Kay and David, Jeff and Elaine and the kiddos, Sally, and Randy
(precious husband of mine), thank you for your words of encouragement, support, advice, love,
and prayers. Blessings to you all.

iv
TABLE OF CONTENTS
Page
ACKNOWLEDGMENTS………………………………………………………………..………iii
LIST OF TABLES…………………………………………………….………………..…….…...v
LIST OF FIGURES……………………………………………………………………………....vi
INTRODUCTION………………………………………………………………………………...1
PREVIOUS RESEARCH……………………………………………………………………...….5
METHODOLOGY……………………………………………………………………………....18
RESULTS………………………………………………………………………………….…….27
DISCUSSION……………………………………………………………………………….…...35
LIMITATIONS AND SUMMARY……………………………….……………………….……37
APPENDIX…………………………………………………………………………………..…..40
REFERENCES……………………………………………………………………………….….46

v
LIST OF TABLES
Table Page
1. Accents in the animated films in the current study…………….……………………………22
2. Respondents' preferences with 3 as most desirable…………..……………………………..27
3. Results of group difference tests for personality trait scales …..…...………………………28
4. Frequency of jobs or life positions respondents selected for speakers……………………...30

vi
LIST OF FIGURES
Figure Page
1. Lippi-Green’s language subordination model (1997, p. 68)……………………………………6
2. Accent usage in Lippi-Green's 1997 study…………………………………..………………..12
3. Pandey’s cline of directives (1997, p. 113)……………………………………………………14
4. Graphic on screen at beginning of survey………………………………….………………….18
5. Graphic on screen during the practice question………………………..….…………………..19
6. Graphic on screen between each section of the survey………………………………………..19
7. Graphic on screen to choose speakers…………………………………….…………………..20
8. Graphic on screen during questions about speakers………………………..…………………21
9. Speakers’ reading passage………………………………………………….…………………22
10. Graphic on screen at end of survey……………………………………….……………..…...23
11. Graphic on screen during preferences section………………………….………………..…..27
1
INTRODUCTION
The purpose of this study is to investigate Lippi-Green’s (1997) claim that “animated
films entertain, but they are also a way to teach children to associate specific characteristics and
life styles with specific social groups, by means of language variation” (p. 85). This study draws
on background studies of research on communication and entertainment media as well as
language attitudes and discrimination.
From the moment we meet someone, we have an impression of that person. We think,
“He looks smart” or “They seem nice” or even “She must be from Texas.” We form opinions
about people’s personality, intellect, and even background based on how we view them
according to their clothes, body shape, hairstyle—things we can see. But, what about the things
we cannot see, like language? Though we may not be aware of it, how people sound to us affects
our attitude toward them. Cargile, Giles, Ryan, and Bradac (1994) discuss language and attitude
as a social process.
Language is a powerful social force that does more than convey intended referential information. Our views of others—their supposed capabilities, beliefs, and attributes—are determined, in part, by inferences we make from the language features they adopt. In addition, some important decisions that govern our prospects and social welfare are also shaped by language performance. (p. 211)
For example, Boberg’s (1999) study showed differences in respondents’ attitudes toward
American and British pronunciations of the phoneme /a/ (e.g., pronouncing “last” as either
American [læst] or British [last]). He found that his respondents often assigned levels of
education, social status, and degree of friendliness to speakers according to the way the
respondents perceived their sound.
Linguistic impressions even affect us through technology, like music, news casts, and
film. Parents and teachers are not the only sources of information, education, and guidance

2
anymore. Before seeing how these media affect their audiences, let us briefly investigate the
amount of exposure.
Research by Roberts and Foehr (2004) found that nine out of ten U.S. households have
two or more television sets with 61% including three or more, and about half of all the children
in their study had a television in their bedrooms. They also discovered that the television
exposure (amount of viewing) only increased with age. Much of the increasing exposure
contained what Roberts and Foehr call “screen exposure,” which includes children’s movies and
animated films. None of Roberts and Foehr’s data go into any further detail as to precisely what
type of children’s entertainment programming (other than comedy, action, or drama and mention
of film-viewing) the children in their study were watching. Nevertheless, children’s
entertainment programming tops the charts as the most-watched genre.
The communication and entertainment media covertly teach their audiences in areas of
fashion, music, and even influence changes in attitude and behavior. As we hear and view
communication and entertainment media (i.e., films, news casts, newspaper reports, music, video
games) we do not merely receive facts or entertainment. Based on how these media filter their
information, they also influence our attitudes. For example, some studies that tested attitude
effects of video games found increasing violent behavior in children (Cicchirillo & Chory-Assad,
2005; Huesmann & Taylor, 2006; Kirsh et al., 2005). Similar studies about music have also
found psychological and attitude changes in listeners (Barongan & Hall, 1995; Hallam et al.,
2002; Nantais & Schellenberg, 1999; Västfjäll et al., 2002; Winchkel et al., 2004). Therefore,
whether viewed as positive or negative, communication and entertainment media appear to have
an ulterior, intrinsic influence. Cortés (2000) even goes so far as to suggest that such media have
begun to teach learned behavior.

3
The idea that communication and entertainment media form generalizations about
diversity and then repeatedly target those that they generalize leads us to the question for the
current study: “Does this happen in animated film?” This question forms the focus of the current
study as described in the methodology section. However, first it is necessary to explore the
“function of selectivity and frequency” (Cortés, 2000) of the media that leads to the formation of
stereotypes.
Cortés (2000) claims these media possess the following three characteristics:
1. Although some may deny it, mediamakers recognize that consumers learn multicuturally from the media.
2. Although they may proclaim their innocence, mediamakers realize that some of this media-based multicultural learning takes the form of internalizing stereotypes.
3. Although they may not always recognize it, mediamakers sometimes draw upon those stereotypes in order to meet what they feel are consumer expectations, and in some cases (as common in advertising) they manipulate those stereotypes to provoke desired reactions. (pp. 154-155)
With the above mind, we can then ask, “When does the communication and entertainment
media’s treatment of a group and its members become the embodiment of a group profile?”
Cortés’ (2000) four-stage progressive model of media influence on an audience (summarized
below) provides an answer.
1. Reality
This stage suggests that there is a small portion of reality in what the media depict. For example,
some white men are unable to dunk (e.g., Billy Hoyle in White Men Can’t Jump), and some
Italians are mobsters (e.g., Don Vito Corleone in The Godfather).
2. Seminal Treatment
This is the stage of “trend setting” in which the media draw on those aspects of reality to
establish a model for future depictions (e.g., The Godfather films depict Italian-Americans as
mobsters).

4
3. Widespread Imitation
During this stage, other media pick up on stage two depictions and repeat them (e.g., Goodfellas,
Carlito’s Way, and The Sopranos TV series all with Italian mobsters).
4. Humor, Parody, and Caricature
This last stage occurs when the media realize which characteristics of certain social groups create
the desired effect for entertainment purposes (e.g., comic relief characters often have African
American vernacular English (AAVE) accents, such as Donkey in Shrek). It is this fourth stage
and its “caricature” in relation to animated film that is of particular interest to the current study.
Pandey (1997), Lippi-Green (1997), and Cargile et al. (1994) represent just some of the
research which suggests that with linguistic “trendsetting” entertainment media also establishes
standards, some of which may not accurately portray reality. In order to fully understand the way
entertainment media discriminate, it is necessary to first discover the ways in which our society
discriminates based on linguistic features.
5
PREVIOUS RESEARCH
The focus of the current study is on accent discrimination in animated films. Therefore, in
order to understand just how powerful accent discrimination is in animated films, it is necessary
to first explore how and why people discriminate based on language.
People who speak English as a second language (ESL) have been regarded by some as
disabled (Montgomery, 1999). All too often, children speaking ESL in schools have been put
into special education classes (Hall, 1997) or told by their teachers that their English was
incorrect. Due to employers’ negative perceptions and opinions about certain accents and
varieties of English, foreign accented English speakers have been fired (Lippi-Green, 1994) and
regionally accented English speakers have been judged unsuitable for some jobs (Markley,
2000). The term that has recently been associated with this kind of behavior is “linguistic
profiling” (Baugh, 2000). Baugh suggests that linguistic profiling occurs according to the
following:
Whereas RACIAL PROFILING is based on visual cues that result in the confirmation of or in speculation concerning the racial background of an individual or individuals, LINGUISTIC PROFILING is based upon auditory cues that may be used to identify an individual orindividuals as belonging to a linguistic subgroup within a given speech community, including a racial subgroup. (p. 363)
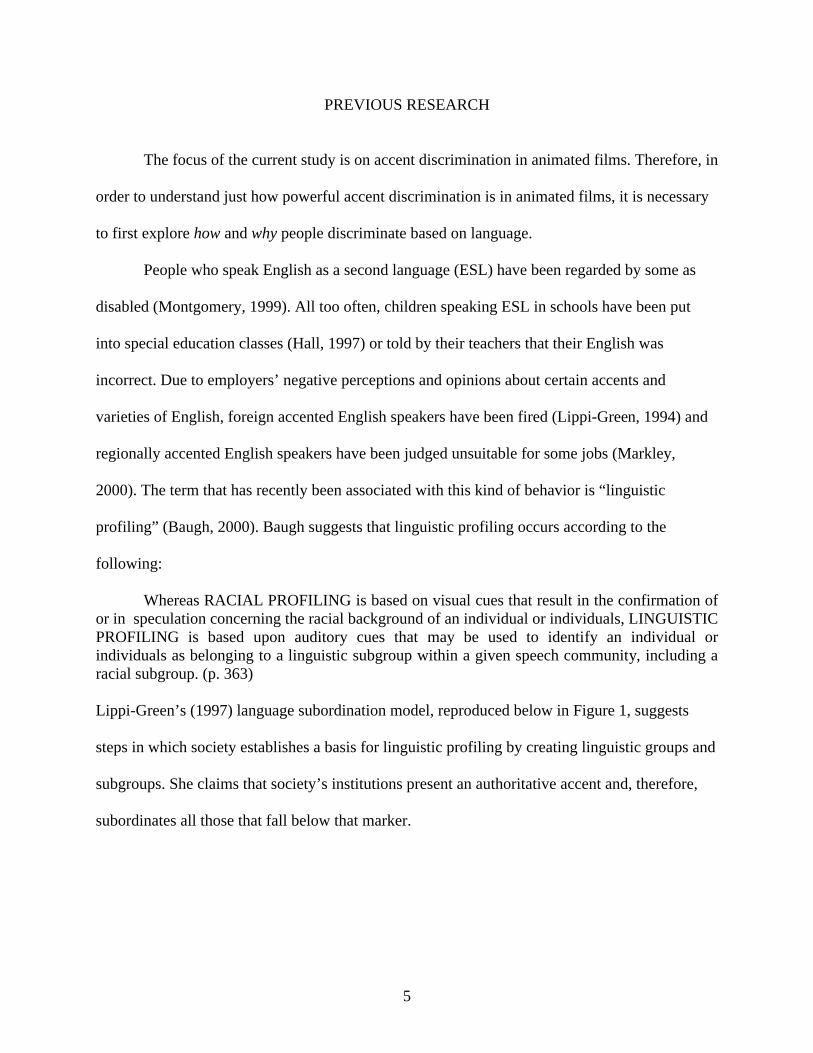
Lippi-Green’s (1997) language subordination model, reproduced below in Figure 1, suggests
steps in which society establishes a basis for linguistic profiling by creating linguistic groups and
subgroups. She claims that society’s institutions present an authoritative accent and, therefore,
subordinates all those that fall below that marker.

6
Figure 1. Lippi-Green’s language subordination model (1997, p. 68).
Lippi-Green’s model suggests a progressive subordination. It begins with a claim that
language is too complex, even for native speakers. Following, is the establishment of “standards”
in language. Lippi-Green suggests that the authorities claiming the “standards” of language are
the educational system, broadcast and print media, the entertainment industry, the corporate
sector, and the judicial system, all of whom claim knowledge of language and look to each other
for validation of this knowledge. Third, the authorities give misinformation in the form of
“commonsense argumentation” as in the statement “Pidgin can be cured!” (p. 68). Lippi-Green
suggests that the misinformation “comes from ignorance of structural and functional facts about
language” (p. 68). Fourth, languages that go against the “standards” are considered “non-
mainstream” and are talked about in a humorous and trivial sense. Fifth, those that conform to
the “standards” are praised for holding up the “ideal of national standard” (p. 69). Sixth and
seventh, promises and threats are made. Those that conform receive promises of success, which
Language is mystifiedYou can never hope to comprehend the difficulties and complexities of your mother tongue without expert guidance.
Authority is claimedTalk like me/us. We know what we are doing because we have studied language, because we write well.
Misinformation is generatedThat usage you are so attached to is inaccurate. The variant I prefer is superior on historical, aesthetic, or logical grounds.
Non-mainstream language is trivializedLook how cute, how homey, how funny.
Conformers are held up as positive examplesSee what you can accomplish if you only try, how far you can get if you see the light.
Explicit promises are madeEmployers will take you seriously; doors open.
Threats are madeNo one important will take you seriously; doors will close.
Non-conformers are vilified or marginalizedSee how willfully stupid, arrogant, unknowing, uninformed, and/or deviant and unrepresentative these speakers are.

7
is also used as motivation for those who have not yet conformed. These promises are more
implied. The “authorities” more openly make threats to the “non-conformers” by saying that
“resistance is utterly useless” and claiming that they “will be cut off from privileges and rights of
citizenship if they won’t even acknowledge the superiority of the mainstream and/or refuse the
commonsense argument” (p. 69). Finally, the authorities’ “encouragement” turns into personal
attacks on the non-conforming people as groups in order to vilify and/or marginalize their
language. Thus, linguistically profiled groups are formed.
Lippi-Green and other scholars believe that much of the discrimination comes from
within a community itself. “Comparison with one’s own in-group often results in negative
attitudes and unfavorable comparison of outsiders” (Bresnahan, Ohashi, Nebashi, Liu, &
Shearman, 2002). Research by Giles, Baker, and Fielding (1975) suggests that such perceptions
held by the speaker and listener even affect the duration of communication (i.e., how long or
short a time people choose to speak with and/or about someone). In their study, they had
respondents listen to British-English speakers with received pronunciation (RP), the highest in
prestige, and other regional varieties. The respondents then wrote and voiced comments to and
about each speaker. The results showed longer and more detailed comments directed towards the
RP speakers. Giles, Baker, and Fielding (1975) suggest that the respondents have an affiliation or
desired affiliation with that particular linguistically profiled group because of their desire to
speak more with and about the RP speakers than the regional variety speakers.
In order to see how language subordination works in society, it is necessary to look at the
civil rights laws in the USA. We will see that the declaration of a law does not necessarily
protect everything it needs to in practice.
Title VII of the U.S. Civil Rights Act states that one cannot discriminate based on race,
skin color, sex, age, and national origin. But, what about language? Lippi-Green (1994) suggests

8
that language should be more specifically protected against discrimination under Title VII, but it
is not. In fact, the only linguistic aspect included is that no one may be discriminated against
because of language linked to their national origin (Lippi-Green, 1994). However, foreign accent
is often not protected under this law in practice. For example, in 1981, a librarian whose native
language was Marathi was fired from her job because of her “heavy accent, speech patterns, and
grammar problems.” The court ruled in favor of the employee but later reversed the decision in
the U.S. Court of Appeals (as cited in Lippi-Green, 1994, p. 164). Also, regionally accented
English is not protected, as in the case of Williams v. Frank (1992). In this case, a discharged
African American postal clerk claimed his employer treated the white employees differently
from him. He also said his co-workers, including supervisors, mocked him because of his
Southern accent. The court denied the plaintiffs claim of discrimination stating that “Southerness
is not a protected trait.”
Over four decades of research on language attitudes suggests that people can and do
determine someone’s personality traits and competency based on accent and judge them
accordingly (see Arslen & Hansen, 1996; Cargile & Giles, 1998; Fraser, 1973; Lindemann,
2005; Markley, 2000; Podberesky, Deluty, & Feldstein, 1990; Preston, 1996; Purnell, Idsardi, &
Baugh, 1999). These studies confirm the inequalities of accented-Englishes. Here are a few
specific examples.
Markley’s (2000) study involved employers and regional US accented-English speakers.
Employer respondents rated the speakers’ personality traits (e.g., intelligence, friendliness,
charm) on a scale of 1 to 7, with 7 being most positive. They then assigned jobs to the speakers
according to perceived technical and/or social ability (i.e., high and low tech; high and low
contact jobs). Markley’s results are summarized as follows:
Respondents reacted differently towards each speaker.
9
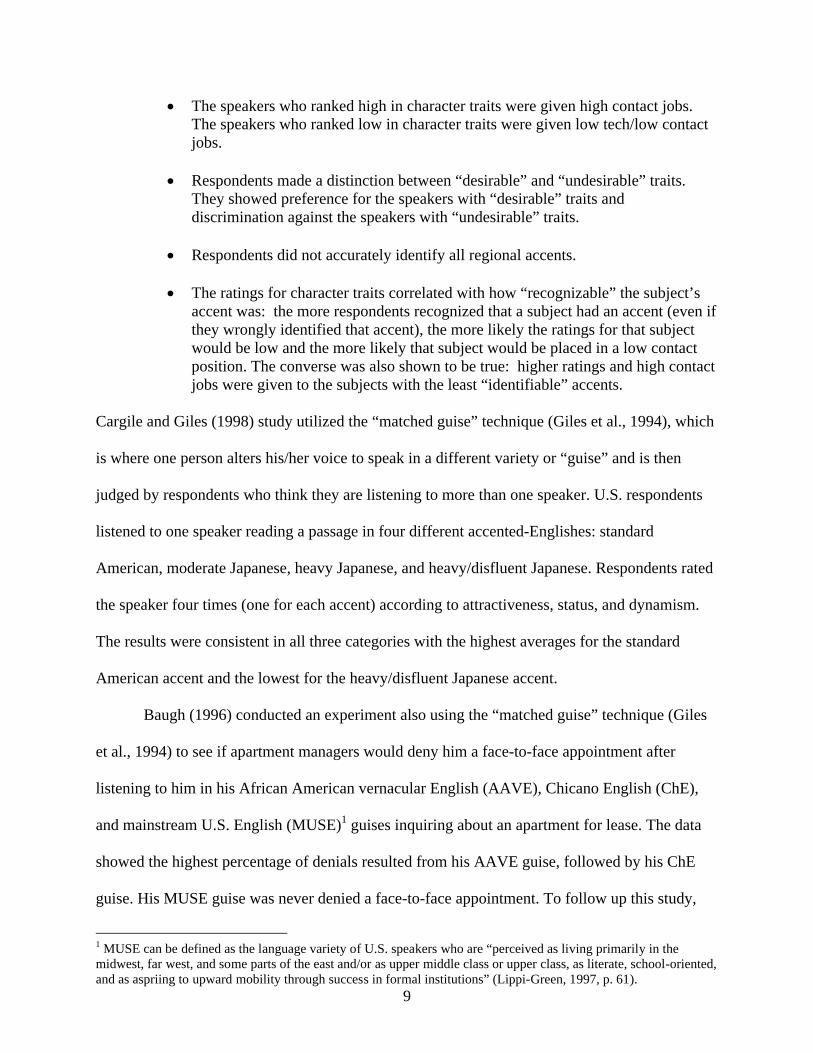
The speakers who ranked high in character traits were given high contact jobs. The speakers who ranked low in character traits were given low tech/low contact jobs.
Respondents made a distinction between “desirable” and “undesirable” traits. They showed preference for the speakers with “desirable” traits and discrimination against the speakers with “undesirable” traits.
Respondents did not accurately identify all regional accents.
The ratings for character traits correlated with how “recognizable” the subject’s accent was: the more respondents recognized that a subject had an accent (even if they wrongly identified that accent), the more likely the ratings for that subject would be low and the more likely that subject would be placed in a low contact position. The converse was also shown to be true: higher ratings and high contact jobs were given to the subjects with the least “identifiable” accents.
Cargile and Giles (1998) study utilized the “matched guise” technique (Giles et al., 1994), which
is where one person alters his/her voice to speak in a different variety or “guise” and is then
judged by respondents who think they are listening to more than one speaker. U.S. respondents
listened to one speaker reading a passage in four different accented-Englishes: standard
American, moderate Japanese, heavy Japanese, and heavy/disfluent Japanese. Respondents rated
the speaker four times (one for each accent) according to attractiveness, status, and dynamism.
The results were consistent in all three categories with the highest averages for the standard
American accent and the lowest for the heavy/disfluent Japanese accent.
Baugh (1996) conducted an experiment also using the “matched guise” technique (Giles
et al., 1994) to see if apartment managers would deny him a face-to-face appointment after
listening to him in his African American vernacular English (AAVE), Chicano English (ChE),
and mainstream U.S. English (MUSE)1 guises inquiring about an apartment for lease. The data
showed the highest percentage of denials resulted from his AAVE guise, followed by his ChE
guise. His MUSE guise was never denied a face-to-face appointment. To follow up this study,
1 MUSE can be defined as the language variety of U.S. speakers who are “perceived as living primarily in the midwest, far west, and some parts of the east and/or as upper middle class or upper class, as literate, school-oriented, and as aspriing to upward mobility through success in formal institutions” (Lippi-Green, 1997, p. 61).

10
Purnell et al. (1999) investigated how much speech it would take for people to make their
judgment. They found that respondents were able to form their opinions about the subjects after
hearing only the first word, in this case “hello,” of the test passage. Their results support Lippi-
Green’s (1994) assertion that “Prejudiced listeners cannot hear what a person has to say, because
accent, as a mirror of social identity and a litmus test for exclusion, is more important” (p. 166).
The current study further investigates the idea that our attitudes about a person’s character and
abilities are influenced by their speech. However, the present focus is on the formation of these
attitudes in children due to the presence of linguistic stereotypes in animated film. Thus, this
study will test to determine if children transfer these linguistic stereotypes from ahimated
character to reality.
Tillman (1986) suggests that visual media instills images in our minds that we refer back
to. Because the visual representation also contains an auditory element, we are also able to
associate a particular sound with a particular image. For example, when we hear a car siren, we
picture an ambulance or a police car, the images usually associated with that sound. We also do
this when we hear someone speaking with an accent. For example, whether we recognize
Lumiere in Beauty and the Beast as having a French accent or not, we associate his sound to his
character. Therefore, when we hear a person who sounds like Lumiere, we might associate
Lumiere’s characteristics with that person who sounds like him. Therefore, we have the ability to
relate an image’s characteristics to another person who produces the same sound the image
produces. We assume that since that person sounds like that image he/she must have similar
personality traits. (cf. Tillman, 1986 for further explanation and examples.). In fact, the “two
cues” that “act as triggers” to someone’s personality traits are visual and auditory (Purnell et al.,
1999); thus, the exploitation of stereotypes is even more possible when both visual and auditory
cues are available together, as in animated films. It is possible that the audience is unaware of the

11
subtle stereotypes in animated films, which could be the catalyst for such long-lasting and
repeatable influence as seen in Cortés’ research (2000) (see also Pandey, 1997).
Previous research (Lippi-Green, 1997; Pandey, 1997) strongly suggests the manipulation
of language and accents in animated film. Lippi-Green suggests it directly affects children’s
judgments, a statement that forms the basis for the current study. Her discussion of animated film
using language “as a quick way to build character and reaffirm stereotype” (1997, p. 85) supports
Cortés’ (2000) fourth stage of media stereotyping “Humor, Parody, and Caricature.” Also, her
reference to Burton (1992) (reproduced below) provides more affirmation to the connection
between animated film and stereotyping.
Precisely because of their assumed innocence and innocuousness, their inherent ability—even obligation—to defy all conventions of realistic representation, animated cartoons offer up a fascinating zone with which to examine how a dominant culture constructs its subordinates. As non-photographic application of photographic medium, they are freed from the basic cinematic expectation that they convey an “impression of reality,” … The function and essence of cartoons is in fact the reverse: the impression of irreality, of intangible and imaginary worlds in chaotic, disruptive, subversive collision. (p. 85)
Lippi-Green (1997) further suggests that many of the linguistic stereotypes shown in
animated films are reflections of society’s attitudes as a result of current politics. Some examples
are:
Japanese and German characters in cartoons during the Second World War (Popeye meets the “oh so solly” Japanese fleet), Russian spy characters in children’s cartoons in the 1950s and 1960s (Natasha and Boris meet Rocky and Bullwinkle, or “beeg trouble forrr moose and squirrrrrel”), and Arabian characters in the era of hostilities with Iran and Iraq. (p. 85)
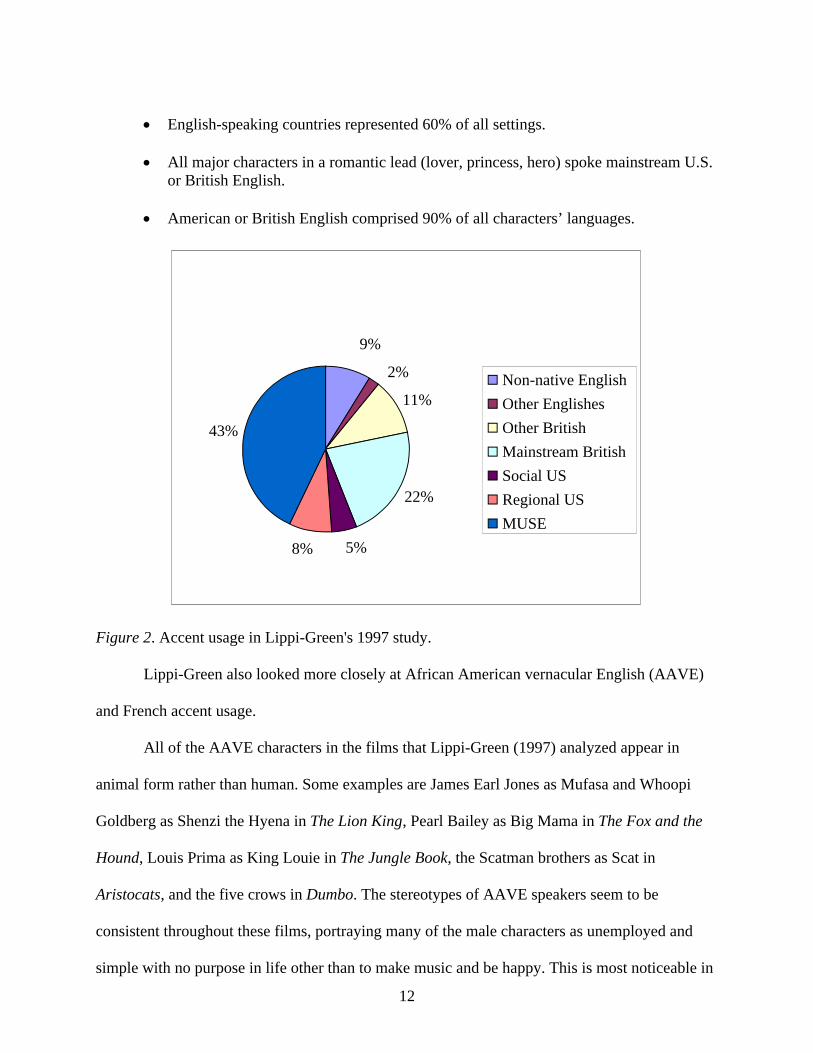
In her 1997 study, Lippi-Green examined 371 Disney characters in twenty-four films to
see if there were any patterns in their assigned roles in the films and languages spoken and/or
accents used. Her results (summarized below) showed the following:
A large portion (43.1%) of the characters had U.S. English accents (see Figure 2reproduced below).
Only 34 of the 91 characters (37%) that were in a role where they would not logically speak English had a foreign accent.
12
English-speaking countries represented 60% of all settings.
All major characters in a romantic lead (lover, princess, hero) spoke mainstream U.S. or British English.
American or British English comprised 90% of all characters’ languages.
Figure 2. Accent usage in Lippi-Green's 1997 study.
Lippi-Green also looked more closely at African American vernacular English (AAVE)
and French accent usage.
All of the AAVE characters in the films that Lippi-Green (1997) analyzed appear in
animal form rather than human. Some examples are James Earl Jones as Mufasa and Whoopi
Goldberg as Shenzi the Hyena in The Lion King, Pearl Bailey as Big Mama in The Fox and the
Hound, Louis Prima as King Louie in The Jungle Book, the Scatman brothers as Scat in
Aristocats, and the five crows in Dumbo. The stereotypes of AAVE speakers seem to be
consistent throughout these films, portraying many of the male characters as unemployed and
simple with no purpose in life other than to make music and be happy. This is most noticeable in
9%
2%
11%
22%
5%8%
43%
Non-native English
Other Englishes
Other British
Mainstream British
Social US
Regional US
MUSE
13
Dumbo with the crows just hanging around, not really doing anything but singing, and in King
Louie and his monkey subjects in The Jungle Book who seem to be anything but a royal kingdom
in that they have no rules and preoccupy their time by having fun and singing. Even the creators,
of The Jungle Book, Johnston and Thomas, focus on the musical attribute of these characters by
saying, “As a personality, he (King Louie) was sparkling, happy and rhythmic in both his
movements and his dialog” (as cited in Pandey, 1997, p.41). AAVE speaking characters are also
often used to create a sense of fun and comic relief (Pandey, 1997). Some examples are Stella the
skunk played by Wanda Sykes in Over the Hedge, Donkey played by Eddie Murphey in the
Shrek films, and Mushu played by Eddie Murphy in Mulan.
Lippi-Green (1997) also suggests that animators purposefully choose French accents for
chef-like and/or sexual characters. Some examples are Lumiere, Stove, and Cherie the
chambermaid in Beauty and the Beast; the milkman and chef in Aristocats; Louis the chef in The
Little Mermaid; and the waiter in Rescuers. These French-accented characters seem to always
appear in roles that deal with either their sexuality (as in Lumiere and Feather Duster in Beauty
and the Beast) or their culinary expertise (as in Louis the chef in The Little Mermaid and the chef
stove in Beauty and the Beast). The stereotype here is of French people being either sensual,
sexual beings or people who are well-versed in cooking and/or food preparation.
Lippi-Green (1997) also claims that there is a “standard language ideology” (SLI) in our
society. She says the SLI “proposes that an idealized nation-state has one perfect, homogenous
language” and “becomes the means by which discourse is seized, and provides rationalization for
limiting access to discourse” (p. 64-65). Pandey (1997) examined SLI in animated film
according to the power roles assigned based on characters’ linguistic features. She studied
“speech acts as exponents of ideology: dialects and directives in cartoons” (p. 108). This
involves the hierarchy placed on characters according to their directives and whether they speak

14
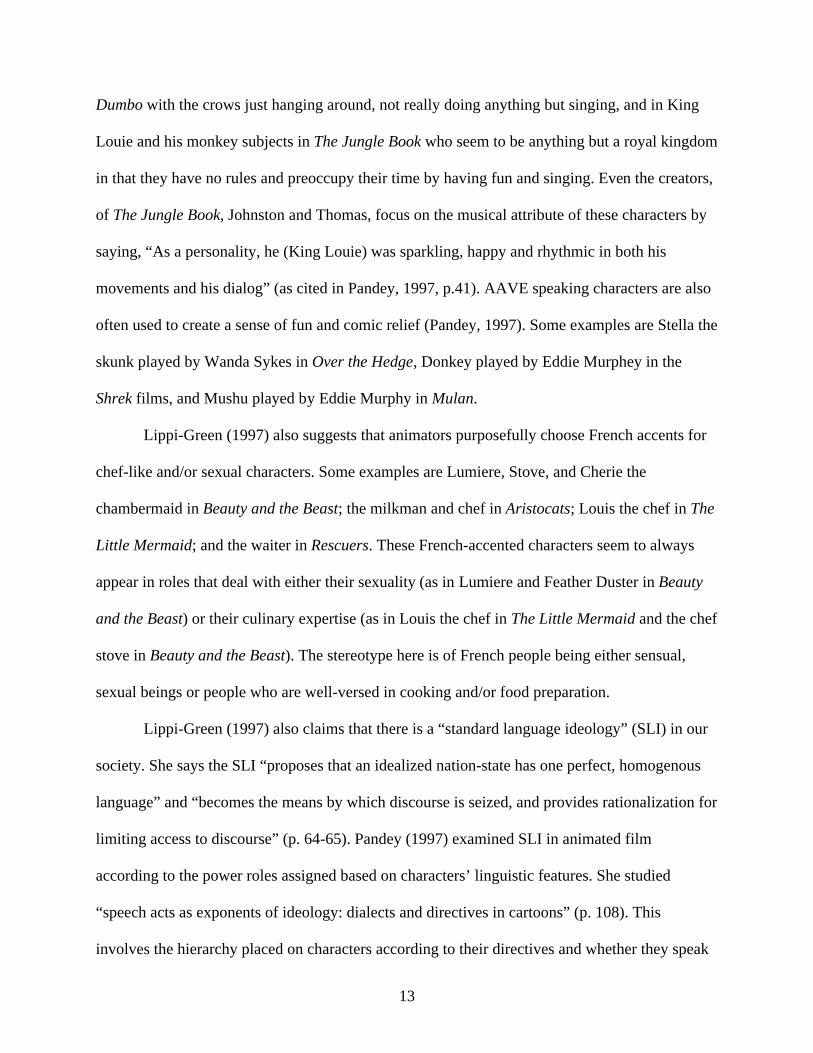
SE (standard English) or NSE (non standard English). She devised a “cline of directives”
(reproduced in Figure 3) which “shows a move from more speaker authority to less speaker
authority or power as we move down the cline” (p. 113). It is, however, necessary to view this
cline as merely one perspective among many. For example, Pandey’s cline assumes that the
speakers with power must utilize directives in order to express and maintain that power.
Therefore, we must look at the cline as simply Pandey’s perspective after she analyzed the films
in her study.
Speaker power is assumed
DIRECT
Imperatives: Orders/Commands
Threats
Warnings
Demands
Speaker power is not assumed
INDIRECT
Requests
Pleas
Suggestions
Offers
Wishes
Figure 3. Pandey's cline of directives (1997, p. 113).
Pandey studied dialogues from the following animated films: The Jungle Book, Dumbo,
One Hundred and One Dalmations, The Little Mermaid, Nightmare Before Christmas, and The
Lion King. Pandey discovered that “power is manifested in discourse via the control and
constraint of various speech acts” (p. 109). Her findings show that animators use directives as a
method of establishing and maintaining social power and relations, “whether symmetrical or
asymmetrical.” The following conclusions from her data support her hypotheses:
1. Speakers of SE direct the behavior of speakers of NSE.
2. There is a marked absence of overt directives from the upper end of the cline on the part of the speakers of NSE.

15
3. In the instance that the NSE speakers did use overt directives, they were directed toward other speakers of NSE to affirm the solidarity between group members.
4. Directives utilized by speakers of NSE were consistently selected from the lower half of the cline. (p. 140)
Pandey concluded that these findings are “final testimony of the linguistic means through
which domination can and is consistently sustained in the discourse of the animated movie” (p.
140).
Pandey also discovered that the characters’ linguistic domination and subordination were
done purposefully by the animated film creators themselves (Thomas and Johnston at Disney).
By examining Thomas and Johnston’s books (1984 and 1993) Pandey suggests that there is a
coincidence in the fact that the creators choose certain actors to play certain characters based on
how the actors sound. The creators say nothing of accent or dialect specifically, only the traits
they desired their audience to see in those characters. Pandey asserts that their description of an
“appealing villain” includes an unspoken yet obvious link between accent and character in the
case of Shere Khan, an RP speaker, in The Jungle Book.
Nevertheless, by the time we were ready to record a voice, we felt that the intellectual refinement inherent in a voice like Rahbone’s would no longer be right. We found the perfect combination of traits in the voice of George Sanders. He was the unquestioned king of the jungle, a competent, intelligent, conceited killer who never had to slaver or growl. (as cited in Pandey, 1997, p. 37)
In contrast, the creators describe King Louie, a speaker of AAVE, in The Jungle Book as
“low in mentality, unpredictable and concerned only with his own wishes” (as cited in Pandey,
1997, p. 41).
All of these stereotypes represented by characters in animated films, whether viewed as
positive or negative, are “fragmented and distorted” (Lippi-Green, 1997) representations of their
respective accents/dialects. If children have no other exposure to these accents, their perspectives
on others as well as themselves could be based merely on what they receive from animated film.

16
In order to see if children are actually influenced by the type of linguistic stereotypes
suggested in the studies by Lippi-Green (1997) and Pandey (1997), I developed the current
study. I wanted to know what kind of personality traits children assign to speakers of accented-
English, specifically MUSE, AAVE, French, British, and Arabic, based on their exposure to
animated films, and whether or not previous exposure to non-American languages had any effect
on their judgments. Therefore, the current study is an attempt to test Lippi-Green’s (1997) claim
that “animated films entertain, but they are also a way to teach children to associate specific
characteristics and life styles with specific social groups, by means of language variation” (p.
85). In fact, because children’s attitudes toward different varieties of languages change
significantly between ages 7 and 10 (Giles et al., 1983), I chose to investigate animated films
industry’s effect an audience of 3rd through 5th graders based on the following hypotheses:
Hypothesis 1. Children will rate the mainstream US English (MUSE) speaker more competent and more socially attractive than all other speakers.
Hypothesis 2. The jobs or life positions2 and characteristics assigned speakers will match the stereotypical jobs or life positions and characteristics portrayed in animated films.
Hypothesis 3. The more animated films children have seen, the more negatively/stereotypically they will rate non MUSE-accented speakers.
Hypothesis 4. Children with exposure to foreign accents will be more likely to rate foreign accents more positively.
My hypotheses were based on those developed by Hargis3 (2003). I chose to investigate these
hypotheses because of animated films’ “trendsetting” as suggested by Cortés’ (2000) fourth
stage.
2 I utilize the term “life positions” from Hargis’ (2003) unpublished manuscript, because it seemed to be the most appropriate term for that category.3 This project was based on a pilot study conducted by Hargis presented at the American Dialect Society conference in 2003. Her initial results suggested that American-accented English speakers rated highest.
17
METHODOLOGY
Developing the Survey
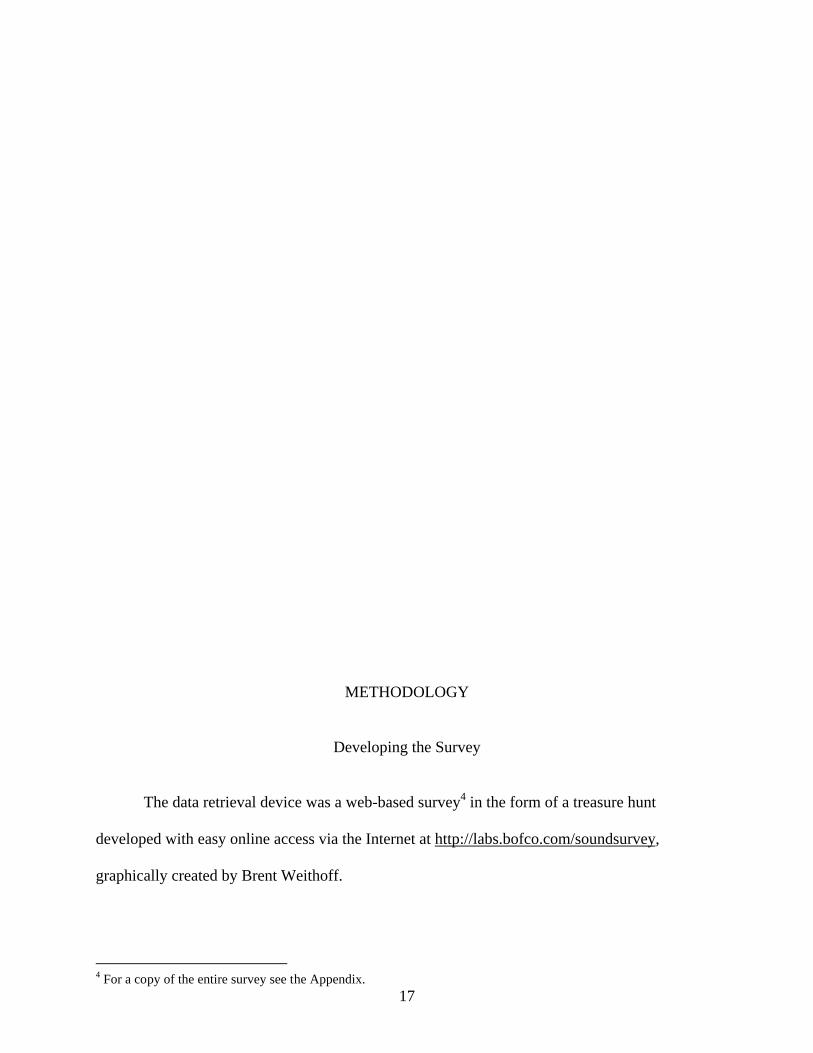
The data retrieval device was a web-based survey4 in the form of a treasure hunt
developed with easy online access via the Internet at http://labs.bofco.com/soundsurvey,
graphically created by Brent Weithoff.
4 For a copy of the entire survey see the Appendix.

18
Figure 4. Graphic on screen at beginning of survey.
The survey was adapted from Hargis’ (2003) pilot study initially called “robot works”
which she developed with programmers at the University of North Texas. The current survey
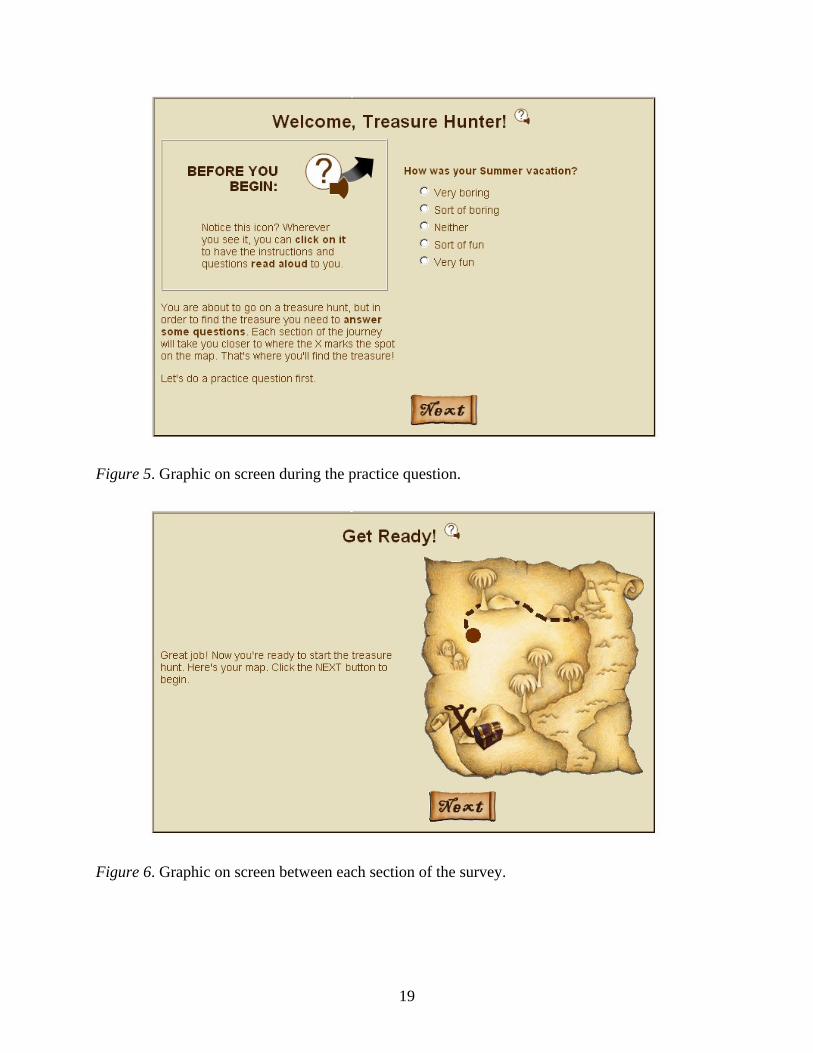
was rewritten and redesigned. After logging in to the survey site, respondents answered a
practice question to get accustomed to the survey. I recorded my voice reading every question in
the survey and inserted the auditory button seen in Figure 5 as a circled question mark beside
each question. I did this so the respondents would have the option of listening if they needed
auditory assistance and could not or did not want to read the questions silently. Between each
section of the survey, respondents viewed a progressive treasure map which took them along
their journey through the survey like a game (see Figure 6).
19
Figure 5. Graphic on screen during the practice question.
Figure 6. Graphic on screen between each section of the survey.
20
Every set of answers for each question was randomized for each respondent in order to prevent
“order effects” (Hayes, 2000) and equalize each answer, showing no favoritism or persuasion
toward any one choice.
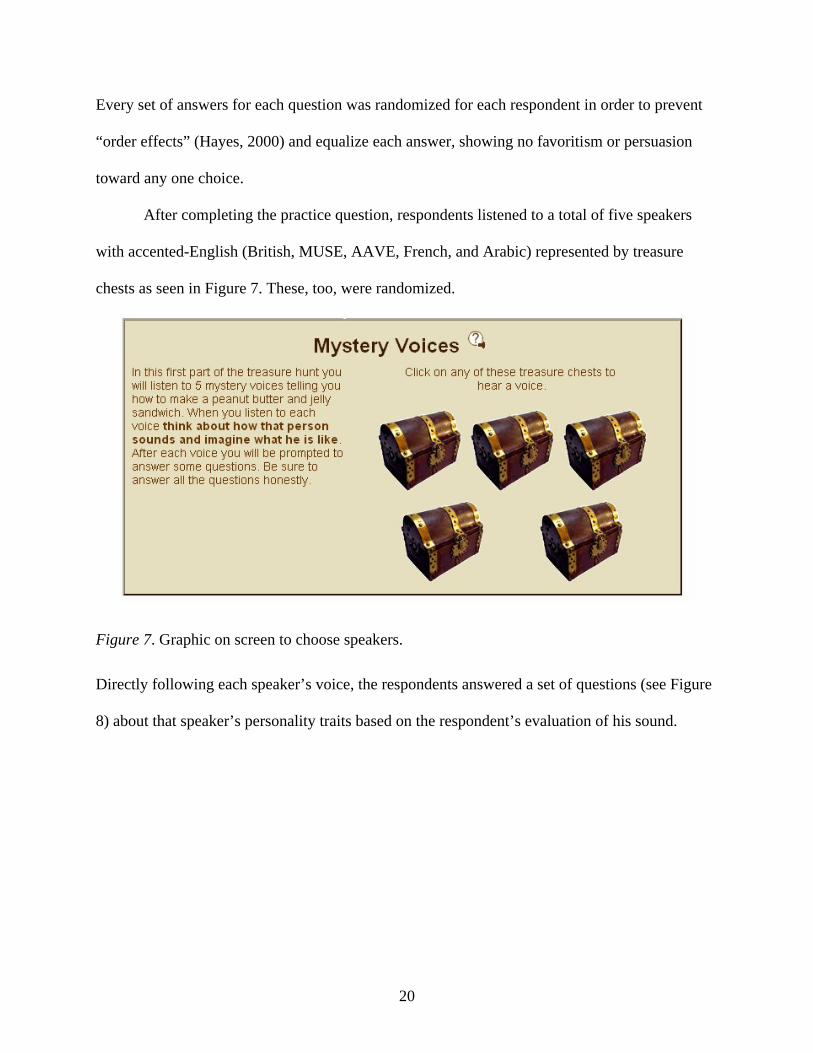
After completing the practice question, respondents listened to a total of five speakers
with accented-English (British, MUSE, AAVE, French, and Arabic) represented by treasure
chests as seen in Figure 7. These, too, were randomized.
Figure 7. Graphic on screen to choose speakers.
Directly following each speaker’s voice, the respondents answered a set of questions (see Figure
8) about that speaker’s personality traits based on the respondent’s evaluation of his sound.
21
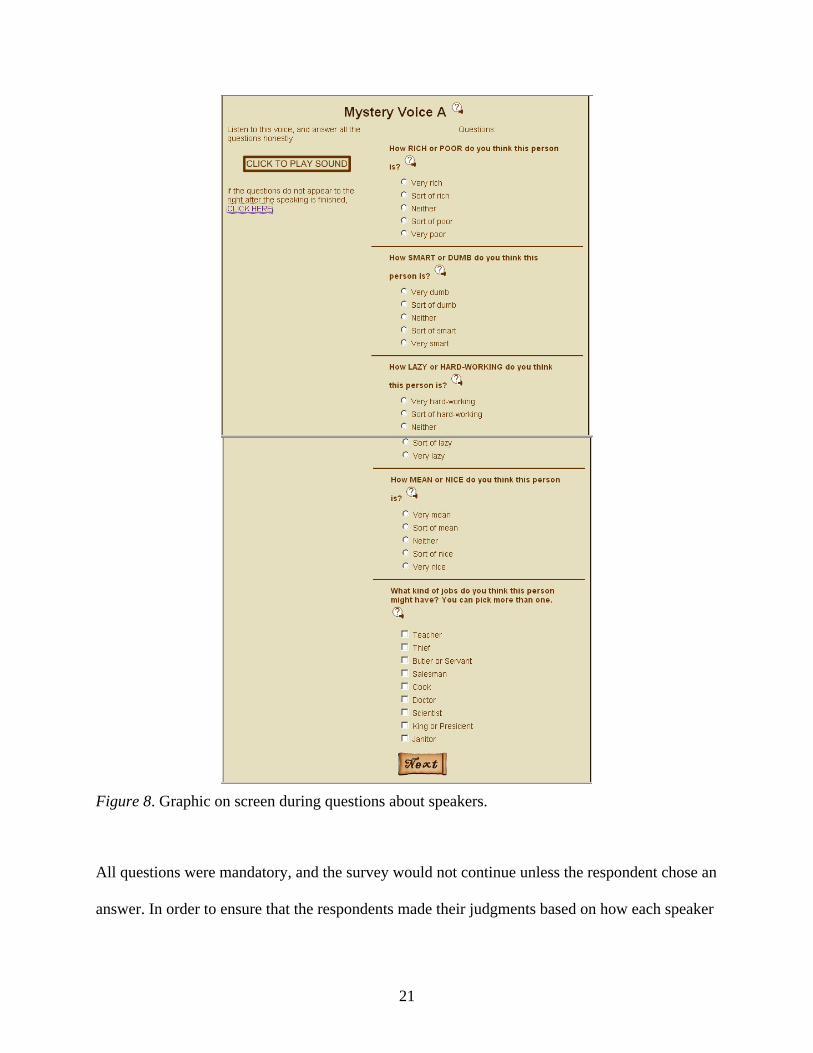
Figure 8. Graphic on screen during questions about speakers.
All questions were mandatory, and the survey would not continue unless the respondent chose an
answer. In order to ensure that the respondents made their judgments based on how each speaker

22
sounded, all speakers read the same reading passage that explained how to make a peanut butter
and jelly sandwich (see Figure 9).
Figure 9. Speakers’ reading passage.
Lastly, the respondents completed two sections on animated film viewing habits and
personal information5. The list of animated films included some that Lippi-Green analyzed in her
1997 study as well as some more contemporary films that I chose based on the accents in them
that pertain to the current study (see Table 1).
Table 1
Accents in the Animated Films Analyzed in the Current Study
Animated Films Accents101 Dalmations MUSE, BritishA Bug’s Life MUSEAladdin MUSE, British, ArabicBeauty and the Beast MUSE, British, FrenchCinderella MUSEDumbo MUSE, AAVEThe Road to El Dorado MUSEFinding Nemo MUSE, FrenchThe Great Mouse Detective MUSE, BritishThe Hunchback of Notre dame MUSE, AAVEIce Age/Ice Age 2 MUSE, AAVEJungle Book MUSE, British, AAVELion King/Lion King 1 ½ MUSE, British, AAVELittle Mermaid MUSE, French
(table continues)
5 See Appendix for complete list of questions.
How to make a peanut butter and jelly sandwich
How to make a peanut butter and jelly sandwich. To make a peanut butter and jelly sandwich you need two pieces of bread, a jar of jelly, and some peanut butter. First, you take a knife and spread some peanut butter on one slice of bread. Then you take another knife and spread jelly on the other slice of bread. Put the two pieces of bread together, and you have a peanut butter and jelly sandwich.

23
(Table 1 continued).
Animated Films AccentsMadagascar MUSE, AAVEMulan MUSE, AAVEOver the Hedge MUSE, AAVERescuers MUSEShrek/Shrek 2 MUSE, British, AAVESnow White MUSETarzan MUSE, British
The respondents selected the number of times they had viewed each film (None, 1 or 2
times, 3-5 times, or more than 5 times). The demographic section included general questions
about respondents’ age, sex, and exposure to foreign languages.
At the end of the survey, the respondents found the treasure (see Figure 10). As a way to
thank them for participating and give them a sense of satisfaction for completing the survey, the
teachers gave them a reward (e.g., candy, certificate, computer class coupons).

24
Figure 10. Graphic on screen at end of survey.
Respondents
The target audience was children in grades 3-5 in a private, parochial school in a rural
Texas town and in two public schools outside this town. In order to keep the anonymity of the
respondents as well as the towns and respective schools, the ethnic demographics of the
respondents (taken from 2005-2006 Texas Education Agency (TEA) enrollment reports), are
provided here as a generalization: 90% White, 4% Hispanic, 3% African American, 3% Native
American and Other. I gathered the ethnic demographics from the U.S. Bureau of the Census and
city websites. They are provided here as an average of the town and its surrounding areas that
participated in the current study: 87.15% White, 6.3% Black or African American and Hispanic,
2% Asian and Native Hawaiian or Other Pacific Islander, 0.85% American Indian and Alaska
Native, 5.2% Other.6 I provided each school with a unique username and password, and all
identifying markers were strictly numeric and only identifiable to the computer each respondent
used7. All consent forms were obtained and kept in a locked filing cabinet to protect the identity
of the respondents.
Data Collection
6 City websites are not included in the reference list in order to keep the anonymity of the areas. Percentages equal more than 100%, because some individuals reported more than one race.7 Computers were repeatedly used by multiple respondents, ensuring no one respondent could be linked to a specific computer.

25
Overall, the survey took about 25-30 minutes. Each school’s computer teacher
implemented the survey during computer class. I trained each teacher by emailing instructions
directly to the teacher and/or the teacher’s principal. I advised the teachers to go through the
survey first by themselves in test mode (so as to not collect their data) in order to resolve any last
minute questions or issues with the survey before implementing it in their classes. This proved
beneficial, because we were able to catch and fix some mistakes in the technical workings of the
site, such as repeating vocal links and glitches in visuals. However, one speaker’s voice would
not play for one set of respondents, so the same group of respondents had to take the survey
twice in order to hear all speakers. This repetition might have had an effect on that particular
group of respondents’ answers, but because the data was not identifiable to particular
respondents, such an effect is unknown.

26
RESULTS
There were 218 total respondents, but three did not complete portions of the survey.
Because of this, I deleted their input from the collected data. This left a total of 215 respondents.
The analyses proved statistically significant for only one out of the four hypotheses. Let us
consider the results in relation to all four hypotheses.
Hypothesis 1. Children will rate the mainstream US English (MUSE) speaker more competent and more socially attractive than all other speakers.
In order to determine “desirable” and “undesirable” traits, it was necessary to ask the
respondents for their preference in each trait (work ethic, wealth, attitude, intelligence) as seen in
Figure 11 on a scale of 1 to 3 with 3 being positive, 2 being neutral, and 1 being negative. For
example, in the question “Would you rather be smart or dumb?”, “smart” ranked 3, “neither”
ranked 2, and “dumb” ranked 1. The mean scores for each trait (see Table 2) indicate that the
respondents viewed being hard working, rich, nice, and smart as the more desirable
characteristics.

27
Figure 11. Graphic on screen during preferences section.
Table 2
Respondents’ Preferences with 3 as Most Desirable
Personality Traits mean (SD)
Intelligence 2.88 (.380)
Work Ethic 2.73 (.581)
Wealth 2.67 (.538)
Attitude 2.89 (.378)
I coded the personality traits (work ethic, attitude, wealth, intelligence) for each speaker
on a scale from 1 to 5 with 5 being most positive and 1 being most negative. For example, in the
question “Do you think this person sounds: very smart, sort of smart, I don’t know, sort of dumb,
28
very dumb”, the choice with the highest score (5) is “very smart” descending numerically to
“very dumb” with the lowest score (1).
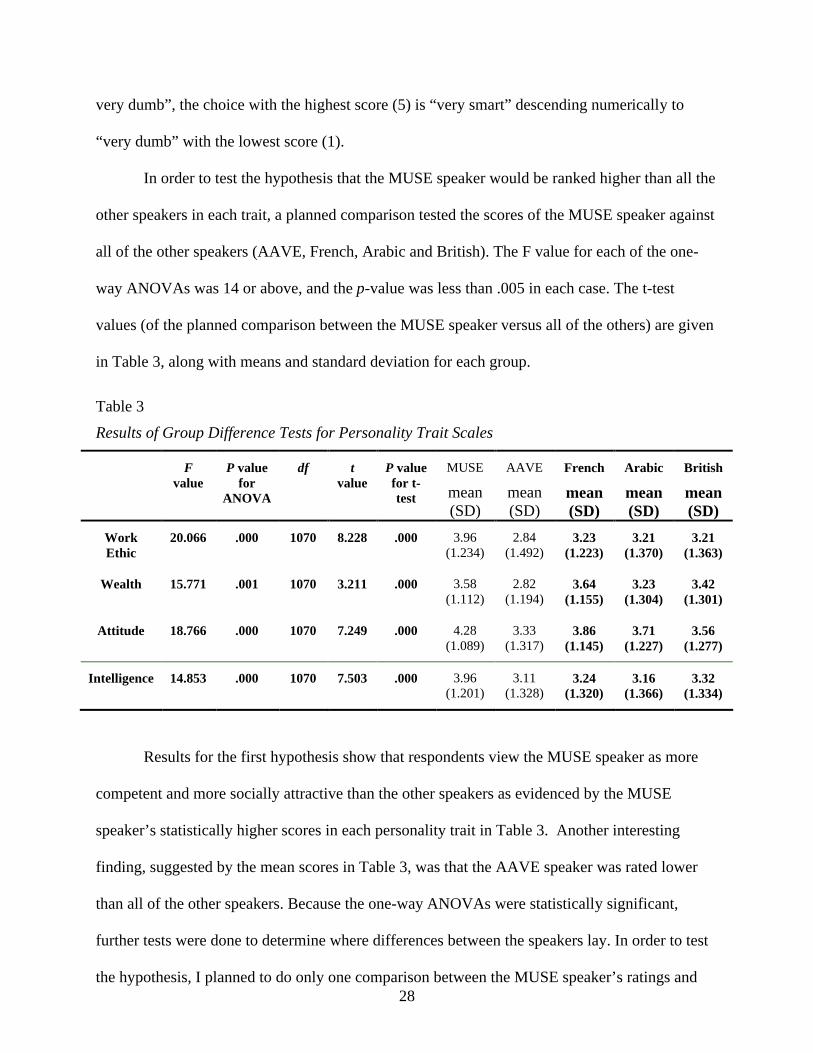
In order to test the hypothesis that the MUSE speaker would be ranked higher than all the
other speakers in each trait, a planned comparison tested the scores of the MUSE speaker against
all of the other speakers (AAVE, French, Arabic and British). The F value for each of the one-
way ANOVAs was 14 or above, and the p-value was less than .005 in each case. The t-test
values (of the planned comparison between the MUSE speaker versus all of the others) are given
in Table 3, along with means and standard deviation for each group.
Table 3
Results of Group Difference Tests for Personality Trait Scales
Fvalue
P value for
ANOVA
df tvalue
P value for t-test
MUSE
mean (SD)
AAVE
mean (SD)
French
mean (SD)
Arabic
mean (SD)
British
mean (SD)
Work Ethic
20.066 .000 1070 8.228 .000 3.96 (1.234)
2.84 (1.492)
3.23 (1.223)
3.21 (1.370)
3.21 (1.363)
Wealth 15.771 .001 1070 3.211 .000 3.58 (1.112)
2.82 (1.194)
3.64 (1.155)
3.23 (1.304)
3.42 (1.301)
Attitude 18.766 .000 1070 7.249 .000 4.28 (1.089)
3.33 (1.317)
3.86 (1.145)
3.71 (1.227)
3.56 (1.277)
Intelligence 14.853 .000 1070 7.503 .000 3.96 (1.201)
3.11 (1.328)
3.24 (1.320)
3.16 (1.366)
3.32 (1.334)
Results for the first hypothesis show that respondents view the MUSE speaker as more
competent and more socially attractive than the other speakers as evidenced by the MUSE
speaker’s statistically higher scores in each personality trait in Table 3. Another interesting
finding, suggested by the mean scores in Table 3, was that the AAVE speaker was rated lower
than all of the other speakers. Because the one-way ANOVAs were statistically significant,
further tests were done to determine where differences between the speakers lay. In order to test
the hypothesis, I planned to do only one comparison between the MUSE speaker’s ratings and
29
the ratings of all of the other groups combined (this is called a planned comparison and is in
contrast to post-hoc pairwise comparisons). This planned comparison was a t-test, and the t-test
value and associated p-value are listed in Table 3. In another run of the one-way ANOVA with
two planned comparisons, that of the MUSE speaker versus all other speakers and the AAVE
speaker versus all other speakers, all one-way ANOVA main effects were statistically significant
at p < .005, and the contrasts for the comparison between the AAVE speaker and all other groups
were statistically significant for all 4 traits at p < .001 in every case (t-values, p-values, and df for
the planned comparison with the MUSE speaker did not change from their values in Table 3).
Hypothesis 2. The jobs or life positions and/or characteristics assigned speakers will match the stereotypical jobs or life positions and/or characteristics portrayed in animated films.
Before assessing the categorization of the jobs/life positions assigned to each character, it
was necessary to first examine the respondents’ most frequently assigned jobs/life positions for
each speaker. I calculated the frequency of each job/life position, divided that by the total
number of responses, and thus was able to pinpoint the most common jobs/life positions and
their percentage of frequency. The results (summarized in Table 4) for the second hypothesis
showed a separation between American-accented speakers (MUSE and AAVE) and non-
American-accented speakers (French, British, Arabic). In order to see the differences in
selectivity, the bolded percentages indicate the jobs/life positions that the respondents chose
more than 10% of the time.

30
Table 4
Frequency of Jobs or Life Positions Respondents Selected for Speakers
Salesman Cook Doctor ScientistKing or
PresidentJanitor Teacher Thief
Butler or Servant
French 9% 24% 6% 8% 7% 9% 7% 5% 23%AAVE 17% 12% 8% 6% 4% 19% 14% 11% 9%Arabic 10% 17% 10% 9% 6% 12% 13% 8% 14%MUSE 14% 12% 17% 11% 4% 8% 23% 4% 8%British 13% 15% 11% 11% 7% 11% 12% 6% 15%

31
The results show allow for only a few conclusions. Based on the respondents frequency, we can
assume that they did not have a clear idea of what a “thief” sounds like, being that they
consistently assigned it less than 10% of the time. The AAVE speaker was the only speaker
given “janitor” as the most frequent choice. All other speakers had “thief” in the least selected
choices, while the AAVE speaker did not. It should also be noted that only the MUSE-accented
speaker had “teacher” and “doctor” as the most frequent choices. While there are slight
differences in percentages, it is worth noting that the respondents selected the same jobs (cook,
butler or servant) most frequently for the Arabic, French, and British speakers. This might be a
suggestive trend that respondents rated speakers along an American/non-American scale.
However, future research could possibily show more support by choosing to list jobs/life
positions in the survey that link more specifically with jobs/life positions in animated films.
Hypothesis 3. The more animated films children have seen, the more negatively/stereotypically they will rate non MUSE-accented speakers.
To test the hypothesis that watching more animated films results in more stereotypical
attitudinal responses, I performed a one-way Pearson correlation between number of movies
watched and the 4 traits for each of the non-MUSE speakers (resulting in 16 correlations). In
order to calculate the number of movies watched, I used a rating scale where the respondents
identified how many times they viewed each film by selecting from the choices “never watched,”
“1 or 2 times,” “3 to 5 times,” or “more than 5 times” for each film. I numerically coded the
responses on the scale of 0 to 3, 0 being “never watched” and 3 being “more than 5 times”. Most
of the correlations were not statistically significant, with p-values above p = .15 and r values
below .08. Although only one of the correlations fell below the p = .05 level, a couple of the
others were below p = .10, and thus the correlations that I will consider to be important were:
1) A correlation between number of movies watched and intelligence ratings for the AAVE speaker (r = -.094, p = .084)

32
2) A correlation between number of movies watched and work ethic ratings for the French speaker (r = -.089, p = .099)3) A correlation between number of movies watched and wealth ratings for the British speaker (r= -.115, p = .047)
The results here seem to indicate that the children did hold some stereotypical attitudes
about certain dialects, and their attitudes were more negative the more movies they had seen.
Although it is difficult to say that this hypothesis is strongly upheld, I also think there is enough
evidence to say there may be something ‘moving in the bushes.’ For future research it might be
more illuminating to correlate the number of times specific movies that portrayed characters with
specific dialects or accents were watched (such as The Little Mermaid with its French cook) with
the specific traits. I did try to do this as far as I was able for the present data set, but because the
variation in just one movie was not much (only a scale from 0 to 3) and because it was difficult
to isolate just one accent for one movie, no interesting findings resulted from this investigation.
Hypothesis 4. Children with exposure to foreign accents will be more likely to rate foreign accents more positively.
I gathered the data for this hypothesis from questions concerning the respondents’
exposure to languages other than English. I determined the respondents’ foreign accent exposure
based on their answers to the following questions:
1. Do you speak another language besides English?
2. Does anyone who lives with you speak English as their second language?
3. Do you know anyone who doesn’t live with you who speaks English as their second language?
The scores for each question were grouped together into one category I called “foreign accent
exposure” and given a numeric code from 0-3 based on the quantity of exposure with 0 being the
least and 3 being the most. For example, if a respondent said “yes” to only one of the questions,
the code was 1. If the respondent said “yes” to all three questions, the code was 3. If the
respondent said “no” to all questions, the code was 0. The respondents identified the “second”

33
languages when they said “yes” to a question. However, the answers to this question showed that
Spanish was the most frequently indicated language (53%), a foreign language that was not
included in this study. Also, the category of “Other” was selected frequently (out of a choice of
French, Arabic, Spanish or Other), at 35%, and thus we may say that most of the children in this
study had not been exposed to French or Arabic accented English. For future research, it might
prove fruitful to include a Spanish-accented subject since the respondents have had a lot of
exposure to L2 speakers with Spanish accents.
I correlated the amount of foreign accent exposure with a composite score for each of the
three foreign accented speakers (French, British, and Arabic). This overall rating was formed by
adding together the scores for each of the 4 personality traits for each speaker. A one-tailed
Pearson correlation was performed between amount of foreign accent exposure and overall rating
for the speaker. The results were: for the French speaker, r = -.179, p = .004, n = 214; for the
Arabic speaker, r = -.096, p = .080, n = 214; for the British speaker, r = .019, p = .388, n = 214.
The negative correlations for the French and Arabic speaker mean that as the respondents had
more exposure to foreign accents, they rated the French and Arabic speakers lower (for the
French speaker this was statistically significant and for the Arabic speaker it was just a trend).
However, for the British speaker there was no correlation between overall rating and foreign
accent exposure.

34
DISCUSSION
Although all of the hypotheses are not supported, the results are encouraging in their
implications and contribution to the field of sociolinguistics. The current study shows difficulty
in testing Lippi-Green’s (1997) claim that animated films teach children about linguistic
stereotypes. Let us discuss the meaning of the results for each hypothesis to see the difficulties
and contributions.
Hypothesis 1. Children will rate the mainstream US English (MUSE) speaker more competent and more socially attractive than all other speakers.
The respondents rate the MUSE speaker most positively in the personality traits of work
ethic, attitude, and intelligence. This data is similar to that of Markley’s (2000) study in which
the adult respondents showed a preference for the least identifiable regionally accented speaker,
the accent with the least variation. It is worth noting, however, that the current study’s results
showed preference for the French speaker in the wealth trait. In the present study, the AAVE
speaker was ranked lowest in all categories, echoing the results of Lippi-Green’s (1997) analysis
where she finds an overall preference for MUSE and negative portrayals of AAVE accented
characters. Pandey (1997) also claims that even the creators of such films purposefully choose
MUSE for the “stronger” roles and AAVE for the “weaker” roles as previously mentioned.
Hypothesis 2. The jobs or life positions and characteristics assigned speakers will match the stereotypical jobs or life positions and characteristics portrayed in animated films.
We can see the respondents’ tendency to group the non-American speakers together in
the current data by their assigning “cook” and “butler or servant” to all non-American accents
(British, French, Arabic) more than 10% of the time. This categorization of non-American-
accented English can be linked to animated films (e.g., British accented butler Cogsworth in
Beauty and the Beast and French chef Louis in The Little Mermaid). Respondents showed a
tendancy, again, to separate the MUSE speaker from the other speakers given that “teacher” and

35
“doctor” were in the highest percentages for the MUSE speaker and not for the other speakers.
Also, they assigned only the AAVE speaker the job of “janitor” more than 10% of the time,
while they did not do so with the other speakers. However, because I was unable to determine
direct influence from animated films on the respondents’ job assignments, all of these findings
merely show trends.
Hypothesis 3. The more animated films children have seen, the more negatively/stereotypically they will rate non MUSE-accented speakers.
While we have no way of knowing from the current data that the respondents knew the
types of accents used in animated films, we can assume that they could perceive the sound of
each foreign/non-standard accent as being different from “the norm.” We could assume,
however, that the respondents could relate the characters’ sounds in animated films to the sounds
of the speakers in the current study when they had similar sounds to the characters. (see page 10
for further explanation of image-sound relation). The data show a correlation in the respondents’
amount of film watching and their ratings of the French speaker in work ethic, the ratings of the
British speaker in wealth, and the ratings of the AAVE speaker in work ethic and intelligence.
While these findings are not enough to fully uphold this hypothesis, they do show the surfacing
of some trends.
Hypothesis 4. Children with exposure to foreign accents will be more likely to rate foreign accents more positively.
There were two correlations between the amount of foreign accent exposure and the
respondents’ ratings of personality traits, one for the French speaker and one for the Arabic
speaker. These correlations were negative. Perhaps, this is due to the small percentages of
foreign residents and English-speaking ethnic minoritiess in the area studied, meaning that the
respondents had little exposure to foreign accents and/or varieties of English different than the
norm for that area. However, from the negative correlations, we can see that as the respondents

36
had more foreign accent exposure, they rated these two speakers lower. Again, without knowing
whether or not the respondents could identify the accents, these findings merely show trend with
the possibility of stronger evidence to be found in future research.
37
LIMITATIONS AND SUMMARY
The limitations of the current study are in the jobs/life positions selections, technical
difficulties with audio, geography and ethnicity of the respondents and the area, and selectivity
of the participating schools. The jobs/life positions did not correlate directly with specific
jobs/life positions of characters in the animated films provided, which made it extremely difficult
to draw any conclusions of speaker-character relation. A duplication of this study should rework
the jobs/life positions in order to better correlate with those of the characters in the chosen
animated films. Also, it would prove beneficial to have a “no job” selection, which might
provide some insight into what kind of accented-speaker the respondents view as incapable of
holding any job.
The audio clips of the speakers proved difficult to hear for some respondents, which
might have had an effect on their responses to certain less audible or poorly recorded speakers’
voices.
The majority of respondents were from public school, and only a small amount was from
private school. A future study should include a larger variety of educational institutions. Also,
because of the demographic makeup of the town and its surrounding areas, as stated on page 24,
the respondents might have less exposure to non-American accents, which could have had an
effect on the personality traits rankings. A future study could be better fortified by including
more geographical variance, because metropolitan areas could produce different results. It might
also be suggested that the current study is limited in the fact that it only included respondents
from the author’s home town, which might possibly have unforeseeable implications. For
example, if the teachers used my name while introducing the survey to the respondents, the
respondents might have consciously or unconsciously altered their answers in hopes of affecting
my opinion of them, even though I could not have identified them individually.

38
We know based on previous language attitude studies (Cargile & Giles, 1998;
Lindemann, 2005; Markley, 2000; Preston, 1996) that people are not successful at identifying
accents. We do not know if they recognize accents as AAVE, MUSE, French, Arabic, and
British. We can, however, assume that respondents recognize these accents as either American or
non-American. In fact, future research would benefit from having respondents identify what
accents they think each speaker uses or where they think each speaker is from. The current study
shows that stereotypes are, indeed, repeated throughout the respondents’ ratings of each
speaker/accent, and there is general preference for the MUSE speaker. The amounts of film
watching and previous foreign accent exposure have some effects on certain speakers’ ratings.
However, there are many other external influences, not included in the current study that could
have had an effect on the respondents’ answers.
The current study has demonstrated the difficulties in testing Lippi-Green’s (1997)
assertion that children are taught to stereotype because of the linguistic stereotypes in animated
films. While we can see that stereotypes do exist in animated films, without taking into account
the multitude of external influences, such as peer conversations, TV shows, music, and influence
from their families, we have no way of knowing if Lippi-Green overstated her claim. Future
research could include an enthographic case study of a small percentage of the respondents to
investigate these kinds of external influences.
Despite the limitations stated above, this study has broken the surface for future research
in sociolinguistics because of its findings showing trends in stereotyping and also in contributing
the survey itself. Future researchers can alter the survey to fit their research needs (e.g., changing
the speakers to use other varieties), and the survey is easily accessible via the web. Data is easily
retrievable, and the positive comments received from the teachers who conducted the surveys in
the current study suggest that the survey works well and is very reliable.

39
APPENDIX
WEBSITE SURVEY SCRIPT
40
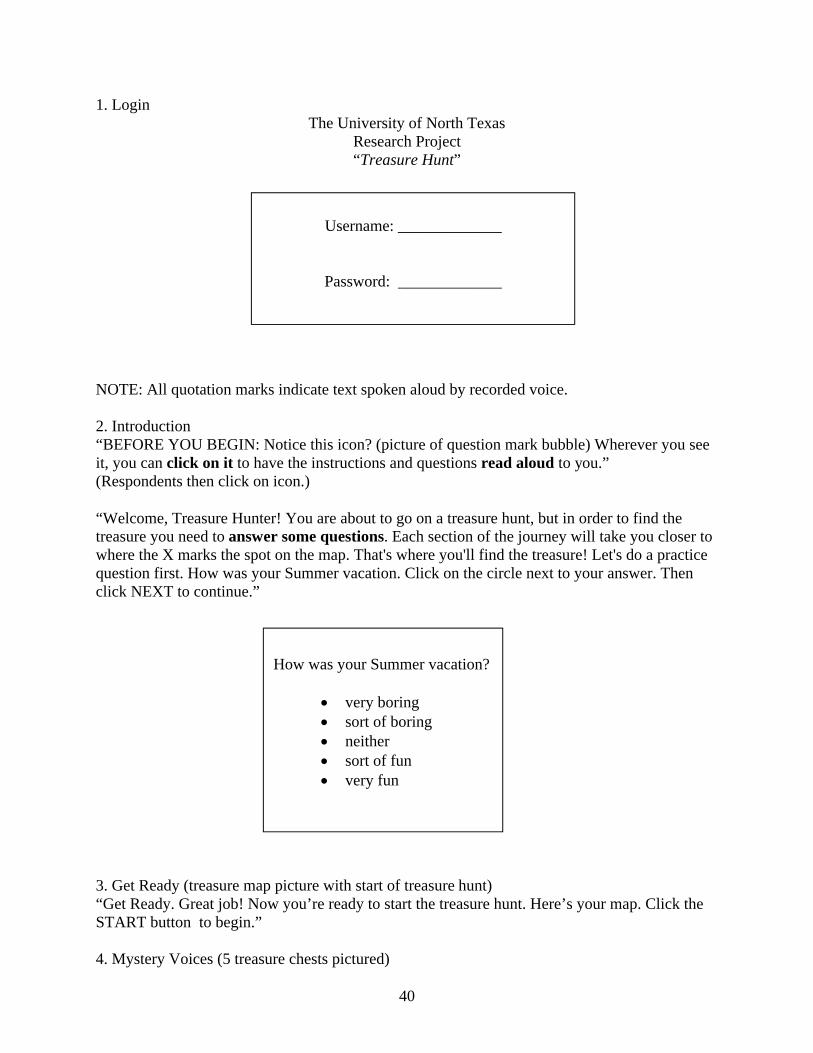
1. LoginThe University of North Texas
Research Project“Treasure Hunt”
NOTE: All quotation marks indicate text spoken aloud by recorded voice.
2. Introduction“BEFORE YOU BEGIN: Notice this icon? (picture of question mark bubble) Wherever you see it, you can click on it to have the instructions and questions read aloud to you.”(Respondents then click on icon.)
“Welcome, Treasure Hunter! You are about to go on a treasure hunt, but in order to find the treasure you need to answer some questions. Each section of the journey will take you closer to where the X marks the spot on the map. That's where you'll find the treasure! Let's do a practice question first. How was your Summer vacation. Click on the circle next to your answer. Then click NEXT to continue.”
3. Get Ready (treasure map picture with start of treasure hunt)“Get Ready. Great job! Now you’re ready to start the treasure hunt. Here’s your map. Click the START button to begin.”
4. Mystery Voices (5 treasure chests pictured)
Username: _____________
Password: _____________
How was your Summer vacation?
very boring sort of boring neither sort of fun very fun

41
“Mystery Voices. In this first part of the treasure hunt you will listen to 5 mystery voices telling you how to make a peanut butter and jelly sandwich. When you listen to each voice think about how that person sounds and imagine what he is like. After each voice you will be prompted to answer some questions. Be sure to answer all the questions honestly. If you want the question read aloud, click on the button next to the question. Click on any of these treasure chests to hear a voice.”
Speakers’ Reading Passage
5. Mystery Voices Questions (appear after each voice)
I think this person sounds… very lazy sort of lazy neither sort of hardworking very hardworking
very rich sort of rich neither sort of poor very poor
very mean sort of mean neither sort of nice very nice
very smart sort of smart neither sort of dumb very dumb
What do you think this person could be? Click on all the answers you think are right. You can choose more than one.
How to make a peanut butter and jelly sandwich
How to make a peanut butter and jelly sandwich. To make a peanut butter and jelly sandwich you need two pieces of bread, a jar of jelly, and some peanut butter. First, you take a knife and spead some peanut butter on one slice of bread. Then you take another knife and spread jelly on the other slice of bread. Put the two pieces of bread together, and you have a peanut butter and jelly sandwich.

42
Thief Butler or Servant King or President Cook Janitor Teacher Salesman Doctor Scientist
(After each question set, respondents click NEXT to listen to another voice and continue on for all 5 voices.)
6. Very good! (picture of treasure map getting closer to treasure)“Very good! You’re getting closer to the treasure! Now click NEXT to do the second part of the treasure hunt.
7. Questions About You (demographic questions)In this second part of the treasure hunt, you will answer some questions about yourself. Please answer truthfully. “Questions about you. Read the question to yourself, then look at each answer and click the box next to your choice. Remember if you need me to read the question, click on the button next to the question.”

43
8. Fantastic! (picture of treasure map with hunt almost complete)“Fantastic! You’re almost to the treasure! Click NEXT to go to the last part of the treasure hunt.”
9. Movies You’ve Seen “Movies you’ve seen. How many times have you watched these movies? Click on the box next to each movie and select Never Watched, 1 or 2 times, 3 to 5 times, or more than 5 times. When you are finished, click NEXT.”(list of animated films with the 4 choices by each)101 Dalmations, A Bug’s Life, Aladdin, Beauty and the Beast, Cinderella, Dumbo, El Dorado, Finding Nemo, Great Mouse Detective, Hunchback of Notre Dame, Ice Age/Ice Age 2, Jungle Book, Lion King/Lion King 1 ½, Little Mermaid, Madagascar, Mulan, Over the Hedge, Rescuers, Shrek/Shrek 2, Snow White, Tarzan
1. How old are you? 5, 6, 7, 8, 9, 10, 11, 12, over 12
2. Are you a boy or a girl? boy girl
3. Do you speak another language besides English? yes no(If yes, box pops up with choices.)4. Does anyone who lives with you speak English as their second language? yes no(If yes, box pops up with choices.)5. Do you know anyone who doesn’t live with you who speaks English as their second language? yes no(If yes, box pops up with choices.)6. How often do you watch movies?
every day once or twice a week once or twice a month a few times a year once a year or less
7. Which would you rather be? Pick one from each line of words. smart or dumb or neither rich or poor or neither lazy or hardworking or neither mean or nice or neither

44
10. You found the treasure chest! (picture of finished hunt)“Wow! You did it! You found the treasure chest! Click NEXT to see what’s inside!”
11. You found the treasure! (picture of open treasure chest)“You found the treasure! Your secret buried treasure code word is _______ (Pirate, Gold, Treasure, or Map). Tell your teacher this code word to get a special treasure of your very own to take home! Bye, Treasure Hunter!”
(End of Survey)

45
REFERENCES
Arslen, L. & Hansen, J. (1996). Language accent classification in American English. Speech Communication, 18, 353-367.
Barongan, C. & Hall, G. (1995). The influence of misogynous rap music on sexual aggression against women. Psychology of Women Quarterly, 19, 195-207.
Baugh, J. (1996). Perceptions within a variable paradigm: Black and white racial detection and identification based on speech. In Schneider, E. (Ed.), Focus on the USA, (169-182). Amsterdam: John Benjamins Publishing Co.
Baugh, J. (2000). Racial identification by speech. American Speech, 75, 362-364.
Boberg, C. (1999). The attitudinal component of variation American English foreign (a) nativization. Journal of Language and Social Psychology, 18, 49-61.
Burton, J. (1992). Don (Juanito) duck and the imperial-patriarchal unconscious: Disney studios, the good neighbor policy, and the packaging of Latin America. In Parker, A., Russo, M., Sommer, D., et al.., (Eds.), Nationalisms and Sexualities (21-41). New York: Routledge.
Bresnahan, M., Ohashi, R., Nebashi, R., Liu, W., & Shearman, S. (2002). Attitudinal and affective response toward accented English. Language & Communication, 22, 171-185.
Cargile, A., Giles, H., Ryan, E., & Bradac, J. (1994). Language attitudes as a social process: A conceptual model and new directions. Language & Communication, 14, 211-236.
Cargile, A. & Giles, H. (1998). Language attitudes toward varieties of English: an American-Japanese context. Journal of Applied Communication Research, 26, 338-356.
Cicchirillo, V. & Chory-Assad, R. (2005). Effects of affective orientation and video game play on aggressive thoughts and behaviors. Journal of Broadcasting and Electronic Media, 49, 435-449.
Cortés, C. E. (2000). The children are watching: How the media teach about diversity. New York and London: Teachers College Press.
Fraser, B. (1973). Some “unexpected” reactions to various American-English dialects. In Roger, S & Fasold, R. (Eds.), Language Attitudes: Current Trends and Prospects (28-35). Washington D.C.: Georgtown University Press.
Giles, H., Baker, S., & Fielding, G. (1975). Communication length as a behavioral index of accent prejudice. Linguistics: An International Review, 166, 73-81.
Giles, H., Harrison, C., Creber, C., Smit, P. M., & Freeman, N. H. (1983). Developmental and contextual aspects of children's language attitudes. Language and Communication, 3, 141-146.

46
Hall, P. A. 1997: The Ebonics debate: Are we speaking the same language? Black Scholar, 27, 12-14.
Hallam, S. Price, J., & Katsaron, G. (2002). Effects of background music on primary school pupils’ task performance. Educational Studies, 28, 111-122.
Hayes, N. (2000). Doing psychological research. Philadelphia: Open University Press.
Huesmann, L. R. & Taylor, L. (2006). The role of media violence on violent behavior. Annual Review of Public Health, 27, 393-415.
Johnston, O, & Thomas, F. (1993). The Disney villain. New York: Hyperion.
Kirsh, S., Okzak, P, & Mounts, J. (2005). Violent video games induce an affect processing bias. Media Psychology, 7, 239-250.
Lindemann, S. (2005). Who speaks broken English?: US undergraduates’ perceptions of non-native English. International Journal of Applied Linguistics, 13, 187-212.
Lippi-Green, R. (1994). Accent, standard language ideology, and discriminatory pretext in the courts. Language in Society, 23, 163-198.
Lippi-Green, R. (1997). English with an accent: Language, ideology, and discrimination in the United States. London and New York: Routledge.
Markely, D. (2000). Regional accent discrimination in the hiring process: A language attitude study. Unpublished master’s thesis, Department of English, University of North Texas, Denton, TX.
Montgomery, J. (1999). Accents and dialects: Creating a national professional statement. Topics in Language Disorders, 19, 78-86.
Nantais, K., & Schellenber, E. (1999). The Mozart effect: An artifact of preference. Psychology Science, 10, 370-373.
Pandey, A. (1997). Articulating prejudice: A linguistic perspective on animated movies.Dissertation Abstracts International, 58(10), 3907A. (UMI No. 9812730)
Podberesky, R., Deluty, R. & Feldstein, S. (1990). Evaluations of Spanish-and Oriental-accented English speakers. Social Behavior and Personality, 18, 53-63.
Preston, D. (1996). Where the worst English is spoken. In Schneider, E. (Ed.). Focus on the USA, Amsterdam, Netherlands: John Benjamins Publishing Co, 297-360.
Purnell, T., Idsardi, W., & Baugh, J. (1999). Perceptual and phonetic experiments on American English dialect identification. Journal of Language and Social Psychology, 18, 10-30.

47
Roberts, D. F. & Foehr, U. G. (2004). Kids and media in America. Cambridge: Cambridge Univ Press.
Texas Education Agency (TEA), Information Analysis Division. (2006). TEA--Standard Reports. Retreived August 29, 2006 from http://www.tea.state.tx.us/adhocrpt/Standard_Reports.html.
Tillman, F. (1986). Film, thought, and language. World Englishes, 5, 265-272.
Thomas, F. & Johnston, O. (1984). Disney animation: The illusion of life. New York: Abbeville Press.
United States Bureau of Census. (2000).
Van de Winckel, A. Feys, H, De Weerdt, W., & Dom, R. Cognitive and behavioural effects of music-based exercises in patients with dementia. Clinical Rehabilitation, 18, 253-260.
Västfjäll, D., Larsson, P., & Kleiner, M. (2002). Emotion and auditory virtual environments: Affect-based judgments of music reproduced with virtual reverberation times. Cyberpsychology and Behavior, 5, 19-32.
Williams v. Frank, 757 F. 2nd 230 (1st Cir. 1992).

![COMPARING ENGLISH IN THE CONTEMPORARY WORLD AND … · culture. He writes openly of a Latin linguistic imperialism, by stating that ³[t]he effects of Roman linguistic imperialism](https://static.fdocuments.us/doc/165x107/5edb1d53aa8629317168b3a0/comparing-english-in-the-contemporary-world-and-culture-he-writes-openly-of-a-latin.jpg)