Digital Lesson on Graphs of Equations. Copyright © by Houghton Mifflin Company, Inc. All rights...
21
Digital Lesson on Graphs of Equations
-
Upload
henry-kittle -
Category
Documents
-
view
219 -
download
0
Transcript of Digital Lesson on Graphs of Equations. Copyright © by Houghton Mifflin Company, Inc. All rights...

Digital Lesson on Graphs of Equations

Copyright © by Houghton Mifflin Company, Inc. All rights reserved. 2
The graph of an equation in two variables x and y is the set of all points (x, y) whose coordinates satisfy the equation.
For instance, the point (–1, 3) is on the graph of 2y – x = 7 because the equation is satisfied when –1 is substituted for x and 3 is substituted for y. That is,
2y – x = 7 Original Equation
2(3) – (–1) = 7 Substitute for x and y.
7 = 7 Equation is satisfied.

Copyright © by Houghton Mifflin Company, Inc. All rights reserved. 3
To sketch the graph of an equation,
1. Find several solution points of the equation by substituting various values for x and solving the equation for y.
2. Plot the points in the coordinate plane.
3. Connect the points using straight lines or smooth curves.

Copyright © by Houghton Mifflin Company, Inc. All rights reserved. 4
Example: Sketch the graph of y = –2x + 3.
1. Find several solution points of the equation.
x y = –2x + 3 (x, y)
–2 y = –2(–2) + 3 = 7 (–2, 7)
–1 y = –2(–1) + 3 = 5 (–1, 5)
0 y = –2(0) + 3 = 3 (0, 3)
1 y = –2(1) + 3 = 1 (1, 1)
2 y = –2(2) + 3 = –1 (2, –1)

Copyright © by Houghton Mifflin Company, Inc. All rights reserved. 5
Example: Sketch the graph of y = –2x + 3.
2. Plot the points in the coordinate plane.
4 8
4
8
4
–4
x
yx y (x, y)
–2 7 (–2, 7)
–1 5 (–1, 5)
0 3 (0, 3)
1 1 (1, 1)
2 –1 (2, –1)

Copyright © by Houghton Mifflin Company, Inc. All rights reserved. 6
Example: Sketch the graph of y = –2x + 3.
3. Connect the points with a straight line.
4 8
4
8
4
–4
x
y

Copyright © by Houghton Mifflin Company, Inc. All rights reserved. 7
Example: Sketch the graph of y = (x – 1)2.
x y (x, y)
–2 9 (–2, 9)
–1 4 (–1, 4)
0 1 (0, 1)
1 0 (1, 0)
2 1 (2, 1)
3 4 (3, 4)
4 9 (4, 9)
y
x2 4
2
6
8
–2

Copyright © by Houghton Mifflin Company, Inc. All rights reserved. 8
Example: Graph 122 xxy

Copyright © by Houghton Mifflin Company, Inc. All rights reserved. 9
Example: Sketch the graph of y = | x | + 1.
x y (x, y)
–2 3 (–2, 3)
–1 2 (–1, 2)
0 1 (0, 1)
1 2 (1, 2)
2 3 (2, 3)
y
x–2 2
2
4

Copyright © by Houghton Mifflin Company, Inc. All rights reserved. 10
The points at which the graph intersects the the x- or y-axis are called intercepts. A point at which the graph of an equation meets the y-axis is called a y-intercept. It is possible for a graph to have no intercepts, one intercept, or several intercepts.
If (x, 0) satisfies an equation, then the point (x, 0) is called an x-intercept of the graph of the equation.
If (0, y) satisfies an equation, then the point (0, y) is called a y-intercept of the graph of the equation.

Copyright © by Houghton Mifflin Company, Inc. All rights reserved. 11
To find the x-intercepts of the graph of an equation, substitute 0 for y in the equation and solve for x.
To find the y-intercepts of the graph of an equation algebraically, substitute 0 for x in the equation and solve for y.
Procedure for finding the x- and y- intercepts of the graph of an equation algebraically:

Copyright © by Houghton Mifflin Company, Inc. All rights reserved. 12
Example: Find the x- and y-intercepts of the graph of y = x2 + 4x – 5.
To find the x-intercepts, let y = 0 and solve for x.
0 = x2 + 4x – 5 Substitute 0 for y.
0 = (x – 1)(x + 5) Factor.
x – 1 = 0 x + 5 = 0 Set each factor equal to 0.
x = 1 x = –5 Solve for x.
So, the x-intercepts are (1, 0) and (–5, 0).
To find the y-intercept, let x = 0 and solve for y.
y = 02 + 4(0) – 5 = –5
So, the y-intercept is (0, –5).

Copyright © by Houghton Mifflin Company, Inc. All rights reserved. 13
To find the x-intercepts of the graph of an equation, locate the points at which the graph intersects the x-axis.
Procedure for finding the x- and y-intercepts of the graph of an equation graphically:
To find the y-intercepts of the graph of an equation, locate the points at which the graph intersects the y-axis.

Copyright © by Houghton Mifflin Company, Inc. All rights reserved. 14
Example: Find the x- and y-intercepts of the graph of x = | y | – 2 shown below.
y
x1
2
–3 2 3
The x-intercept is (–2, 0).
The y-intercepts are (0, 2) and (0, –2).
The graph intersects the x-axis at (–2, 0).
The graph intersects the y-axis at (0, 2) and at (0, –2).

Copyright © by Houghton Mifflin Company, Inc. All rights reserved. 15
Graphical Tests for Symmetry
• A graph is symmetric with respect to the y-axis if, whenever (x, y) is on the graph, (-x, y) is also on the graph. As an illustration of this we graph y = x2

Copyright © by Houghton Mifflin Company, Inc. All rights reserved. 16
Graphical Tests for Symmetry
• A graph is symmetric with respect to the x-axis if, whenever (x, y) is on the graph, (x, -y) is also on the graph. As an illustration of this we graph y2 = x.

Copyright © by Houghton Mifflin Company, Inc. All rights reserved. 17
Graphical Tests for Symmetry• A graph is symmetric with respect to the origin if,
whenever (x, y) is on the graph, (-x, -y) is also on the graph. As an illustration of this we graph y = x3

Copyright © by Houghton Mifflin Company, Inc. All rights reserved. 18
Algebraic Tests for Symmetry
• The graph of an equation is symmetric with respect to the y-axis if replacing x with –x yields an equivalent equation.
• The graph of an equation is symmetric with respect to the x-axis if
replacing y with –y yields an equivalent equation. • The graph of an equation is symmetric with respect to the origin if
replacing x with –x and replacing y with –y yields an equivalent equation.
The algebraic tests for symmetry are as follows:
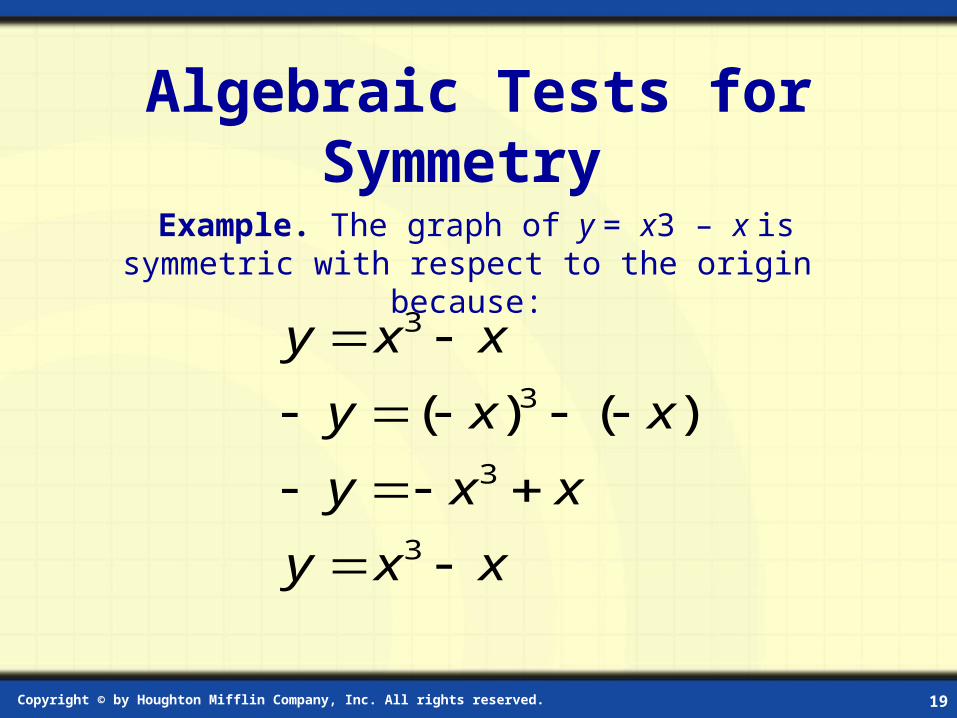
Copyright © by Houghton Mifflin Company, Inc. All rights reserved. 19
Algebraic Tests for Symmetry
Example. The graph of y = x3 – x is symmetric with respect to the origin because:
xxy
xxy
xxy
xxy
3
3
3
3
)()(

Copyright © by Houghton Mifflin Company, Inc. All rights reserved. 20
Circles A circle with center at (h, k) and radius r consists of all points (x, y) whose distance from (h, k) is r. From the Distance Formula, we have the standard equation of a circle as:
222
22
)()(
)()(
rkyhx
rkyhx

Copyright © by Houghton Mifflin Company, Inc. All rights reserved. 21
Circles Example. Find the standard form of the equation of the
circle with center at (2, -5) and radius 4.
(x-2)2+(y-(-5))2=42
or (x-2)2+(y+5)2=16