
Digital Industrial Company - General Electric 2 3 4 5 GE today Simple + stronger Industrial core...
41
Imagination at work J. R. Immelt December 14, 2016 Digital Industrial Company Caution Concerning Forward-Looking Statements: This document contains "forward-looking statements" – that is, statements related to future events that by their nature address matters that are, to different degrees, uncertain. For details on the uncertainties that may cause our actual future results to be materially different than those expressed in our forward-looking statements, see http://www.ge.com/investor-relations/disclaimer-caution-concerning-forward-looking-statements as well as our annual reports on Form 10-K and quarterly reports on Form 10-Q. We do not undertake to update our forward-looking statements. This document also includes certain forward-looking projected financial information that is based on current estimates and forecasts. Actual results could differ materially. Non-GAAP Financial Measures: In this document, we sometimes use information derived from consolidated financial data but not presented in our financial statements prepared in accordance with U.S. generally accepted accounting principles (GAAP). Certain of these data are considered “non- GAAP financial measures” under the U.S. Securities and Exchange Commission rules. These non-GAAP financial measures supplement our GAAP disclosures and should not be considered an alternative to the GAAP measure. The reasons we use these non-GAAP financial measures and the reconciliations to their most directly comparable GAAP financial measures are posted to the investor relations section of our website at www.ge.com . General Electric Capital Corporation (GECC) has been merged into GE and our financial services business is now operated by GE Capital Global Holdings LLC (GECGH). In this document, we refer to GECC and GECGH as “GE Capital”. We refer to the industrial businesses of the Company including GE Capital on an equity basis as “GE”. “GE (ex-GE Capital)” and /or “Industrial” refer to GE excluding GE Capital. Our financial services segment previously referred to as GE Capital is now referred to as Capital. GE’s Investor Relations website at www.ge.com/investor and our corporate blog at www.gereports.com, as well as GE’s Facebook page and Twitter accounts, contain a significant amount of information about GE, including financial and other information for investors. GE encourages investors to visit these websites from time to time, as information is updated and new information is posted.
Transcript of Digital Industrial Company - General Electric 2 3 4 5 GE today Simple + stronger Industrial core...

Imagination at work
J. R. Immelt
December 14, 2016
Digital Industrial Company
Caution Concerning Forward-Looking Statements: This document contains "forward-looking statements" – that is, statements related to future events that by their nature address matters that are, to different degrees, uncertain. For details on the uncertainties that may cause our actual future results to be materially different than those expressed in our forward-looking statements, see http://www.ge.com/investor-relations/disclaimer-caution-concerning-forward-looking-statements as well as our annual reports on Form 10-K and quarterly reports on Form 10-Q. We do not undertake to update our forward-looking statements. This document also includes certain forward-looking projected financial information that is based on current estimates and forecasts. Actual results could differ materially.
Non-GAAP Financial Measures:In this document, we sometimes use information derived from consolidated financial data but not presented in our financial statements prepared in accordance with U.S. generally accepted accounting principles (GAAP). Certain of these data are considered “non-GAAP financial measures” under the U.S. Securities and Exchange Commission rules. These non-GAAP financial measures supplement our GAAP disclosures and should not be considered an alternative to the GAAP measure. The reasons we use these non-GAAP financial measures and the reconciliations to their most directly comparable GAAP financial measures are posted to the investor relations section of our website at www.ge.com.
General Electric Capital Corporation (GECC) has been merged into GE and our financial services business is now operated by GE Capital Global Holdings LLC (GECGH). In this document, we refer to GECC and GECGH as “GE Capital”. We refer to the industrial businesses of the Company including GE Capital on an equity basis as “GE”. “GE (ex-GE Capital)” and /or “Industrial” refer to GE excluding GE Capital. Our financial services segment previously referred to as GE Capital is now referred to as Capital. GE’s Investor Relations website at www.ge.com/investor and our corporate blog at www.gereports.com, as well as GE’s Facebook page and Twitter accounts, contain a significant amount of information about GE, including financial and other information for investors. GE encourages investors to visit these websites from time to time, as information is updated and new information is posted.

2
Framing 2017 + 2018
+ Most optimistic we have been about U.S. economy in many years … reform + general economic growth; in addition, a lot of our markets are quite good
- Oil market is tougher than we envisioned on 4/15 … has put pressure on our business & some of our markets … pricing has stabilized
A few things I want you to know about GE
Alstom & Baker Hughes are good deals
Digital & Additive are gamechangers … GE is (way) out front
Digital & Alstom have given us new ideas on how to run GE more productively
We still see big opportunities in being a global company
We all get rewarded @ $2 EPS in 2018
1
2
3
4
5
3
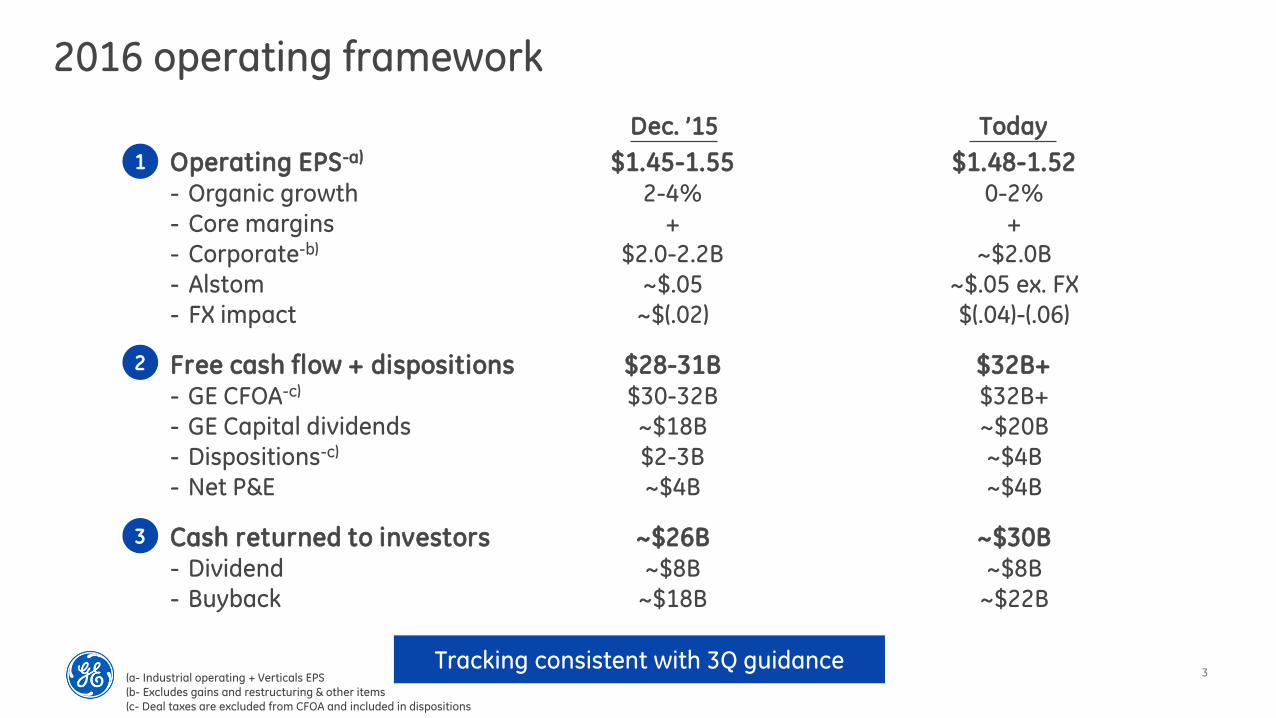
2016 operating framework
Operating EPS-a) $1.45-1.55 $1.48-1.52- Organic growth 2-4% 0-2%
- Core margins + +
- Corporate-b) $2.0-2.2B ~$2.0B
- Alstom ~$.05 ~$.05 ex. FX
- FX impact ~$(.02) $(.04)-(.06)
Free cash flow + dispositions $28-31B $32B+- GE CFOA-c) $30-32B $32B+
- GE Capital dividends ~$18B ~$20B
- Dispositions-c) $2-3B ~$4B
- Net P&E ~$4B ~$4B
Cash returned to investors ~$26B ~$30B- Dividend ~$8B ~$8B
- Buyback ~$18B ~$22B
1
2
3
(a- Industrial operating + Verticals EPS (b- Excludes gains and restructuring & other items(c- Deal taxes are excluded from CFOA and included in dispositions
Dec. ’15 Today
Tracking consistent with 3Q guidance

4
GE is uniquely positioned
2017 outlook
Premium Industrial businesses
+ Essential … builds,
powers, moves, cures
+ Valuable … foundation of
GE Store
Leadership in analytics
& software for assets
Leadership in next
generation manufacturing
Leading today Tomorrow+
New levels of productivity for GE,
our customers & the world
Build a strong Digital Industrial company
Invest in GE Store … a performance & competitive differentiator
Position to hit $2 EPS in 2018 despite oil & gas headwinds
1
2
3
5
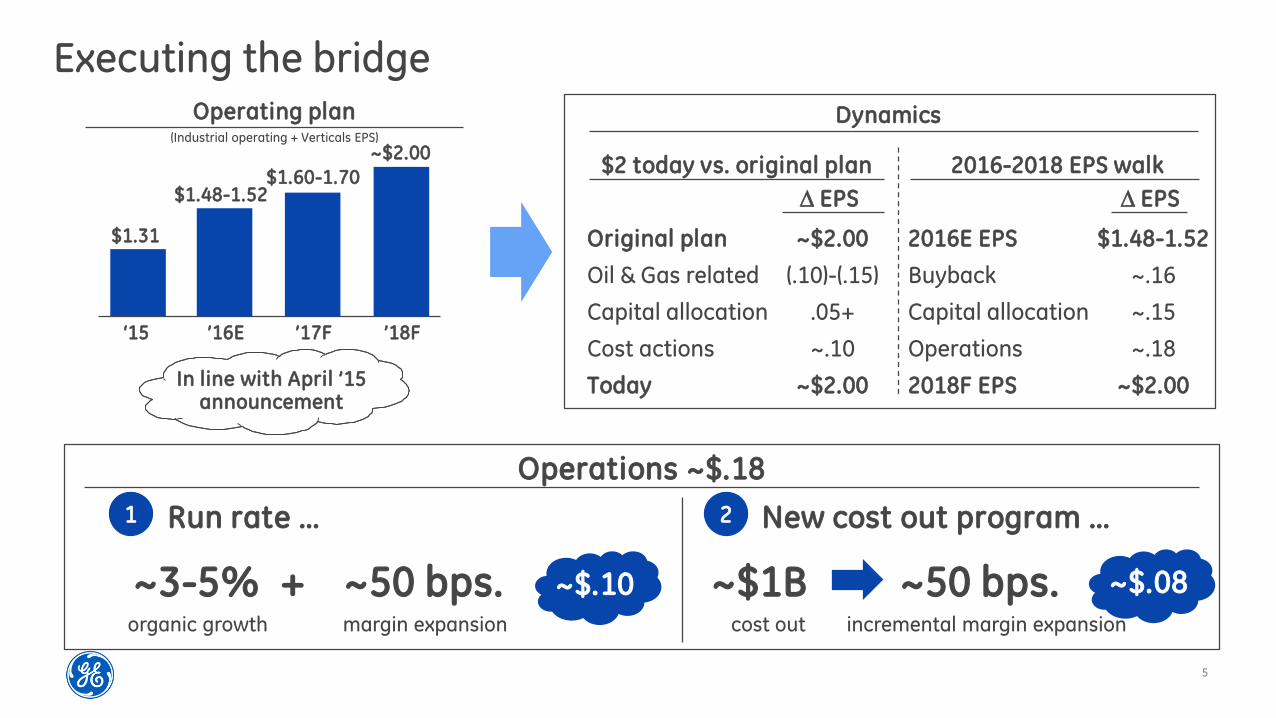
Executing the bridge
$1.31
Operating plan
‘15
$1.48-1.52
’16E
$1.60-1.70
’17F
Dynamics
Operations ~$.18
~$2.00
’18F
Original plan ~$2.00
Oil & Gas related (.10)-(.15)
Capital allocation .05+
Cost actions ~.10
Today ~$2.00In line with April ’15 announcement
∆ EPS
$2 today vs. original plan
2016E EPS $1.48-1.52
Buyback ~.16
Capital allocation ~.15
Operations ~.18
2018F EPS ~$2.00
∆ EPS
2016-2018 EPS walk
~$.10organic growth
~3-5%margin expansion
~50 bps.+ ~$.08
cost out
~$1B
Run rate … New cost out program …
incremental margin expansion
~50 bps.
1 2
(Industrial operating + Verticals EPS)

6
Most valuable Industrial portfolio
Invest in digital capability+ Drive Predix, APM, thread
Strengthen core businesses+ Alstom+ Baker Hughes
Capture supply chain value
Execute GE Capital pivot
Simplify portfolio
Investing
1
2
3
4
5
GE today
Simple + strongerIndustrial core
Deeper GE Store
Digital
+
+
Simplifying
Additive+

7
Leadership businesses
Strong portfolio Portfolio value creation
Revenue
~$135B
Op profit
~$19B+
• Leadership businesses in big
ecosystems
• Win with big technical launches
• Diversified model … services, product,
geography
• Expanding margins & returns
+ Execute big deals that strengthen the core …
deliver growth & synergies
+ Create the leading Digital Industrial
+ Invest in manufacturing leadership & recapture
supply chain value … lead in Additive
+ Embrace “build + buy” in fast-growth segments
Exit businesses where others can run better
Evolve toward an industrial balance sheet …
creates incremental leverage
(2017 Industrial segments + Corporate + Verticals)

8
Baker Hughes, a GE Company
Strong returns for GE + Baker Hughes
GE EPS impact
~$(.02)
~$.04
~$.08
’17F ’18F ’20F
+ Competitive industry player: Unmatched capability Customer value Diversified in cycle
+ GE Store adds value: Digital/operational Global scale
+ Multiple ways to create investor value: Earnings growth Balanced through cycles
Investment impact
Extendedscope
Technology+
Predix
+ Productivity leader in Oil & Gas industry … customer support
+ Substantial cost & revenue synergies
+ Right time in cycle … capitalize on recovery
Creating “full-stream” capability
The Baker Hughes transaction is subject to customary closing conditions, including approval by regulators and Baker Hughes shareholders.
9
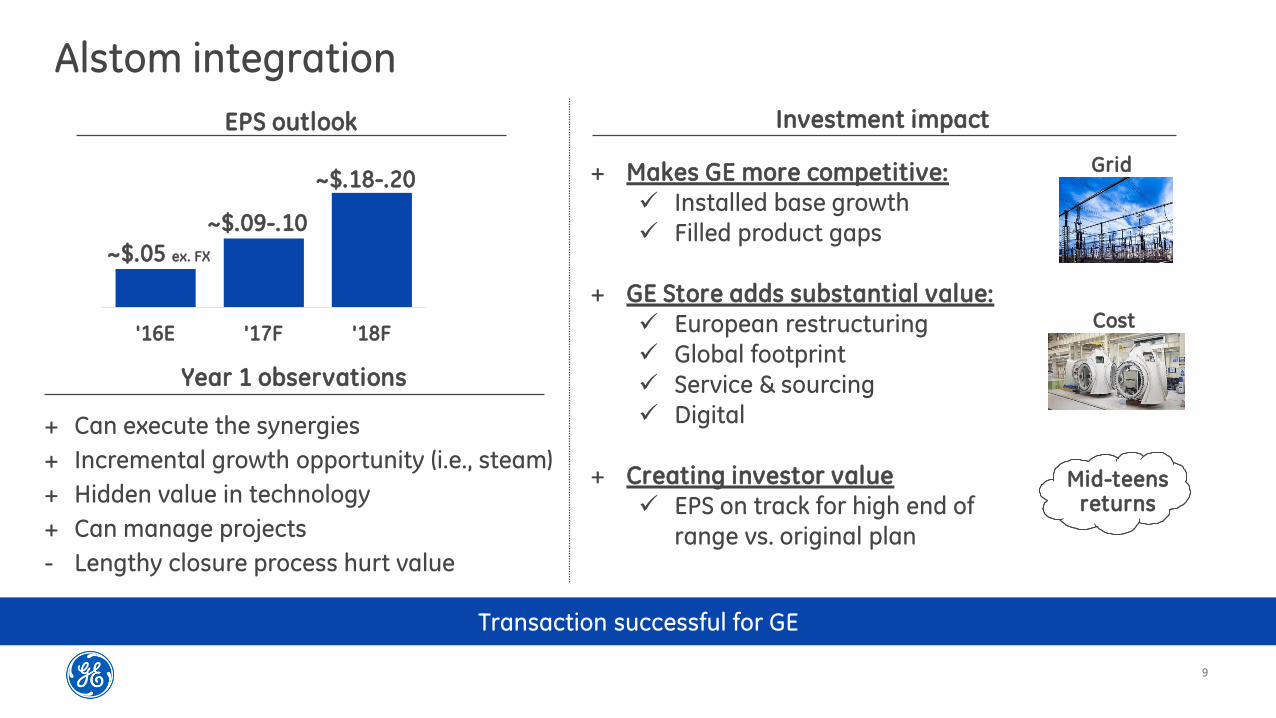
Year 1 observations
+ Can execute the synergies
+ Incremental growth opportunity (i.e., steam)
+ Hidden value in technology
+ Can manage projects
- Lengthy closure process hurt value
Grid
Cost
Alstom integration
'16E '17F '18F
EPS outlook
~$.05 ex. FX
~$.09-.10
~$.18-.20 + Makes GE more competitive:
Installed base growth
Filled product gaps
+ GE Store adds substantial value:
European restructuring
Global footprint
Service & sourcing
Digital
+ Creating investor value
EPS on track for high end of
range vs. original plan
Investment impact
Transaction successful for GE
Mid-teensreturns

10
Digital Industrial leader
2017F orders
Total
$8B+
Predix-powered + software
$5B+
Priorities for 2017
Accelerate Predix adoption … build scale
Grow APM & digital thread
Generate productivity for GE & customers
1
2
3
Metrics improving
Developers 20K 35K+
Partners 300+ ~500
Reference customers 50 ++
Predix-powered orders $300MM $1B+
Productivity $500MM $700MM
’17F’16E+20-30%
11
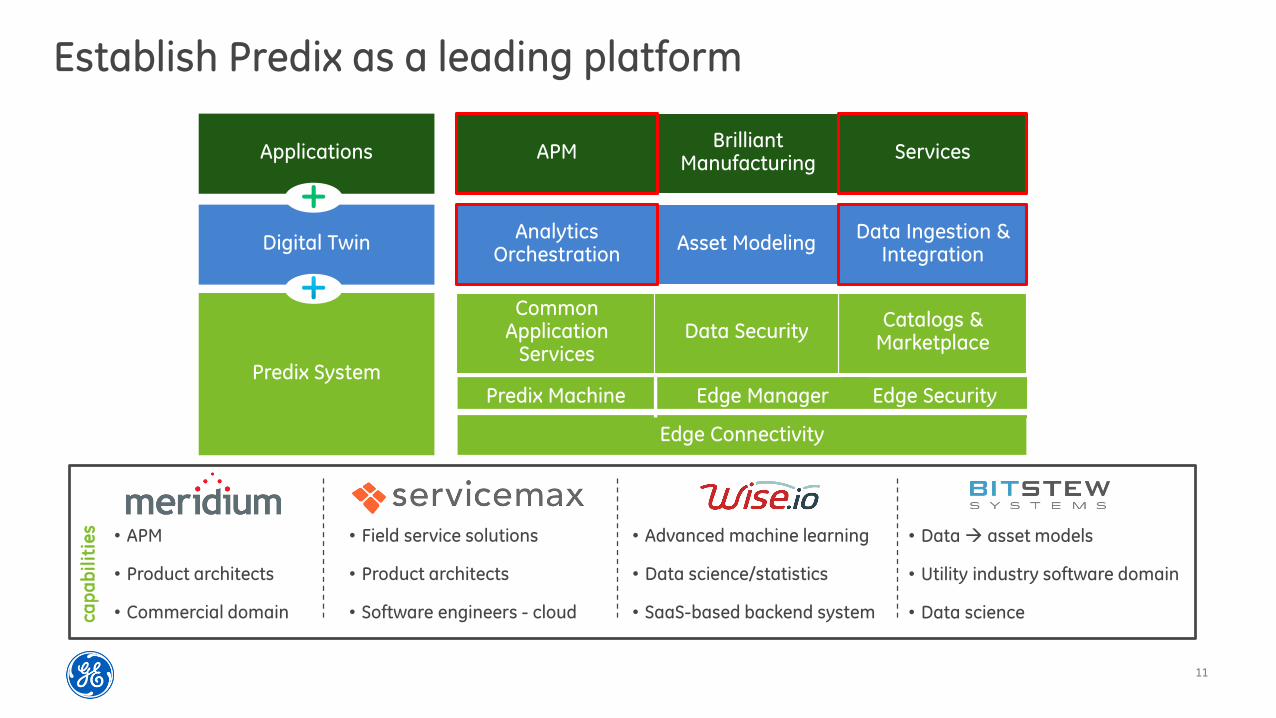
Establish Predix as a leading platform
Asset Modeling
BrilliantManufacturing
Edge Connectivity
CommonApplication
Services
Catalogs & Marketplace
Predix System
Data Security
Digital Twin
Applications
+
Predix Machine Edge Manager Edge Security
AnalyticsOrchestration
Data Ingestion & Integration
APM Services
cap
ab
ilit
ies • APM
• Product architects
• Commercial domain
• Field service solutions
• Product architects
• Software engineers - cloud
• Advanced machine learning
• Data science/statistics
• SaaS-based backend system
• Data asset models
• Utility industry software domain
• Data science

12
Asset performance management
OPERATIONS OPTIMIZATION
Customer KPICurrent
potential 2H’17
Startup fuel -10% -20% -30%
Heat rate -1.0% -1.5% -2.0+%
Capacity +3-4% +4-5% +5-6%
Total plant availability
+1% +2% +3%
Starting reliability +5% +7% +10%
Ga
s/S
tea
mG
as
Heat rate +0.75% +1.0% +1.25%
Emissions -10% -15% -20%
ASSET PERFORMANCE MANAGEMENT
Delivers outcomes (Power example)
2018+
Industrial internet … physical + digital outcomes
Every GE business has a “value framework” for APM
Digital
Twin
Meridium
(Non-GE)
Apps
catalog
+
+
CSA
Software/SAAS
Microservice
Outcome models
Upgrades
Customer delivery

13
Digital service market
GE leads in service content
ServiceMax offers a gateway to customers … 400 customers, $/customer
Accelerate GE service productivity
1
2
Large value pool
$25B+
Digital services market
Assets
DIGITAL TWIN
ASSET PERFORMANCEMANAGEMENT
GE Digital Portfolio Digital Thread Services
ServiceMax
AssetPassport
FieldVision
SmartShop
SmartCMR
ServiceCycle
cases
alerts
CBM data
asset data
config
context
3
GE content

14
• Predix running on Azure - 2017 launch
• Hololens & other Microsoft tech. to be Predix compatible
• 1K developers trained on Predix in ’16
• 50+ Predix-based apps/micro-services in TCS Digital Store
Foundries
4+
Hubs
8+
Early examples
• Reliance providing connectivity infra. in India through Jio
• Develop joint IoT solutions on Predix
Win the ecosystem Build the infrastructure
Ops centers
7+
Driving
Paris• >150 unique visits; >1,600 visitors
• BPI, Numa, 4 university partnerships
Shanghai• >150 unique visits; >3,700 visitors
• Customer solutions: CT, Huawei, Comac
New Orleans
• Home to “FieldVision” & other services products
• 200+ software engineers & growing
Value of scale
Customer co-development … more value in IB
Partners2017F
~500
Link internal with external
+ Speed to market+ New industries
15
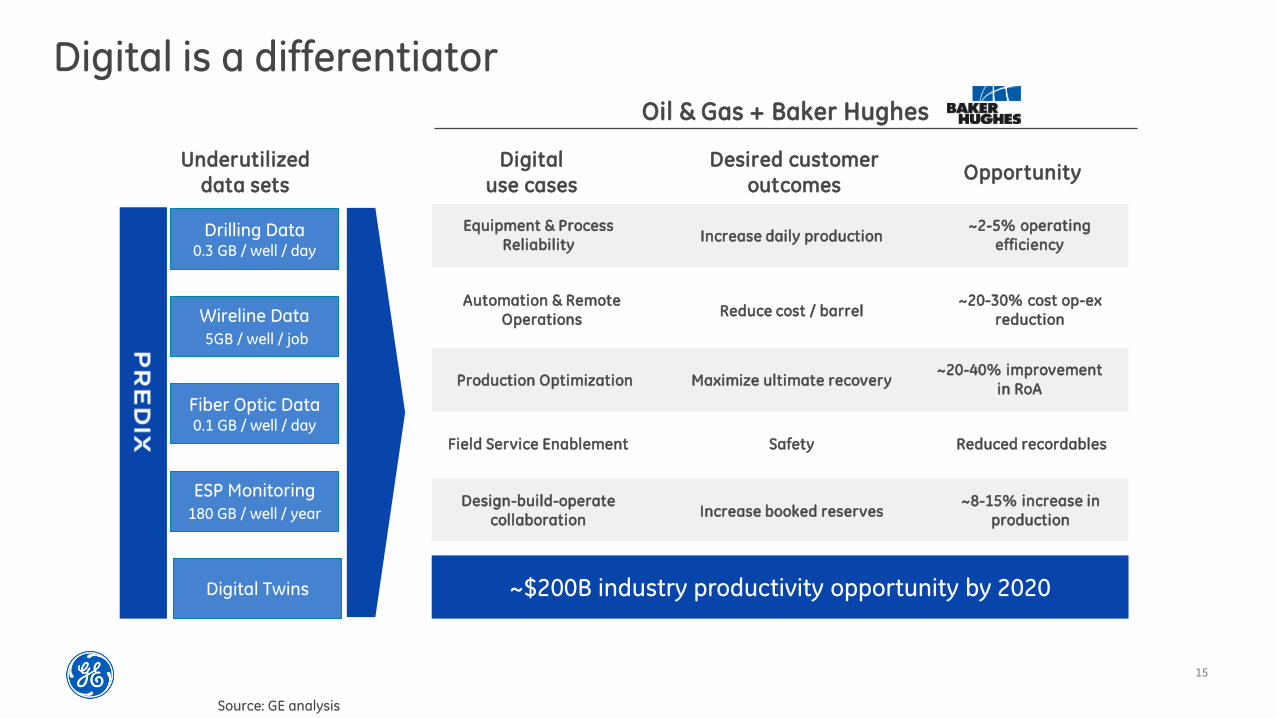
Digital is a differentiator
Source: GE analysis
Oil & Gas + Baker Hughes
Underutilized
data sets
Digital
use cases
Desired customer
outcomesOpportunity
Equipment & Process Reliability
Automation & Remote Operations
Production Optimization
Field Service Enablement
Design-build-operate collaboration
Increase daily production
Reduce cost / barrel
Maximize ultimate recovery
Safety
Increase booked reserves
~2-5% operating efficiency
~20-30% cost op-ex reduction
~20-40% improvement in RoA
Reduced recordables
~8-15% increase in production
~$200B industry productivity opportunity by 2020Digital Twins
ESP Monitoring180 GB / well / year
Fiber Optic Data 0.1 GB / well / day
Wireline Data5GB / well / job
Drilling Data0.3 GB / well / day

16
Manufacturing: Backward integration
Insourcing value creation
Generators
+ Power Conversion driving NPI
to serve Power & Renewables
+ 40% 90% internal make
+ Utilize Alstom technology
~$0.8B annual buy
Investment castings
+ 100% outsourced pre-2016
+ Developing internal capability
+ Utilize additive potential
+ METEM acquisition
~$2.0B annual buy
Significant presence,
technology and global
footprint
Leading manufacturing &
design capabilities
Financial & strategic benefits
Margin recapture opportunity
Drives performance
Supply chain capacity and flexibility
Blades 25% of cost
Gearbox 15% of cost
Towers22% of cost
Provides GE with integrated
blade capability
HRSG/Boiler
+ Plant efficiency/output
+ Insourcing capability
+ Doosan acquisition
30+/year
w/ Alstom
Will add ~$.02-.03 EPS by 2018

17
Manufacturing: leadership in additive
• Location: Germany
• Revenue 2016: ~$100M• Products: Metal Additive machines
(Laser technology)• Industries: Aerospace, Medical, Auto, Jewelry
• Location: Sweden• Revenue 2016: ~$70MM-a)
• Products: Metal Additive machines
(Electron Beam technology)• Industries: Aerospace, Medical, Auto, Tooling
~$1.5BProductivity
• Machine technology• Additive repairs• Analytics & Control
2010–2016E
Leverage GE investments
Materials• Process modelling• Powder recovery/reuse• Material science
Digital• Brilliant factory
Harnessing the GE Store
Global Research Centers
GE Digital
Additive Development Centers
Additive Production Facilities
GE Advanced Manufacturing Works
(a- consensus estimate

18
Additive business plan
2017F 2018F
~$300MM
~$500MM
~330 ~550Machines (#)
Build a market-a) Internal productivity
$3-5B
15
500+
Cost out
productivity
2017F 2020F
# Engineers 100 300
# Products 7 12
Financing Limited Full
GE revenues
(a- Based on GE pro-forma estimates
Accelerating internal deployment
Design tiger team
Use cases
New products
Scale
Before With GE
CT Collimator HA Shroud
A-CT7 Frame
Production parts (#)

19
GEnx example ... a proxy for systems level thinking
1000 mm
800 mm
600 mm
450 mm
250 mm
Machine size
Phase 1Re-design existing parts for additive
Phase 2Design new parts and systems for additive
• Turbine center frame
• HPT shrouds• HPC case treatment
• Fan OGV heat exchanger
Developing a process that we will institutionalize and adopt across all businesses
• Fan platform
• HPC cases• HPT shroud hangers
• HPT case

20
Buy + build
Enrich & isolate Activate, modify, expand Harvest
Build out closed unit operations connect digitize
GE Solution … developed @ GRC
Revenue
$4.2B
Growth ~10%
Margins 25%+
FCF conv. 1.3xService +
collection
work flow
Building a position in cell therapy ($1B by 2025)
GE Store leverage:
Global build out
GRC impact
Service expansion
Industrial finance
Buy + build strategy
Amersham foundation
+ 8 bolt-ons
2
3
1 Organic build … launch Harvester, media, separators … reagent portfolio
Buy niche technologies … BioSafe
Partner: Vitruvian Networks … service model JV with cancer centers
(Mayo + Parker)
Create value through buy + buildPerformance > industry
Life Sciences
21
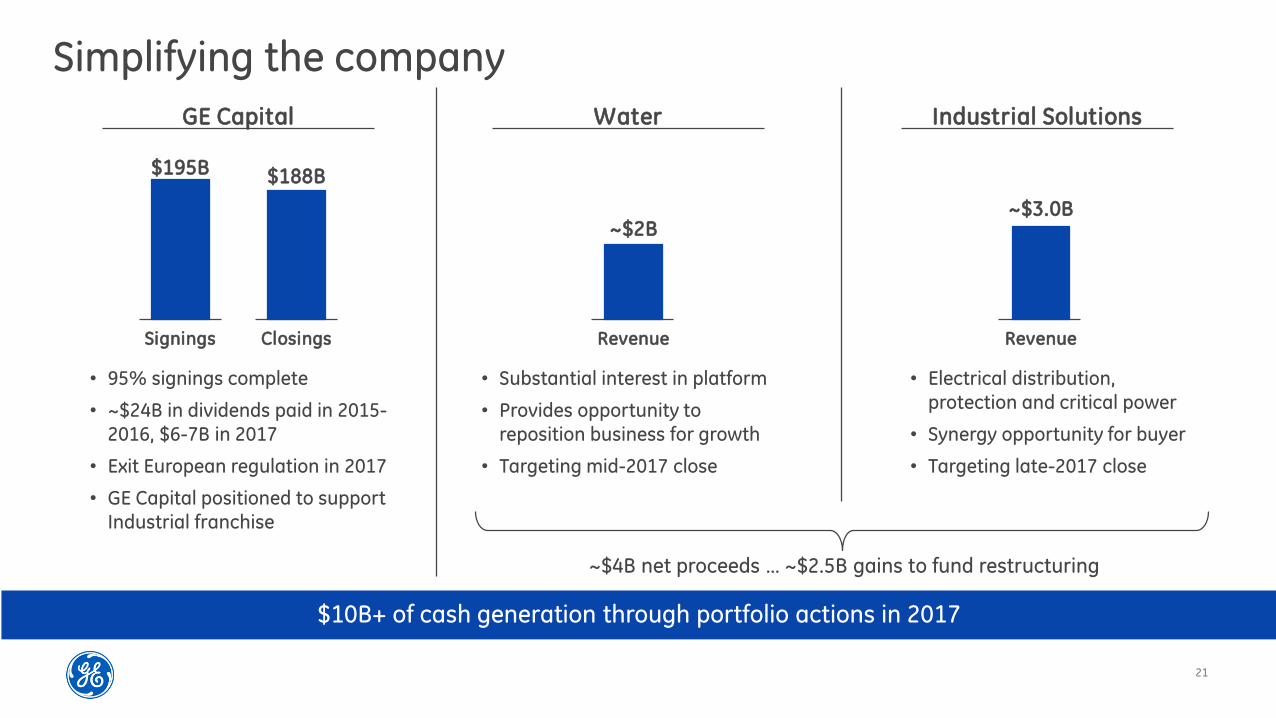
Simplifying the company
GE Capital
• 95% signings complete
• ~$24B in dividends paid in 2015-2016, $6-7B in 2017
• Exit European regulation in 2017
• GE Capital positioned to support Industrial franchise
Signings
$195B
$10B+ of cash generation through portfolio actions in 2017
Closings
$188B
Water
• Substantial interest in platform
• Provides opportunity to reposition business for growth
• Targeting mid-2017 close
Revenue
~$2B
Revenue
~$3.0B
Industrial Solutions
• Electrical distribution, protection and critical power
• Synergy opportunity for buyer
• Targeting late-2017 close
~$4B net proceeds … ~$2.5B gains to fund restructuring

22
2016E-2018F cash uses
($ in billions)
Capital allocation
2016E-2018F cash sources
~$115
Cash available
Industrial CFOA … team aligned to FCF conversion
Capital dividends … $20B in ’16, $6-7B in ’17, remainder in ’18
Dispositions generating cash … drive value creation
Cash uses
~$115
Attractive dividend payout … yield > peers
M&A improves competitiveness; buyback from dispositions (~$4B in 2017)
Pension funding: ’16 $0.3, ’17F $1.8, ’18F ~$1.7
2015-2018 buyback program $55B-a) $61-63B
Organic investments
Dividend
Buyback (GECC)
Pension funding
Parent cash
~$10B of unallocated capital
~20 leverage
M&A + Buyback(ex. GECC dividend)
Announced M&A
Baker Hughes
M&A + Buyback (ex GECC)
Increased buyback
Unallocated10
8
7
8
~$34~34
~95 ~81
Industrial CFOA
Capital dividends
Disposition proceeds
Parent cash
Unallocated capitalM&A/buyback $10+ Leverage 20Original plan $30+ Water/Ind. Solutions 4New plan $34
(a- Including Synchrony exchange

23
Power
Combustion, services, global reach
Renewables
Policy, materials, solutions, GE2GE
Oil & Gas
Global reach, solutions, localization
Energy Efficiency
Current, controls, GE2GE, LED
Healthcare
Imaging, biology, global reach, services,
capability
Aviation
Materials, manufacturing, services, global reach,
additive
Transportation
Engine technology, localization
Capital
Project finance,capex opex
GE Digital
Ecosystem of productivity through industrial
analytics & software
Global researchGlobal footprint
Global OperationsPredix operating system
Industrial financeLeadership & culture
Additive manufacturing ecosystem
“Platforms”
Leverage the value of the GE Store
24
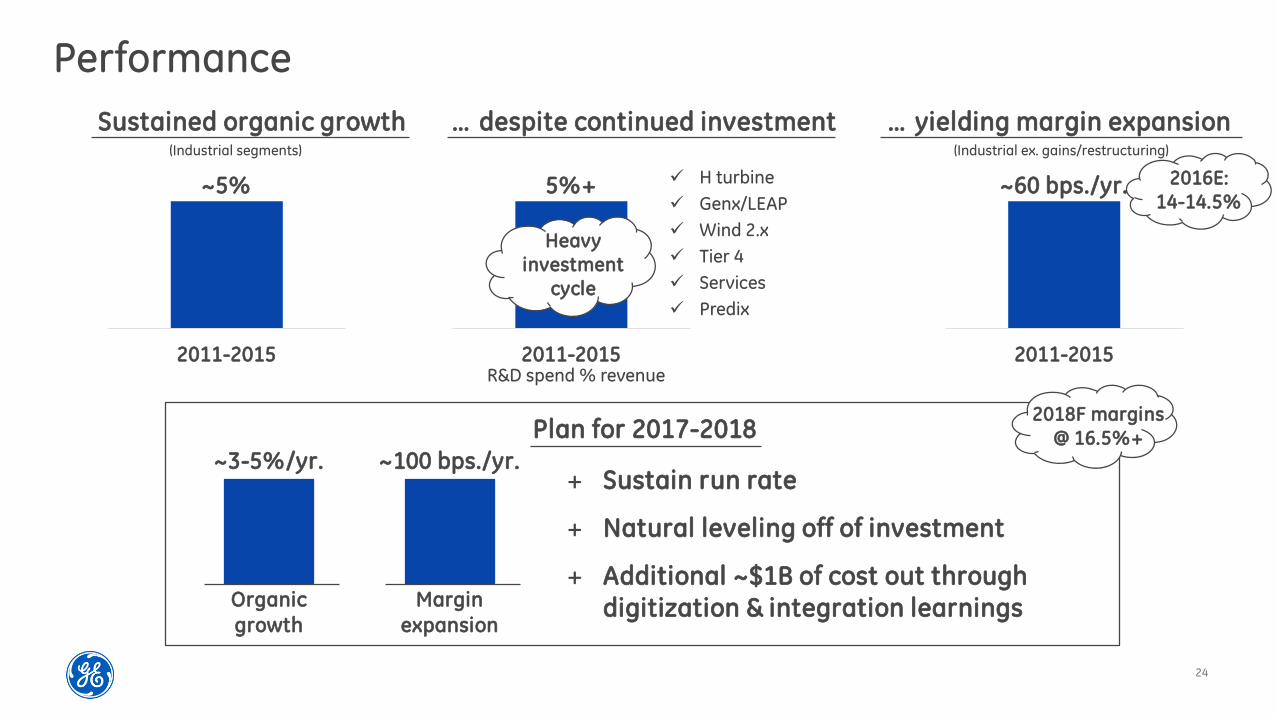
Performance
… despite continued investmentSustained organic growth
H turbine
Genx/LEAP
Wind 2.x
Tier 4
Services
Predix
R&D spend % revenue2011-2015
~5%
2011-2015
5%+
… yielding margin expansion(Industrial ex. gains/restructuring)
2011-2015
~60 bps./yr.
~3-5%/yr.
Organic
growth
~100 bps./yr.
Margin
expansion
Plan for 2017-2018
2016E: 14-14.5%
+ Sustain run rate
+ Natural leveling off of investment
+ Additional ~$1B of cost out through digitization & integration learnings
2018F margins @ 16.5%+
Heavy investment
cycle
(Industrial segments)

25
Technical leadership
R&D + capex+ digital
$10B+
Big launches
More NPIs in pipeline
Alstom integration
Digital investment
Innovate at scale … big launches with differentiated manufacturing
Own design value
Global execution & development
Spend efficiency
Store value
Delivering
renewable grid
parity
Extending
world record
efficiency
leadership
65% CC GT
Industry
leading speed
to diagnosis
Plug & Play MRI
Doubling
production of
traditional oil
& gas wells
2X Well
3¢ Wind
Delivering science-based sustainable differentiation
The next
performance
breakthrough
Hybrid Electric
Lowest cost
electrical
architecture
enabled by SiC
SiC MVDC Solar
Product Breakouts
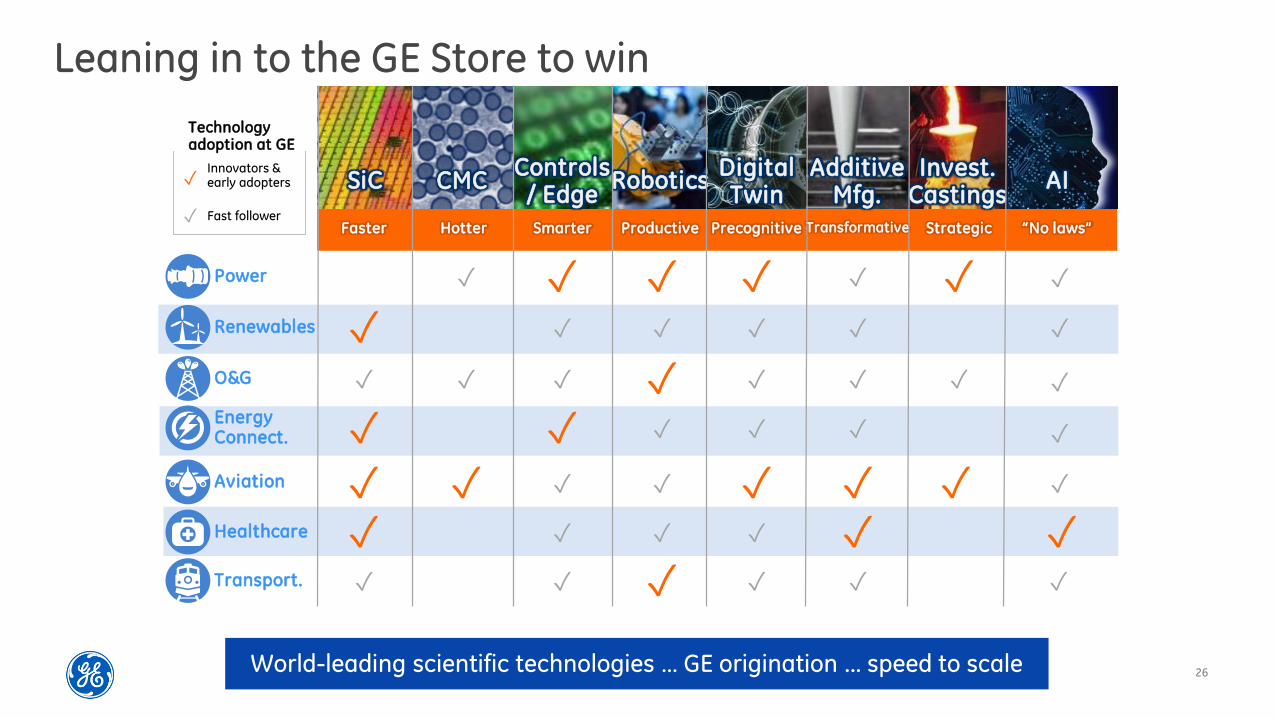
26World-leading scientific technologies … GE origination ... speed to scale
Leaning in to the GE Store to win
Power
Aviation
Transport.
Healthcare
Energy Connect.
Renewables
O&G
SiC CMCControls
/ EdgeRobotics
AdditiveMfg.
Invest.Castings
DigitalTwin
HotterFaster Smarter Productive Precognitive Transformative Strategic
Innovators &early adopters
✓
✓
✓
✓
✓
✓
✓
✓
✓
✓
✓
✓
✓
✓ ✓
✓
✓
✓
✓
✓
✓
✓
✓
✓
✓
✓
✓
✓ ✓
✓
✓ ✓
✓
✓
Fast follower✓
Technologyadoption at GE
✓
✓
✓
✓
✓✓
✓
“No laws”
Invest.CastingsAI
✓✓ ✓
✓
✓
✓
✓

27
~$235B
Services
Backlog
~$53B
Revenue
~5%
AAGR(5 year)
Growth drivers
+ Software as a service+ Upgrades+ Customer outcomes+ Global capability+ Expanding market
GE Store: Predix, shared productivity,tools, repairs, global footprint
Global scale
~$230B
Backlog
~$68B
Revenue
~5%
AAGR(5 year)
Growth drivers
+ Strong Infrastructure needs+ New frontiers+ Energy transition+ Local content+ Project financing
Growth initiatives
GE Store: infrastructure, brand &partners, projects, financing
GE2GE sourcing
Enabled orders
$10B+
2015
$2.5B
2018F
~$5BEnergy infrastructure
Leading aircraft lessor
Industrial … Capex Opex
Margins & growth
Leverages Alstom capacity
Benefits Energy Connections
SolutionsFinancing
2X
28
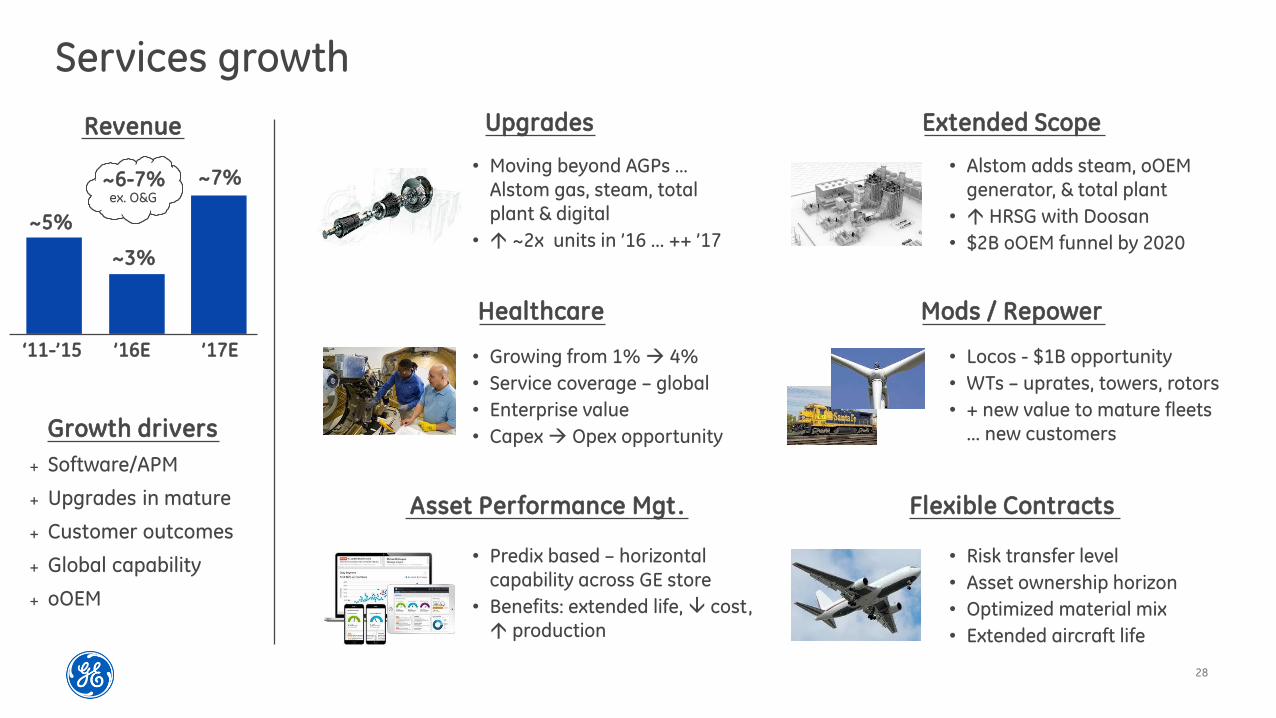
Services growth
Revenue
~3%
’16E
~7%
’17E
Growth drivers
+ Software/APM
+ Upgrades in mature
+ Customer outcomes
+ Global capability
+ oOEM
Upgrades Extended Scope
Flexible Contracts
Healthcare Mods / Repower
Asset Performance Mgt .
• Alstom adds steam, oOEMgenerator, & total plant
• HRSG with Doosan
• $2B oOEM funnel by 2020
• Moving beyond AGPs … Alstom gas, steam, total plant & digital
• ~2x units in ’16 ... ++ ’17
• Growing from 1% 4%
• Service coverage – global
• Enterprise value
• Capex Opex opportunity
• Locos - $1B opportunity
• WTs – uprates, towers, rotors
• + new value to mature fleets ... new customers
• Predix based – horizontal capability across GE store
• Benefits: extended life, cost, production
• Risk transfer level
• Asset ownership horizon
• Optimized material mix
• Extended aircraft life
~5%
‘11-’15
~6-7%ex. O&G

29
Global growth
’16E-a) ’17F
Europe ++ +
Japan/Korea ++ +
China + +
India ++ ++
ASEAN + +
LATAM - +
MENAT ++ ++
SS Africa ++ ++
Global Wind … quoting 25GW deals
• Emerging growth segments in India, LATAM & MENAT
• Expanded product range & commercial footprint
• Driving services growth with repower & digital
Gas-to-power … unique GE solution
• Fuel solutions enabling large pipeline of power projects
• $4B opportunities in Bangladesh, Nigeria, S. Africa
Global Rail … quoting $6B+ global deals
• Expanding globally … India, South Africa, Brazil, Russia, CIS
• Supply chain repositioning and product management
Healthcare … China & India +10%
• “Affordable Care Portfolio” … launches
• Shift to value / super-value segments …
matching portfolio with evolving market needs
(Revenue)
(a- 2016 includes Alstom
30
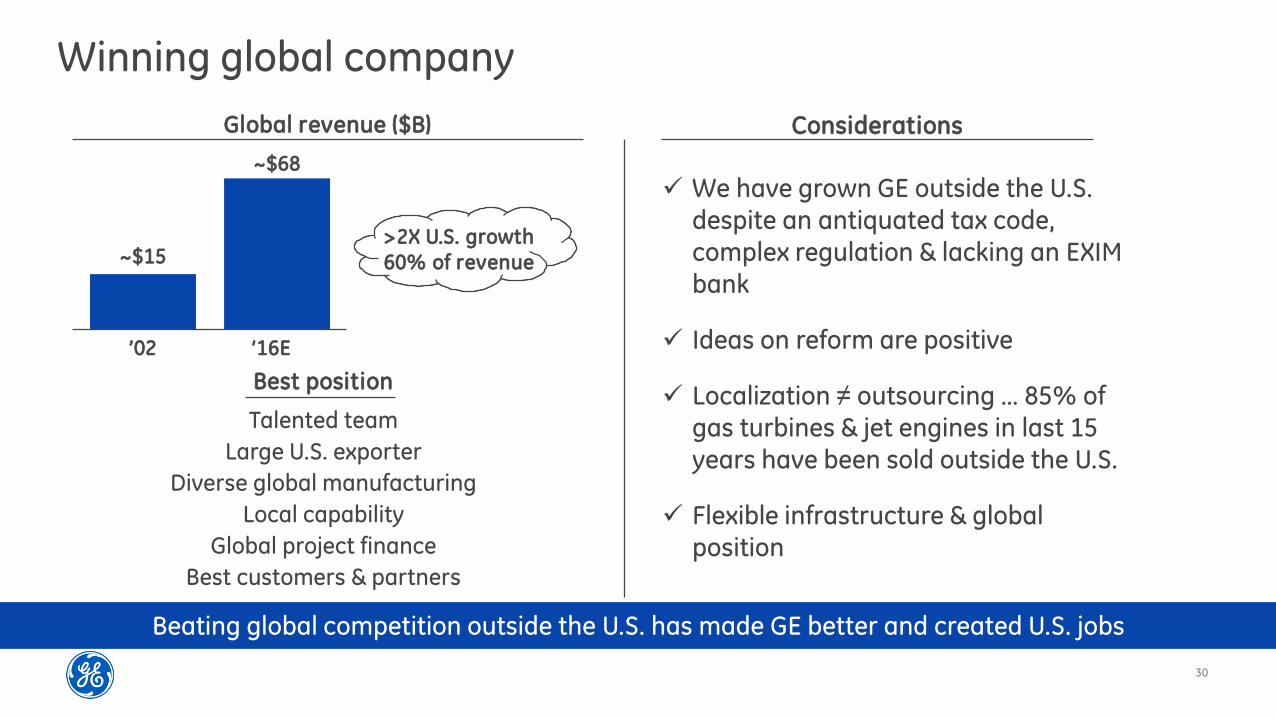
Winning global company
’02
ConsiderationsGlobal revenue ($B)
Talented team
Large U.S. exporter
Diverse global manufacturing
Local capability
Global project finance
Best customers & partners
Best position
~$15
~$68
>2X U.S. growth
60% of revenue
’16E
We have grown GE outside the U.S. despite an antiquated tax code, complex regulation & lacking an EXIM bank
Ideas on reform are positive
Localization ≠ outsourcing … 85% of gas turbines & jet engines in last 15 years have been sold outside the U.S.
Flexible infrastructure & global position
Beating global competition outside the U.S. has made GE better and created U.S. jobs

31
Cost program
What’s incremental …What’s in the run rate …
+ Product & service costs
+ Factory & services productivity
+ Digital thread/brilliant factories
+ Vertical integration
+ NPI launch cycle (H, LEAP)
+ Acquisition integration
+ Lower SG&A/Corporate
+ Global operations/shared services
Digitization
+ Revenue offsetting Digital spend+ SG&A productivity
+ Horizontal IT+ Corporate+ Leaner segment structure+ Functional productivity
Integration learnings
+ Factory consolidation+ R&D productivity/requisition eng.
Additive manufacturing
Will continue to run the play … actions enable
~50 bps. margin expansion per year
Specific list of actions to enable additional
~50 bps. of margin expansion in 2017 + 2018
1 2
~$200
~$450
~$500
~$100~$400
+
($ in millions)

32
Acquisition integration
• Supplier negotiations
• Big data “should cost”
• GE2GE optimization
Services expansion Product learning curve
Capturing deflation Smaller CorporateGlobal Operations
• Leveraging scale + speed to drive cost-out
• ~5% cost productivity annually
• Process automation & standardization
Cost actions in the run rate
'14 '15 16E
$1.1$1.5
~$1.8
• Analytical tools
• Digital Thread
• Parts life optimization
• Field services & repairs productivity
Material deflation
'14 '15 16E
$0.5 $0.6
~$1
Services productivity
($ in billions)
• Demonstrated ability to achieve synergies
• Capturing profit pools via vertical integration
• Accretive to margins post-integration
65%Target for processes
in shared services
• Moving authority to segments
• Aligned to GE store
• Reducing org. layers
• High return growth investments
Corporate cost
'11 '16E Goal
$2.9
~$2 -
(ex gains/restructuring & other)
LEAP EngineH Turbine
• TY’16 margin positive• Cost out from vertical
integration actions
• Accelerating cost curve• Leverage GEnx
learnings

33
Footprint
Horizontal ITDigital investment
Requisition engineering
• Creating product cost handbooks
• Reducing repetitive work:
•Digital automation
• Integration of design tools
• Process standardization
Incremental cost out actions
• Structural simplification … reduce redundancy
• Capacity utilization … software, hardware,
professional services
• Sourcing productivity … licenses, vendor
consolidation
• Software standardization … # apps ~2K
Manufacturing + Service sites
540
Baseline
−
2018F
• Lean transformation…
efficiency in less space
• Additional restructuring
• Regional consolidations
~150MM square feet
~$5B
Annual IT spend
Digital spend in Corporate
'17E '18E
++-
~$2B
Spend
• Platform revenue offsetting
digital spend
• Strategic investments aligned
to future growth
• “Steady state” in 2018+ … with
less cost
($ in billions)
~$100MM ~$100MM
~$200MM ~$450MM
ex. LM, Additive, BHI
34
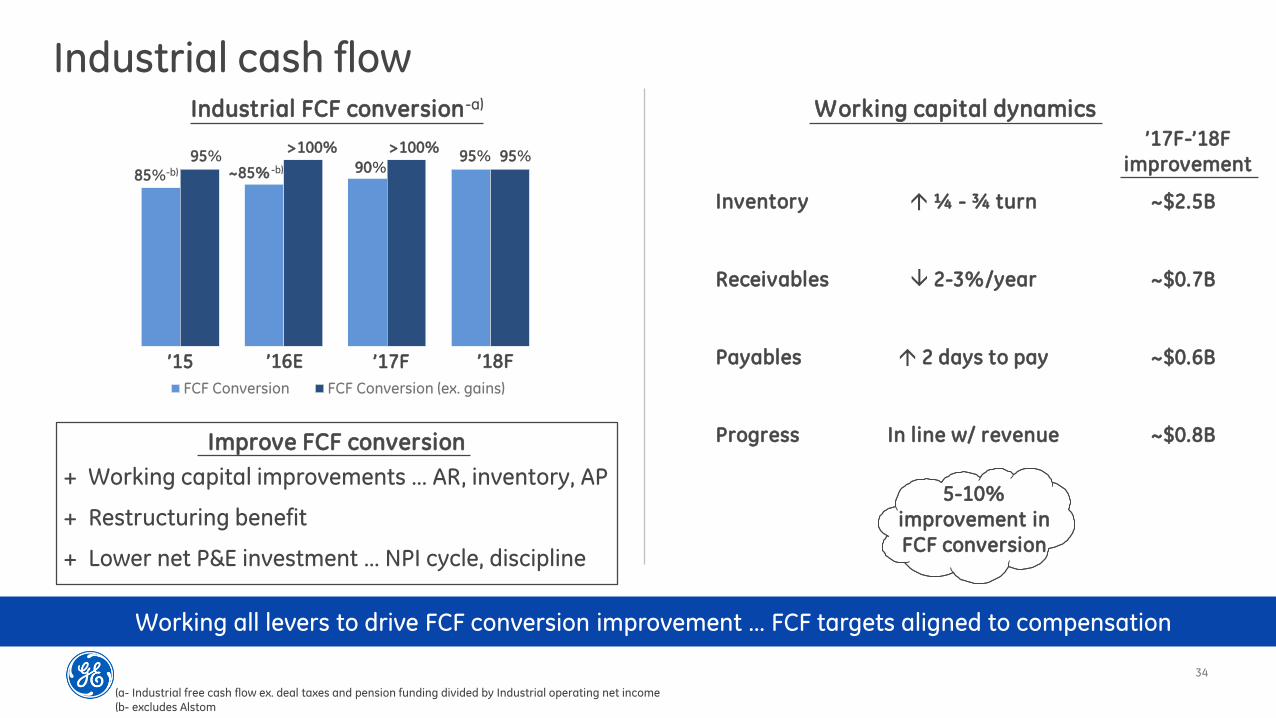
Industrial cash flow
’15 ’17F
Industrial FCF conversion-a)
Improve FCF conversion
Working all levers to drive FCF conversion improvement … FCF targets aligned to compensation
(a- Industrial free cash flow ex. deal taxes and pension funding divided by Industrial operating net income(b- excludes Alstom
’16E ’18F
’17F-’18F
improvement
+ Working capital improvements … AR, inventory, AP
+ Restructuring benefit
+ Lower net P&E investment … NPI cycle, discipline
Working capital dynamics
Inventory ~$2.5B¼ - ¾ turn
Receivables ~$0.7B 2-3%/year
Payables ~$0.6B 2 days to pay
5-10%
improvement in
FCF conversion
FCF Conversion FCF Conversion (ex. gains)
~85% -b)
>100% >100%95%95%
85%-b) 90%95%
Progress In line w/ revenue ~$0.8B

35
Oil & Gas: Florence
•50% lead time
•39% inventory
• +0.8 inventory turns
Healthcare: Hino
•32% hrs./CT unit
•42% CT lead time
• +2 inventory turns
Aviation: Muskegon
• +25% on-time delivery
• $20MM cost-out
• +1.1 inventory turns
Transportation: Grove City
• +7% shop efficiency
• 10% 80% analytics-
based maintenance
work scopes
• +2 inventory turns
Multi-modal: Pune
• +18% equipment
effectiveness
• $76 $45 OCPH
• +3 inventory turns
Renewables: Haiphong
•36% lead time
• +5% productivity
• +2 inventory turns
Digital tools built on foundation of lean productivity
Brilliant factories

36
Inventory optimization
~¾ turn~$2.5B oppty.
Our goal Dedicated resources
Lead by P. Cochet, SVP Productivity
~100 dedicated resources
~15 Lean / Sourcing / Material leaders
Tied to incentive plans
Key focus areas
Apply & re-invigorate GE’s lean
toolkit to drive lead time reduction
Analytics to optimize supply &
demand planning alignment
Partner with suppliers to increase
flexibility across the value chain
Scaling learnings across the company
(a- excludes Baker Hughes
~$22B
’16E ‘18 goal-a)
<$20B
EC: Assess & optimize planned lead times to buffer O&G: Lead time stacking shows where material is waiting
Using Lean to reduce lead
times90 days
Touch time
88 days
Wait time
$40-50MM opportunityTotal lead time ~178 days
Analytics to quickly assess &
update planned lead timesPlanned LT
Actual LT
64 days
36 days ~$30MM opportunity
Examples

37
2016E 2017F
Op Profit 2016 dynamics
+ Organic growth 0-2% … ~4% excluding Oil & Gas
+ Good execution in most segments and corporate
+ Alstom delivering on synergies
- Pressure in oil-related markets … O&G/Transportation
- FX headwind ~$.04-.06 impact on EPS
+ Strong organic growth ~3-5%
+ Margin expansion and cost out program
− Pressure continues in oil-related industries
+ Other segments executing
2017 dynamics
2017 outlook
Power ++ ++
Renewable Energy ++ ++
Oil & Gas − − −
Aviation + +
Healthcare +/++ +
Transportation − − − −
EC & Lighting − − ++
Industrial Segments =/+ +/++
Verticals + =
ex. FX
High end Low end
+ Better U.S. / tax reform+ O&G/related markets better+ Lower cost/M&A execution
- O&G/related markets worse- Timing of M&A+/- Stronger dollar

38
2017 operating framework
Operating EPS-a) $1.60-1.70
Operating cash $16-20Bflow
Cash returned $19-21Bto investors
1
2
3
(a- Industrial operating and Vertical EPS
(b- CFOA excludes deal taxes and pension funding; deal taxes included in dispositions
• Organic growth of 3-5%• Margin expansion ~100 bps.• Corporate $1.8-2.0B• Alstom EPS ~$.09-.10• Restructuring = gains• Tax rate headwind (mid-teens)
• CFOA $18-21B-b); Capital dividend $6-7B• Pension funding ~$1.8B• Dispositions-b) of ~$4B; Net P&E of $3-4B
• Dividend of ~$8B• Buyback of ~$11-13B

39
Incentives are aligned
+ Company EPS, op profit, margins & FCF aligned to this plan
+ Business metrics tie to 3-5% organic growth, 100 bps. margin expansion, and working capital improvements
+ Strategic goals align with long term value creation: share, integration, NPI, global development, digital
AEIP: 2017 + 2018 Long-term incentive plan (’16-’18)
Cumulative EPS $5.05-$5.55
Industrial margins 15-17%
Industrial ROTC 16-18%
Cash generated $70-97B
Cash returned $55-67B
Aligned to“bridge”

40
GE in the futureStrong portfolio in big ecosystem Connected enterprise advantages
Leading in Power & Renewables
Leading in Oil & Gas
Leading in Healthcare
Leading in Aviation & Transportation
$235B services backlog
Revenue
Global research
Global footprint
Global operations
Predix
Industrial finance
Additive manufacturing
Leadership & brand
~$135B
1 2
Strong relative performance Lead in Digital & productivity future
+ Good execution aligned with compensation
Organic growth
~3-5%/yr.
3 4
Lead in Industrial Internet
Lead in Additive manufacturing
New entitlement in productivity
+
Margins
~100 bps./yr.
+
Cash optionality
~$10B


