Diffusion of Innovation Storyboard Project. The Diffusion of Innovation The graphing Calculator...
34
Diffusion of Innovation Storyboard Project
-
Upload
ambrose-stephens -
Category
Documents
-
view
219 -
download
2
Transcript of Diffusion of Innovation Storyboard Project. The Diffusion of Innovation The graphing Calculator...

Diffusion of Innovation Storyboard Project
The Diffusion of Innovation The graphing Calculator Project
Diffusion of Innovation Storyboard Project
Graphing Calculator and Mathematics Education in High Schools
Oko A. Igbokwe
Instructor: Prof. Thornburg
:Walden University
Statement of the Problem
Technology needed to enhance student learning of mathematics.
• Instrument to provide visual representation in solving problems
• Instrument to serve as an extension of teachers’ teaching style
• The need for programmable and mobile (portable) instrument to
• replace log books and slide rules
Project Overview
The introduction of the graphing calculator in schools has revolutionalized the way teachers teach and students learn, The innovation brought about by the use of graphing calculators is making it possible for students and teachers to do many things faster, more accurately than when things were done by paper and pencil and slide rule/log book .
Research
Many organizations both public and private have conducted basic and applied research on the impact of graphing calculators. Primarily, much has been published by: :
• Universities and Colleges of Education• Mathematics Organizations like NCTM
• School Districts and mathematics Teachers
• Developers and Manufactorers notably• Texas Instruments• Casio Company
Teaching and Learning with Graphing Calculators: What Can Be Learned with Graphing Calculators
Virginia Commonwealth University
A peer-reviewed meta-analysis of 54 studies with the strongest form of evidence, high-quality experimental and quasi-experimental studies concluded:•Students with graphing technology had better understanding of functions, variables, solving algebra problems in applied contexts and interpreting graphs.
•"Students' operational skills and problem-solving skills improved." Reference:(Ellington 2003)
SRI International
A discussion of current research "best evidence" concluded that students who have been taught effectively with graphing calculators: •Use graphs•
Engage in problem solving•
Are more flexible in choosing solution, making conjectures, moving among algebraic, numeric, and graphical approaches, and working with real data.
Reference: Center for Technology in Learning (2007), "Why should a teacher use technology in his or her classroom?" Research Note 8, Menlo Park, CA
University of York
A UK review of 33 papers on information and communications technology (ICT) including graphing calculators in mathematics teaching found:
Gains in understanding of particular aspects of functions.
Pupils reached higher levels of thinking and could explain their thinking better.
Learning gains from small group work and interaction with the teacher. Reference: (Goulding 2008)
INRP
A review of 10 qualitative studies in France on the integration of graphing calculators in mathematics teaching concluded: •
Graphing calculator environments tend to promote assimilation between a function and its graphical representations to a greater degree than symbolic calculator environments.
Reference: (Sabra 2008)
Teaching and Learning with Graphing Calculators: How to Teach with Graphing
Calculators
Virginia Commonwealth UniversityA peer-reviewed meta-analysis of 54 of studies with the strongest form of evidence, high-quality experimental and quasi-experimental studies concluded:
Students' operational skills and problem solving improved when graphing calculators were an integral part of instruction and testing.
Reference: (Ellington 2003)
Conclusion:
Graphing calculators should be an integral part of teaching and testing
Benefits are strongest when teaching focuses on uses of graphing calculators for conceptual understanding and problem solving strategy
Michigan State University
A review of 43 key comparative and interpretive studies found:
The greatest benefits come from investigations which center on "what if…?" or "why?" questions.
Reference: (Burrill, Allison et al. 2002)
INRP
A review of 10 quantitative and qualitative studies in France concluded:
Students widely use calculators, even complex ones, only for simple tasks.
Integration of the tool in a rational process of exploration, conjecture and evidence depends on the teacher to lead this integration in the classroom.
Michigan State University
A review of 43 key comparative and interpretive studies examined this issue. The review concluded:
•No significant differences in procedural skills were found between students who use handheld graphing technology and those who do not (in the areas examined).
•Extensive use of the technology does not necessarily interfere with students' acquisition of skills.
Reference: (Burrill, Allison et al. 2002)
Conclusion:
Teaching that emphasizes concepts and connections between representations is more successful than focusing on technology and procedural algebraic approaches.
Students whose teachers illustrated connections between representations and emphasized concepts had greater success than did students whose teachers focused on technological and algebraic approaches.
• These teachers seemed to create classrooms with more conjecturing, multiple approaches and higher levels of discourse.
• Teachers also used technology as an extension of the way they always taught.
Teaching and Learning with Graphing
Calculators: Duration of Use and Ownership
Conclusion: While available research does not make a conclusive case, research shows that when students use graphing calculators frequently, they tend to score higher on national, state and school-level tests. Research also indicates that it is not simply the frequency of access but types of use that matter.
SRI International
Correlational studies of the relationship of frequency of graphing calculator use and achievement using:
The National Assessment of Educational Progress (NAEP)
Algebra I End-Of-Course Tests in Oregon and Kansas• The Texas TAKS exam• All show higher achievement when students have access
to a personal graphing calculator both in and outside of class.
However, selective access to the calculator during class (depending on the learning activity) is also a best practice.
More research is needed to eliminate other possible causes of the effect, such as differences in student ability.
Reference: Center for Technology in Learning (2008) “Should students have frequent access to graphing calculators? TI Research Note 3. Menlo Park, CA: SRI International
Conclusion:
The more access students have to graphing calculators, and the more instructional time they have in which graphing calculators are used, the higher the test scores
Heller Research Associates
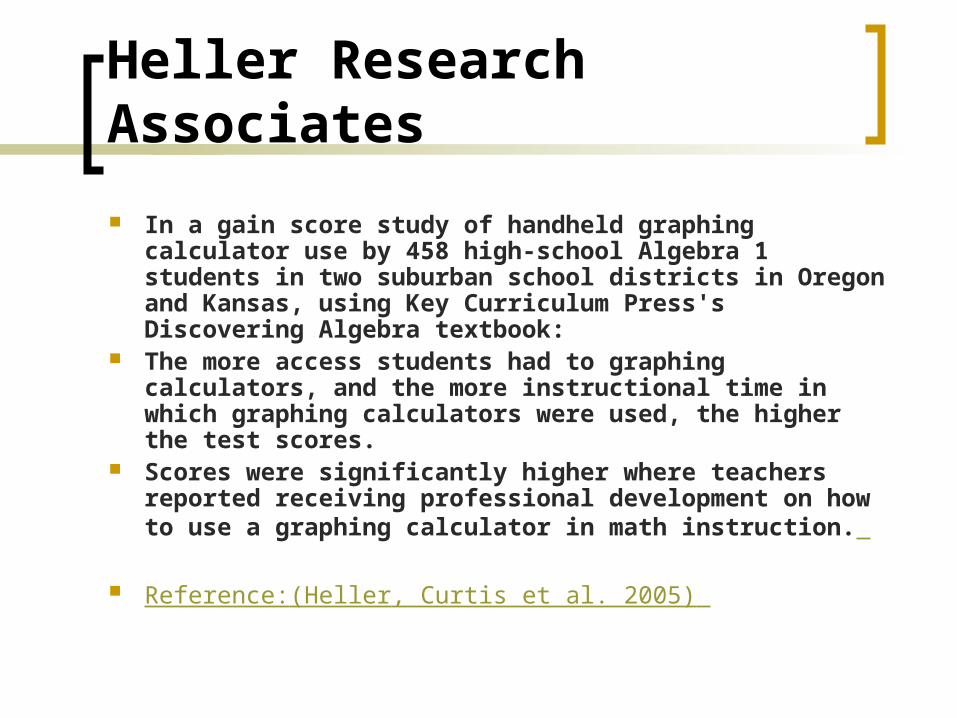
In a gain score study of handheld graphing calculator use by 458 high-school Algebra 1 students in two suburban school districts in Oregon and Kansas, using Key Curriculum Press's Discovering Algebra textbook:
The more access students had to graphing calculators, and the more instructional time in which graphing calculators were used, the higher the test scores.
Scores were significantly higher where teachers reported receiving professional development on how to use a graphing calculator in math instruction.
Reference:(Heller, Curtis et al. 2005)
Conclusion:
Continuous access to graphing calculators is important. Additionally, students do better in math when they use a graphing calculator in class and at home.
Southwest Educational Development Laboratory
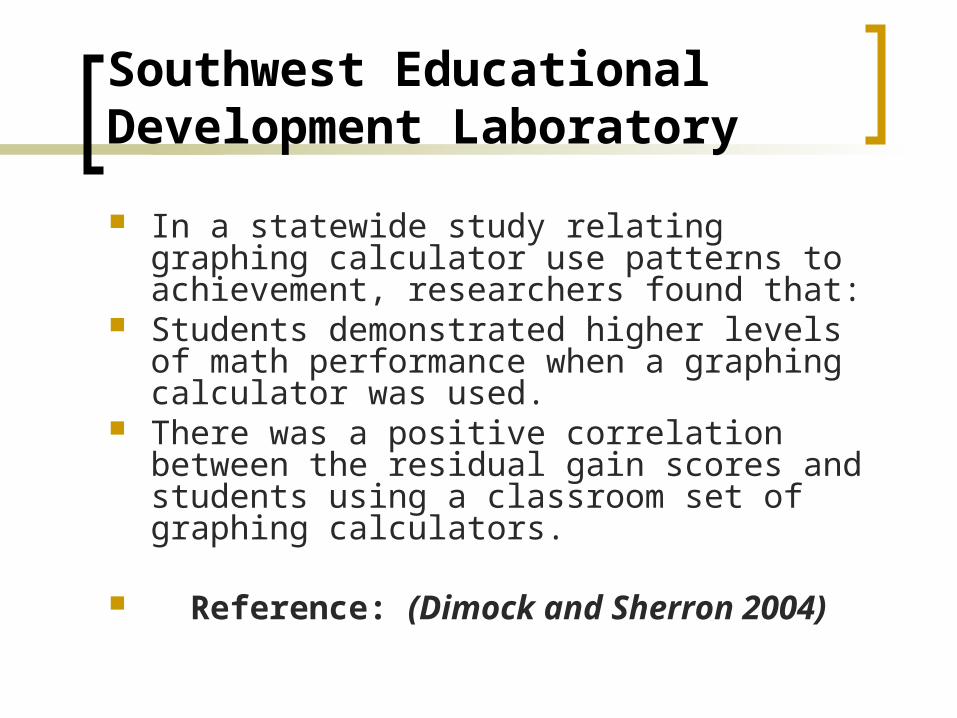
In a statewide study relating graphing calculator use patterns to achievement, researchers found that:
Students demonstrated higher levels of math performance when a graphing calculator was used.
There was a positive correlation between the residual gain scores and students using a classroom set of graphing calculators.
Reference: (Dimock and Sherron 2004)
SRI International
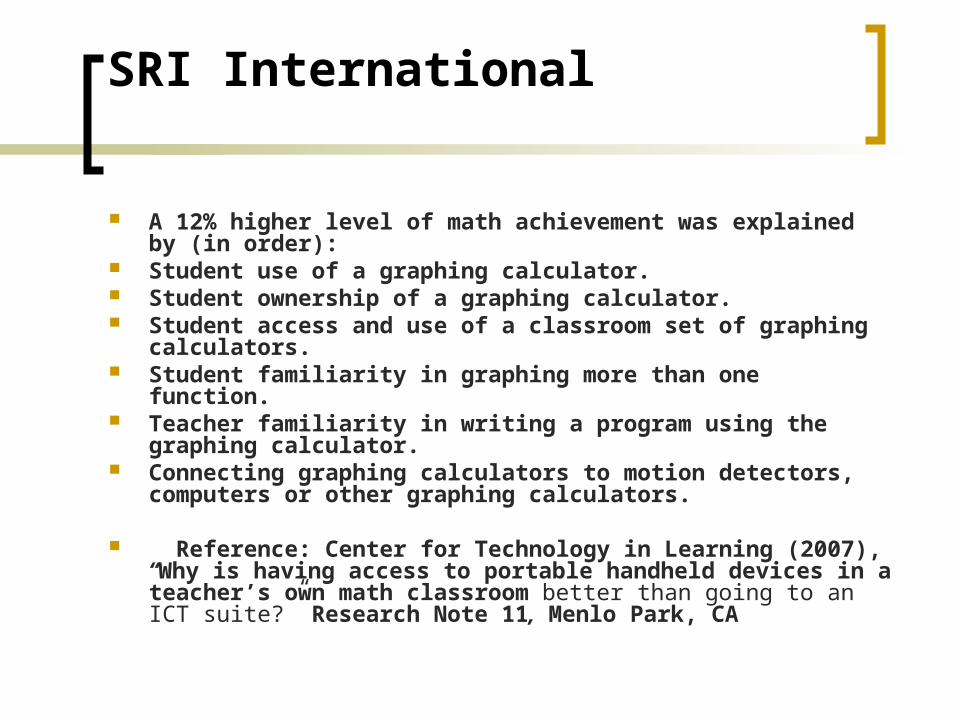
A 12% higher level of math achievement was explained by (in order):
Student use of a graphing calculator. Student ownership of a graphing calculator. Student access and use of a classroom set of graphing
calculators. Student familiarity in graphing more than one function. Teacher familiarity in writing a program using the graphing
calculator. Connecting graphing calculators to motion detectors,
computers or other graphing calculators.
Reference: Center for Technology in Learning (2007), “Why is having access to portable handheld devices in a teacher’s own math classroom better than going to an ICT suite?” Research Note 11, Menlo Park, CA
Conclusion:
While a longer duration spent using graphing calculators may increase learning, quality of use counts more than quantity
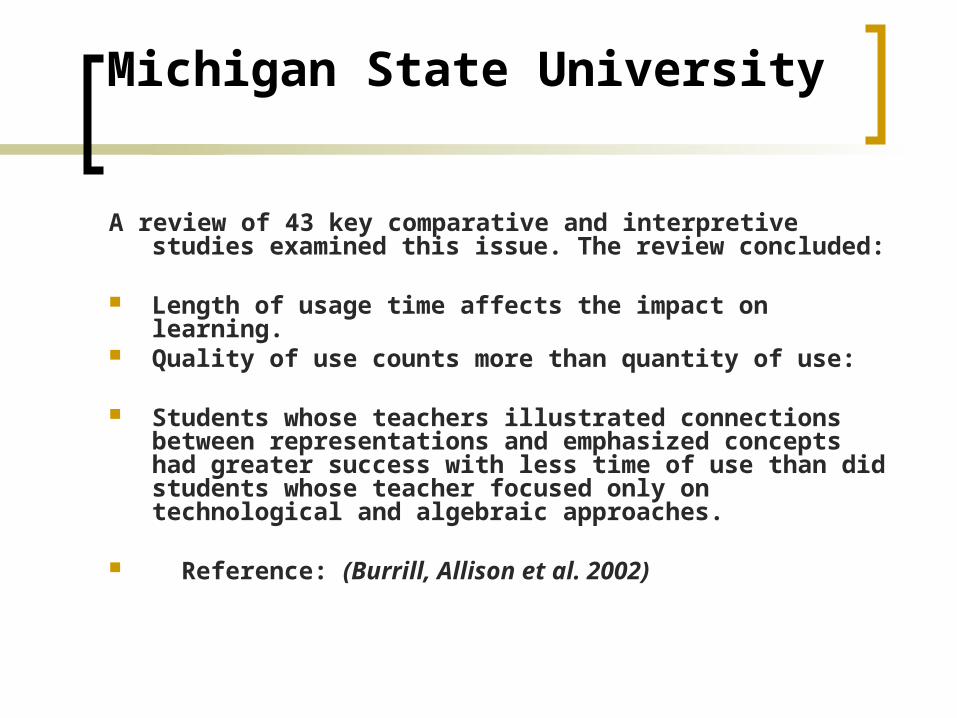
Michigan State University
A review of 43 key comparative and interpretive studies examined this issue. The review concluded:
Length of usage time affects the impact on learning. Quality of use counts more than quantity of use:
Students whose teachers illustrated connections between representations and emphasized concepts had greater success with less time of use than did students whose teacher focused only on technological and algebraic approaches.
Reference: (Burrill, Allison et al. 2002)
Virginia Commonwealth University
A peer-reviewed meta-analysis of 54 studies with the strongest form of evidence, high-quality experimental and quasi-experimental studies found inconclusive results:
Both positive and negative effects on conceptual understanding were related to time of use.
Reference: (Ellington 2003)
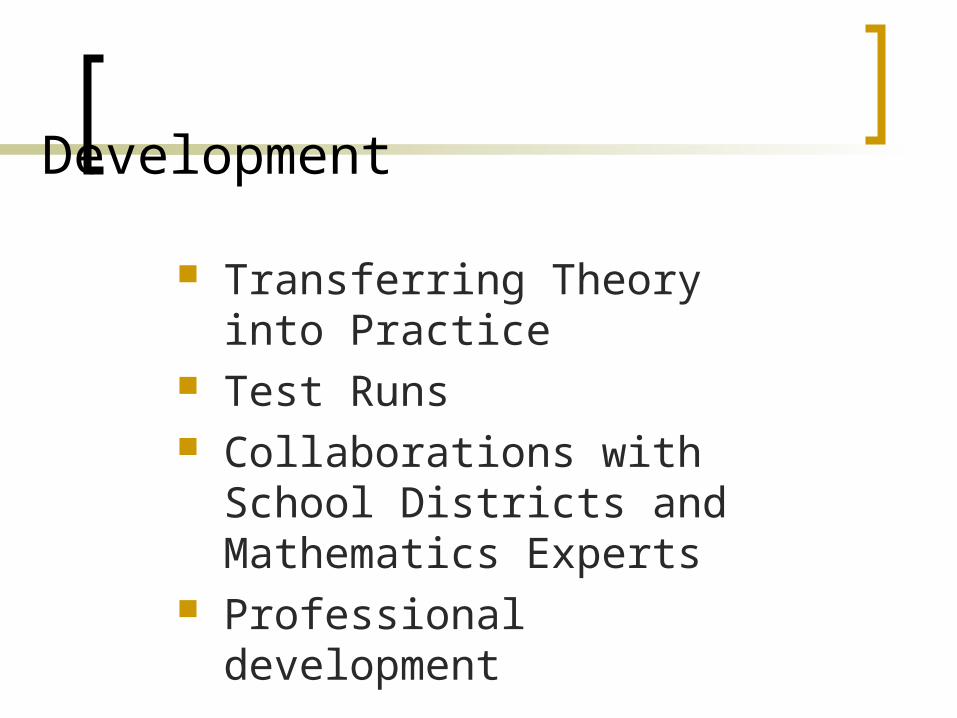
Development
Transferring Theory into Practice
Test Runs Collaborations with School
Districts and Mathematics Experts
Professional development
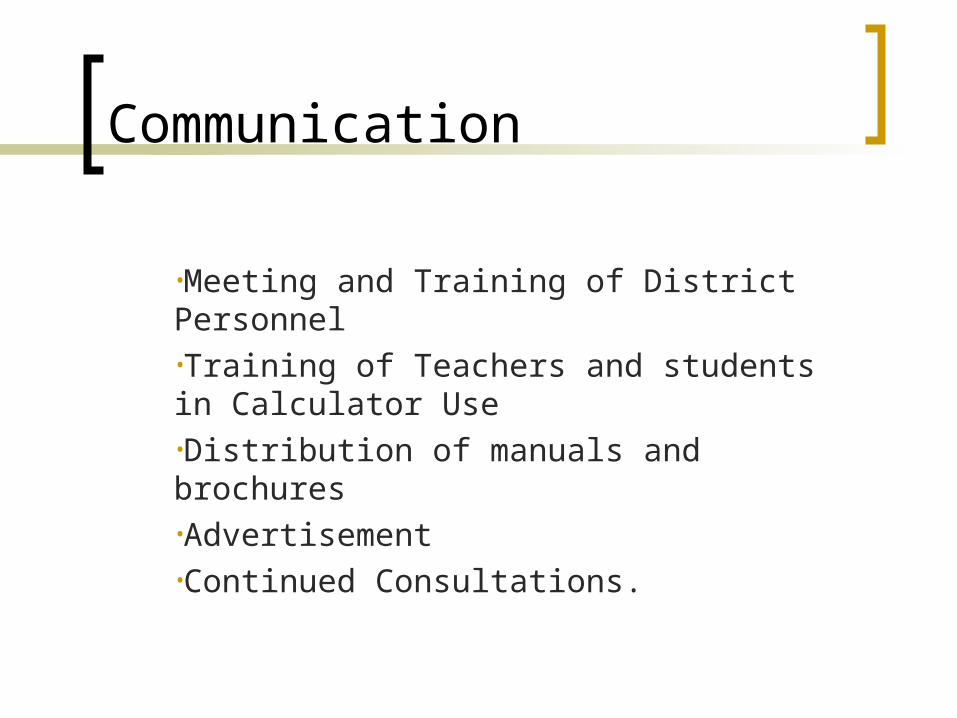
Communication
•Meeting and Training of District Personnel•Training of Teachers and students in Calculator Use•Distribution of manuals and brochures•Advertisement•Continued Consultations.
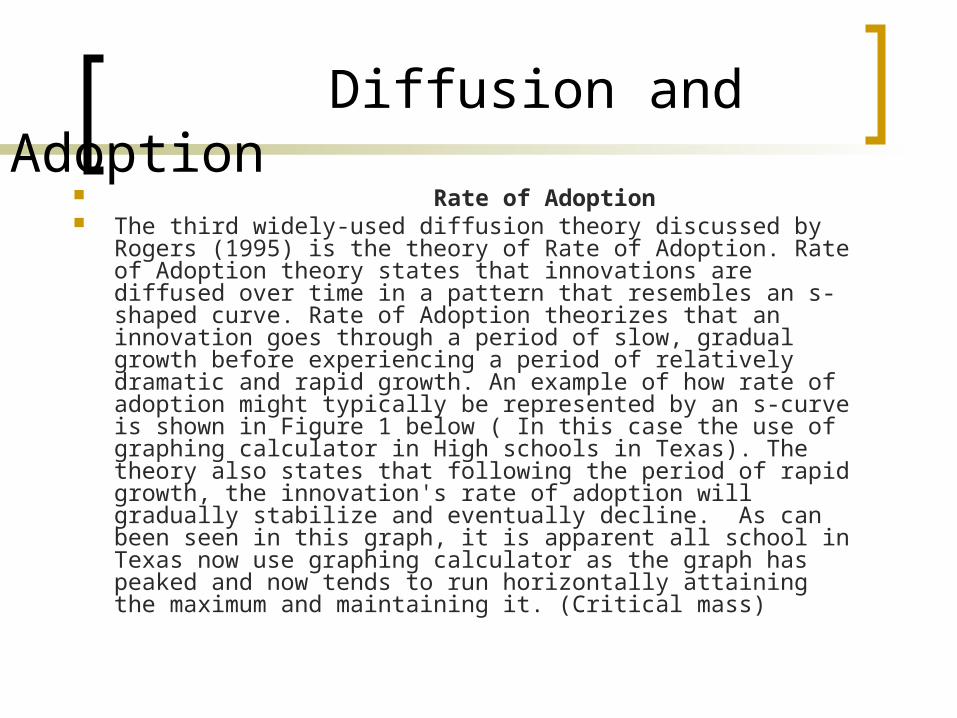
Diffusion and Adoption Rate of Adoption The third widely-used diffusion theory discussed by Rogers
(1995) is the theory of Rate of Adoption. Rate of Adoption theory states that innovations are diffused over time in a pattern that resembles an s-shaped curve. Rate of Adoption theorizes that an innovation goes through a period of slow, gradual growth before experiencing a period of relatively dramatic and rapid growth. An example of how rate of adoption might typically be represented by an s-curve is shown in Figure 1 below ( In this case the use of graphing calculator in High schools in Texas). The theory also states that following the period of rapid growth, the innovation's rate of adoption will gradually stabilize and eventually decline. As can been seen in this graph, it is apparent all school in Texas now use graphing calculator as the graph has peaked and now tends to run horizontally attaining the maximum and maintaining it. (Critical mass)
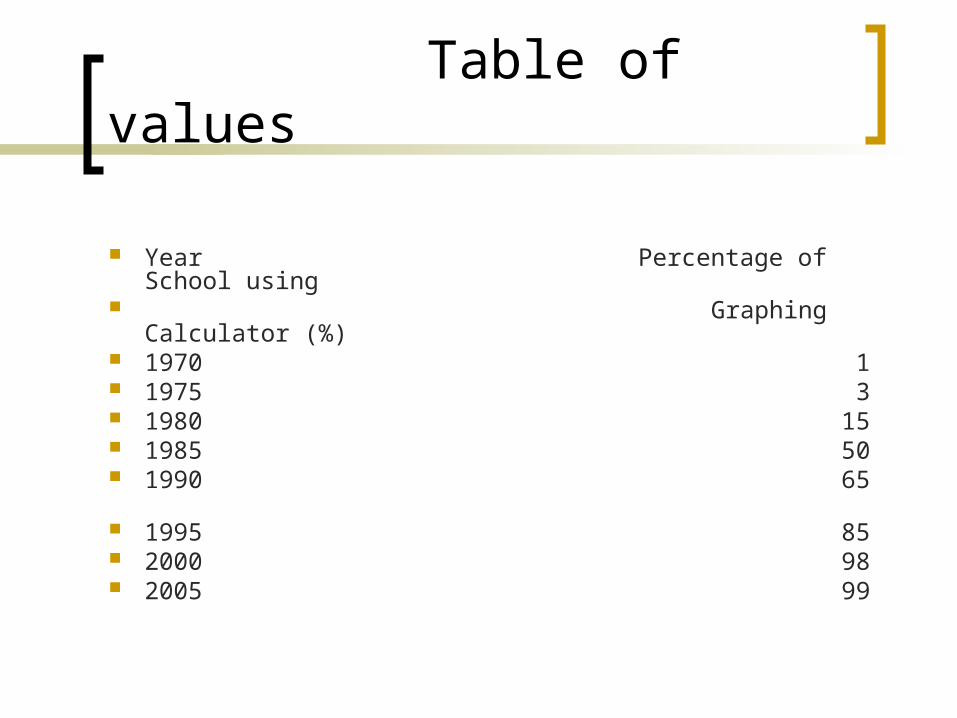
Table of values
Year Percentage of School using Graphing Calculator (%) 1970 1 1975 3 1980 15 1985 50 1990 65 1995 85 2000 98 2005 99
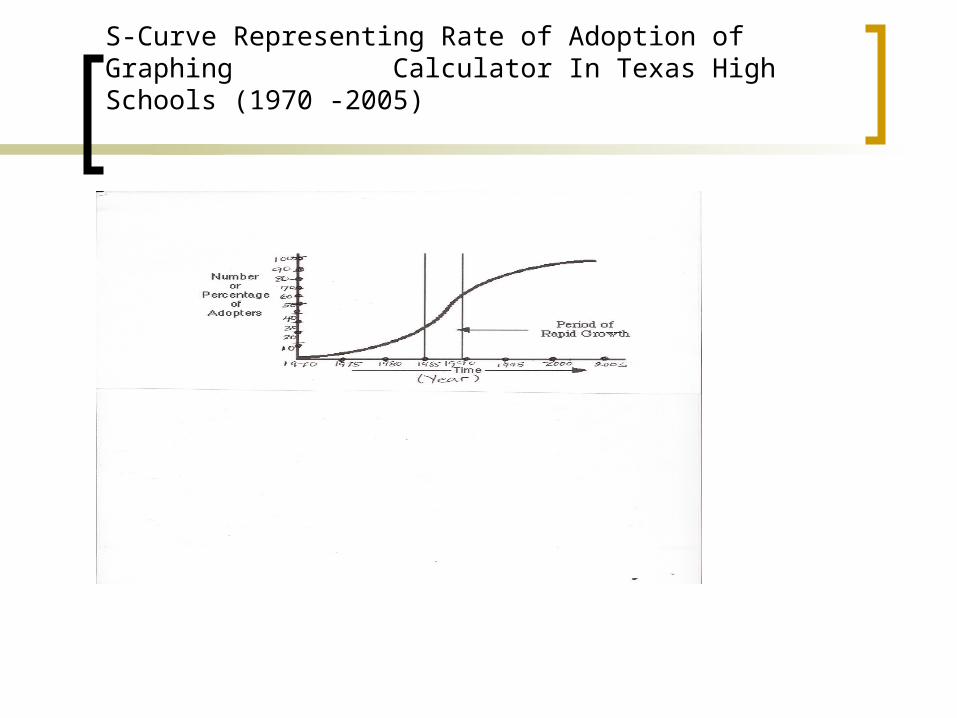
S-Curve Representing Rate of Adoption of Graphing Calculator In Texas High Schools (1970 -2005)
Consequences
Conclusion
Works Cited
References: