Diffusion of Clean Energy Innovations - United Nations · Belfer Center, Harvard Kennedy School....
32
The Global Diffusion of Clean Energy Technologies: Lessons from China May 30, 2013 Kelly Sims Gallagher Associate Professor of Energy and Environmental Policy The Fletcher School, Tufts University Senior Research Associate Belfer Center, Harvard Kennedy School
-
Upload
nguyenthuan -
Category
Documents
-
view
215 -
download
0
Transcript of Diffusion of Clean Energy Innovations - United Nations · Belfer Center, Harvard Kennedy School....

The Global Diffusion of Clean Energy Technologies:
Lessons from China May 30, 2013
Kelly Sims Gallagher
Associate Professor of Energy and Environmental Policy
The Fletcher School, Tufts University
Senior Research Associate
Belfer Center, Harvard Kennedy School
Motivations
Why clean energy Why global diffusionGlobal climate change Emissions shifting to non-
OECDJobs Human developmentResource efficiency Finite global resourcesEnergy insecurity Global peace and stabilityAir pollution (conventional) Cleaner air and water at
local and regional levelsEconomic competitiveness Sustainable prosperity

Research Questions
What are the main barriers and incentives to the cross‐border
movement of cleaner energy technologies based on empirical
evidence?
Does the diffusion of clean energy technologies differ from other technologies?
Does the theory about international technology transfer hold up to the evidence for cleaner technologies?
What do the conclusions imply for business practice and government policy?
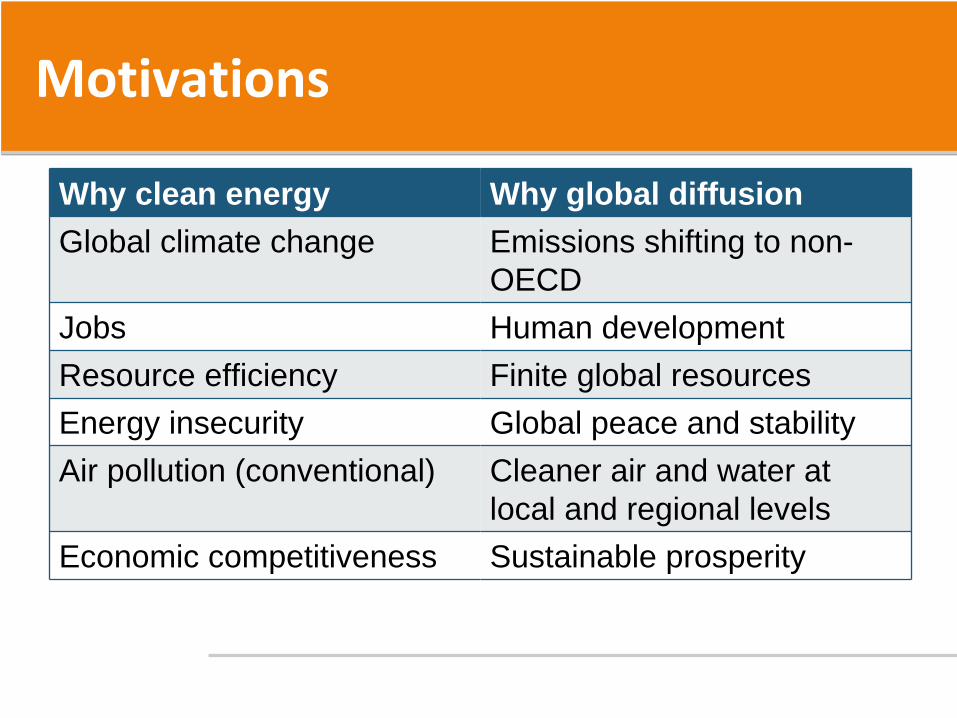
Into the Dragon’s Den
China has a large quantity of energy firms that have used every conceivable strategy for developing and/or acquiring technology
Chinese policy for clean energy evolving rapidly
China is fastest‐growing large economy, 2nd in world
China is fastest‐growing major energy consumer, now 1st in world, projected by the IEA to be the largest energy market for the next two decades
Fair or not, China is the country currently that industrialized countries are most scared of in terms of IP infringement. China has previously argued it lacks access to key energy technologies

Four Telling Tales: Case Studies 四个生动的故事:案例分析
Solar PV/太阳能光伏Coal gasification/煤气化Natural gas turbines/天燃气燃气轮机Batteries for advanced vehicles (EV, HEV) /电动汽车电池

Mechanisms for diffusionMechanism Variation Used by
Chinese firms to
acquire from
foreigners
Used by
foreign firms
to acquire
from China
Exports or imports of final goods Equipment for manufacturing ✔ ✔
Licenses ✔ ✔
Purchase of foreign firm (M&A) To acquire technology; merger ✔ ✔
Strategic alliance or joint venture Partial or 100%‐owned ✔ ✔
Migration of people for work or
education
As entrepreneur, consultant, or employee
recruited overseas
✔ ✔
Contract with research entity IP is negotiated with foreign university
lab, research institute, firm
✔ ✔
Collaborative RD&D ✔ ✔
Open sources Textbooks, conferences, journal articles,
exhibitions
✔ ✔
Bi‐lateral or multi‐lateral
technology agreement
Research, development, demonstration ✔ ✔
Sources: author, Lanjouw and Mody 1996, Mowrey and Oxley 1997, Gallagher 2006, Barton 2007, Lewis 2007, Odigiri
et al. 2010, Lema and Lema 2010
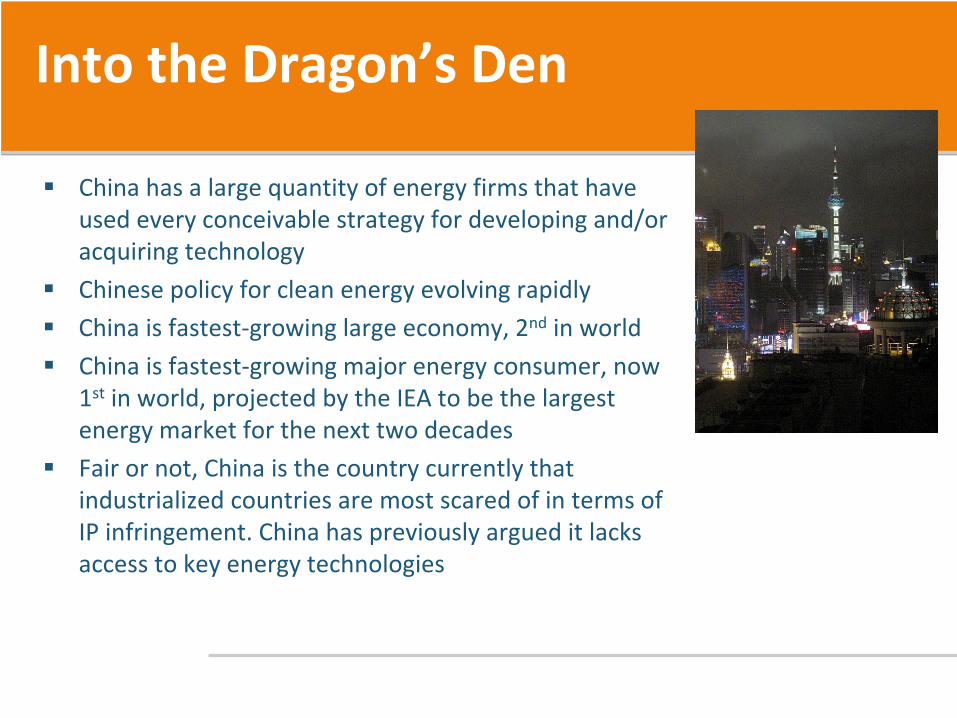
Barriers/阻碍因素Barriers to the Transfer of Cleaner Energy Techs to and from China Gas
TurbinesAdvanced Batteries
Solar PV
Coal Gasification
Policy factors
Export controls
Import tariffs
Restriction of access to domestic marketWeak innovation policy
Weak industrial policy
Weak market-formation policy * *
Weak export promotion policy
Cost and finance factors
Access to finance/ability to investLack of “natural” market
High cost of foreign technology
Source: Author analysis, based on case study research. Yellow is the Chinese point of view. Blue is foreign point of view. Green denotes agreement between foreign and Chinese perspectives. A question mark (?) denotes a lack of data, where as lack of an entry means that the barrier does not clearly apply in this case.*Before new policies announced in the 12th Five Year Plan
(continued)
Presenter�
Presentation Notes�
Chinese point of view = yellow | Foreign point of view = blue| Agreement between the two = green Not much agreement about the barriers except for the lack of a natural market for these technologies, and to a lesser extent, the weakness of market-formation policy in China Chinese perceive many barriers in gas turbines and advanced batteries especially�

Barriers to the Transfer of Cleaner Energy Techs to and from China (cont.)Gas
TurbinesAdvanced Batteries
Solar PV
Coal Gasification
Intellectual property factors
Export prohibitions in license agreementsDefensive, anti-competitive patentingFear of IP infringement
Refusal by foreign firms to license
Business practice factors
Lack of experience in foreign marketsWeak IP management
High risk aversion
Poor after-sales service
Source: Author analysis, based on case study research. Yellow is the Chinese point of view. Blue is foreign point of view. Green denotes agreement between foreign and Chinese perspectives. A question mark (?) denotes a lack of data, where as lack of an entry means that the barrier does not clearly apply in this case.*Before new policies announced in the 12th Five Year Plan

Barriers/阻碍因素Incentives for the Transfer of Cleaner Energy Techs to and from China Gas
TurbinesAdvanced Batteries
Solar PV
Coal Gasification
Policy factors Clear long term policy * *
Lack of trade barriers
Strong innovation policy
Strategic industrial policy * *
Stable market-formation policy * *
Strong export promotion policy
Alignment of policy
Cost and finance factors
Good access to finance ?
“Natural” market exists
Ability to buy tech if needed
Costs of foreign or Chinese technology reasonable
Source: Author analysis, based on case study research. Yellow is the Chinese point of view. Blue is foreign point of view. Green denotes agreement between foreign and Chinese perspectives. A question mark (?) denotes a lack of data, where as lack of an entry means that the barrier does not clearly apply in this case.*Before new policies announced in the 12th Five Year Plan
( ti d)
Presenter�
Presentation Notes�
Chinese point of view = yellow | Foreign point of view = blue| Agreement between the two = green Not much agreement about the barriers except for the lack of a natural market for these technologies, and to a lesser extent, the weakness of market-formation policy in China Chinese perceive many barriers in gas turbines and advanced batteries especially�
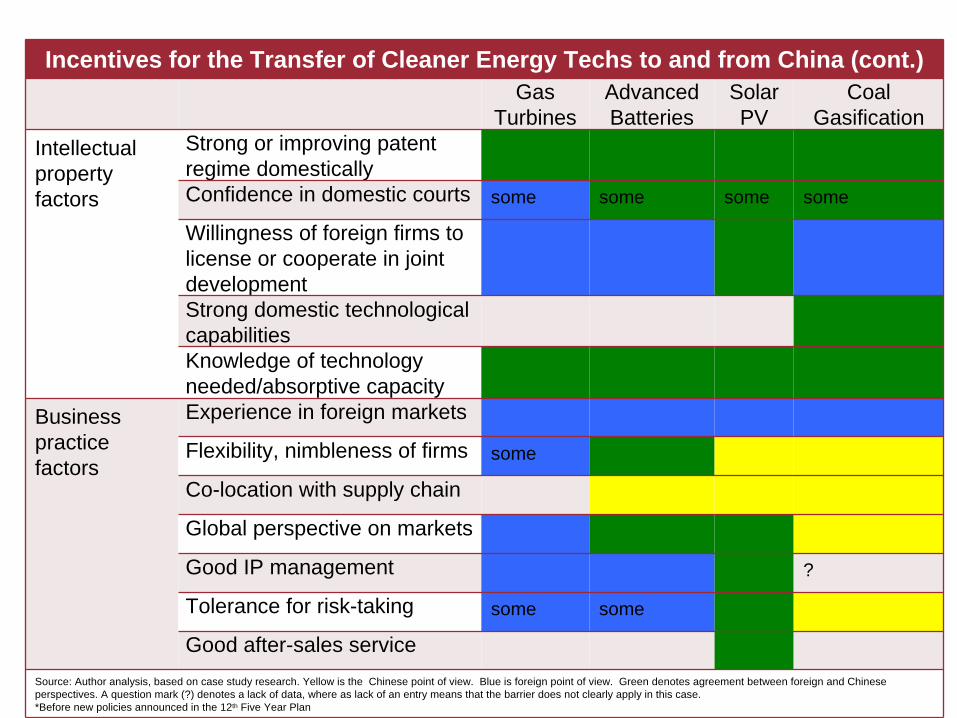
Incentives for the Transfer of Cleaner Energy Techs to and from China (cont.)Gas
TurbinesAdvanced Batteries
Solar PV
Coal Gasification
Intellectual property factors
Strong or improving patent regime domesticallyConfidence in domestic courts some some some some
Willingness of foreign firms to license or cooperate in joint developmentStrong domestic technological capabilitiesKnowledge of technology needed/absorptive capacity
Business practice factors
Experience in foreign markets
Flexibility, nimbleness of firms some
Co-location with supply chain
Global perspective on markets
Good IP management ?
Tolerance for risk-taking some some
Good after-sales serviceSource: Author analysis, based on case study research. Yellow is the Chinese point of view. Blue is foreign point of view. Green denotes agreement between foreign and Chinese perspectives. A question mark (?) denotes a lack of data, where as lack of an entry means that the barrier does not clearly apply in this case.*Before new policies announced in the 12th Five Year Plan
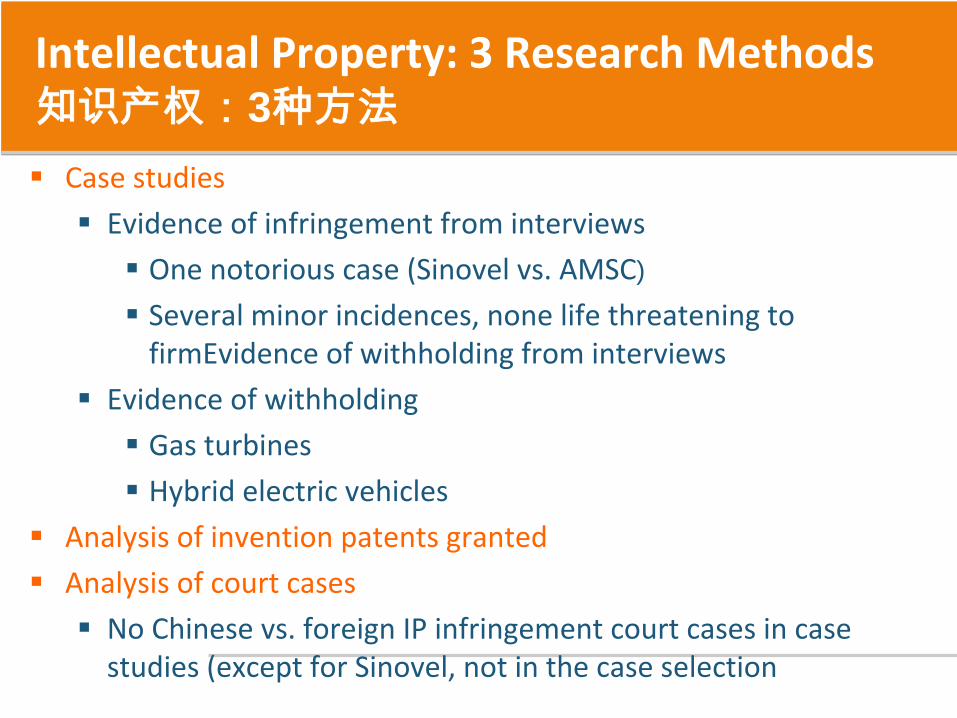
Intellectual Property: 3 Research Methods 知识产权:3种方法
Case studies
Evidence of infringement from interviews
One notorious case (Sinovel vs. AMSC)
Several minor incidences, none life threatening to firmEvidence of withholding from interviews
Evidence of withholding
Gas turbines
Hybrid electric vehicles
Analysis of invention patents granted
Analysis of court cases
No Chinese vs. foreign IP infringement court cases in case studies (except for Sinovel, not in the case selection

Annual Share of Foreign Patents: My Case Studies 外国在中国申请专利的比例:案例研究
Gallagher, K.S. and A. Irwin, The Fletcher School. Raw data from the State Intellectual Property Organization, China – accessed 2012.
各国在中国申请清洁能源发明专利的比例
Presenter�
Presentation Notes�
Chinese hold a large fraction of patents granted in China in every technology except for LEDs and gas turbines �
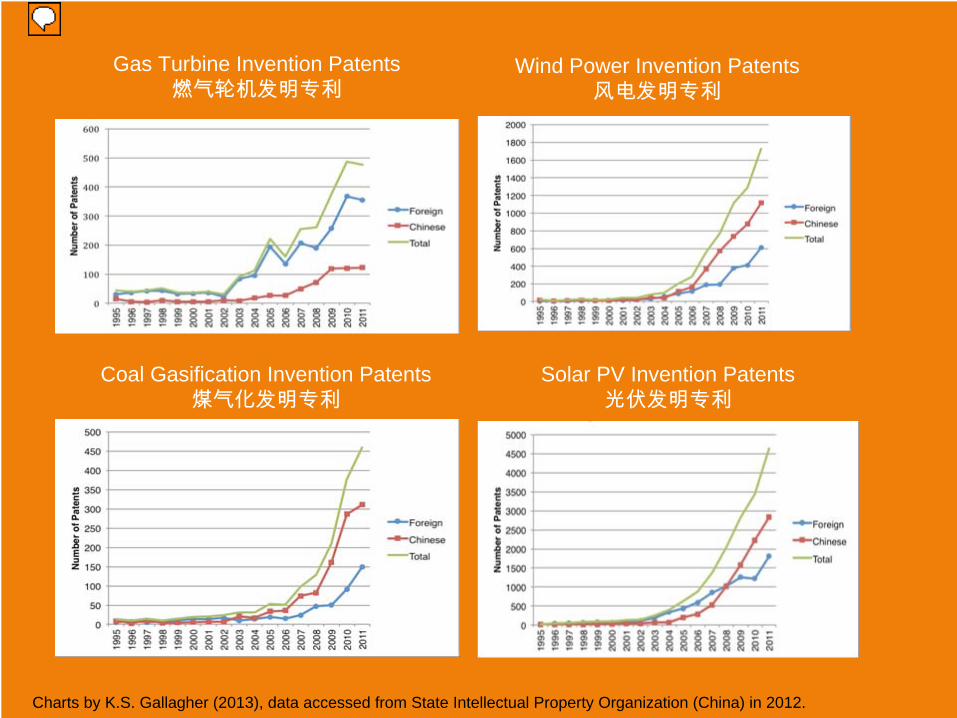
Gas Turbine Invention Patents燃气轮机发明专利
Wind Power Invention Patents风电发明专利
Coal Gasification Invention Patents煤气化发明专利
Solar PV Invention Patents光伏发明专利
Charts by K.S. Gallagher (2013), data accessed from State Intellectual Property Organization (China) in 2012.
Presenter�
Presentation Notes�
But the rate of growth of invention patents granted for all of these technologies, even for foreign patents is very fast. (Note scale is different on each graph).�

Clean Energy Invention Patents Granted by China’s State Intellectual Property Office (1995-2011)
中国知识产权局授权的清洁能源发明专利(1995-2011)
Cleaner Energy Technology
Foreign Percentage of Total
Chinese annual growth rate since 2005
Foreign annual growth rate since 2005
Year that number of new Chinese patents surpassed number of foreign patents
Gas turbines 78% 37% 28% Not yet LEDs 67% 72% 28% Likely in 2012 Wind 34% 68% 44% 2005 Clean vehicles 50% 49% 39% 2009 Coal gasification 32% 58% 46% 2003 Advanced batteries for vehicles
52% n/a1 n/a1 n/a1
Geothermal 26% 53% 23% 2002 Solar PV 48% 85% 28% 2008 Notes: All data from SIPO, calculations by author. 1The data series is too short

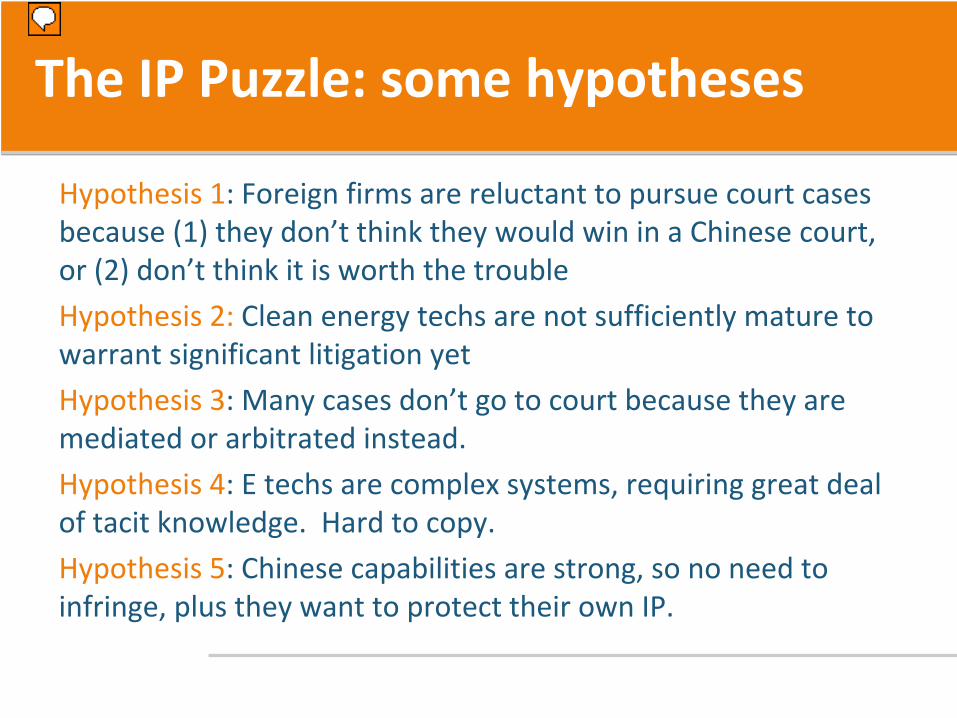
The IP Puzzle: some hypotheses
Hypothesis 1: Foreign firms are reluctant to pursue court cases
because (1) they don’t think they would win in a Chinese court,
or (2) don’t think it is worth the trouble
Hypothesis 2:
Clean energy techs are not sufficiently mature to
warrant significant litigation yet
Hypothesis 3: Many cases don’t go to court because they are
mediated or arbitrated instead.
Hypothesis 4: E techs are complex systems, requiring great deal
of tacit knowledge. Hard to copy.
Hypothesis 5: Chinese capabilities are strong, so no need to
infringe, plus they want to protect their own IP.
Presenter�
Presentation Notes�
Puzzle: if China is reputed to be the most notorious infringers of clean energy technologies, but we do not observe in this sector, what is going on? Could conclude then that at global scale, infringement likely to be small. Alternatively, since evidence of IP infringement also exists outside China, we could argue nothing particularly special about China. Hypothesis 1: Foreign firms are reluctant to pursue court cases because (1) they don’t think they would win in a Chinese court, or (2) don’t think it is worth the trouble Hypothesis 2: Clean energy techs are not sufficiently mature to warrant significant litigation yet Hypothesis 3: Many cases don’t go to court because they are mediated or arbitrated instead. Hypothesis 4: E techs are complex systems, requiring great deal of tacit knowledge. Hard to copy. Hypothesis 5: Chinese capabilities are strong, so no need to infringe, plus they want to protect their own IP. �

Market failures pervasive
Energy markets are far from “perfect”
Asymmetric information (e.g. OPEC vs. consumers)
Highly subsidized in some countries
Highly regulated in some countries
Externalities are pervasive and not valued by market
Energy security costs
Costs of conventional air pollution in terms of public health, premature death, damage to infrastructure
Costs of climate change (benefits of avoiding it, costs of adaptation)
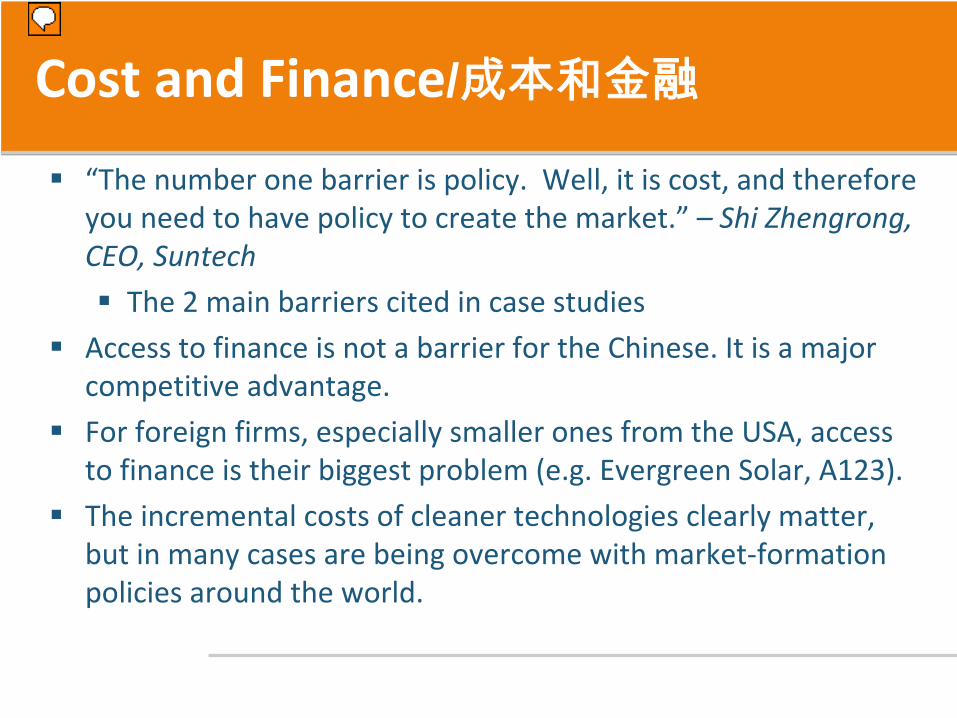
Cost and Finance/成本和金融
“The number one barrier is policy. Well, it is cost, and therefore you need to have policy to create the market.” – Shi Zhengrong, CEO, Suntech
The 2 main barriers cited in case studies
Access to finance is not a barrier for the Chinese. It is a major competitive advantage.
For foreign firms, especially smaller ones from the USA, access to finance is their biggest problem (e.g. Evergreen Solar, A123).
The incremental costs of cleaner technologies clearly matter, but in many cases are being overcome with market‐formation policies around the world.
Presenter�
Presentation Notes�
Substantial differences existed for installed PV systems for residential applications in different countries as of 2011, with Germany and China having average costs of approximately $3,200-3,700/kW for small systems (2kW-5kW) compared with approximately $5,600/kW in the United States, Italy, and Portugal (IRENA 2012a). As of 2010, China had the lowest average wind turbine price at $644/kW, compared with $1234/kW in the United States, $1526/kW in Mexico, and $2123/kW in Austria (IRENA 2012b). �
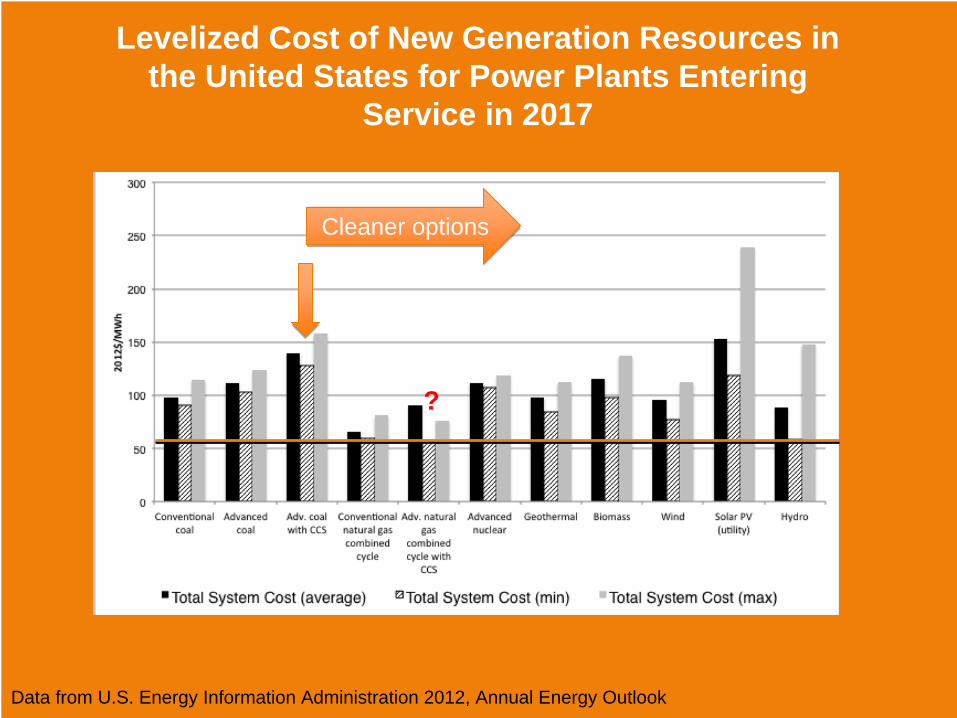
Levelized Cost of New Generation Resources in the United States for Power Plants Entering
Service in 2017
Data from U.S. Energy Information Administration 2012, Annual Energy Outlook
?
Cleaner optionsCleaner options
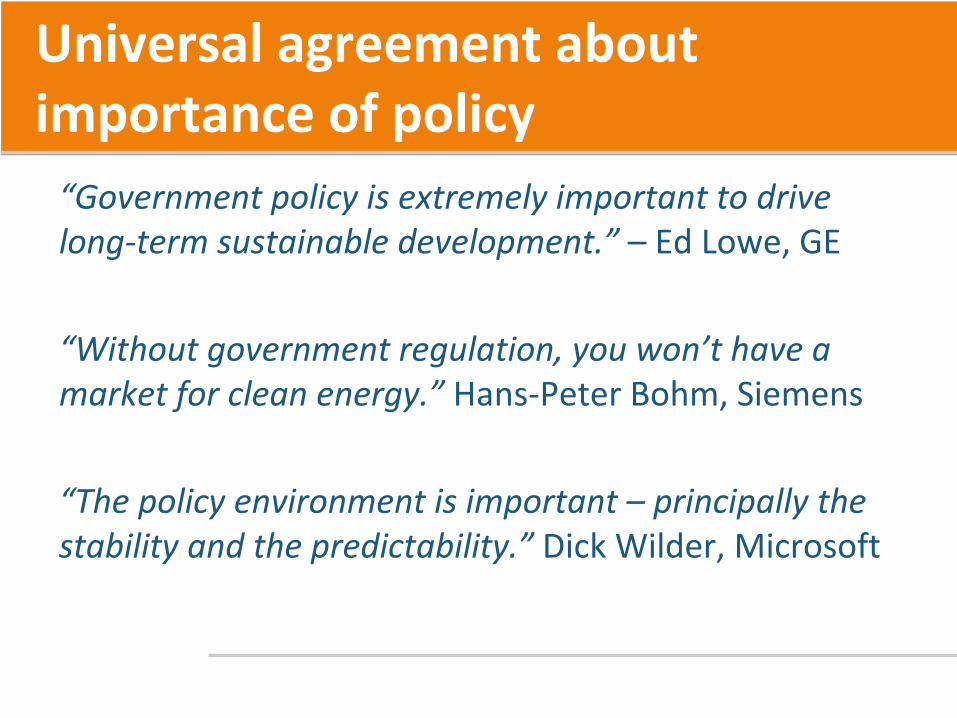
Universal agreement about importance of policy
“Government policy is extremely important to drive long‐term sustainable development.”
– Ed Lowe, GE
“Without government regulation, you won’t have a market for clean energy.”
Hans‐Peter Bohm, Siemens
“The policy environment is important –
principally the stability and the predictability.”
Dick Wilder, Microsoft

Four types of policy 政策的核心作用
Domestic manufacturing or industrial policy国内制造或工业政策Technology or innovation policy技术或者创新政策Export promotion policy出口推动政策Market‐formation policy市场形成政策
Of course, policies can also inhibit diffusion as well

Domestic manufacturing or industrial policy
Essential to exports. “You cannot export what you don’t manufacture”
Need to have domestic market for scaling up, commercial demonstration, national branding. Need forgiving market.
Availability of capital is key
“Like snowballs rolling down a hill”
Standardization, agglomeration through technical and regulatory standards
Innovation and technology policy
Technology push and pull – emphasis on a systemic approach
Export promotion
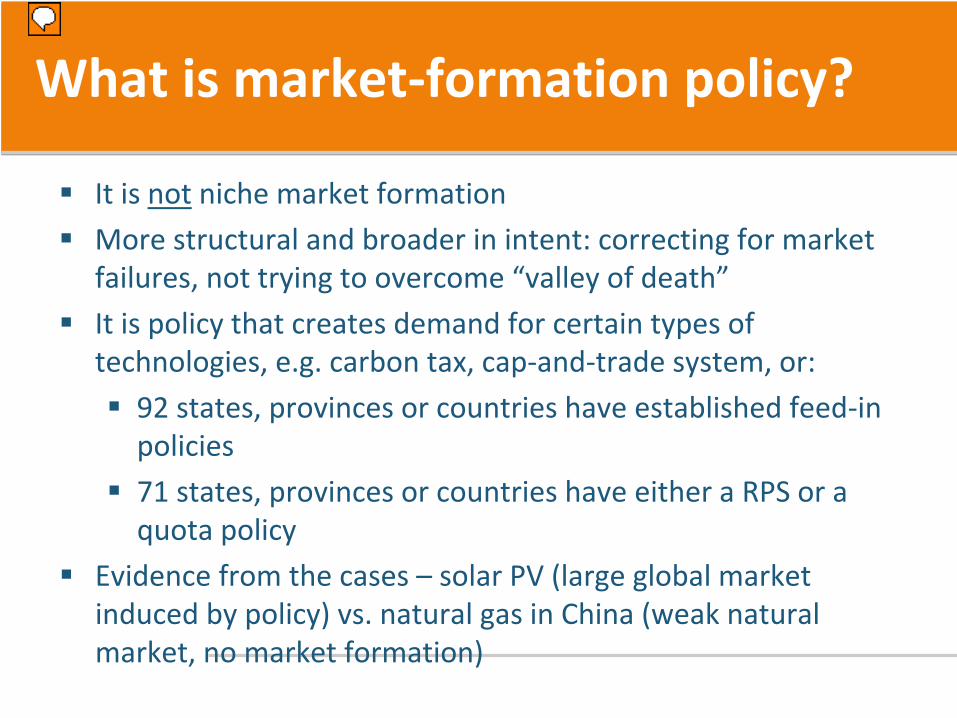
What is market‐formation policy?
It is not niche market formation
More structural and broader in intent: correcting for market failures, not trying to overcome “valley of death”
It is policy that creates demand for certain types of technologies, e.g. carbon tax, cap‐and‐trade system, or:
92 states, provinces or countries have established feed‐in policies
71 states, provinces or countries have either a RPS or a quota policy
Evidence from the cases – solar PV (large global market induced by policy) vs. natural gas in China (weak natural market, no market formation)
Presenter�
Presentation Notes�
One hundred and nine countries have enacted some form of policy to support renewable power, and 118 countries have set targets for renewable energy. Ninety-two states, provinces, or countries have feed-in policies and 71 have either an RPS or a quota policy. �

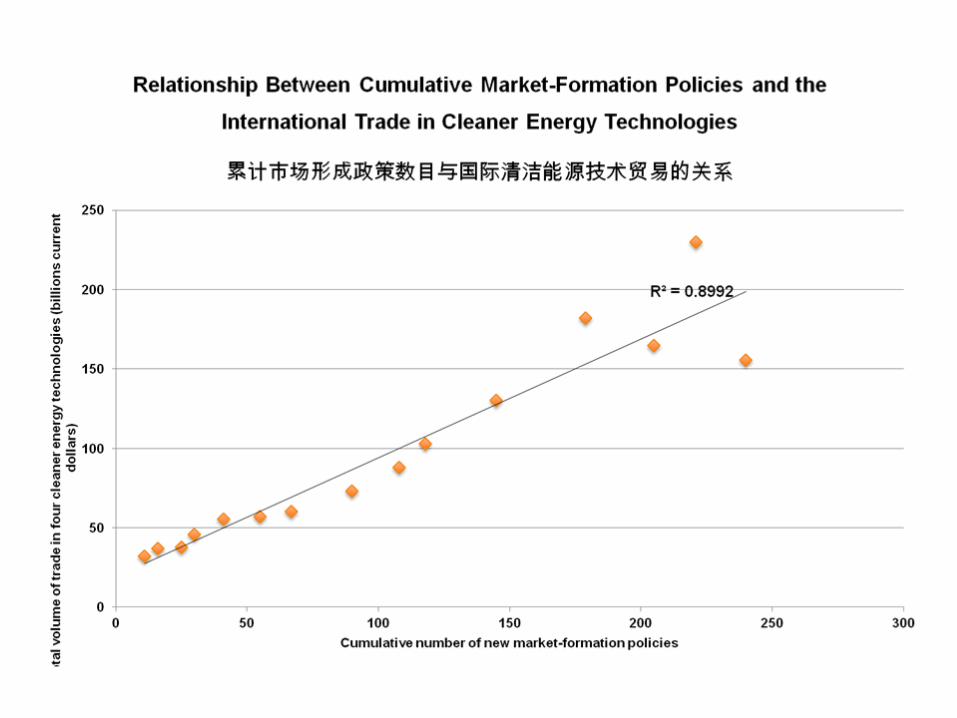
Trade data from COMTRADE (UN Statistics Division). Policy data compiled from various sources by Gallagher, K.S. 2013
Presenter�
Presentation Notes�
For these four clean energy technologies alone, the volume of exports and imports grew 259% between 2000-2010, compared with 118% for the exports and imports of total manufactured goods globally. Chinese exports of solar PV were only worth $93 million in 1997, accounting for just 3 percent of global exports, but by 2011, Chinese exports had soared to $27 billion, accounting for 45 percent of global exports These figures were calculated from data obtained through COMTRADE (UN Statistics Division website) and the World Development Indicators (World Bank). �

The clean energy industry globalized around 2000: why and how?
Internationalization of university education
International collaboration
Ease and increased normalcy of migration
Globalization of energy RD&D
Aggregated national market formation policies = global markets
Trade liberalization and new int’l institutions
Chinese willingness to finance the transition
Presenter�
Presentation Notes�
According to UNESCO, between 1998 and 2010, the number of internationally mobile students nearly doubled. China’s share of the total grew from just 7% in 1998 to 17 percent in 2010 (UNESCO 2011). Duke-Huaneng --- GreenGen and Edwardsport �
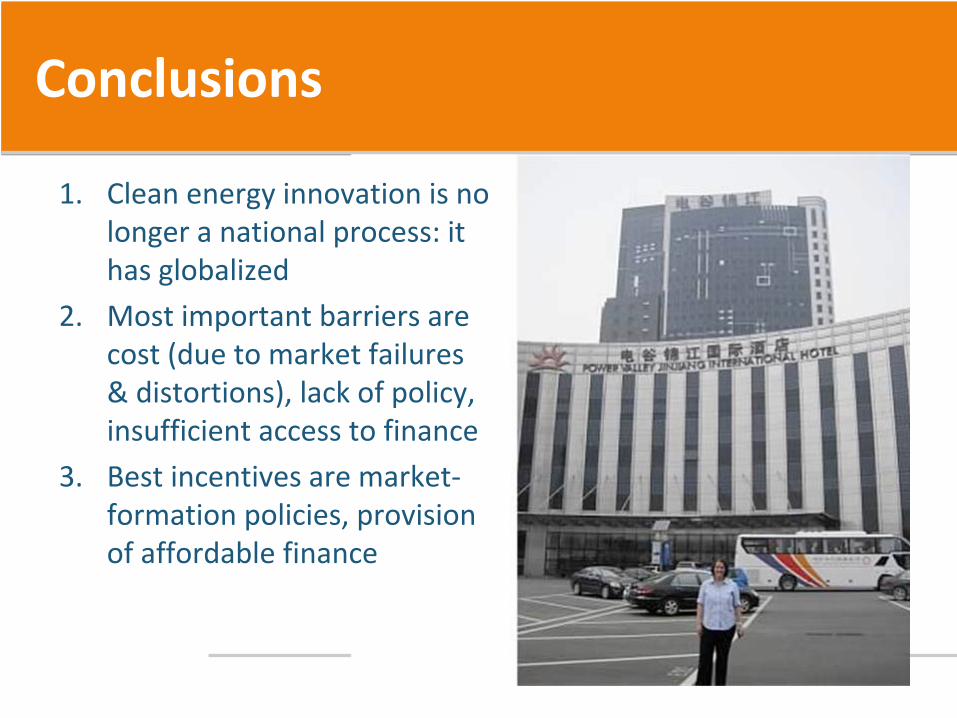
Conclusions
1.
Clean energy innovation is no
longer a national process: it
has globalized
2.
Most important barriers are
cost (due to market failures
& distortions), lack of policy,
insufficient access to finance
3.
Best incentives are market‐
formation policies, provision
of affordable finance
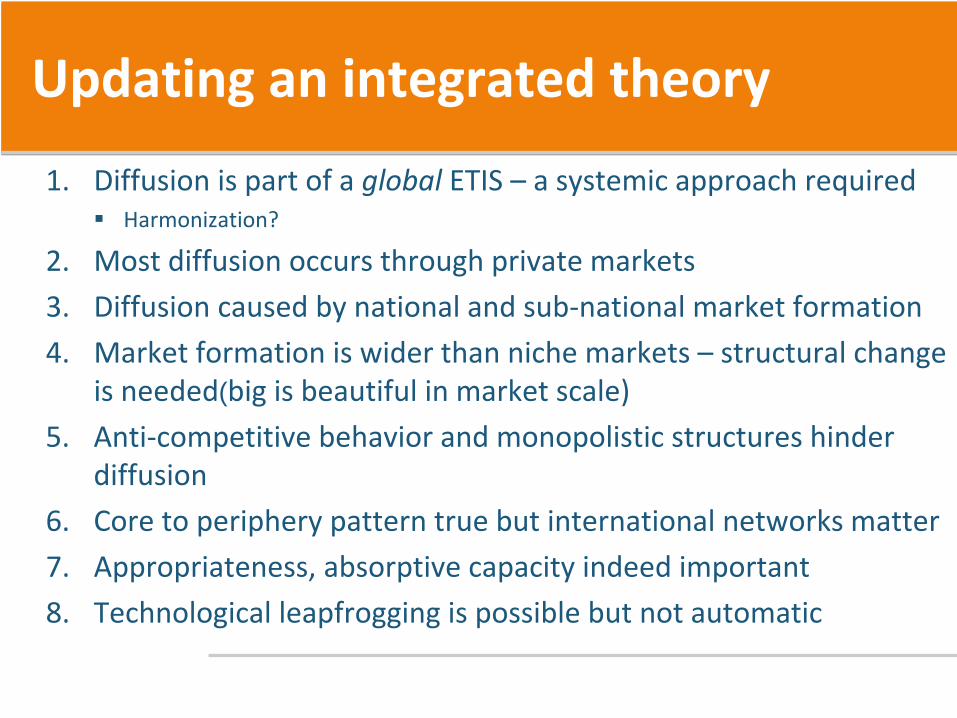
Updating an integrated theory
1.
Diffusion is part of a global
ETIS – a systemic approach required
Harmonization?
2.
Most diffusion occurs through private markets
3.
Diffusion caused by national and sub‐national market formation
4.
Market formation is wider than niche markets –
structural change
is needed(big is beautiful in market scale)
5.
Anti‐competitive behavior and monopolistic structures hinder
diffusion
6.
Core to periphery pattern true but international networks matter
7.
Appropriateness, absorptive capacity indeed important
8.
Technological leapfrogging is possible but not automatic

Acknowledgements
Book is The Global Diffusion of Clean Energy Technologies: Lessons from China (The MIT Press: January 2014)
Financial support from William and Flora Hewlett Foundation, BP Group, and The Fletcher School
Contact
Kelly Sims Gallagher
Associate Professor of Energy & Environmental Policy and
Director, Center for International Environment & Resource Policy
The Fletcher School | Tufts University
Senior Research Associate, Belfer Center for Science & International Affairs
Harvard Kennedy School | Harvard University
Personal website: http://sites.tufts.edu/ksgallagher/
http://fletcher.tufts.edu/CIERP

Back‐Up

Estimated Levelized Cost of New Generation Resources for Plants Entering Service in the United States in 2017 (2012$/MWh)
2017 年美国投入使用的发电厂的平准化发电成本成本估计 Plant Type Capacity
Factor (%)
Fixed O&M
Variable O&M (includ-ing fuel)
Trans-mission Investment
Total System Cost (average)
Total System Cost (min-imum)
Total System Cost (max-imum)
Conventional coal 85 4.0 27.5 1.2 97.7 90.5 114.3Advanced coal 85 6.6 29.1 1.2 110.9 102.5 124.0Adv. coal with CCS 85 9.3 36.4 1.2 138.8 127.7 158.2Conventional natural gas combined cycle
87 1.9 45.8 1.2 66.1 59.5 81.0
Adv. natural gas combined cycle with CCS
87 4.0 50.6 1.2 90.1 56.8 76.4
Advanced nuclear 90 11.3 11.6 1.1 111.4 107.2 118.7Geothermal 91 11.9 9.6 1.5 98.2 84.0 112.0Biomass 83 13.8 44.3 1.3 115.4 97.8 136.7Wind 33 9.8 0 3.8 96.0 77.0 112.2Solar PV (utility) 25 7.7 0 3.8 152.7 119.0 238.8Solar thermal 20 40.1 0 6.3 242.0 176.1 386.2Hydro 53 4 6 2.1 88.9 57.8 147.6Notes: Source: Adapted from U.S. Energy Information Administration, Annual Energy Outlook 2012, June 2012, DOE/EIA-0383 (2012).