Differentiation of Muscle, Fat, Cartilage, and Bone from Progenitor
13
Differentiation of Muscle, Fat, Cartilage, and Bone from Progenitor Cells Present in a Bone-derived Clonal Cell Population: Effect of Dexamethasone Agamemnon E. Grigoriadis, Johan N. M. Heersche, and Jane E. Aubin Medical Research Council Group in Periodontal Physiology, University of Toronto, Toronto, Ontario, Canada M5S IA8 Abstract. RCJ 3.1, a clonally derived cell population isolated from 21-d fetal rat calvaria, expresses the osteoblast-associated characteristics of polygonal mor- phology, a cAMP response to parathyroid hormone, synthesis of predominantly type I collagen, and the presence of 1,25-dihydroxyvitamin D3-regulated alka- line phosphatase activity. When cultured in the pres- ence of ascorbic acid, sodium 13-glycerophosphate, and the synthetic glucocorticoid dexamethasone, this clone differentiated in a time-dependent manner into four morphologically distinct phenotypes of known mesen- chymal origin. Multinucleated muscle cells were ob- served as early as 9-10 d in culture, lipid-containing adipocytes formed after 12 d, chondrocyte nodules were observed after 16 d, and mineralized bone nod- ules formed after 21 d in culture. The differentiated cell types were characterized morphologically, histochemically, and immunohistochemically. The for- mation of adipocytes and chondrocytes was dependent upon the addition of dexamethasone; the muscle and bone phenotypes were also expressed at low frequency in the absence of dexamethasone. The sex steroid hor- mones progesterone and 1713-estradiol had no effect on differentiation in this system, suggesting that the effects of dexamethasone represent effects specific for gluco- corticosteroids. Increasing concentrations of dexameth- asone (10-9-10-6 M) increased the numbers of myo- tubes, adipocytes, and chondrocytes; however, when present continuously for 35 d, the lower concentra- tions appeared to better maintain the muscle and adi- pocyte phenotypes. Bone nodules were not quantitated because the frequency of bone nodule formation was too low. Single cells obtained by plating RCJ 3.1 cells at limiting dilutions in the presence of dexamethasone, were shown to give rise to subclones that could differentiate into either single or multiple phenotypes. Thus, the data suggest that this clonal cell line con- tains subpopulations of mesenchymal progenitor cells which can, under the influence of glucocorticoid hor- mones, differentiate in vitro into four distinct cell types. It is, therefore, a unique cell line which will be of great use in the study of the regulation of mesen- chymal stem cell differentiation. T HE regulation of the differentiation of mesenchymal precursor cells into specialized connective tissue cells such as the cells of bone, cartilage, muscle, and adi- pose tissues is poorly understood. Osteoblasts, chondro- cytes, myotubes, and adipocytes may be related at the level of a less restricted precursor cell population. This is sug- gested by the observation that demineralized bone induces formation of cartilage in rat skeletal muscle (49, 65); by the finding that embryonic chick limb bud mesenchymal cells differentiate into muscle, cartilage, and bone (9, 10, 45, 46); and by the observed differentiation of clonal mouse embryo fibroblasts into muscle, fat, and cartilage (63). Recently, we (7) and others (41) have shown that mixed populations of cells enzymatically isolated from 21-d fetal rat calvaria and cul- tured for periods ranging from 14 to 21 d form bone nodules which mineralize in the presence of organic phosphate. Quan- titation of the numbers of bone nodules formed suggested that in the mixed cell population a limited number of progen- itor cells are present which have the capacity to differentiate along the osteogenic pathway (Bellows, C. G., and J. E. Au- bin, manuscript submitted for publication). The exact nature of these putative progenitor cells and the factors regulating their activities are not known, although it has recently been shown that glucocorticoids increase the expression of the bone phenotype (6, 7) and permit the expression of cartilage in this system (Bellows, C. G., J. E. Aubin, and J. N. M. Heersche, manuscript submitted for publication). It is also not known how this type of osteoprogenitor is related to other mesenchymally derived cells, such as cartilage, muscle, and adipose tissue (for review see reference 47). Earlier, we isolated a number of clonal cell lines from cell populations derived from 21-d fetal rat calvaria and showed that distinct populations with characteristic biochemical phenotypes could be recovered (4). In the present study, we wished to determine whether any of the clonal lines that ex- pressed properties associated with the osteoblast phenotype © The Rockefeller University Press, 0021-9525/88/06/2139/13 $2.00 The Journal of Cell Biology, Volume 106, June 1988 2139-2151 2139 on April 10, 2019 jcb.rupress.org Downloaded from http://doi.org/10.1083/jcb.106.6.2139 Published Online: 1 June, 1988 | Supp Info:
Transcript of Differentiation of Muscle, Fat, Cartilage, and Bone from Progenitor
Differentiation of Muscle, Fat, Cartilage, and Bone from Progenitor Cells Present in a Bone-derived Clonal Cell Population: Effect of Dexamethasone A g a m e m n o n E. Grigoriadis , Johan N. M. Heersche, and Jane E. Aubin
Medical Research Council Group in Periodontal Physiology, University of Toronto, Toronto, Ontario, Canada M5S IA8
Abstract. RCJ 3.1, a clonally derived cell population isolated from 21-d fetal rat calvaria, expresses the osteoblast-associated characteristics of polygonal mor- phology, a cAMP response to parathyroid hormone, synthesis of predominantly type I collagen, and the presence of 1,25-dihydroxyvitamin D3-regulated alka- line phosphatase activity. When cultured in the pres- ence of ascorbic acid, sodium 13-glycerophosphate, and the synthetic glucocorticoid dexamethasone, this clone differentiated in a time-dependent manner into four morphologically distinct phenotypes of known mesen- chymal origin. Multinucleated muscle cells were ob- served as early as 9-10 d in culture, lipid-containing adipocytes formed after 12 d, chondrocyte nodules were observed after 16 d, and mineralized bone nod- ules formed after 21 d in culture. The differentiated cell types were characterized morphologically, histochemically, and immunohistochemically. The for- mation of adipocytes and chondrocytes was dependent upon the addition of dexamethasone; the muscle and bone phenotypes were also expressed at low frequency in the absence of dexamethasone. The sex steroid hor-
mones progesterone and 1713-estradiol had no effect on differentiation in this system, suggesting that the effects of dexamethasone represent effects specific for gluco- corticosteroids. Increasing concentrations of dexameth- asone (10-9-10 -6 M) increased the numbers of myo- tubes, adipocytes, and chondrocytes; however, when present continuously for 35 d, the lower concentra- tions appeared to better maintain the muscle and adi- pocyte phenotypes. Bone nodules were not quantitated because the frequency of bone nodule formation was t o o low. Single cells obtained by plating RCJ 3.1 cells at limiting dilutions in the presence of dexamethasone, were shown to give rise to subclones that could differentiate into either single or multiple phenotypes. Thus, the data suggest that this clonal cell line con- tains subpopulations of mesenchymal progenitor cells which can, under the influence of glucocorticoid hor- mones, differentiate in vitro into four distinct cell types. It is, therefore, a unique cell line which will be of great use in the study of the regulation of mesen- chymal stem cell differentiation.
T HE regulation of the differentiation of mesenchymal precursor cells into specialized connective tissue cells such as the cells of bone, cartilage, muscle, and adi-
pose tissues is poorly understood. Osteoblasts, chondro- cytes, myotubes, and adipocytes may be related at the level of a less restricted precursor cell population. This is sug- gested by the observation that demineralized bone induces formation of cartilage in rat skeletal muscle (49, 65); by the finding that embryonic chick limb bud mesenchymal cells differentiate into muscle, cartilage, and bone (9, 10, 45, 46); and by the observed differentiation of clonal mouse embryo fibroblasts into muscle, fat, and cartilage (63). Recently, we (7) and others (41) have shown that mixed populations of cells enzymatically isolated from 21-d fetal rat calvaria and cul- tured for periods ranging from 14 to 21 d form bone nodules which mineralize in the presence of organic phosphate. Quan- titation of the numbers of bone nodules formed suggested that in the mixed cell population a limited number of progen-
itor cells are present which have the capacity to differentiate along the osteogenic pathway (Bellows, C. G., and J. E. Au- bin, manuscript submitted for publication). The exact nature of these putative progenitor cells and the factors regulating their activities are not known, although it has recently been shown that glucocorticoids increase the expression of the bone phenotype (6, 7) and permit the expression of cartilage in this system (Bellows, C. G., J. E. Aubin, and J. N. M. Heersche, manuscript submitted for publication). It is also not known how this type of osteoprogenitor is related to other mesenchymally derived cells, such as cartilage, muscle, and adipose tissue (for review see reference 47).
Earlier, we isolated a number of clonal cell lines from cell populations derived from 21-d fetal rat calvaria and showed that distinct populations with characteristic biochemical phenotypes could be recovered (4). In the present study, we wished to determine whether any of the clonal lines that ex- pressed properties associated with the osteoblast phenotype
© The Rockefeller University Press, 0021-9525/88/06/2139/13 $2.00 The Journal of Cell Biology, Volume 106, June 1988 2139-2151 2139
on April 10, 2019jcb.rupress.org Downloaded from http://doi.org/10.1083/jcb.106.6.2139Published Online: 1 June, 1988 | Supp Info:

had the capacity to differentiate in vitro under conditions pre- viously shown to maximally stimulate bone nodule forma- tion in mixed rat calvaria cultures (6, 7). We found that one of these clonal cell lines, RCJ 3.1, differentiated into four morphologically distinct cell types: multinucleated muscle cells, fat-containing adipocytes, chondrocytes, and osteo- blasts. In addition, we analyzed the potential of subclones isolated from RCJ 3.1 cells to generate populations differen- tiating into one or more phenotypes.
Materials and Methods
Cloning and Cell Culture The cell population used in this study, RCJ 3.1, was isolated in 1980 by limit- ing dilution cloning from population III of a sequential collagenase diges- tion of 21-d fetal rat calvaria cells (4). Single-cell suspensions of fourth sub- culture population III were plated at limiting dilutions of "~1 and 5 cells/ 16-mm well and left undisturbed for "~10 d. Multicolony wells were used only for the determination of plating efficiency; from a total of 432 cells plated, 41 colonies were detectable, yielding a plating efficiency of "~9%. The percentage of wells containing more than 1 colony was low, varying be- tween 4 and 15%, whereas the percentage of wells containing no colonies was high, varying between 40 and 90%. Clones from twelve wells contain- ing single colonies were subcultured and maintained, and 4 (designated 3.1, 3.2, 3.4, and 3.12) survived to population doubling levels of >20. Spe- cifically, RCJ 3.1 was derived from a multiwell plate seeded at 5 cells/well which, upon screening, had 67 % of the wells containing no colonies, 25 % containing one colony, and 8% containing >1 colony, suggesting a high probability that the single colony wells were clonal in origin (34). Since we were interested in obtaining clonal cell lines with phenotypic properties of osteoblasts, the four clonal lines surviving to population doubling levels >20 were screened for the presence of osteoblast properties (e.g., cAMP responsiveness to parathyroid hormone, type I collagen synthesis) as early as possible (population doubling levels •20-25) and were frozen soon thereafter. As expected based on previous cloning experiments (4), the four clones were different with respect to their morphology, hormone respon- siveness, and collagen synthesis. All experiments reported here were per- formed on RCJ 3.1 cells recovered from the same frozen stock; i.e., cells at ,'~45 population doublings from the initial single cell. This was done to avoid the possibility that the phenotype expressed by the cells would change during the course of our experiments (4a, 8, 26).
For analysis of subclones, single cell suspensions of RCJ 3.1 cells were plated at limiting dilutions of '~0.25, 0.5, and 1.0 cells/6-mm-diam microti- ter well (Nunc; Gibco, Grand Island, NY) in the presence of sodium I~-glyc- eropbosphate (I~-GP), ~ ascorbic acid, and 10 -7 M dexamethasone; 300 wells were prepared at each dilution. Only single-colony wells were selected for study; these were maintained for 30 d, fixed, stained, and scored for the presence of each phenotype, as described below.
Cells were routinely maintained in standard medium: a-Minimal Essen- tial Medium (ct-MEM + RNA-DNA, Flow Laboratories, Inc., McLean, VA) containing 15 % FBS and antibiotics (100 p,g/ml penicillin G, 50 p,g/ml gentamicin, and 0.3 p.g/ml fungizone) at 37°C in a humidified atmosphere of 5% CO2 in air. For all experiments, RCJ 3.1 cells were plated at --50,000 cells/35-mm culture dish (5.2 × 10³ cells/era 2) in standard medium. 24 h after plating, the medium was changed to either standard medium, sup- plemented medium (standard medium plus 50 lag/ml ascorbic acid [Fisher Scientific Co., Don Mills, Ontario] and 10 mM I~-GP [BDH Chemicals, Toronto, Ontario]) or supplemented medium containing various concentra- tions of dexamethasone, other steroid hormones (progesterone, 17~estra- diol, hydrocortisone; Sigma Chemical Co., St. Louis, MO), or ethanol ve- hicle. Dexamethasone stock solutions were prepared in absolute ethanol at 10 -3 M and the final ethanol concentration in all cultures did not exceed 0.1% vol/vol. Media supplemented with fresh [~-GP, ascorbic acid, and the appropriate concentration of steroid hormones were changed three times weekly. Under these conditions, cells reached confluence by 5 d and could be maintained for at least 35 d.
cAMP Determination Cells were plated in standard medium at 50,000 cells/35-mm culture dish
1. Abbreviations used in this paper: 13-GE sodium 13-glycerophosphate; 1,25-(OH)2D3, 1,25-dihydroxyvitamin D3.
and assayed at confluence. The effects of parathyroid hormone (bPTH [1-84], 2,200 U/mg, donated by Dr. T. M. Murray, University of Toronto, Canada), l-lsoproterenol (Sigma Chemical Co.), and prostaglandin E2 (Upjohn Co., Kalamazoo, MI) on intracellular cAMP were analyzed by in- cubating intact cells with [3H]adenine as described previously (23). All agonist incubations were for 10 min at room temperature, after pretreatment of the cells with phosphodiesterase inhibitor, 3-isobutyl-l-methylxanthine (Sigma Chemical Co.).
Alkaline Phosphatase Activity Cells were plated in standard medium at 50000 cells/35-mm culture dish. After 24 h, the medium was changed to standard medium containing 2% FBS and either vehicle (0.1% ethanol) or 10 -7 M 1,25-dihydroxyvitamin D3 (1,25-[OH]2D3) and cultured for a further 72 h. Alakaline phosphatase activity was measured according to the method of Lowry (38) as described previously (23).
Analysis of Collagen ~pes Cells were cultured for 72 h in either standard medium or supplemented medium containing either vehicle or dexamethasone. At confluence, the cells were pulse-labeled for 30 rain at 37°C in medium containing 50 p.Ci [35S]methionine (New England Nuclear Corp., Lachine, Quebec). After the pulse, the cells were washed and incubated for4 h in medium containing 1% FBS. The chase media were then collected and aliquots were digested with 0.1 mg/ml pepsin (Worthington Biochemical Corp., Freehold, NJ) at pH 2.3 (0.5 N acetic acid-HCl) for 4.5 h at 15°C. The pepsin-resistant col- lagen was lyophilized and the a chains were analyzed by SDS-PAGE using delayed reduction as described previously (8, 36).
Quantitation of Muscle, Fat, Cartilage, and Bone Living cultures were routinely examined using phase-contrast microscopy and were fixed at various times for histology, indirect immunofluorescence, and quantitation of the cell types present.
Muscle was identified morphologically by the appearance of multi- nucleated myotubes, and immunochemically by the presence of the muscle- specific intermediate filament protein desmin and the presence of acetylcho- line receptors. After various culture periods, representative cultures were fixed in neutral buffered formalin and stained with haematoxylin and eosin. For desmin staining, cells were fixed in situ with -20°C methanol for 5 min and incubated with a mouse mAb against desmin (15; Boehringer-Mann- heim Canada, Montreal, Quebec) at 15 p.g/ml in PBS. The second antibody was sheep anti-mouse FITC-conjugated F(ab')2 fragments of IgG at 50 ~tg/ ml in PBS. Both incubations were for 45 min at 37°C, each followed by three 5-min washes in PBS. The cells were then covered with PBS and observed immediately with a water immersion objective on a Zeiss Photomicroscope III equipped for epifluorescence and photographed with Kodak Tri-X Pan film. For detecting the presence of acetylcholine receptors, cells were in- cubated with 7 × 10 -s M tetramethylrhodamine-a-bungarotoxin (Molecu- lar Probes Inc., Eugene, OR; see reference 48) in tt-MEM containing 3 mg/ml BSA for I h at 37°C as described previously (66). Cells were then washed and fixed in 1% formaldehyde at 4°C for 30 min, and observed and photographed as described above. Since there was a large variation in the size of myotube colonies and in the number of nuclei per myotube, an ac- curate assessment of myotube formation could not be achieved; therefore the effect of dexamethasone on myotube formation was evaluated by estimat- ing the percentage of microscope fields which contained at least one myo- tube (minimum 60-75 fields/dish, 2-ram field diam).
For quantitation of adipocytes, cultures were fixed overnight in neutral buffered formalin, washed in 70% ethanol, and stained in situ for neutral lipid with Sudan IV for 10 min (13). Each dish was examined in its entirety for adipocyte colonies using a Nikon inverted microscope by placing the dish on a transparent acetate grid ruled in 2-mm squares. A focus of adipo- cytes was defined as a group of one or more lipid-containing (Sudan IV- positive) cells separated from other similar colonies by at least one micro- scope field (2-mm field diam). The total number of stained adipocyte foci, and the number of adipocytes per focus were counted. Adipocyte foci were photographed with Kodak Technical Pan film 2415.
For quantitation of cartilage, cultures were fixed overnight with neutral buffered formalin and stained in situ for glycosaminoglycans with either AI- cian blue or toluidine blue. Single loci of cartilage were defined as cartilage nodules, whereas groups of discrete nodules clus~red together within a 2-ram field diam were defined as cartilage clusters. Cartilage nodules and clusters were counted and photographed in a similar manner as described above for the adipocyte foci.
The Journal of Cell Biology, Volume 106, 1988 2140

Figure 1. Phase-contrast micrographs of RCJ 3.1 cells. Cells cul- tured in standard culture medium typically appear fibroblast-like at subconfluence (a), while at confluence the cells form a layer of cu- boidal or polygonal cells (b). Bar, 20 p.m.
% E
8.0 A
6.0
4.0
2.0
0.0 Co
[ PTH IPT
g PGE 2
0.8
~ 0.6
o ~ #.~. 0 4
0.0 m Control
l/ 1,25-(OH)2 D 3
(0.1 uM)
Figure 2. Hormone responsiveness and alkaline phosphatase activ- ity of RCJ 3.1 cells. (A) Cells were cultured in standard medium and the effects of parathyroid hormone (PTH, 2.5 U/ml), isoproter- enol (IPT, 5 x 10 -4 M), and prostaglandin E2 (PGE2, 2.5 ~tg/ml) on intracellular cAMP were analyzed at confluence as described in Materials and Methods. (B) The effects of 1,25-(OH)2D3 (0.1 p.M) on alkaline phosphatase activity. Cells were plated in standard medium; after 24 h the medium was changed to a-MEM containing 2% FBS and either vehicle (0.1% absolute ethanol) or 1,25- (OH)2D3 and cultured for a further 72 h. Alkaline phosphatase ac- tivity was measured as described in Materials and Methods.
Bone was identified morphologically and histologically as previously de- scribed (6). Briefly, cultures were fixed overnight with neutral buffered for- malin, the nodules were removed and embedded either in paraffin or O.C.T. compound (Tissue-Tek 4583, Miles Scientific Div., Naperville, 1L) for paraffin and frozen tissue sections, respectively. All sections were 6 ~tm thick and were stained with hematoxylin and eosin, van Gieson's picrofuch- sin for collagen, yon Kossa for mineral deposits, and Alcian blue for glycos- aminoglycans. The frequency of bone nodule formation was low; therefore we did not quantitate the number of bone nodules.
Results
Morphological and Biochemical Characteristics of RCJ 3.1
At subconfluence, RCJ 3.1 cells comprise a relatively homo- geneous population of fibroblast-like cells (Fig. 1 a), while at confluence the cells appear more polygonal and form a tightly packed monolayer (Fig. 1 b). To establish the osteo- blast-like nature of these cells, we analyzed their hormone responsiveness, alkaline phosphatase activity, and collagen synthesis. RCJ 3.1 cells responded to exogenously added parathyroid hormone, l-isoproterenol, and prostaglandin E: with an increase in intracellular cAMP over basal levels of ,~12-, 17-, and 5-fold, respectively (Fig. 2 a). Previous results have shown that RCJ 3.1 cells respond to exogenous parathyroid hormone and prostaglandin E2 by cytoplasmic
retraction (3). RCJ 3.1 cells also expressed moderately high basal levels of alkaline phosphatase activity, which increased over twofold after incubating the cells for 72 h with 10 -7 M 1,25-(OH)2D3 (Fig. 2 B). These cells synthesized predomi- nantly type I collagen (90%) and ~10% type III collagen (Fig. 3). Incubating the cells for 72 h with either 10 -9 M or 10 -7 M dexamethasone did not affect the relative amount of type I or type III collagen synthesized (Fig. 3, lanes 5 and 6). However, there was a slight reduction in the percentage of total collagen synthesized (<5%) in cultures treated for 72 h with 10 -7 M dexamethasone (data not shown).
Myotube Formation
In the absence of dexamethasone, RCJ 3.1 cells consistently formed a small number of myotubes after at least 9-10 days in culture. In the presence of dexamethasone (10 -7 M), the number of myotubes per culture dish was increased. These myotubes, which were elongated and contained many nuclei, formed both on top of and within the tightly packed mono- layer of RCJ 3.1 cells (Fig. 4, a-c). The size of the myotube colonies varied, depending upon the presence of dexametha- sone and the time in culture; some colonies contained a few large myotubes (Fig. 4 a), while others comprised as many as >50 densely packed, smaller myotubes (Fig. 4 b). In addi- tion, there was a large variation in the number of nuclei per
Grigoriadis et al. Glucocorticoids and Mesenchymal Differentiation 2141
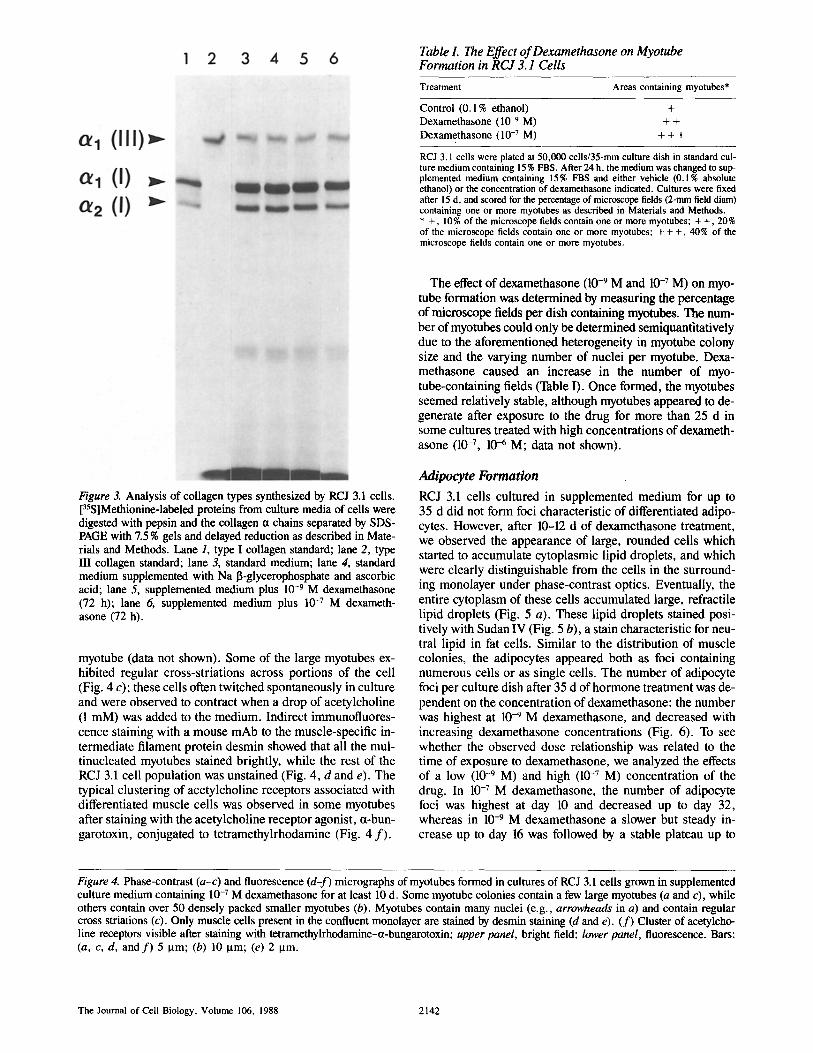
Table L The Effect of Dexamethasone on Myotube Formation in RCJ 3. I Cells
Treatment Areas containing myotubes*
Control (0.1% ethanol) + Dexamethasone (10 -9 M) + +
Dexamethasone (10 -7 M) + + +
RCJ 3.1 cells were plated at 50,000 cells/35-mm culture dish in standard cul- ture medium containing 15 % FBS. After 24 h, the medium was changed to sup- plemented medium containing 15% FBS and either vehicle (0.1% absolute ethanol) or the concentration of dexamethasone indicated. Cultures were fixed after 15 d, and scored for the percentage of microscope fields (2-mm field diam) containing one or more myotubes as described in Materials and Methods. * +, 10% of the microscope fields contain one or more myotubes; + +, 20% of the microscope fields contain one or more myotubes; + + +, 40% of the microscope fields contain one or more myotubes.
Figure 3. Analysis of collagen types synthesized by RCJ 3.1 cells. [3~S]Methionine-labeled proteins from culture media of cells were digested with pepsin and the collagen ct chains separated by SDS- PAGE with 7.5 % gels and delayed reduction as described in Mate- rials and Methods. Lane 1, type I collagen standard; lane 2, type III collagen standard; lane 3, standard medium; lane 4, standard medium supplemented with Na I~-glycerophosphate and ascorbic acid; lane 5, supplemented medium plus 10 -9 M dexamethasone (72 h); lane 6, supplemented medium plus 10 -7 M dexameth- asone (72 h).
myotube (data not shown). Some of the large myotubes ex- hibited regular cross-striations across portions of the cell (Fig. 4 c); these cells often twitched spontaneously in culture and were observed to contract when a drop of acetylcholine (1 mM) was added to the medium. Indirect immunofluores- cence staining with a mouse mAb to the muscle-specific in- termediate filament protein desmin showed that all the mul- tinucleated myotubes stained brightly, while the rest of the RCJ 3.1 cell population was unstained (Fig. 4, d and e). The typical clustering of acetylcholine receptors associated with differentiated muscle cells was observed in some myotubes after staining with the acetylcholine receptor agonist, ct-bun- garotoxin, conjugated to tetramethylrhodamine (Fig. 4 f ) .
The effect of dexamethasone (10 -9 M and 10 -7 M) on myo- tube formation was determined by measuring the percentage of microscope fields per dish containing myotubes. The num- ber of myotubes could only be determined semiquantitatively due to the aforementioned heterogeneity in myotube colony size and the varying number of nuclei per myotube. Dexa- methasone caused an increase in the number of myo- tube-containing fields (Table I). Once formed, the myotubes seemed relatively stable, although myotubes appeared to de- generate after exposure to the drug for more than 25 d in some cultures treated with high concentrations of dexameth- asone (10 -7, 10 -6 M; data not shown).
Adipocyte Formation
RCJ 3.1 cells cultured in supplemented medium for up to 35 d did not form foci characteristic of differentiated adipo- cytes. However, after 10-12 d of dexamethasone treatment, we observed the appearance of large, rounded cells which started to accumulate cytoplasmic lipid droplets, and which were clearly distinguishable from the cells in the surround- ing monolayer under phase-contrast optics. Eventually, the entire cytoplasm of these cells accumulated large, refractile lipid droplets (Fig. 5 a). These lipid droplets stained posi- tively with Sudan IV (Fig. 5 b), a stain characteristic for neu- tral lipid in fat cells. Similar to the distribution of muscle colonies, the adipocytes appeared both as foci containing numerous cells or as single cells. The number of adipocyte foci per culture dish after 35 d of hormone treatment was de- pendent on the concentration of dexamethasone: the number was highest at 10 -9 M dexamethasone, and decreased with increasing dexamethasone concentrations (Fig. 6). To see whether the observed dose relationship was related to the time of exposure to dexamethasone, we analyzed the effects of a low (10 -9 M ) and high (10 -7 M) concentration of the drug. In 10 -7 M dexamethasone, the number of adipocyte foci was highest at day 10 and decreased up to day 32, whereas in 10 -9 M dexamethasone a slower but steady in- crease up to day 16 was followed by a stable plateau up to
Figure 4. Phase-contrast (a-c) and fluorescence (d-f) micrographs of myotubes formed in cultures of RCJ 3.1 ceils grown in supplemented culture medium containing 10 -7 M dexamethasone for at least 10 d. Some myotube colonies contain a few large myotubes (a and c), while others contain over 50 densely packed smaller myotubes (b). Myotubes contain many nuclei (e.g., arrowheads in a) and contain regular cross striations (c). Only muscle cells present in the confluent monolayer are stained by desmin staining (d and e). (f) Cluster of acetylcho- line receptors visible after staining with tetrarnethylrhodamine-ct-bungarotoxin; upper panel, bright field; lower panel, fluorescence. Bars: (a, c, d, and f ) 5 I.tm; (b) 10 Ixm; (e) 2 txm.
The Journal of Cell Biology, Volume 106, 1988 2142

Grigoriadis et al. Glucocorticoids and Mesenchymal Differentiation 2143

Figure 5. Phase-contrast (a) and bright field (b) micrographs of adipocyte loci formed in cultures of RCJ 3.1 cells grown in supple- mented medium containing 10 -9 M dexa- methasone for at least 18 d. (b) A typical adipocyte colony stained with Sudan IV and counterstained with haematoxylin as de- scribed in Materials and Methods. The lipid vacuoles in the cells are strongly stained. Bar, 40 ~tm.
at least day 32 (Fig. 7). When the total number of adipocyte foci at each time point in Fig. 7 was analyzed for the actual number of adipocytes per focus of cells, it was observed that as the culture time progressed, foci comprised predomi- nantly small numbers of adipocytes in 10 -7 M dexametha- sone (1-5 adipocytes/focus Fig. 8 A), whereas in 10 -9 M dexamethasone, large foci containing 21-30, or >30 adipo- cytes/focus were predominant at all time points after day 12 (Fig. 8 B).
Cartilage Formation
After ~16 d of dexamethasone treatment, numerous nodules appeared comprising round or cuboidal cells which morpho- logically resembled chondrocytes and which were distinctly different from the surrounding cells (Fig. 9 a). The cells pro- duced a matrix which was highly refractile when viewed with phase-contrast microscopy, and which displayed intense AI-
Figure 6. The effect of various concentrations of dexamethasone on the number of adipocyte foci per culture dish. RCJ 3.1 cells were cultured in supplemented medium containing dexamethasone as de- scribed in Materials and Methods. After 35 d, cultures were fixed, stained with Sudan IV, and counted as described in Materials and Methods. Values represent the mean + SEM of 3-5 culture dishes.
The Journal of Cell Biology, Volume 106, 1988 2144

Figure 7. Time dependency of the formation of adipocyte foci in the presence of 10 -9 M (1) and 10 -7 M (1~) dexamethasone. RCJ 3.1 cells were cultured in supplemented medium containing dexameth- asone as described in Materials and Methods. At the indicated times, cultures were fixed, stained with Sudan IV, and counted as described in Materials and Methods. No adipocyte foci were ob- served in control cultures. Values represent the mean + SEM of 3-5 culture dishes.
cian blue staining and metachromasia with toluidine blue staining (Fig. 9, b-d). Chondrocyte-like nodules did not ap- pear in cultures treated with supplemented medium alone for periods of up to 35 d. In some cultures treated with high con- centrations of dexamethasone (10 -7 M, 10 -6 M), we ob- served several nodules clustered in a small defined area of the culture dish; such groups of nodules were defined as clusters of nodules (Fig. 9 e). In addition to the observation that cartilage formed either as discrete nodules or in clusters
Figure 8. Analysis of the size of the adipocyte foci at each time point shown in Fig. 7. Cultures treated with 10 -7 M (A) and 10 -9 M (B) dexamethasone were stained with Sudan IV and the number of adipocytes per focus counted. (11) <5; (1~) 5-10; ([]) 11-20; (~]) 21-30; (17) >30.
of nodules, we have observed mixed colonies containing both adipocytes and chondrocytes in several cultures treated with dexamethasone concentrations >110 -8 M; these were present at low frequencies and were not quantitated (data not shown).
The formation of both cartilage nodules and clusters of nodules increased with increasing concentrations of dexa- methasone (Fig. 10) when analysis was done after 35 d in cul- ture. Analysis of the time dependency of low (10 -9 M) and high (10 -7 M) concentrations of dexamethasone showed that 10 -9 M caused a slight stimulation of the number of chon- drocytes per culture dish which remained constant with in- creasing time of exposure to the drug. In contrast, the effect of 10 -7 M dexamethasone was to increase cartilage nodule formation throughout the entire 32-d culture (Fig. 11).
Bone Formation
RCJ 3.1 cells cultured for at least 21 d also formed three- dimensional nodular structures (Fig. 12 a) which morpho- logically were distinctly different from the cartilage nodules shown in Fig. 9. These nodules appeared to form with or without dexamethasone added to the culture medium. Upon further examination in cross section, the nodules consisted of a dense connective tissue matrix containing round cells resembling osteocytes, covered by a layer of polygonal or cu- boidal cells resembling osteoblasts (Fig. 12 b). That the ma- trix was collagenous in nature was confirmed by the positive staining of adjacent sections with van Gieson's picrofuchsin (data not shown). Both nonmineralized (Fig. 12 b) and min- eralized (Fig. 12 c) nodules were observed. Sections of a mineralized nodule stained with von Kossa showed intense staining associated with the mineralized portion of the nod- ule (Fig. 12 c). We did not attempt to quantitate the number of bone nodules formed because the frequency of bone nod- ule formation was very low.
Subclone Analysis
Wells containing single cells were obtained by plating single- cell suspensions of RCJ 3.1 cells at limiting dilutions in the presence of 13-GP, ascorbic acid, and 10 -7 M dexamethasone as described above. A total of 164 single colonies were selected for further study; single-colony wells found to con- tain more than one colony after a second screening were dis- carded. Of these 164 subclones, 52 (32%) gave rise to com- binations of muscle, adipocyte, and chondrocyte phenotypes (Table II). Specifically, 36 colonies (22%) were restricted to a single cell type, 14 colonies (9%) gave rise to two pheno- types, and 2 colonies (1%) gave rise to three phenotypes: muscle, fat, and cartilage. Bone nodules were not detected in these cloning experiments, as expected based on the low frequency measured earlier.
Steroid Hormone Specificity
To assess the steroid specificity of induction of the different phenotypes, cultures were treated for 30 d with 10 -7 M con- centrations of either progesterone, 1713-estradiol, hydrocorti- sone, or dexamethasone. The steroid hormones progesterone and 17~estradiol did not induce RCJ 3.1 cells to form any of the differentiated cell types observed with dexamethasone, whereas the effects of the glucocorticoid hydrocortisone were similar to those of dexamethasone (Table III).
Grigoriadis et al. Glucocorticoids and Mesenchymal Differentiation 2145
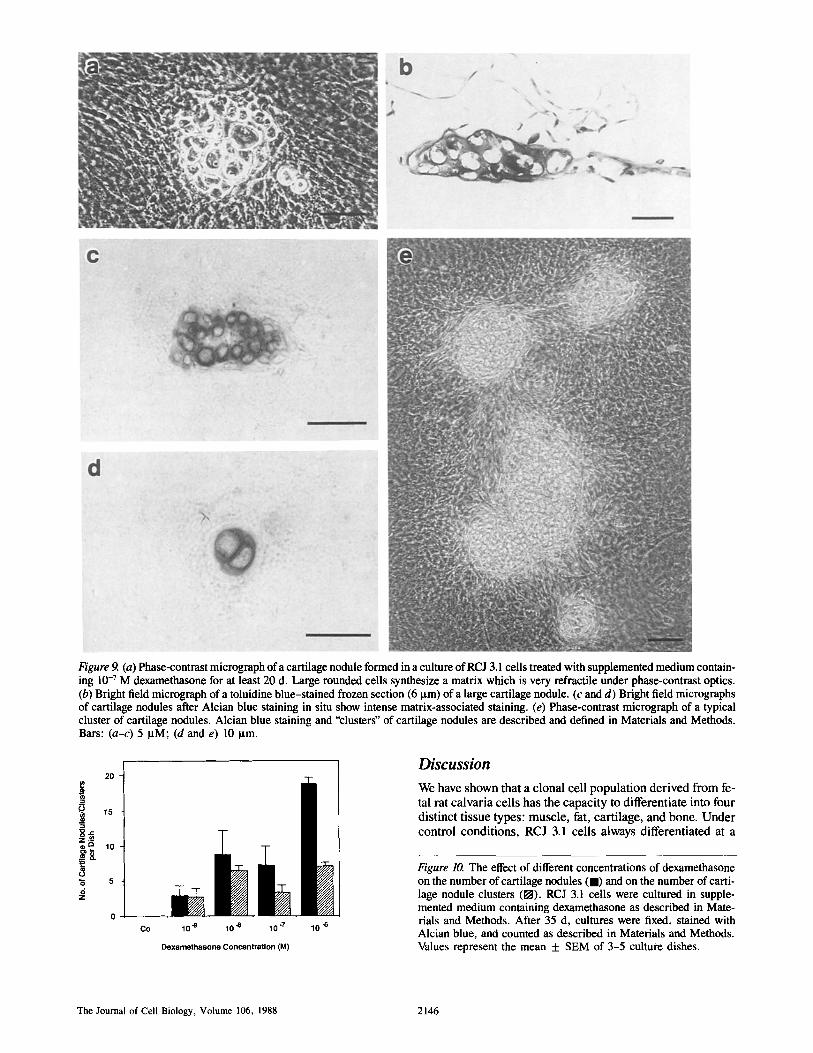
Figure 9. (a) Phase-contrast micrograph of a cartilage nodule formed in a culture of RCJ 3,1 cells treated with supplemented medium contain- ing 10 -7 M dexamethasone for at least 20 d. Large rounded cells synthesize a matrix which is very refractile under phase-contrast optics. (b) Bright field micrograph of a toluidine blue-stained frozen section (6 ~tm) of a large cartilage nodule. (c and d) Bright field micrographs of cartilage nodules after Alcian blue staining in situ show intense matrix-associated staining. (e) Phase-contrast micrograph of a typical cluster of cartilage nodules. Alcian blue staining and "clusters" of cartilage nodules are described and defined in Materials and Methods. Bars: (a-c) 5 p.M; (d and e) 10 Ixm.
6 6 z
20
15
10
Co 10 -9 10 "s 10.7
Dexarnethasone Concentration (M)
10 .6
Discussion
We have shown that a clonal cell population derived from fe- tal rat calvaria cells has the capacity to differentiate into four distinct tissue types: muscle, fat, cartilage, and bone. Under control conditions, RCJ 3.1 cells always differentiated at a
Figure 10. The effect of different concentrations of dexamethasone on the number of cartilage nodules (11) and on the number of carti- lage nodule clusters (E~). RCJ 3.1 cells were cultured in supple- mented medium containing dexamethasone as described in Mate- rials and Methods. After 35 d, cultures were fixed, stained with Alcian blue, and counted as described in Materials and Methods. Values represent the mean + SEM of 3-5 culture dishes.
The Journal of Cell Biology, Volume 106, 1988 2146

I 6
0 ~ 4
'8 2
14 16 18 20 24 28 32
DurJlon of Oexamethlone Tr,~m~t (dw.)
Figure 11. Time dependency of the formation of cartilage nodules in the presence of 10 -9 M ([]) and 10 -7 M (11) dexamethasone. RCJ 3.1 cells were cultured in supplemented medium containing dexamethasone. At the indicated times, cultures were fixed, stained with Alcian blue, and counted as described in Materials and Methods. No cartilage nodules were observed in control cultures. Values represent the mean + SEM of 3-5 culture dishes.
low frequency into muscle cells, and occasionally into osteo- blasts, but adipocytes and chondrocytes appeared only after the addition of dexamethasone. The chronological develop- ment of the four tissue types (that is, muscle first, followed by fat, cartilage, and then bone) was identical in all experi- ments and only occurred after the cells reached confluence. The dexamethasone effect on the expression of the muscle, adipocyte, and chondrocyte phenotypes was both dose and time dependent, and apparently specific for glucocortico- steroid hormones since the sex steroid hormones progester- one and 17ffestradiol had no effect.
Myotubes appeared mainly in colonies of varying size, suggesting that they formed as a result of local proliferation of muscle progenitor cells and fusion of mononuclear myo- blast-like precursor cells, similar to myotube formation in primary muscle cell cultures or in isolated myoblast cell lines (for example L6; 68, 69). The formation of myotubes in the absence of dexamethasone suggests that a certain sub- population of cells in RCJ 3.1 has the capacity to differentiate along a myogenic pathway without exogenous stimulation. The increase, after treatment with dexamethasone, in the percentage of microscopic fields per culture dish that con- tained myotubes suggests that the drug stimulated the proliferation and/or differentiation of these putative muscle progenitor cells. Since our standard culture medium was supplemented with 15% FBS, it is not clear whether this effect reflects a direct action of glucocorticoids on muscle differentiation in vitro, or an indirect effect (see below).
Adipocytes were not observed in control cultures, despite supplementation of the culture medium with 50 Ixg/ml ascor- bic acid which has been reported to stimulate adipocyte con- version in other cell systems (63). This is in direct contrast to all previously described preadipocyte cell lines (e.g., 3T3- L1 [20], 3T3-F422A [21], TA1 [11], and Ob17 [42] to mention but a few), which differentiate under normal culture condi- tions into lipid-containing adipocytes if the cultures are maintained after the population reaches confluence. Thus, RCJ 3.1 is unique in that dexamethasone appears to be an ab- solute requirement for the expression of the adipocyte pheno-
type. However, dexamethasone has been shown to accelerate the appearance of the adipocytes in some of the above men- tioned preadipocyte cell lines (11, 31, 52, 53), and stimulate the differentiation and expression of several mRNAs specific for mature adipocytes (11, 51).
Most adipocytes appeared typically in foci of either a few cells or many tightly packed cells, suggesting that they origi- nated from the proliferation and differentiation of single adipocyte precursor cells. Interestingly, the stimulation of adipocyte differenfiaton by 10 -7 M dexamethasone was great- er than the response to 10 -9 M dexamethasone at day 10-11 of culture, while after day 16, the number of adipocytes ob- served in 10 -9 M dexamethasone was greater than that seen with 10 -7 M. In addition, cultures treated with 10 -9 M dexamethasone contained many foci with >30 adipo- cytes/foci, whereas cultures in 10- 7 M dexamethasone com- prised foci with very small numbers of adipocytes, suggest- ing that the lower steroid concentration may be stimulating the proliferation of adipocytes. Alternatively, higher concen- trations of dexamethasone may be toxic to adipocytes over long exposure periods. Consistent with this latter view is the observation that some lipid droplets which formed in cells in response to 10-6-10 -7 M dexamethasone gradually de- creased in size at later time points (data not shown). That high concentrations of dexamethasone may be inhibitory for lipid accumulation in adipocytes has been reported in MC3T3- G2/PA6 cells (31). An additional factor, perhaps insulin, may be required for the maintenance of the differentiated pheno- type (31, 56, 61).
Dexamethasone treatment also caused the appearance of cells with the phenotype of cartilage cells. Since we did not observe any chondrocytes in the RCJ 3.1 population without dexamethasone treatment, it appears that dexamethasone was required for the differentiation of chondroblast-like cells in this system. In addition, the fact that the clusters of carti- lage nodules were observed only in the presence of 10 -7 M and 10 -6 M dexamethasone suggests that the higher concen- trations of dexamethasone may have also stimulated the proliferation of chondrocyte progenitors. The effects of glu- cocorticoids on chondrocyte proliferation vary, depending upon the culture system or species used (29, 39, 62; Bellows, C. G., J. E. Aubin, and J. N. M. Heersche, manuscript sub- mitted for publication).
RCJ 3.1 cells also differentiated into three-dimensional nodules with the morphological and histological properties of bone. The cuboidal layer of cells resembling osteoblasts which covered the nodules, the collagenous matrix contain- ing cells resembling osteocytes, and the fact that the matrix had the capacity to mineralize, are properties which are iden- tical to those of the bone nodules formed in mixed cultures of fetal rat calvaria cells previously described in our labora- tory (7) and that of Nefussi et al. (41). Although the forma- tion of bone nodules by RCJ 3.1 cells did not appear to be dependent upon the addition of dexamethasone, further effects of dexamethasone could not be analyzed because the low frequency of bone nodule formation precluded their quantitation. Consistent with the initial observation that RCJ 3.1 cells possess several biochemical and morphological properties associated with cells of the osteoblast lineage (see Figs. 1-3 and reference 3), these data further support the presence within the RCJ 3.1 cell population of osteoprogeni- tor cells which have the capacity to differentiate along an os-
Grigoriadis et al. Glucocorticoids and Mesenchymal Differentiation 2147

Figure 12. (a) Phase-contrast micrograph of an unmineralized bone nodule formed in a culture of RCJ 3.1 cells after 25 d of culture in supplemented medium con- raining ethanol vehicle (0.1% [vol/vol]). The nodule is lined by polygonal cells which are at a different focal plane than those in the adjacent cell layer. (b) Bright field micrograph of a paraffin section (6 gtm) through the bone nodule in a, stained with haematoxylin and eosin. The nodule consists of a layer of cuboidal osteoblast-like cells (e.g., arrowheads) covering an eosinophilic collagenous ma- trix containing rounded osteocytelike cells (e.g., arrow). (c) Bright field micro- graph of a frozen section (6 I.tm) through a mineralized bone nodule formed in a culture of RCJ 3.1 cells after 30 d in sup- plemented medium containing 10 -7 M dexamethasone and stained with von Kossa for calcium mineral deposits. Bars, 5 I.tm.
teogenic pathway and form bone. It remains to be seen whether it is a certain proportion of cells, or all the cells within RCJ 3.1 which confer these osteoblast-like properties to the RCJ 3.1 cell population. We are currently investigating whether subclones restricted to particular lineages also ex- press the biochemical parameters of osteoblast-like cells.
Taken together, our results indicate that the RCJ 3.1 clonal cell population contains a subpopulation(s) of progenitor
cells which is susceptible to the regulatory effects of gluco- corticoid hormones, and can differentiate into several differ- ent cell types. As a clonally derived population, the earliest precursor of the four cell types was a single type of cell. However, that there exist multiple progenitors within RCJ 3.1 which can differentiate along several distinct pathways is evi- dent from the subclone experiments, where it was possible to isolate both subclones containing mixed colonies (muscle
The Journal of Cell Biology, Volume 106, 1988 2148

Table II. Analysis of the Differentiation Potential of RCJ 3.1 Subclones
Contents of clone Colonies (% total)*
M y o t u b e s on ly Adipocytes only Chondrocytes only Myotubes and adipocytes Myotubes and chondrocytes Adipocytes and chondrocytes Myotubes, adipocytes, and chondrocytes
n
8 (5%) 15 (9%) 13 (8%) 2 (1%) 8 (5%) 4 (2%) 2 (1%)
Single-cell suspensions of RCJ 3.1 cells were plated at limiting dilutions of ",,0.25, 0.5, and 1.0 cells/6-mm-diam microtiter well (300 wells prepared at each dilution) in the presence of [~-GP, ascorbic acid, and 10 -7 M dexametha- sone. Only single-colony wells were selected for study; single-colony wells found to contain more than one colony after a second screening were discarded. These were maintained for 30 d, fixed, stained, and scored for the presence of each phenotype as described in Materials and Methods. Values represent the results combined from two separate subcloning experiments. * Total number of single colonies, 164.
and fat; muscle and cartilage; fat and cartilage; muscle, fat, and cartilage), and subclones containing colonies restricted to only one phenotype (muscle only, fat only, and cartilage only). Bone, which was present at very low frequencies in the parent RCJ 3.1 population was not detected in any of these subclones. Since these experiments were performed on RCJ 3.1 cells at a population doubling level of ,',,45, this hetero- geneity may be one consequence of the repeated passaging before the onset of these experiments. Clearly, however, RCJ 3.1 does not merely contain a heterogeneous population of committed precursor cells restricted to each of the four line- ages, but rather it contains cells that are pluripotent. It is not known which of these progenitors, if any, can also differenti- ate into bone. Which cell type(s) is acted upon by dexametha- sone is not yet known. We have confirmed, however, that dexamethasone is required for progenitors to become com- mitted to and differentiate along adipocyte and chondrocyte lineages, because RCJ 3.1 cells, subcloned in the absence of dexamethasone, only produced clones which differentiated into muscle, but not into fat or cartilage (data not shown).
The observation that there exist several less differentiated progenitor cell subpopulations in RCJ 3.1 is also interesting
Table IlL Steroid Hormone Specificity for the Induction of Myotubes, Adipocytes, and Chondrocytes in RCJ 3.1 C Cells
Myotubes Adipocyte Chondrocyte Treatment per dish foci per dish nodules per dish
n n n
Contro l + 0 0
D e x a m e t h a s o n e + + + 2 .0 ___ 0 .3 8.7 _+ 1.2
Hydroco r t i sone + + 20.2 + 1.4 5 .6 + 0 .9
P roges te rone + 0 0
1713-estradiol + 0 0
RCJ 3. I cells were plated at 50,000 cells/35-mm culture dish in standard cul- ture medium containing 15% FBS. After 24 h, the medium was changed to sup- plemented medium containing 15% FBS and either vehicle control (0.1% absolute ethanol) or the appropriate steroid hormone at 10 ~ M. Cultures were fixed after 30 d and each phenotype was quantitated as described in Materials and Methods. Values represent the mean + SEM of three to five cul- ture dishes.
in view of the observations of Constantinides et al. (14) and of Taylor and Jones (63) who have shown that C3H101"1/2 CI 8 (10Tl/2), a clonal mouse embryo fibroblast cell line, can develop colonies of myotubes, adipocytes, and chondrocytes after exposure to 5-azacytidine. Similar results were also ob- tained after treatment of Swiss 3T3 mouse fibroblasts with 5-azacytidine (63). In some ways, the properties of the RCJ 3.1 cell line described in this study are similar to those de- scribed for 10"1"1/2 and 3T3 cells, including the development of myotubes, adipocytes, and chondrocytes in the same chronological order, the similarity of morphological and histochemical properties of each phenotype, and the pres- ence both of colonies containing one cell type and mixed colonies (64). Perhaps more important, however, is that there are also clear differences between the presumptive pro- genitor cell population within RCJ 3.1 cells and the progeni- tors within 10"I"1/2 and 3T3 cells. (a) lffrl/2 is a clonal cell line derived from mouse embryo fibroblasts (50), and Swiss 3T3 cells are a mixed population of fibroblast-like cells that both differentiate in the absence of any inducer into fat- containing adipocytes (20, 21, 63). In contrast, RCJ 3.1 is a clonally derived cell line expressing some osteoblast-like characteristics and derived from a population of normal rat calvaria cells (3, 4, 4a), and differentiates in the absence of any added inducer into muscle and bone. (b) The nature of the inducer is different in these two cell systems: in 10T1/2 and 3T3 cells, differentiation into muscle, fat, and cartilage was dependent upon or enhanced by 5-azacytidine, an inhibi- tor of eukaryotic DNA methylation (for review see reference 28), whereas the formation of the same three cell types in RCJ 3.1 cells was dependent upon or enhanced by the gluco- corticoid, dexamethasone. There is currently no evidence suggesting that the mechanisms of action of these two in- ducers are similar in any way. (c) The fact that RCJ 3.1 cells also form bone in addition to muscle, fat, and cartilage clear- ly makes this cell line unique as no other isolated cell line possessing the capacity to differentiate into all these cell types has previously been reported. Some of the above points are summarized in Table IV.
It remains to be investigated whether dexamethasone is acting directly or indirectly on the progenitor cell popula- tion, and whether it is required during the logarithmic growth phase, after the cells become quiescent, or during the entire culture period. It is possible, for example, that dexa-
Table IV. A Comparison of the Differentiated Phenotypes Observed in Different Putative Progenitor Cell Populations
Differentiated cell types Starting population Inducer* Muscle Fat Cartilage Bone Reference
RCJ 3.1 - Yes No No Yes
(rat) + Yes Yes Yes Yes
10TI /2 - No Yes No NR$
(mouse) + Yes Yes Yes NR
3T3 - No Yes No NR (mouse) + Yes Yes Yes NR
63
63
* Inducer: RCJ 3.1, dexamethasone; 10T1/2, 5-azacytidine; 3T3, 5-azacy- tidine.
NR, not reported.
Grigoriadis et al. Glucocorticoids and Mesenchymal Differentiation 2149

methasone may act by affecting the cell sensitivity to other regulatory factors present in FBS. With regard to muscle differentiation in vitro, previous reports indicate that the effects of glucocorticoid hormones are complex and vary, de- pending on the cell type (e.g., species, primary cell cultures vs. established cell lines) and the nature of the culture medium (e.g., serum-containing vs. defined medium) used (1, 5, 24, 57, 71). It is also known that factors contained in serum-for example, g~'owth hormone, insulin, retinoids, and vitamin D3 metabolites, or growth factors like insulin- like growth factor I, fibroblast growth factor, epidermal growth factor, or transforming growth factor-13-can have a profound effect on the differentiated state of cells that are committed to muscle cell, adipocyte, chondrocyte, and os- teoblast lineages (2, 17, 19, 22, 27, 32, 33, 37, 40, 43, 44, 54, 58, 60, 61, 70, 71). The composition of extracellular ma- trices and cell-matrix interactions have also been shown to elicit effects on muscle and adipocyte differentiation (16, 25, 30, 35, 55, 59). In addition, dexamethasone and other gluco- corticoids have been shown to have dramatic effects on the production by cells of local cellular mediators such as prosta- glandins both in vitro and in vivo (e.g., see 12, 18, 67). Whatever the mechanisms, it remains that dexamethasone regulates the differentiation potential of this clonal, non- transformed, rat-derived cell population containing less dif- ferentiated mono- and multipotential progenitor cells. We are currently investigating further the lineage relationships be- tween muscle, fat, cartilage, and bone in RCJ 3.1 cells, which is the first time such lineage relationships will be analyzed in isolated rat mesenchymal cell populations.
Received for publication 19 April 1987, and in revised form 12 January 1988.
References
1. Allen, R. E., M. V. Dodson, L. S. Luiten, and L. K. Boxhorn. 1985. A serum-free medium that supports the growth of cultured skeletal muscle satellite cells. In Vitro Cell. Dev. Biol. 21:636-640.
2. Antosz, M. E., C. G. Bellows, and J. E. Aubin. 1987. Biphasic effects of epidermal growth factor on bone nodule formation by isolated rat calvaria cells in vitro. J. Bone Mineral Res. 2:385-393.
3. Aubin, J. E., E. Alders, and J. N. M. Heersche. 1983. A primary role for microfilaments, but not microtubules, in hormone-induced cytoplasmic retraction. Exp. Cell Res. 143:439-450.
4. Aubin, J. E., J. N. M. Heersche, M. J. Merrilees, andJ. Sodek. 1982. Iso- lation of bone cell clones with differences in growth, hormone responses, and extracellular matrix production. J. Cell Biol. 92:452-461.
4a. Aubin, J. E., I. Tertinegg, R. Ber, and J. N. M. Heersche. 1988. Consis- tent patterns of changing hormone responsiveness during continuous cul- ture of cloned rat calvaria cells. J. Bone Mineral Res. In press.
5. Ball, E. H., and B. D. Sanwal. 1980. A synergistic effect of glucocorticoids and insulin on the differentiation of myoblasts. J. Cell. Physiol. 102:27- 36.
6. Bellows, C. G., J. E. Aubin, and J. N. M. Heersche. 1987. Physiological concentrations of glucocorticoids stimulate formation of bone nodules from isolated rat calvaria cells in vitro. Endocrinology. 121:1985-1992.
7. Bellows, C. G., J. E. Aubin, J. N. M. Heersche, and M. E. Antosz. 1986. Mineralized bone nodules formed in vitro from enzymatically released rat calvaria cell populations. Calcif Tissue Int. 38:143-154.
8. Bellows, C. G., J. Sodek, K.-L. Yao, and J. E. Aubin. 1986. Phenotypic differences in subclones and long-term cultures of clonally derived rat bone cell lines. J. Cell. Biochem. 31:153-169.
9. Caplan, A. I. 1972. The effects of the nicotinamide-sensitive teratogen 3-acetylpyridine on chick limb mesodermal cells in culture; biochemical parameters. J. Exp. Zool. 180:351-362.
10. Caplan, A. I., and A. C. Stoolmiller. 1973. Control of chondrogenic ex- pression in mesodermal cells of embryonic chick limb. Proc. Natl. Acad. Sci. USA. 70:1713-1717.
I1. Chapman, A. B., D. M. Knight, B. S. Dieckmann, and G. M. Ringold. 1984. Analysis of gene expression during differentiation of adipogenic cells in culture and hormonal control of the developmental program. J. Biol. Chem. 259:15548-15555.
12. Chyun, Y. S., and L. G. Raisz. 1984. Stimulation of bone formation by prostaglandin E2. Prostaglandins. 27:97-103.
13. Clark, G. 1981. Staining Procedures. 4th edition. Williams and Wilkins, Baltimore.
14. Constantinides, P. G., P. A. Jones, and W. Gevers. 1977. Functional stri- ated muscle cells from non-myoblast precursors following 5-azacytidine treatment. Nature (Lond.). 267:364-366.
15. Debus, E., K. Weber, and M. Osboru. 1983. Monoclonal antibodies to des- min, the muscle-specific intermediate filament protein. EMBO (Eur. Mol. Biol. Organ.)J. 2:2305-2312.
16. Delaporte, C., B. Dautreaux, and M. Fardeau. 1986. Human myotube differentiation in vitro in different culture conditions. Biol. Cell. 57:17- 22.
17. Florini, J. R., A. B. Roberts, D. Z. Ewton, S. L. Falen, K. C. Flanders, and M. B. Sporn. 1986. Transforming growth factor [I. A very potent inhibitor of myoblast differentiation, identical to the differentiation inhibi- tor secreted by buffalo rat liver cells. J. Biol. Chem. 261:16509-16513.
18. Foster, S. J., and J. P. Perkins. 1977. Glucocorticoids increase the respon- siveness of cells in culture to prostaglandin E~ Proc. Natl. Acad. Sci. USA. 74:4816-4820.
19. Gospodarowitz, D. J., J. Weseman, I. S. Moran, and J. Lindstrom. 1976. Effect of fibroblast growth factor on the division and fusion of bovine myoblasts. J. Cell Biol. 70:395-405.
20. Green, H., and O. Kehinde. 1974. Sublines of mouse 3T3 cells that ac- cumulate lipid. Cell. 1:13-16.
21. Green, H., and O. Kehinde. 1976. Spontaneous heritable changes leading to increased adipose conversion in 3T3 cells. Cell. 7:105-113.
22. Green, H., M. Morikawa, and T. Nixon. 1985. A dual effector theory of growth-hormone action. Differentiation. 29:195-198.
23. Grigoriadis, A. E., P. M. Petkovich, E. E. Rosenthal, and J. N. M. Heersche. 1986. Modulation by retinoic acid of 1,25-dihydroxyvitamin D3 effects on alkaline phosphatase activity and parathyroid hormone re- sponsiveness in an osteoblast-like osteosarcoma cell line. Endocrinology. 119:932-939.
24. Guerriero, V., lr., and L R. Florini. 1980. Dexamethasone effects on myo- blast proliferation and differentiation. Endocrinology. 106:1198-1202.
25. Hauschka, S. D., and I. R. Konigsberg. 1966. The influence of collagen on the development of muscle clones. Proc. Natl. Acad. Sci. USA. 55: 119-126.
26. Heersche, J. N. M., J. E. Aubin, A. E. Grigoriadis, and Y. Moriya. 1985. Hormone responsiveness of bone cell populations: searching for answers in vivo and in vitro. In The Chemistry and Biology of Mineralized Tis- sues. W. T. Butler, editor. Ebsco Media, Inc., Birmingham, Alabama. 286-295.
27. Ignotz, R. A., and J. Massagu6. 1985. Type 13 transforming growth factor controls the adipogenic differentiation of 3T3 fibroblasts. Proc. Natl. Acad. Sci. USA. 82:8530-8534.
28. Jones, P. A. 1984. Gene activation by 5-azacytidine. In DNA Methylation: Biochemistry and Biological Significance. A. Razin, H. Cedar, and A. D. Riggs, editors. Springer-Verlag New York Inc., New York. 165-187.
29. Kato, Y., and D. Gospodarowicz. 1985. Stimulation by glucocorticoid of the synthesis of cartilage matrix proteoglycans produced by rabbit costal chondrocytes in vitro. J. Biol. Chem. 260:2364-2373.
30. Kleinman, H. K., R. J. Klebe, and G. R. Martin. 1981. Role of collagenous matrices in the adhesion and growth of cells. J. Cell Biol. 88:473-485.
31. Kodama, H.-A., Y. Amagai, H. Koyama, and S. Kasai. 1982. Hormonal responsiveness of a preadipose cell line derived from newborn mouse cal- varia. J. Cell. Physiol. 112:83-88.
32. Kuri-Harcuch, W. 1982. Differentiation of 3T3-F422A cells into adipo- cytes is inhibited by retinoic acid. Differentiation. 23:164-169.
33. Lathrop, B. K., E. N. Olson, and L. Glaser. 1985. Control by fibroblast growth factor of differentiation in the BC3HI muscle cell line. J. Cell Biol. 100:1540-1547.
34. Lefkovits, 1., and H. Waldmann. 1979. Limiting Dilution Analysis of Cells in the Immune System. Cambridge University Press, London. 227 pp.
35. Leibovitch, S. A., J. Hillion, M.-P. Leibovitch, M. Guillier, A. Schmitz, and J. Harel. 1986. Expression of extracellular matrix genes in relation to myogenesis and neoplastic transformation. Exp. Cell Res. 166:526- 534.
36. Limeback, H. F., and J. Sodek. 1979. Procollagen synthesis and processing in periodontal ligament in vivo and in vitro. A comparative study using slab-gel fluorography. Eur. J. Biochem. 100:541-550.
37. Linkhart, T. A., C. H. Clegg, and S. D. Hanschka. 1981. Myogenic differentiation in permanent clonal myoblast cell lines: regulation by mac- romolecular growth factors in the culture medium. Dev. Biol. 86:19-30.
38. Lowry, O. H. 1955. Micromethods for the assay of enzyme. II. Specific procedures. Alkaline phosphatase. Methods Enzymol. 4:371-372.
39. Maor, G., and M. Silbermann. 1986. Supraphysiological concentrations of dexamethasone induce elevation of calcium uptake and depression of [3H]-thymidine incorporation into DNA in cartilage in vitro. Calcif Tis- sue Int. 39:284-290.
40. Massagu6, J., S. Cheifetz, T. Endo, and B. NadaI-Ginard. 1985. Type 13 transforming growth factor is an inhibitor of myogenic differentiation. Proc. Natl. Acad. Sci. USA. 83:8206-8210.
The Journal of Cell Biology, Volume 106, 1988 2150

41. Nefussi, J.-R., M. L. Boy-Lefevre, H. Boulekbache, and N. Forest. 1985. Mineralization in vitro of matrix formed by osteoblasts isolated by col- lagenase digestion. Differentiation. 29:160-168.
42. N6grel, R., P. Grimaldi, and G. Ailhaud. 1978. Establishment ofpreadipo- cyte clonal line from epididymal fat pad of ob/ob mouse that responds to insulin and to lipolytic hormones. Proc. Natl. Acad. Sci. USA. 75: 6054-6058.
43. Nixon, B. T., and H. Green. 1984. Growth hormone promotes the differen- tiation of myoblasts and preadipocytes generated by azacytidine treatment of 10TI/2 cells. Proc. Natl. Acad. Sci. USA. 81:3429-3432.
44. Olson, E. N., E. Sternberg, J. S. Hu, G. Spizz, and C. Wilcox. 1986. Regu- lation of myogenic differentiation by type [3 transforming growth factor. J. Cell Biol. 103:1799-1805.
45. Osdoby, P., and A. 1. Caplan. 1976. The possible differentiation of osteo- genic elements in vitro from chick limb mesodermal cells. I. Morphologi- cal evidence. Dev. Biol. 52:283-299.
46. Osdoby, P., and A. I. Caplan. 1979. Osteogenesis in cultures of limb mesenchymal cells. Dev. Biol. 73:84-102.
47. Owen, M. 1985. Lineage of osteogenic cells and their relationship to the stromal system. In Bone and Mineral Research. Vol. 3. W. A. Peck, edi- tor. Elsevier Science Publishing, Amsterdam. 1-25.
48. Ravdin, P., and D. Axelrod. 1977. Fluorescent tetramethyl rhodamine de- rivatives of a-bungarotoxin: preparation, separation, and characteriza- tion. Anal. Biochem. 80:585-592.
49. Reddi, A. H., and C. B. Huggins. 1972. Biochemical sequences in the transformation of normal fibroblasts in adolescent rats. Proc. Natl. Acad. Sci. USA. 69:1601-1605.
50. Reznikoff, C. A., D. W. Brankow, and C. Heidelberger. 1973. Establish- ment and characterization of a cloned line of C3H mouse embryo cells sen- sitive to postconfluence inhibition of division. Cancer Res. 33:3231-3238.
51. Ringold, G. M., A. B. Chapman, and D. M. Knight. 1986. Glucocorticoid control of developmentally regulated adipose genes. J. Steroid Biochem. 24:69-75.
52. Rubin, C. S., A. Hirsch, C. Fung, and O. M. Rosen. 1978. Development of hormone receptors and hormonal responsiveness in vitro. Insulin receptors and insulin sensitivity in the preadipocyte and adipocyte forms of 3T3-LI cells. J. Biol. Chem. 253:7570-7578.
53. Rubin, C. S., F. Lai, and O. M, Rosen. 1977. Acquisition of increased hor- mone sensitivity during in vitro adipocyte development. ,L Biol. Chem. 252:3554-3557.
54. Schiwek, D. R., and G. Lfflter. 1987. Glucocorticoid hormones contribute to the adipogenic activity of human serum. Endocrinology. 120:469-474.
55. Scott-Burden, T., E. Bogenmann, and P. A. Jones. 1986. Effects of com- plex extracellular matrices on 5-azacytidine-induced myogenesis. Exp. Cell Res. 156:527-535.
56. Shimizu, M., F. Torti, and R. A. Roth. 1986. Characterization of the insu- lin and insulin-like growth factor receptors and responsitivity of a fibro-
blast/adipocyte cell line before and after differentiation. Biochem. Bio- phys. Res. Commun. 137:552-558.
57. Smith, T. J., R. Dana, A. Krichevsky, J. P. Bilezikian, and M. Schonberg. 1981. Inhibition of I~-adrenergic responsiveness in muscle cell cultures by dexamethasone, Endocrinology. 109:2110-2116.
58. Sparks, R. L., and R. E. Scott. 1986. Transforming growth factor type I~ is a specific inhibitor of 3T3 T mesenchymal stem cell differentiation. Exp. Cell Res. 165:345-352.
59. Spiegelman, B. M., and C. A. Ginty. 1983. Fibronectin modulation of cell shape and lipogenic gene expression in 3T3-adipocytes. Cell. 35:657- 666.
60. Spizz, G., D. Roman, A. Strauss, and E. N. Olson. 1986. Serum and fibroblast growth factor inhibit myogenic differentiation through a mecha- nism dependent on protein synthesis and independent of cell proliferation. J. Biol. Chem. 261:9483-9488.
61. Steinberg, M. M., and B. L. Brownstein. 1982. A clonal analysis of the differentiation of 3T3-L1 preadipose cells: role of insulin. J. Cell. Phys- iol. 113:359-364.
62. Takano, T., M. Takigawa, and F. Suzuki. 1985. Stimulation by glucocorti- coids of the differentiated phenotype of chondrocytes and the proliferation of rabbit costal chondrocytes in culture. J. Biochem. (Tokyo). 97:1093- 1100.
63. Taylor, S. M., and P. A. Jones. 1979. Multiple new phenotypes induced in 10TI/2 and 3T3 cells treated with 5-azacytidine. Cell. 17:771-779.
64. Taylor, S. M., and P. A. Jones. 1982. Changes in phenotypic expression in embryonic and adult cells treated with 5-azacytidine. J. Cell. Physiol. 111:187-194.
65. Urist, M. R. 1965. Bone formation by autoinduction. Science (Wash. DC). 150:893-899.
66. Wallace, B. G. 1986, Aggregating factor from Torpedo electric organ in- duces patches containing acetylcholine receptors, acetylcholinesterase, and butyrylcholinesterase on cultured myotubes. J. Cell Biol. 102:783- 794.
67. Williams, 1. H., and S. E. Polakis. 1977. Differentiation of 3T3-LI fibro- blasts to adipocytes. The effect of indomethacin, prostaglandin E~ and cyclic AMP on the process of differentiation. Biochem. Biophys. Res. Commun. 77:175-186.
68. Yaffe, D. 1969. Cellular aspects of muscle differentiation in vitro. Curr. Top. Dev. Biol. 4:37-75.
69. Yaffe, D. 1971. Developmental changes preceding cell fusion during mus- cle cell differentiation in vitro. Exp. Cell Res. 66:33-48.
70. Yeoh, G. C. T., and H. Holtzer. 1977. The effect of cell density, condi- tioned medium and cytosine arabinoside on myogenesis in primary and secondary cultures. Exp. Cell Res. 104:63-78.
71. Zalin, R. J. 1987. The role of hormones and prostanoids in the in vitro proliferation and differentiation of human myoblasts. Exp. Cell Res. 172: 265-281.
Grigoriadis et al. Glucocorticoids and Mesenchymal Differentiation 2151