Differential Scanning Calorimetry...
144
1 ©2009 TA Instruments Differential Scanning Calorimetry Basic Theory & Applications Training (DSC) DSC Training Course Agenda Understanding DSC Experimental Design Calibration Optimization of DSC Conditions Interpretation of Undesirable Events in DSC Data Applications
Transcript of Differential Scanning Calorimetry...

1
©2009 TA Instruments
Differential Scanning Calorimetry
Basic Theory & Applications Training
(DSC)
DSC Training Course
Agenda
� Understanding DSC
� Experimental Design
� Calibration
� Optimization of DSC Conditions
� Interpretation of Undesirable Events in DSC Data
� Applications

2
DSC Training Course
2900 Series DSC’s
DSC 2010 DSC 2910 DSC 2920
DSC Training Course
Q1000
Q100
Q10
First Generation Q Series™ DSCs

3
DSC Training Course
Second Generation Q-Series™ DSCs
Q2000 Q200 AutoQ20
Q2000 is top-of-the-line, research grade with all options
Q200 is research grade and expandable
Q20 is a basic DSC – Available as an
Auto Q20 & also Q20P
DSC Training Course
Understanding DSC - Agenda
� What does a DSC measure?
� How does a DSC make that measurement?
� How is a Tzero™ DSC different?
� Tzero Results
� Advanced Tzero

4
DSC Training Course
Agenda
� What does a DSC measure?
� How does a DSC make that measurement?
� How is a Tzero™ DSC different?
� Tzero Results
� Advanced Tzero
DSC Training Course
What Does a DSC Measure?
A DSC measures the difference in heat flow rate (mW = mJ/sec) between a sample and inert reference as a function of time and temperature

5
DSC Training Course
-0 .4
-0 .3
-0 .2
-0 .1
0 .0
0 .1Heat Flow (W/g)
0 2 5 5 0 7 5 1 0 0 1 2 5 1 5 0
T em pe ra tu re (°C )E xo U p
Endothermic Heat Flow
� Heat flows into the sample as a result of either � Heat capacity (heating)
� Glass Transition (Tg)
� Melting
� Evaporation
� Other endothermic processes
Endothermic
DSC Training Course
-0 .1
0 .0
0 .1
Heat Flow (W/g)
0 2 0 4 0 60 80 1 0 0 1 2 0 1 40 16 0
Tem pe ra ture (°C )Exo U p
Exothermic Heat Flow
� Heat flows out of the sample as a result of either � Heat capacity (cooling)
� Crystallization
� Curing
� Oxidation
� Other exothermic processes
Exothermic

6
DSC Training Course
Temperature
� What temperature is being measured and displayed by the DSC?
� Sensor Temp: used by most DSCs. It is measured at the sample platform with a thermocouple, thermopile or PRT.
Constantan Body
Chromel Wire
Chromel Area Detector
Constantan Wire
Chromel Wire
Base Surface
Thin Wall Tube
Sample Platform
Reference Platform
DSC Training Course
Temperature
� What temperature is being measured and displayed by the DSC?
� Pan Temp: calculated by TA Q1000/2000 based on pan material and shape
� Uses weight of pan, resistance of pan, & thermoconductivity of purge gas
� What about sample temperature?
� The actual temperature of the sample is never measured by DSC

7
DSC Training Course
Temperature
� What temperatures are not typically being displayed?
� Program Temp: the set-point temperature is usually not recorded. It is used to control furnace temperature
� Furnace Temp: usually not recorded. It creates the temperature environment of the sample and reference
DSC Training Course
Understanding DSC Signals
Heat Flow
� Relative Heat Flow: measured by all DSCs except TA Q1000/2000. The absolute value of the signal is not relevant, only absolute changes are used.
� Absolute Heat Flow: used by Q1000/2000. Dividing the signal by the measured heating rate converts the heat flow signal into a heat capacity signal

8
DSC Training Course
DSC Heat Flow
t)(T,dt
dT Cp
dt
dHf+=
signal flowheat DSC dt
dH=
Weight SampleHeat x Specific Sample
CapacityHeat Sample Cp
=
=
Rate Heating dt
dT=
(kinetic) re temperatuabsolutean at
timeoffunction is that flowHeat t)(T, =f
DSC Training Course
Agenda
� What does a DSC measure?
� How does a DSC make that measurement?
� How is a Tzero™ DSC different?
� Tzero Results
� Advanced Tzero

9
DSC Training Course
How does a DSC Measure Heat Flow?
� DSC comprises two nominally identical calorimeters in a common enclosure that are assumed to be identical.
� Advantages of a twin calorimeter:
� Noise reduction by cancellation of common mode noise.
� Simplified heat flow rate measurement.
� Cancellation of calorimeter and pan heat capacities.
� Cancellation of heat leakages.
DSC Training Course
Heat Flux DSC Cell Schematic
2900 Series DSC
Dynamic Sample Chamber
Reference PanSample Pan
Lid
Gas Purge Inlet
Chromel Disc
Heating Block
Chromel Disc
Alumel Wire
Chromel Wire
Thermocouple Junction
Thermoelectric Disc
(Constantan)

10
DSC Training Course
Perfectly Symmetrical?
� The heat flow rate of an empty perfectly symmetrical twin calorimeter should be zero.
� However, it almost never is because the DSC is rarely symmetrical as assumed.
� The asymmetry is the inevitable result of manufacturing tolerances and is unavoidable.
For example, thermal resistance of the Tzero DSC cell is determined
by the wall thickness of the “top hat” which is .005” (0.13mm). To
achieve 1% thermal resistance imbalance would require
manufacturing tolerance of .00005” (.00127mm).
DSC Training Course
Conventional DSC Measurements
Heat Flow
Measurement Model
This model assumes that the sample and reference calorimeter thermal resistances
are identical, the temperature of the furnace at the sample and reference
calorimeters are equal and does not include other known heat flows.
Rs Rr
qs qr
TrTs
T Tfs fr
s
sfs
sR
TTq
−=
r
rfr
rR
TTq
−=
Heat Balance Equations
rs qqq −=
R
T
R
TTq sr ∆−
=−
=
Conventional DSC Heat
Flow Rate Measurement
2900 Series

11
DSC Training Course
Conventional DSC - Assumptions
� The resistance between the sample sensor and the furnace equals the resistance between the reference sensor and the furnace
� Pan and calorimeter heat capacities are ignored
� Measured temperature equals sample temperature
� No heat exchange with the surroundings
DSC Training Course
Consequences of the Assumptions
� Whenever the heating rate of the sample and reference calorimeters is not identical, the measured heat flow is not the actual sample heat flow rate. This occurs during transitions in standard DSC and always during MDSC®.
� Resolution suffers.
� Sensitivity suffers.
� MDSC® results are strongly period dependent, requiring long periods and slow heating rates.
� The heat flow baseline is usually curved and has large slope and offset.

12
DSC Training Course
Violations of Assumptions
Pan and calorimeter heat capacities are ignored
� Sample and reference heat capacities are assumed to be the same and to heat at the same rate.
� In general the sample and reference calorimeter heat capacities do not match contributing to non-zero empty DSC heat flow rate baseline.
� During transitions and MDSC® experiments the sample and reference heating rates differ and the measured heat flow rate is incorrect because the sample and reference sensor and pan heat capacities store or release heat at different rates.
DSC Training Course
Expanded Principle of Operation
Q = Ts - Tr + A + B + C
R Thermal
Resistance
Imbalance
Thermal
Capacitance
Imbalance
Heating
Rate
Imbalance
Tfs
TsRs Tfr
TrRr
Cs Cr Not Being
Measured w/
Conventional
DSC

13
DSC Training Course
Agenda
� What does a DSC measure?
� How does a DSC make that measurement?
� How is a Tzero™ DSC different?
� Tzero Results
� Advanced Tzero
DSC Training Course
Q-Series DSC Schematic
Sample & Reference Platforms
Tzero™
Thermocouple

14
DSC Training Course
Constantan Body
Chromel Wire
Chromel Area Detector
Constantan Wire
Chromel Wire
Base Surface
Thin Wall Tube
Sample Platform
Reference Platform
Q-Series Heat Flow Measurement
TrTsRs
Cs Cr
Rr
To
TfQ-Series DSC
DSC Training Course
Tzero™ Heat Flow Measurement
Rs Rr
qs qr
Cs Cr
Tr
T0
Ts Heat Flow Rate Equations
Heat Flow
Sensor Model
The sample and reference calorimeter thermal resistances and heat capacities
obtained from Tzero calibration are used in the heat flow rate measurements.
rs TTT −=∆ sTTT −=∆ 00
dt
dTC
R
Tq s
s
s −∆
= 0
dt
dTC
R
TTq r
r
r −∆+∆
= 0
Differential Temperatures

15
DSC Training Course
Tzero™ Heat Flow Measurement (T4)
( )ττ d
TdC
d
dTCC
RRT
R
Tq r
ssr
rsr
T
∆−−+
−∆+
∆−=
1104
Principal DSC
Heat Flow
Thermal Resistance
Imbalance
Heat Capacity
Imbalance
Heating Rate
Difference
The four term Tzero heat flow rate measurement includes effects of the thermal
resistance and heat capacity imbalances as well as the difference in the heating
rates of the sample and reference calorimeters. When the assumptions of
conventional DSC are applied, only the first term remains and the conventional
heat flow rate measurement is obtained.
rsT qqq −=4
DSC Training Course
Tzero Heat Flow Equation
R s R r
q s q r
C s C r
T r
T 0
T s
Heat Flow
Sensor Model
( )ττ d
TdC
d
dTCC
RRT
R
Tq r
ssr
rsr
∆−−+
−∆+
∆−=
110
Besides the three
temperatures (Ts, Tr, T0);
what other values do we
need to calculate Heat
Flow?

16
DSC Training Course
Tzero Heat Flow Equation
( )ττ d
TdC
d
dTCC
RRT
R
Tq r
ssr
rsr
∆−−+
−∆+
∆−=
110
R s R r
q s q r
C s C r
T r
T 0
T s
Heat Flow
Sensor Model
How do we calculate these?
Besides the three
temperatures (Ts, Tr, T0);
what other values do we
need to calculate Heat
Flow?
DSC Training Course
Measuring the C’s & R’s
� Tzero™ Calibration calculates the C’s & R’s
� Calibration is a misnomer, THIS IS NOT A CALIBRATION, but rather a measurement of the Capacitance (C) and Resistance (R) of each DSC cell
� After determination of these values, they can be used in the Four Term Heat Flow Equation (T4) shown previously

17
DSC Training Course
A few words about the C’s and R’s
� The curves should be smooth and continuous, without evidence of noise or artifacts
� Capacitance values should increase with temperature (with a decreasing slope)
� Resistance values should decrease with temperature (also with a decreasing slope)
� It is not unusual for there to be a difference between the two sides, although often they are very close to identical
Good Tzero™ Calibration Run

18
DSC Training Course
Can see that it is bad during
Tzero™ cal run
Bad Tzero™ Calibration Run
DSC Training Course
Example of Typical Results
40
50
60
Reference Resistance (°C
/Watt)
0.02
0.03
0.04
Reference Capacitance (Joule/°C)
0.01
0.02
0.03
0.04
0.05
Sample Capacitance (Joule/°C)
30
40
50
60
70
Sample Resistance (°C
/Watt)
-200 -100 0 100 200 300
Temperature (°C)
Characteristics of the thermal resistances and heat capacities:
Both curves should be smooth, with no steps, spikes or inflection points.
Thermal resistances should always have negative slope that gradually decreases.
Heat capacities should always have positive slope that gradually decreases.
This cell is very well balanced. It is acceptable and usual
to have larger differences between sample and reference.

19
DSC Training Course
Agenda
� What does a DSC measure?
� How does a DSC make that measurement?
� How is a Tzero™ DSC different?
� Tzero Results
� Advanced Tzero
DSC Training Course
What does this do for us?
� By measuring the capacitance and resistance, we are no longer assuming the DSC cell is symmetrical
� Using these values in the four term equation, we see that nearly all aspects of DSC performance are improved by Tzero™ DSC.� Empty DSC baselines are straighter and closer to zero.
� Resolution is enhanced.
� Sensitivity is enhanced.
� Frequency dependence of MDSC is greatly reduced.

20
DSC Training Course
-0.4
-0.2
0.0
0.2
0.4
0.6
Heat Flow (mW)
-100 0 100 200 300 400
Temperature (°C)
Conventional BaselineT zero Baseline
Tzero™ vs Conventional Baseline
DSC Training Course
Q2000 Quantified Baseline Performance
4.94°C5.40µW
-29.38°C31.23µW
-100
-50
0
50
100
Heat Flow (µW)
-50 0 50 100 150 200 250 300 350
Temperature (°C)Exo Up

21
DSC Training Course
Agenda
� What does a DSC measure?
� How does a DSC make that measurement?
� How is a Tzero™ DSC different?
� Tzero Results
� Advanced Tzero
DSC Training Course
Advanced Tzero™ Technology
� During transitions and MDSC experiments, the heating rates of the sample pan, sample calorimeter, reference pan and reference calorimeter may be very different.
� Sample pans have thermal resistance and heat capacity and sample and reference pans rarely have the same mass.
� Advanced Tzero includes the heat capacity of the pans and the heating rate differences between the sample and reference calorimeters and pans.
� Peaks are taller and sharper, hence both resolution and sensitivity are dramatically improved.

22
DSC Training Course
Advanced Tzero™ Model
Advanced Tzero is a further refinement of the Tzero model and takes the
measurement up to the sample pan, one step closer to the actual sample
q sam
R s R r
q s q r
C s C r
T r
T0
T s
R p R p
mprcpan
Tps Tpr
R s R r
q s q r
C s C r
T r
T0
T s
R p R p
mprcpan
Tps Tpr
m pscpanm pscpanm
Advanced Tzero
model includes
the pans
Tzero models the
Calorimeters
Rp
Cpan
Rs
Q2000
Q200
DSC Training Course
What is Pan Contact Resistance?
DSC Pan
Heat Flow Sensor
Heat Flow
Imperfect (non-intimate) contact
between pan and sensor causes lag
in heat flow which decreases resolution

23
DSC Training Course
Result of Pan Contact Resistance Factor
Without pan contact
resistance factor, temperature
is measured at the sensor
With pan contact resistance
factor, temperature
is measured at the bottom
of the pan, in intimate contact
with the sample
DSC Training Course
Indium with Q-Series Heat Flow Signals
Q1000
Q100
Q10

24
DSC Training Course
Indium with Q-Series Heat Flow Signals
Theoretical
Melting of
Indium
Q1000
Q100
Q10
DSC Training Course
Indium as a Measure of Sensitivity & Resolution
Height
Width at Half-Height
-30
-25
-20
-15
-10
-5
0
Heat flow (mW)
140 145 150 155 160 165 170 175 180
Temperature (°C)
�Peak Height Increases
�Peak Width Decreases
�Height/Width Increases
25
DSC Training Course
Improved Sensitivity/Resolution-Q2000
Tzero Pan Standard Pan
-12
-10
-8
-6
-4
-2
0
2
Heat Flow (mW)
154 155 156 157 158 159 160
Temperature (°C)Exo Up
Q2000
(Tzero pan)Q1000
DSC Training Course
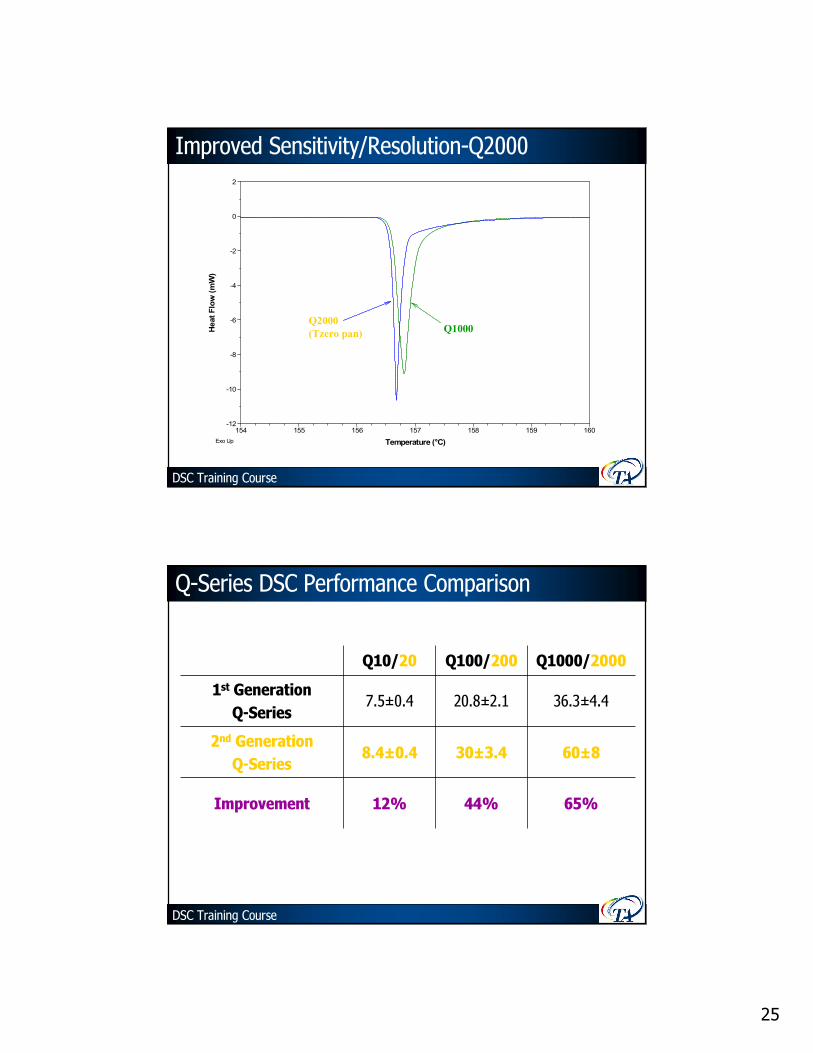
Q-Series DSC Performance Comparison
60±830±3.48.4±0.42nd Generation
Q-Series
65%44%12%Improvement
36.3±4.420.8±2.17.5±0.41st Generation
Q-Series
Q1000/2000Q100/200Q10/20

26
DSC Training Course
Definitions
� Amorphous Phase - The portion of material whose molecules are randomly oriented in space. Liquids and
glassy or rubbery solids. Thermosets and some thermoplastics
� Crystalline Phase - The portion of material whose molecules are regularly arranged into well defined structures
consisting of repeat units. Very few polymers are 100% crystalline
� Semi-crystalline Polymers - Polymers whose solid phases are partially amorphous and partially crystalline.
Most common thermoplastics are semi-crystalline
DSC Training Course
Definitions (cont.)
� Melting – The process of converting crystalline structure to a liquid amorphous structure
� Thermodynamic Melting Temperature –The temperature where a crystal would melt if it had a perfect structure (large crystal with no defects)
� Metastable Crystals – Crystals that melt at lower temperature due to small size (high surface area) and poor quality (large number of defects)

27
DSC Training Course
Definitions (cont.)
� Crystal Perfection – The process of small, less perfect crystals (metastable) melting at a temperature below their thermodynamic melting point and then (re) crystallizing into larger, more perfect crystals that will melt again at a higher temperature.
� True Heat Capacity Baseline – Often called the thermodynamic baseline, it is the measured baseline (usually in heat flow rate units of mW) with all crystallization and melting removed.� Assumes no interference from other latent heat such as polymerization,
cure, evaporation etc. over the crystallization/melting range.
DSC Training Course
Definitions (cont.)
� Crystallization – The process of converting either solid amorphous structure (cold crystallization on heating) or
liquid amorphous structure (cooling) to a more organized solid crystalline structure
� Enthalpy of Melting/Crystallization - The heat energy required for melting or released upon crystallization.
This is calculated by integrating the area of the DSC peak on a time basis.
28
DSC Training Course
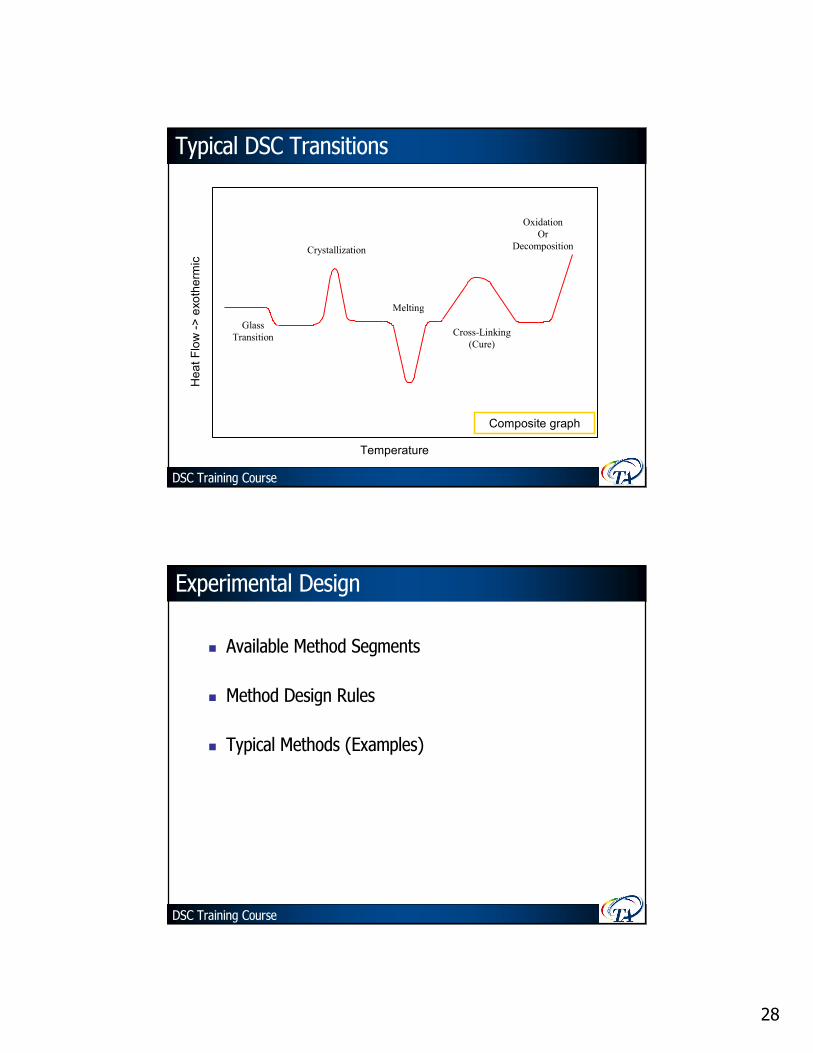
Typical DSC Transitions
Temperature
Heat Flow -> exotherm
ic
Glass
Transition
Crystallization
Melting
Cross-Linking
(Cure)
Oxidation
Or
Decomposition
Composite graph
DSC Training Course
Experimental Design
� Available Method Segments
� Method Design Rules
� Typical Methods (Examples)

29
DSC Training Course
Methods vs. Procedures
The logic of the instrument control software is based upon
the concepts of methods and procedures.
� METHODS are the actual steps that the DSC executes during a run. The software provides custom templates built around types of experiments.
� PROCEDURES include, along with the method, all other options that the user sets in creating a run. For example, the data sampling interval, method end conditions, etc.
DSC Training Course
Q-Series DSC Segment List

30
DSC Training Course
Method Design Rules
� Start Temperature
� Generally, the baseline should have two (2) minutes to completely stabilize prior to the transition of interest. Therefore, at 10°C/min., start at least 20°C below the transition onset temperature
� End Temperature
� Allow a two (2) minute baseline after the transition of interestin order to correctly select integration or analysis limits
� Don’t Decompose sample in DSC Cell
DSC Training Course
Why have 2 min of baseline?
-2.5
-2.0
-1.5
-1.0
-0.5
0.0
Heat Flow (W/g)
20 40 60 80 100 120 140 160
Temperature (°C)Exo Up Universal V3.9A TA Instruments
Wax 10°C/min

31
DSC Training Course
Heating/Cooling Methods
Typical Heating Method1) Equilibrate at 0°C2) Ramp 10°C/min. to 300°C
Typical Cooling Method1) Equilibrate at 300°C2) Ramp 10°C/min. to 25°C
DSC Training Course
Heat-Cool-Reheat Method
Typical Heat-Cool-Heat Method
1) Equilibrate @ 25°C2) Ramp 10°C/min. to 300°C3) Mark cycle end 04) Ramp 10°C/min. to 25°C5) Mark cycle end 06) Ramp 10°C/min. to 300°C7) Mark cycle end 0

32
DSC Training Course
Oxidative Stability (OIT) Method
OIT Method
1) Equilibrate at 60°C2) Isothermal for 5.00 min.3) Ramp 20°C/min. to 200°C4) Isothermal for 5.00 min.5) Select gas: 26) Abort next seg. if W/g > 1.07) Isothermal for 200.00 min.
DSC Training Course
Modulated® DSC Method
Typical MDSC Methods
1) Data storage: off2) Equilibrate at -20°C3) Modulate ±1°C every 60 seconds4) Isothermal for 5.00 min.5) Data storage: on6) Ramp 3°C/min. to 300°C

33
DSC Training Course
DSC General Method Recommendations
� Determine decomposition temp
� Stay below that temperature
� Run Heat-Cool-Heat @ 10°C/min
� Use specific segments as needed, i.e. gas switch, abort, etc.
� Modify heating rate based on what you’re looking for
DSC Training Course
Calibration & Sample Preparation
• Instrument Calibration� Q200 & Q2000
� Cell Constant & Temperature
� Q20 & 2900s� Baseline � Cell Constant & Temperature
• Miscellaneous� Purge Gas� Cooling Accessories� Environment
• Sample Preparation• Selecting Experimental Conditions

34
DSC Training Course
General Calibration Issues
� Calibration� Use Calibration Mode
� Calibrate upon installation
� Re-calibrate every ????
� Verification� Determine how often to verify data
� Run a standard as a sample (std mode)
� Compare results vs. known
� If results are within your tolerance – system checks out and doesn’t re-need calibration
� If results are out of tolerance, then re-calibrate
DSC Training Course
Heat Flow Calibration
� Differential Heat Flow (ASTM E968)
� Heat of fusion (melting) standards
� Heat capacity (no transition)
� Miscellaneous� Use specific purge gas at specified rate
� Calibrate w/cooling accessory functioning if it will be used to run samples
� Single point used for heat of fusion
� Calibration should not change w/heating rate

35
DSC Training Course
Heat Flow Calibration
� Prepare a 1-3mg sample of indium and premelt prior to first use
� Verify at least once a month
� Typical values for cell constant:
� 1.0 to 1.2 (in N2)
Premelt
DSC Training Course
Calorimetric Calibration
150 155 160 165 170
-15
-10
-5
0
5
Temperature (°C)
Heat Flow (mW)
157.44°C
Sample: Indium, 5.95 mg.
CALIBRATION MODE; 10°C/MIN
CALIBRATION BASED ON 28.42J/g
Cell Const.: 1.0766
Onset Slope: -20.82 mW/°C

36
DSC Training Course
Temperature Calibration
• ASTM Method E967� Pure metals (indium, lead, etc.) typically used� Extrapolated onset is used as melting temperature� Sample is fully melted at the peak
DSC Training Course
Temperature Calibration
150 152 154 156 158 160 162 164
-5
-4
-3
-2
-1
0
1
0
10
20
30
40
50
Temperature (°C)
Heat Flow (W/g)
Deriv. Temperature (°C/m
in)
Extrapolated Onset
156.61°C
28.36J/g
HEATING RATE
157.09°C
PEAK

37
DSC Training Course
Temperature Calibration
� Verify at least once a month
� Maximum of five points
� Use tin, lead, and zinc one time only
DSC Training Course
• Benzoic acid (147.3 J/g) Tm = 123°C• Urea (241.8 J/g) Tm = 133°C • Indium (28.45 J/g) Tm = 156.6°C• Anthracene (161.9 J/g) Tm = 216°C
• Cyclopentane* -150.77°C• Cyclopentane* -135.09°C• Cyclopentane* -93.43°C• Cyclohexane# -83°C• Water# 0°C• Gallium# 29.76°C• Phenyl Ether# 30°C• p-NitrotolueneE 51.45°C• NaphthaleneE 80.25°C• Indium# 156.60°C• Tin# 231.95°C• Lead* 327.46°C• Zinc# 419.53°C
Recommended Temperature & Enthalpy Standards
* GEFTA recommended
Thermochim. Acta, 219 (1993) 333.
# ITS 90 Fixed Point
E Zone refined organic compound
(sublimes)
Enthalpy
(cell constant)
Temperature

38
DSC Training Course
To begin calibration start
DSC Calibration Wizard
DSC Training Course
Select Heat Flow signal
& type of cooler
Q2000/1000 = T4P
Q200/100 = T4
Q20/10 = T1

39
DSC Training Course
Select which
calibration to perform
Tzero Calibration
T4P & T4
Calibration
DSC Training Course
Enter parameters for
first run (empty cell)
T4P & T4
Calibration

40
DSC Training Course
Start experiment
T4P & T4
Calibration
DSC Training Course
Enter weight of sapphire samples
T4P & T4
Calibration

41
DSC Training Course
When run is completed, capacitance &
resistance are plotted and saved
T4P & T4
Calibration
DSC Training Course
Enter parameters for Indium sample
Always run Indium for
Cell Constant
T4P & T4
Calibration

42
DSC Training Course
Enter temperatures for Indium run
T4P & T4
Calibration
DSC Training Course
Start experiment
T4P & T4
Calibration

43
DSC Training Course
Data is analyzed
automatically
T4P & T4
Calibration
DSC Training Course
T4P & T4
Calibration

44
DSC Training Course
Baseline Calibration
� Slope� Calibration should provide flat baseline with empty cell
� Polymers should always have an endothermic slope due to increasing heat capacity with increasing temperature
� Curvature� Not normally part of calibration procedure
� Can be eliminated if necessary with baseline subtraction
� Curvature can cause errors in analyses
Q20 & 2900s Only
DSC Training Course
Baseline Slope due to Heat Capacity

45
DSC Training Course
-0.4
-0.2
0.0
0.2
0.4
0.6
Heat Flow (mW)
-100 0 100 200 300 400
Temperature (°C)
Conventional BaselineT zero Baseline
Baseline Curvature
DSC Training Course
To begin calibration start
DSC Calibration Wizard

46
DSC Training Course
T1 Calibration
DSC Training Course
Select type of
calibration to run
T1 Calibration
47
DSC Training Course
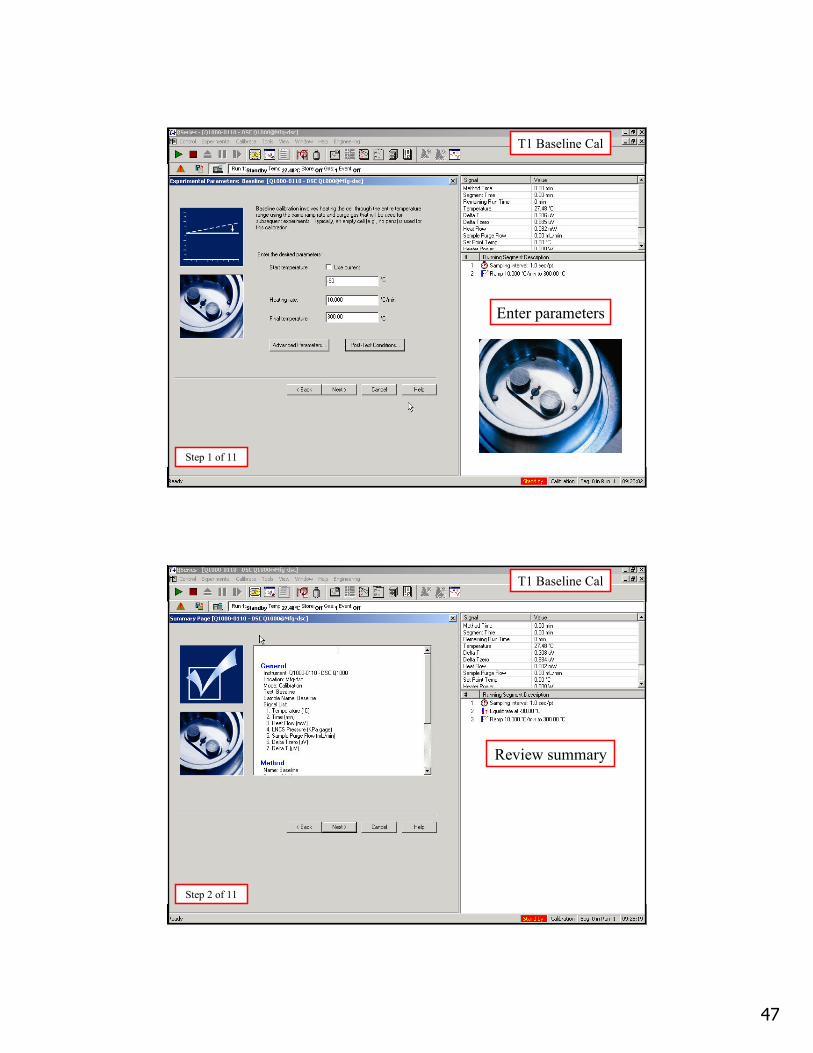
Enter parameters
T1 Baseline Cal
Step 1 of 11
DSC Training Course
Review summary
T1 Baseline Cal
Step 2 of 11

48
DSC Training Course
Enter sample
information
T1 Baseline Cal
Step 3 of 11
DSC Training Course
Finish entering
sample information
T1 Baseline Cal
Step 4 of 11

49
DSC Training Course
Review checklist
T1 Baseline Cal
Step 5 of 11
DSC Training Course
Baseline calibration running
T1 Baseline Cal
Step 6 of 11

50
DSC Training Course
T1 Baseline Cal
Step 7 of 11
Start calibration analysis
DSC Training Course
File is opened
automatically
T1 Baseline Cal
Step 8 of 11

51
DSC Training Course
Select limits then click on
Limits Ok button
T1 Baseline Cal
Step 9 of 11
DSC Training Course
Click on Accept
to save calibration
T1 Baseline Cal
Step 10 of 11

52
DSC Training Course
Once the file is analyzed and the
results are saved, a checkmark
appears next to the filename
T1 Baseline Cal
Step 11 of 11
DSC Training Course
Select type of
calibration to run
T1 Calibration

53
DSC Training Course
Enter parameters
T1 Temperature Cal
Step 1 of 7
DSC Training Course
Review summary
T1 Temperature Cal
Step 2 of 7

54
DSC Training Course
Enter sample
information
T1 Temperature Cal
Step 3 of 7
DSC Training Course
Finish entering
sample information
T1 Temperature Cal
Step 4 of 7

55
DSC Training Course
Review checklist
T1 Temperature Cal
Step 5 of 7
DSC Training Course
Start calibration analysis
T1 Temperature Cal
Step 6 of 7

56
DSC Training Course
File is opened and analyzed
automatically. Click Analyze
to change limits or Accept to
complete the calibration.
T1 Temperature Cal
Step 7 of 7
DSC Training Course
Traceable Calibration Materials
• NIST DSC calibration materials:� SRM 2232 Indium Tm = 156.5985°C� SRM 2220 Tin Tm = 231.95°C� SRM 2222 Biphenyl Tm = 69.41°C� SRM 2225 Mercury Tm = -38.70°C
• NIST: Gaithersburg, MD 20899-0001� Phone: 301-975-6776� Fax: 301-948-3730� Email: [email protected]� Website: http://ts.nist.gov/srm

57
DSC Training Course
Traceable Calibration Materials
• LGC DSC Calibration Materials:� LGC2601: Indium (TA p/n: 915060-901)� LGC2608: Lead� LGC2609: Tin� LGC2611: Zinc
• Laboratory of the Government Chemist, UK� Phone: 44 (0) 181 943 7565� Fax: 44 (0) 181 943 7554� Email: [email protected]
DSC Training Course
Traceable Calibration Materials
• Certified materials used to establish traceability of instrument calibration
• ISO/GLP certification often requires third party calibration of instruments:� Service provided by TA Instruments service representative
using certified materials� Certificate of Calibration issued showing traceability of
calibration to a national laboratory

58
DSC Training Course
� After completion of calibration routine, run baseline
� Standard mode
� Empty cell, -90°C-400°C (w/ RCS)
� Plot mW vs. temperature on a 1mW scale� Should look fairly flat on this scale
� Measure bow,drift & zero� Bow <50 µW
� Drift <50 µW
� Should be around zero
� To verify performance in the future re-run
Verifying Baseline
DSC Training Course
Verifying Baseline
-0 .4
-0.2
0.0
0.2
0.4
Heat Flow (mW)
-100 0 100 200 300 400
Temperature (°C )

59
DSC Training Course
Verifying Baseline
176 .66 °C0 .02138mW
21 m ic roW bow
-0 .0 03252m W-0 .04562mW
42 m ic roW d r if t
-0 .5
-0 .4
-0 .3
-0 .2
-0 .1
0 .0
0 .1
0 .2
0 .3
0 .4
0 .5Heat Flow (mW)
-1 00 0 100 200 300 40 0
Tempera ture (°C )
DSC Training Course
Verifying Baseline
Initia l Baseline after calibration
Baseline check - still good
-0.4
-0.2
0.0
0.2
0.4
Heat Flow (mW)
-100 0 100 200 300 400
Temperature (°C)

60
DSC Training Course
Verifying Baseline
In itia l Baseline after calibration
Baseline check - still good
Baseline check - needs recalibrating
-0.4
-0.2
0.0
0.2
0.4Heat Flow (mW)
-100 0 100 200 300 400
Temperature (°C)
DSC Training Course
Verifying Heat Flow & Temperature
� Run Indium as a sample (i.e. in std mode not cal mode)
� Analyze melt and record melt onset & heat of fusion
� Compare to known values
� Melting of In 156.6°C
� Heat of Fusion 28.71J/g

61
DSC Training Course
Verifying Heat Flow & Temperature
157 .06°C
156.64°C-28 .60J /g
-25
-20
-15
-10
-5
0
5
Heat Flow (mW)
140 145 150 155 160 165 170 175 180
Temperature (°C)
Temp is within
0.04°C
Heat of fusion is
within 0.11J/g
DSC Training Course
Q-Series Platinum Software
� Platinum features are designed to assist you in ensuring that your instrument is in proper working condition, calibrated, and has the latest software available.
� Automatic Calibration Routines
� Auto Diagnostics
� Event Scheduler
� Email/Messaging Notification
� Live Software Updates

62
DSC Training Course
Platinum Software
DSC
DSC Training Course
Automatic Calibration Routines
� DSC Automatic Calibration Routines
� Baseline Calibration (T1)
� Cell/Cooler Conditioning (T4 or T4P)
� Baseline Conditioning (T4 or T4P)
� Tzero Calibration (T4 or T4P)
� Cell Constant/Temperature Calibration
� Cell Constant/Temperature Verification

63
DSC Training Course
Calibration Sequence Generator
� Select Auto Calibration through Platinum options to initiate theCalibration Sequence Generator. Creates a calibration sequence based on your selections.
DSC Training Course
DSC Diagnostics Routine
� Perform a diagnostic check of the instrument
� List based on options (e.g., Autosampler, MFC, Cooler Type)

64
DSC Training Course
Event Scheduler
� Sequences, Auto-calibration, Auto-Verification and Diagnostics Events can be Scheduled via Platinum Software
DSC Training Course
� DTA Baseline & TGA Weight Calibration
� 2 runs – empty beams & then calibration weights
� Temperature Calibration
� Up to 5 temperature standards
� DSC Heat Flow Calibration
� 2 runs – empty pans then sapphire
SDT Q600 (2960) Calibration

65
DSC Training Course
� Two scans from ambient to 1500°C at 20 oC/min� empty alumina pans
� sapphire in alumina sample pan
� Use Software to analyze
� E-curve will be calculated and transferred to the module
when the user accepts the results
SDT Q600 (2960) DSC Heat Flow Calibration
DSC Training Course
Instrument Preparation
� Purge Gas� Type of purge gas and flow rate affect calibration and therefore
should be controlled� Nitrogen is preferred because it is inert and calibration is least
affected by changes in flow rate
� Cooling Accessories� If used, they should be operating and equilibrated prior to
calibration or sample runs
� Warm-up Time/Environment� Electronics should be given at least one hour to stabilize for
important samples if the instrument has been turned OFF� Electronics are effected by ambient temperature. Avoid areas
such as hoods or near an air conditioner

66
DSC Training Course
Recommended Purge Gas Flow Rates
Module Purge Port
All TA DSC’s 50(N2) or 25(He)
(Purge in ml/min)
If you have a 2900s DSC, purge the vacuum port with 50ml/min if using a RCS or LNCA.
If purge gas is too slow - possible moisture accumulation & early aging of the cell
If purge gas is too fast – excessive noise
DSC Training Course
Purge gas ports on Q-Series DSC
Dry N2 @ 20 psi Purge gas @ 20 psi
Dry air @ 15-120 psi for Finned air cooler
Dry N2 @ 15-120 psi for RCS or LNCS
20 psig not 20 psig max

67
DSC Training Course
This is used to specify the type
of gas connected to Gas #1
& Gas #2 inlets
DSC Training Course
This is used to select which
gas is going to the DSC cell
and the flow rate for that gas.

68
DSC Training Course
Autolid II: Improved Purge Gas Exhaust
DSC Training Course
Selecting Optimum Experimental Conditions
� "Always" run a TGA experiment before beginning DSC tests on new materials
� Heat approximately 10mg sample in the TGA at 10°C/min to determine:
� Volatile content
� Unbound water or solvent is usually lost over a broader temperature range and a lower temperature than a hydrate/solvate
� Decomposition temperature
� DSC results are of little value once the sample has lost 5% weight due to decomposition (not desolvation)
� Decomposition is a kinetic process (time + temperature dependent). The measured decomposition temperature will shift to lower temperatures at lower heat rates

69
DSC Training Course
Selecting Optimum Experimental Conditions
� Use TGA data to help select DSC experimental conditions
� Crimped vs. Hermetic (sealed) Pan
� Use hermetic pan if sample loses approximately 0.5% or more
� Maximum Temperature
� Excessive decomposition will contaminate DSC cell between runs
� When comparing samples, always use the same experimental conditions
DSC Training Course
Optimization of DSC Conditions
� Sample Preparation� Keep thin; cut rather than crush
� Weight of 10-15mg for polymers; 3-5mg for metal or chemical melting
� Goal is to achieve a change of 0.1-10mW heat flow in going through the transition (see Figure #1)
� If sample contains volatiles, put 5-10 pinholes in the lid of the pan before crimping in order to permit a continuous evaporation process

70
DSC Training Course
Heat Flow Change During a Transition
1.0
Figure #1
+
40 60 80 100 120 140 160 180 200 220
-2.0
-1.5
-1.0
-0.5
0.0
0.5
161.17°C
1.593mW
69.41°C
73.37°C(H)
0.4881mW
143.70°C
34.95J/g
Heat Flow (mW)
Temperature (oC)
DSC Training Course
Selecting Optimum Experimental Conditions
� Sample Pan: Crimped vs. Hermetically Sealed
� Crimped pans are lighter (» 23mg) and provide better sensitivity and resolution
� Hermetic aluminum pans are heavier (» 55mg) but can be sealed to prevent loss of volatiles
� Hermetic stainless steel pans (» 250mg) permit use of large samples (100mg) and higher temperatures/pressures (2000 psig = 1.4 MPa)
� Care should be taken to keep the bottom of all pans flat to improve heat transfer/resolution

71
DSC Training Course
Optimization of DSC Conditions
Experimental Conditions (cont.)
� Select an end-temperature which does not cause decomposition of the sample to occur in the DSC.
� Decomposition products can condense in the cell and cause either corrosion of the cell or baseline problems� Use sealed glass ampoules or stainless steel pans, which can take
high pressure (>1000psi), in order to study decomposition by DSC
DSC Training Course
Sample Pans
� Type of pan depends on:
� Sample form
� Volatilization
� Temperature range
� Use lightest, flattest pan possible
� Always use reference pan of the same type as sample pan

72
DSC Training Course
Standard DSC Pans (Crimped)
� Pan & lid weighs ~23mg, bottom of pan is flat
� Used for solid non-volatile samples
� Always use lid (see exceptions)
� Lid improves thermal contact
� Keeps sample from moving
� Exceptions to using a lid
� Running oxidative experiment
� Running PCA experiment
DSC Training Course
Standard DSC Pans (Crimped)
� Crimped pans are available in:
� Aluminum: up to 600°C
� Copper: up to 725°C (in N2)
� Gold: up to 725°C
� Standard Pans without lids
� Graphite: up to 725°C (in N2)
� Platinum: up to 725°C

73
DSC Training Course
Hermetic Pans (Sealed)
� Pan & Lid weigh ~55mg, bottom of pan is not as flat as std pans
� Used for liquid samples and samples with volatiles
� Always use lid (same exceptions as before)
� After sealing pans, the lid should form a dome
DSC Training Course
Hermetic Pans (Sealed)
� Hermetic Pans are available in:
� Aluminum: <600°C; <3 atm (300 kPa gage)
� Alodined Aluminum: <600°C; <3 atm (300 kPa gage)
� (For aqueous samples)
� Gold: <725°C; <6 atm (600 kPa gage)
� Specialized Sealed Pans
� High Volume: 100µL; <250°C; 600 psig(4.1 MPa)
� High Pressure: 35µL; <300°C; 1450 psig(10 MPa)
Note: 3 atm is approximately 44 psig

74
DSC Training Course
New Tzero Sample Press & Pans
� Completely Redesigned Press
� Two New Sample Pans
� Compatible with existing sample pans
� No tooling required
� Color-coordination between pan boxes and dies
� Improved hermetic sealing
� Improved DSC Performance
DSC Training Course
Factors Affecting Sensitivity/Resolution
� Thermocouple Output
� Magnitude of ∆T
� Signal/Noise
� Baseline Quality
� Time Constant of Transducer
� Pan Contact Resistance
Sensitivity
Resolution
The flatness of the bottom of the DSC pan in critical to optimizing resolution

75
DSC Training Course
New TA Instruments Tzero Pans
� The Tzero pan has been engineered to have a perfectly flat bottom and not to deform during crimping. This ensures the optimal contact between pan and sensor, minimizing the contact resistance and improving resolution.
� The Tzero Pan can be configured for crimped or hermetic use.
� The Tzero Low-Mass Pan is designed for the highest sensitivity when sample mass is limited.
Tzero Low-Mass Pan
Tzero Pan
DSC Training Course
Tzero Press Kit Configurations
Tzero Pan
Tzero LidTzero
Hermetic LidSmall samples
High Sensitivity
Larger Samples
High PerformanceHermetic seals
Standard Pan Standard Lid
Tzero
Low-Mass Pan

76
DSC Training Course
It Does Matter What Pan You Use
Monohydrate
Pharmaceutical
sample
DSC Training Course
TGA of Monohydrate Pharmaceutical Drug

77
DSC Training Course
Sample Shape
� Keep sample thin
� Cover as much as the bottom of pan as possible
DSC Training Course
Sample Shape
� Cut sample to make thin, don’t crush
� If pellet, cut cross section

78
DSC Training Course
Sample Shape
� Cut sample to make thin, don’t crush
� If pellet, cut cross section
� If powder, spread evenly over the bottom of the pan
DSC Training Course
Keeping the DSC Cell Clean
� One of the first steps to ensuring good data is to keep the DSC cell clean
� How do DSC cells get dirty?
� Decomposing samples during DSC runs
� Samples spilling out of the pan
� Transfer from bottom of pan to sensor

79
DSC Training Course
How do we keep DSC cells clean?
� DO NOT DECOMPOSE SAMPLES IN THE DSC CELL!!!
� Run TGA to determine the decomposition temperature
� Stay below that temperature!
� Make sure bottom of pans stay clean
� Use lids
� Use hermetic pans if necessary
DSC Training Course
TGA Gives Decomposition Temperature

80
DSC Training Course
Cleaning Cell (Q-Series Only)
� Use solvent – slightly damp swab with an appropriate solvent
� Heat cell to 200°C for 10 min to drive off any remaining solvent
� Solvents are Last Resort for 2900 Series
� If the cell is still dirty………
DSC Training Course
Cleaning Cell (Q-Series and 2900 Series)
� If the cell is still dirty
� Clean w/ brush
� Brush gently both sensors and cell if necessary
� Be careful with the Tzero™ thermocouple
� Blow out any remaining particles

81
DSC Training Course
Q-Series Cell Before Cleaning
DSC Training Course
Brushing the Sample Sensor

82
DSC Training Course
After Cleaning Sample Sensor
Fibers in
cell from
cleaning
brush
need to be
removed
DSC Training Course
Cleaning Cell (Q-Series and 2900 Series)
� Bake out (Use as a last resort in Q-Series cell)
� Air purge
� Open lid
� Heat @ 20°C/min to appropriate temp (max of 550°C) No Isothermal @ the upper temperature
� Cool back to room temp & brush cell again
� Check for improved baseline performance

83
DSC Training Course
Cleaning Cell (2900 Series)
� LAST RESORT for 2900 Series� Use solvent – slightly damp swab with appropriate solvent
� Keep solvent away from holes in base of cell
� Heat cell to 200°C for 10 min to drive off any remaining solvent
DSC Training Course
What if I need help?
� On-site training & e-Training courses - see Website
� Call the TA Instruments Hotline
� 302-427-4070 M-F 8-4:30 Eastern Time
� mailto:[email protected]
� Call the TA Instruments Service Hotline
� 302-427-4050 M-F 8-4:30 Eastern Time
� Check out our Website
� http://www.tainstruments.com/

84
©2009 TA Instruments
Interpretation of Undesirable
Events in DSC Data
DSC Training Course
Topics
√ Event 1: Large Endothermic Shift in the Baseline
at the Beginning of the Experiment
√ Event 2: Baseline Slope After Baseline Calibration
Event 3: Unexpected Transitions Near 0°C
Event 4: Shifts in the Baseline and Apparent Melting
at the Glass Transition
Events 5 and 6: Exothermic Peaks in the Data Between the Glass Transition and Melting Temperature
Event 7: Changes in the Melting Transition Due to Thermal History
Event 8: Decomposition
[See Figure 5]

85
DSC Training Course
Figure 5
DSC Training Course
Event 3: Unexpected Transitions Near 0°C
Event 3 in Figure 5 is caused by water. The transition is also much larger than normally seen in order to more easily illustrate it.
Water in the DSC Cell
� It is possible to get condensation of water within the DSC cell if the purge gas is not sufficiently dry or if the cell is opened to room atmosphere when its temperature is below the freezing point of water, 0°C.
� The transitions caused by water in the cell can cover a wide temperature range from –10°C to more than 50°C and are highly undesirable.

86
DSC Training Course
Event 3 (cont.)
� When water condenses in the cell, it can condense on the sample pan, reference pan, sensors, and furnace. Water on the sample pan or inside it typically melts very sharply at 0°C as seen in the endothermic spike at 0°C in Figure 5.
� Water on the reference pan would look similar except that it would appear as an exothermic spike in the data. In this data, the melting peak is endothermic because most, if not all, of the water was on the sample. To get this undesirable transition for illustration purposes, the sample pan was removed from the DSC when its temperature was –50°C. Water from the room air condensed on the pan, plus some of it probably condensed in other parts of the cell.
DSC Training Course
Event 3 (cont.)
� The broader endothermic peak between 0°C and 25°C is due to the endothermic evaporation of the water on the DSC pan. As can be seen in the data, the baseline does not stabilize until almost 50°C when all of the water in contact with the pan and sensor has finally evaporated.
� To avoid artifacts in the data due to water, it is best to have a drying tube in the purge gas line between the source of the gas and the purge gas inlet on the DSC cell base. In addition, never open the cell to the atmosphere or load a sample when the cell temperature is below 0°C.

87
DSC Training Course
Event 3 (cont.)
Water in the Sample
� Many samples contain water and, therefore, can undergo a transition near 0°C due to this water.
� However, just because the sample contains water does not mean it will have a melting transition near 0°C.
� Water that is physically or chemically associated with sample material generally will not freeze and, therefore, cannot melt.
� Unassociated water or “free” water in the sample has the same properties as bulk water. However, the actual melting point is often lower than 0°C due to impurities dissolved in the water.
DSC Training Course
Figure 5

88
DSC Training Course
Event 4: Shifts in the Baseline
Shifts in the Baseline
� The most common baseline shift is due to the increase in heat capacity that occurs upon heating through the glass transition temperature. The size of the endothermic shift is a measure of the amount of amorphous material in the sample. The more amorphous the sample, the larger the baseline shift.
� Heat capacity is a measure of molecular mobility within the sample. Since there is a step-increase in molecular mobility within the sample as it is heated through its glass transition temperature, there is also a step-increase in the amount of heat required to continue heating the sample at the same rate above its Tg.
DSC Training Course
Event 4 (cont.)
� An exothermic shift (less endothermic) in the baseline while heating results in the baseline moving back closer to zero (0 mW) heat flow. This type of shift is much less common and in order for this to occur while heating, there must either be a reduction in molecular mobility or a reduction in sample mass. Most of the time, this type of positive shift is due to evaporation of some component within the sample.
Apparent Melting in the Glass Transition
� The endothermic shift in the baseline at the transition in Figure 5 is due to the glass transition of the amorphous PET polymer.

89
DSC Training Course
Event 4 (cont.)
� Depending on the thermal history of amorphous (glassy) polymers, the glass transition can appear as a simple step in the baseline or one that has a substantial endothermic peak that canbe misinterpreted as a melting peak.
� Figure 6 shows the results from two experiments on the same sample; the only difference is the thermal history. The sample with the endothermic peak was stored for over ten years at a temperature just below its glass transition temperature. As it aged, the enthalpy of the sample decreased towards equilibrium, and it became denser and more brittle.
DSC Training Course
Event 4 (cont.)
� By heating a sample above the glass transition temperature and then cooling it back to room temperature, the previous thermal history is erased. This is the data marked as the “Second Heat” in Figure 6.
� The term for the endothermic peak that develops in the glass transition with aging at temperatures below the glass transition temperature is “enthalpic relaxation.” It is due to the fact that amorphous materials are not in thermodynamic equilibrium but, with time, do relax and move towards equilibrium.

90
DSC Training Course
Figure 6
DSC Training Course
Aging of Amorphous Structure (Storage Stability)
Background Information
� At temperatures above Tg, there is high molecular mobility and the sample is in thermal equilibrium
� At temperatures well below Tg (Tg-40°C), molecular mobility is low and the existing amorphous structure is relatively stable
� At temperatures just below Tg (Tg-10°C), there is enough molecular mobility that the existing amorphous structure is not stable and will change with time as the amorphous material seeks a lower energy state (amorphous equilibrium or crystalline)

91
DSC Training Course
Aging of Amorphous Structure (Storage Stability)
� Cooling at relatively high rates from temperatures above Tg to temperatures below Tg creates a meta-stable glass which ages towards equilibrium over time. The rate of change is a function of the storage temperature and molecular structure
� DSC/MDSC can be used to evaluate the stability of the meta-stable glass and compare the structural state of the amorphous phase
DSC Training Course
Some Definitions
� Enthalpic Relaxation
� The process of a meta-stable glass relaxing towards equilibrium at a temperature below Tg
� Occurs as the sample is being cooled to temperatures below Tg
� Occurs as the sample is being stored at temperatures below Tg
� Enthalpic Recovery
� The recovery of energy (J/g) lost during Enthalpic Relaxation. It (peak in DSC data @ Tg) occurs as the sample is heated to a temperature above Tg

92
DSC Training Course
Effect of Aging on Amorphous Materials
Temperature
Max Tg
Storage
timeHMS
Equilibrium
Liquid
Equilibrium
Glass
KauzmannTemp; Lowest Tg
(Entropy of Crystal)
Where H = High relative cooling rate
M = Medium relative cooling rate
S = Slow relative cooling rate
DecreasesEntropy
DecreasesEnthalpy
DecreasesHeat Capacity
DecreasesCoefficient of
Expansion
IncreasesModulus
DecreasesSpecific Volume
Response on
S
Physical Property
Entropy
Enthalpy
Coefficient of
Modulus
Specific Volume
Response on
Storage Below Tg
Physical Property
H
V
DSC Training Course
Effect of Cooling Rate on Shape of Tg
PMMA
6.36mg
Heating @ 20°C/min
Sample cooled @ 40, 20,
10, 5, 2, & 1°C/min
Cooled @ 40°C/min
Cooled @ 1°C/min

93
DSC Training Course
Figure 7
DSC Training Course
Enthalpy/Volume Diagrams
liquid
us
Temperature
Enthalpy or Volume
Equilibrium Conditions
Tg
Above Tg, the
sample is
mobile, so it
doesn’t matter
what cooling
rate we use. The
sample will be in
equilibrium

94
DSC Training Course
Enthalpy/Volume Diagrams
liquid
us
Temperature
Enthalpy or Volume
Equilibrium
Conditions
Tg Below Tg, there
is very little
molecular
mobility, so the
cooling rate will
determine
whether the
sample stays in
equilibrium
DSC Training Course
For Example
solidus
liquid
us
Temperature
Enthalpy or Volume
Equilibrium Conditions
Tg
Non-equilibrium
states
1°C/year

95
DSC Training Course
Enthalpy/Volume Diagrams
Temperature
Enthalpy or Volume
Tg
Non-equilibrium states
DSC Training Course
Importance of Enthalpic Relaxation
Is enthalpic recovery at the glass transition important?…Sometimes
� Glass transition temperature, shape and size provide useful information about the structure of the amorphous component of the sample.
� This structure, and how it changes with time, is often importantto the processing, storage and end-use of a material.
� Enthalpic recovery data can be used to measure and predict changes in structure and other physical properties with time.

96
DSC Training Course
Figure 5
DSC Training Course
Events 5 and 6
� Events 5 and 6 in Figure 1 are the result of crystallization and crystal perfection processes that occur as the sample is heated.
� To understand what might be happening, so that the data is interpreted correctly, there are three factors that need to be considered:
1. What is the thermal history of the sample?
2. Does the material crystallize and, if so, how fast or slow (kinetics) does it crystallize as a function of time and temperature?
3. How fast was the sample heated or cooled in the DSC experiment?
Exothermic Peaks in the Data between the Tg and Melting Temperatures

97
DSC Training Course
Events 5 and 6 (cont.)
Thermal History
� When referring to “Thermal History,” we are identifying the temperature versus time profile that the sample has been subjected to in the past.
DSC Training Course
Events 5 and 6 (cont.)
� As temperature is increased above Tg, molecular mobility increases rapidly. This permits the molecules to align with their neighbors and crystallize as seen in the exothermic peak centered near 130°C for the “First Heat.”
� Although the baseline appears to stabilize between 150 and 225°C, there is an ongoing process of crystallization and crystal perfection over that temperature range as will be discussed later.
� The term “crystal perfection” is used to describe the process where small, less perfect crystals melt and then recrystallize into larger, more perfect crystals that will melt again at a higher temperature.

98
DSC Training Course
Events 5 and 6 (cont.)
Crystallization Kinetics
� Crystallization is a kinetic process, which means that the rate of crystallization is a function of both time and temperature. The fact that the peak of the crystallization process occurs near 130°C in Figure 8 is the result of the selected experimental conditions.
� Figure 9 shows how the cold crystallization peak broadens and shifts to a higher temperature as the heating rate is increased from 2 to 16°C/min. This shift is much larger than seen in the glass transition and melting processes, which have relatively minor kinetic contributions.
DSC Training Course
Figure 8

99
DSC Training Course
Figure 9
DSC Training Course
Figure 5

100
DSC Training Course
Event 7: The Melting Transition
� The melting transition can be the least complicated transition measured by DSC. However, it can also be the most complicated transition for some materials, especially semi-crystalline polymers.
� When measuring the melting transition, it is normal to measure the temperature range over which it occurs as
well as the enthalpy of melting (∆Hm) which is proportional to the crystalline content of the sample.
DSC Training Course
Event 7 (cont.)
� The complication occurs with semi-crystalline materials because of the fact that the sample can increase in crystallinity as it is being heated in the DSC. If this occurs and is not considered in calculating the crystallinity of the sample, an artificially large value will result.
� Figure 10 shows the data from an MDSC® experiment. The Total signal is qualitatively and quantitatively equivalent to traditional DSC. From just the Total signal, it is possible and quite common to calculate a crystallinity value which has an error in excess of 100%.

101
DSC Training Course
Figure 10
DSC Training Course
Event 7 (cont.)
� The question is: “How can DSC provide such a wrong answer?”The answer is that it does not.
� The error is due to the integration limits selected by the operator.
� Total signal of DSC is often misleading because it measures only the sum of all exothermic and endothermic processes.
� Figure 11 shows that slower heating rates provide more exothermic (crystal perfection) activity in the temperature region between 150 and 220°C.
� The increased crystal perfection that occurs at slower heating rates causes the melting point to increase to higher temperatures.

102
DSC Training Course
Figure 11
DSC Training Course
Event 7 (cont.)
� The shape of the melting peak is also affected by crystal perfection processes that occur over the same temperature range as bulk melting. This often gives the appearance of two melting peaks rather than what actually is an exothermic crystallization peak superimposed on an endothermic melting peak.
� Figure 12 compares the shape of the melting process on the same sample of PET after it had been cooled at different rates from above its melting point. This is different from Figure 11 where all samples had the same thermal history (quench cooled) but were heated at different rates.

103
DSC Training Course
Figure 12
DSC Training Course
Figure 5

104
DSC Training Course
Event 8: Decomposition
� Beginning at about 310°C in Figure 1, the sample of PET begins to decompose.
� Depending on the chemistry of the sample and type of sample pan used, decomposition can either be endothermic or exothermic.
� Decomposition usually involves a release of some volatiles. The process of off-gasing is usually erratic, and the data can become noisy and nonreproducible.
� Decomposing samples in a DSC will adversely affect the baseline and may corrode the DSC cell.
DSC Training Course
Applications
• Thermoplastics• Thermosets• Pharmaceuticals• Heat Capacity • Glass Transition• Melting and Crystallization• Additional Applications Examples

105
DSC Training Course
Thermoplastic Polymers
Semi-Crystalline or Amorphous
Crystalline Phase
melting temperature Tm
(endothermic peak)
Amorphous Phase
glass transition
temperature (Tg)
(causing ∆Cp)
Tg < TmCrystallizable polymer can crystallize
on cooling from the melt at Tc
(Tg < Tc < Tm)
DSC Training Course
DSC of Thermoplastic Polymers
� Tg
� Melting
� Crystallization
� Oxidative Induction Time (OIT)
� General Recommendations
� 10-15mg in crimped pan
� H-C-H @ 10°C/min

106
DSC Training Course
Selecting Experimental Conditions
� Thermoplastic Polymers
� Perform a Heat-Cool-Heat Experiment at 10°C/min.
� First heat data is a function of the material and an unknown thermal history
� Cooling segment data provides information on the crystallization properties of the polymer and gives the sample aknown thermal history
� Second heat data is a function of the material with a known thermal history
DSC Training Course
Heat/Cool/Heat
Second Heat
First Heat
Cool
-1.5
-1.0
-0.5
0.0
0.5
1.0
1.5
Heat Flow (W/g)
20 60 100 140 180 220 260
Temperature (°C)

107
DSC Training Course
Selecting Experimental Conditions
Thermoplastic Polymers (con't)
� Interpreting Heat-Cool-Heat Results:
� One of the primary benefits of doing Heat-Cool-Heat is for the comparison of two or more samples which can differ in material, thermal history or both
� If the materials are different then there will be differences inthe Cool and Second Heat results
� If the materials are the same and they have had the same thermal history then all three (H-C-H) segments will be similar
� If the materials are the same but they have had different thermal histories then the Cool and Second Heat segments are similar but the First Heats are different
DSC Training Course
Selecting Experimental Conditions
� During first heat the maximum temperature must be higher than the melting peak end; eventually an isothermal period must be introduced
� Too high temperature/time:
� decomposition could occur
� Too low temperature/time:
� possibly subsequent memory effect because of the fact that crystalline order is not completely destroyed
� For non-crystallizable (amorphous) thermoplastics the maximum temperature should be slightly above Tg (removal of relaxation effects, avoid decomposition)

108
DSC Training Course
Thermosetting Polymers
Thermosetting polymers react (cross-link) irreversibly. A+B will give out heat (exothermic) when they cross-link (cure). After cooling and reheating C will have only a glass transition Tg.
A + B C
GLUE
DSC Training Course
DSC of Thermosetting Polymers
� Tg
� Curing
� Residual Cure
� General Recommendations
� 10-15 mg in crimped pan if solid; hermetic pan if liquid
� H-C-H @ 10°C/min

109
DSC Training Course
Selecting Experimental Conditions
Thermosetting Polymers
� Anneal the sample(if needed), then Heat-Cool-Heat at 10°C/min.
� Anneal approximately 25°C above Tg onset for 1 minute to eliminate enthalpic relaxation from Tg (if needed)
� First Heat is used to measure Tg and residual cure (unreacted resin). Stop at a temperature below the onset of decomposition
� Cooling segment gives the sample a known thermal history
� Second Heat is used to measure the Tg of the fully cured sample.
� The greater the temperature difference between the Tg of the First and Second Heats the lower the degree of cure of the sample as received
DSC Training Course
Comparison of First and Second Heating Runs
0 50 100 150 200 250 300-0.24
-0.20
-0.16
-0.12
-0.08
-0.04
Temperature (°C)
Heat Flow (W/g)
Tg
Tg
155.93°C
102.64°C
20.38J/g
Residual Cure
First
Second

110
DSC Training Course
Characterization of Epoxy Prepreg
2nd heat shows
increased Tg, due to
additional curing during
1st heat
Note: Small exotherm due to residual cure
DSC Training Course
Determination of % Cure
79.33J/g75.21 % cured
NOTE: Curves rescaled and shifted for readability
145.4J/g54.55 % cured
Under-cured Sample
Optimally-cured Sample-5.27°C(H)
DSC Conditions:Heating Rate = 10°C/min.Temperature Range = -50°C to 250°CN2 Purge = 50mL/min.
-12.61°C(H)
-0.5
0.0
0.5
1.0
1.5
2.0
Heat Flow (W/g)
-50 0 50 100 150 200 250
Temperature (°C)Exo Up Universal V2.4F TA Instruments

111
DSC Training Course
Pharmaceuticals
� Tg
� Melting
� Purity
� Polymorphs
� General Recommendations
� Use TGA to determine pan type
� Use 1-5 mg samples (use 1mg for purity)
� Initial H-C-H @ 10°C/min (1°C/min for purity)
� If polymorphs present heat faster to inhibit polymorphic transformations
DSC Training Course
Tg of Sucrose Varies with Moisture Content
Std DSC @ 20°C/min
Vented Pans

112
DSC Training Course
Structure Changes With Time
10 min @ 55°C
100 min
Sucrose
13.98mg
Annealed @ 55°C
1000 min
DSC Training Course
Melting is Not Heating Rate Dependent
Phenacetin
Hermetic Pan
Approx 1.5mg
Onset of melting shifts by 0.3C
over heating rate range of 1-
20°C/min for sample that has a
true melt

113
DSC Training Course
Ciprofloxacin Hydrochloride Decomposes
Onset differs
by almost 30°C
Decomposition is kinetic (heating rate dependent)
DSC Training Course
TGA of Ciprofloxacin Hydrochloride
0.0
0.5
1.0
Deriv. Weight (%
/°C)
20
40
60
80
100
Weight (%
)
0 50 100 150 200 250 300 350 400
Temperature (°C)
Decomposition

114
DSC Training Course
Sulfanilimide
Comparison of 1 & 10°C/min Heating Rates on
Melting of three Polymorphs for Sulfanilimide
DSC Training Course
Specific Heat Capacity
� What is it?
� How is it observed and measured?
� Methods for calculating specific heat capacity
� What affects the specific heat capacity of a polymer?

115
DSC Training Course
What is Heat Capacity?
� Heat capacity is the amount of heat required to raise or lower the temperature of a material.
� Specific heat capacity refers to a specific mass and temperature change for the material (J/g°C)
DSC Training Course
Why is Heat Capacity Important?
� Thermodynamic property of material (vs. heat flow)
� Measure of molecular mobility
� Provides useful information about physical properties of the material as a function of temperature

116
DSC Training Course
Heat Flow Due to Heat Capacity
10.04 mg PMMA
DSC Training Course
Measuring Heat Capacity
� In a DSC experiment, heat capacity is measured as the absolute value of the heat flow, divided by the heating rate, and multiplied by a calibration constant.
dH/dt = Cp (dT/dt)
or
Cp = [(dH/dt)/(dT/dt)] x K
K = calibration constant

117
DSC Training Course
Conventional DSC Cp Measurement
x wtRateHeat
HF– HFK x Cp
MTS=
HF
�
endo
0HFMT
HFS
Temp.
Where:
K = Calibration constant
HFS = Differential heat flow
with sample
HFMT = Differential heat flow
with empty pans
wt = weight of sample
DSC Training Course
Alternative DSC Cp Measurement
HF
�
endo
0
HFHR1
HFHR2
Temp.
wt)HR– (HR
HF– HFK x Cp
12
HR1HR2=
Where:
K = Calibration constant
HFHR1 = Differential heat flow of
sample at HR1
HFHR2 = Differential heat flow of
sample at HR2
HR2 = Heating rate 2
HR1 = Heating rate 1
wt = weight of sample

118
DSC Training Course
Direct CP Measurement on Q2000/1000
� Unlike any other DSC, the heat flow signal of the Q2000/1000 is an absolute signal:
� Baseline is flat
� Absolute zero heat flow value established as part of method
� By knowing absolute values of the heat flow and heating rate, heat capacity is calculated in real time and stored in data file
� Accuracy and precision is generally ± 1-2% with just single run measurements
DSC Training Course
Q1000 Direct Heat Capacity
Average Value of 8 Runs at 20°C/min in a Hermetic Pan is 0.893 vs. a TheoreticalValue of 0.902 J/g°C at 97°C. Total Rangeof Results Varied Less Than +/- 2%. SampleWas Replaced At The End of Each Run.
97.00°C0.9111J/g/°C
97.00°C0.8758J/g/°C
-0.5
0.0
0.5
1.0
1.5
Heat Capacity (J/g/°C)
0 50 100 150 200
Temperature (°C) Universal V3.1B TA Instruments

119
DSC Training Course
What Affects the Specific Heat Capacity?
� Amorphous Content
� Aging
� Side Chains
� Polymer Backbone
� Copolymer Composition
� Anything that effects the mobility of the molecules, affects the Heat Capacity
DSC Training Course
Effect of Amorphous Content on Cp
� Amorphous Cp is greater than Crystalline Cp
� Amorphous Content increases Specific Heat Capacity
� Crystalline polymers contain more order and thus
fewer degrees of molecular motion. Less
molecular motion results in lower specific heat
capacity.

120
DSC Training Course
Heat Capacity Summary
� Anything that effects the mobility of the molecules, affects the Heat Capacity
� The Q2000/1000 provides direct Cp measurement with one run(pan weights required)
DSC Training Course
Glass Transitions (Tg)
� The glass transition is a step change in molecular mobility (in the amorphous phase of a sample) that results in a step change in heat capacity
� The material is rigid below the glass transition temperature and rubbery above it.
� Amorphous materials flow, they do not melt (no DSC melt peak)

121
DSC Training Course
Glass Transitions
� The change in heat capacity at the glass transition is a measure of the amount of amorphous phase in the sample
� Enthalpic recovery at the glass transition is a measure of order in the amorphous phase. Annealing or storage at temperatures just below Tg permit development of order as the sample moves towards equilibrium
DSC Training Course
Heat Flow & Heat Capacity at the Tg
Heat Flow
Heat Capacity
Temperature Below Tg - lower Cp - lower Volume - lower CTE - higher stiffness - higher viscosity - more brittle - lower enthalpy
Glass Transition is Detectable by DSCBecause of a Step-Change in Heat Capacity
-1.0
-0.9
-0.8
-0.7
-0.6
-0.5
-0.4
-0.3
[ ––––– · ] Heat Flow (mW)
0.5
1.0
1.5
2.0
Heat Capacity (J/g/°C)
70 90 110
Temperature (°C)Exo Up Universal V3.8A TA Instruments
Polystyrene

122
DSC Training Course
Measuring/Reporting Glass Transitions
� The glass transition is always a temperature range
� The molecular motion associated with the glass transition is time dependent. Therefore, Tg increases when heating rate increases or test frequency (MDSC®, DMA, DEA, etc.) increases.
� When reporting Tg, it is necessary to state the test method (DSC, DMA, etc.), experimental conditions (heating rate, sample size, etc.) and how Tg was determined
� Midpoint based on ½ Cp or inflection (peak in derivative)
DSC Training Course
Glass Transition Analysis
Polystyrene
9.67mg
10°C/min

123
DSC Training Course
Glass Transition Analysis
Polystyrene
9.67mg
10°C/min
DSC Training Course
Step Change in Cp at the Glass Transition
% Amorphous = 0.145/0.353= 41%
PET
9.43mg

124
DSC Training Course
A Glass Transition is Reversible
DSC Training Course
What Affects the Glass Transition?
� Heating Rate
� Heating & Cooling
� Aging
� Molecular Weight
� Plasticizer
� Filler
� Crystalline Content
� Copolymers
� Side Chains
� Polymer Backbone
� Hydrogen Bonding
Anything that effects the
mobility of the molecules,
affects the Heat Capacity and,
in turn, the Glass Transition

125
DSC Training Course
Suggestions for Finding Weak Tg’s
� Know your empty-pan baseline
� Get as much material in the amorphous state
� Cool rapidly to reduce or eliminate crystallization
� Use MDSC®
� Or use Quasi-Isothermal MDSC
DSC Training Course
Effect of Heating Rate on the Tg
10.04mg PMMA

126
DSC Training Course
Effect of Heating Rate on the Tg
Heating Rate
(°C/min)
Heat Flow @
80°C
Tg
Onset (°C)
Tg
Midpoint (°C)
½ Width of
Tg (°C)
2.5 -0.84 95.9 100.9 5.0
5.0 -1.66 96.0 102.0 6.0
10.0 -3.31 96.3 102.8 6.5
20.0 -6.62 98.3 105.1 6.8
DSC Training Course
Glass Transition Summary
� The glass transition is due to Amorphous material
� The glass transition is the reversible change from a glassy to rubbery state & vice-versa
� DSC detects glass transitions by a step change in Cp

127
DSC Training Course
Melting
� In a DSC, a melt peak shows up as an endotherm during the conversion of Crystalline structure to Amorphous structure
� If a material is 100% Amorphous, we will not see a melting peak by DSC
� We integrate this endothermic peak, on a time basis to determine the Heat of Fusion
DSC Training Course
Melting of Indium
157.01°C
156.60°C28.50J/g
Indium5.7mg10°C/min
-25
-20
-15
-10
-5
0
Heat Flow (mW)
150 155 160 165
Temperature (°C)Exo Up Universal V4.0B TA Instruments
Peak Temperature
Extrapolated
Onset
Temperature
Heat of
Fusion
For pure, low molecular
weight materials
(mw<500 g/mol) use
Extrapolated Onset as
Melting Temperature

128
DSC Training Course
Melting of PET
249.70°C
236.15°C52.19J/g
PET6.79mg10°C/min
-7
-6
-5
-4
-3
-2
-1
Heat Flow (mW)
200 210 220 230 240 250 260 270
Temperature (°C)Exo Up Universal V4.0B TA Instruments
Extrapolated
Onset
Temperature
Peak Temperature
Heat of
Fusion
For polymers, use Peak as Melting Temperature
DSC Training Course
Comparison of Melting
249.70°C
236.15°C52.19J/g
157.01°C
156.60°C28.50J/g
Indium5.7mg10°C/min
PET6.79mg10°C/min
-25
-20
-15
-10
-5
0
Heat Flow (mW)
140 160 180 200 220 240 260 280
Temperature (°C)Exo Up Universal V4.0B TA Instruments

129
DSC Training Course
Analyzing/Interpreting Results
� It is often difficult to select limits for integrating melting peaks
� Integration should occur between two points on the heat capacity baseline
� Heat capacity baselines for difficult samples can usually be determined by MDSC® or by comparing experiments performed at different heating rates
� Sharp melting peaks that have a large shift in the heat capacitybaseline can be integrated with a sigmoidal baseline
DSC Training Course
Baseline Due to Cp

130
DSC Training Course
Baseline Type
DSC Training Course
DSC of Polymer Blend
Where is the
Cp baseline?

131
DSC Training Course
DSC of Polymer Blend
Where is the
Cp baseline?
Is it here?
DSC Training Course
DSC of Polymer Blend
Where is the
Cp baseline?
Is it here?

132
DSC Training Course
MDSC® Aids Interpretation
Xenoy 13.44 mg
MDSC Heat-Only
DSC Training Course
Is this Melting?
Phenacetin
Hermetic Pan
Approx 1.5mg
Onset of melting shifts by 0.3C
over heating rate range of 1-
20°C/min for sample that has a
true melt

133
DSC Training Course
Is this Melting?
Onset differs by
almost 30°C
DSC Training Course
Effect of Heating Rate on Melting
10°C/min
50°C/min
100°C/min
150°C/min
0
2
4
6
8
10
Heat Capacity (J/g/°C)
-40 0 40 80 120 160 200 240 280Temperature (°C)
Melt

134
DSC Training Course
Effect of Heating Rate on Polymorph
DSC at 1°C/min
DSC at 10°C/min
DSC at 50°C/min
DSC at 1°C/min
DSC Training Course
Effect of Impurities on MeltingEffect of p-Aminobenzoic Acid Impurity Concentration on the Melting
Shape/Temperature of Phenacetin
Approx. 1mg
Crimped Al Pans
2°C/min
NBS 1514
Thermal Analysis
Purity Set
Melting of
Eutectic Mixture
95.0% Pure
99.3% Pure
96.0% Pure
100% Pure

135
DSC Training Course
Van't Hoff Purity Calculation
�����������������
�
�
�
�
�
�
�
�
133.0
133.5
134.0
134.5
135.0
Temperature (°C
)
-2 0 2 4 6 8 10
Total Area / Partial Area
��
��
�
��
�
��
��
�
��
��
�
�
�
��
�
�
�
�����
���
��
��
�
��
��
�
�
�
��
�
�
�
125.20°C137.75°C
Purity: 99.53mol %Melting Point: 134.92°C (determined)Depression: 0.25°CDelta H: 26.55kJ/mol (corrected)Correction: 9.381%Molecular Weight: 179.2g/molCell Constant: 0.9770Onset Slope: -10.14mW/°CRMS Deviation: 0.01°C
-2.2
-2.0
-1.8
-1.6
-1.4
-1.2
-1.0
-0.8
Heat Flow (W/g)
122 124 126 128 130 132 134 136 138
Temperature (°C)Exo Up
DSC Training Course
Calculation of % Crystallinity
� Sample must be pure material, not copolymer or filled
� Must know enthalpy of melting for 100% crystalline
material (∆Hlit)
� You can use a standard ∆Hlit for relative crystallinity
For standard samples:
% crystallinity = 100* ∆∆∆∆Hm / ∆∆∆∆Hlit
For samples with cold crystallization:
% crystallinity = 100* (∆∆∆∆Hm - ∆∆∆∆Hc)/ ∆∆∆∆Hlit

136
DSC Training Course
ATHAS Databank
The ATHAS Databank is
a source for the ∆∆∆∆Hf for
common polymers
DSC Training Course
ATHAS Summary Page for PET
∆∆∆∆Hf in kJ/mol

137
DSC Training Course
PET Data from ATHAS
Calculate g/mole from
molecular structure which
equals 192 g/mole for PET
DSC Training Course
ATHAS Summary Page for PET
∆∆∆∆Hf in kJ/mol
gJmolg
molkJ/1401000
/192
/9.26=×

138
DSC Training Course
PET – Initial Crystallinity
78.99°C(I)
75.43°C
80.62°C
134.62°C
127.72°C53.39J/g
256.24°C
242.91°C74.71J/g
-1.5
-1.0
-0.5
0.0
0.5
1.0Heat Flow (W/g)
50 100 150 200 250 300
Temperature (°C)
32.2139.5371.74 =−
39.5371.74ityCrystallin Initial −=
DSC Training Course
PET
78.99°C(I)
75.43°C
80.62°C
134.62°C
127.72°C53.39J/g
256.24°C
242.91°C74.71J/g
-1.5
-1.0
-0.5
0.0
0.5
1.0
Heat Flow (W/g)
50 100 150 200 250 300
Temperature (°C)
% crystallinity = 100* (∆∆∆∆Hm - ∆∆∆∆Hc)/ ∆∆∆∆Hlit
( )%15
140
39.5371.74100 =
−×

139
DSC Training Course
PET % Crystallinity
� 21J/g Initial Crystallinity or 15% Crystalline
� Does that sound right?
DSC Training Course
PET % Crystallinity
� 21J/g Initial Crystallinity or 15% Crystalline
� Does that sound right?
� The sample is quenched cooled PET
� We know that quenched cooled PET is 100% amorphous
� Why does DSC give us the wrong answer?

140
DSC Training Course
Change in Crystallinity While Heating
105.00°C275.00°C
134.63°C
127.68°C0.6877J/g 230.06°C
230.06°C71.96J/g
0
20
40
60
Integral (J/g)
-1.5
-1.0
-0.5
0.0
0.5
1.0Heat Flow (W/g)
-50 0 50 100 150 200 250 300 350
Temperature (°C)Exo Up Universal V4.0B TA Instruments
Quenched PET
9.56mg
10°C/min
DSC Training Course
Crystallization
� Crystallization is a kinetic process which can be studied either while cooling or isothermally
� Differences in crystallization temperature or time (at a specific temperature) between samples can affect end-use properties as well as processing conditions
� Isothermal crystallization is the most sensitive way to identify differences in crystallization rates

141
DSC Training Course
Crystallization
� Crystallization is a two step process:
� Nucleation
� Growth
� The onset temperature is the nucleation (Tn)
� The peak maximum is the crystallization temperature (Tc)
DSC Training Course
Crystallization
� A temperature shift is seen in the cooling data on the next slide. In this example, the samples were cooled from 285°C to room temperature at 2 to 16°C/min. The higher rates of temperature change broaden the crystallization process and shift it further in temperature from the starting point.

142
DSC Training Course
Effect of Cooling Rate on Crystallization
Sample: PET
Weight: 10.66mg
DSC Training Course
0.0
0.5
1.0
1.5
2.0
Heat Flow (W/g)
40 50 60 70 80 90 100 110 120 130 140 150 160
Temperature (°C)Exo Up
POLYPROPYLENE
WITH NUCLEATING
AGENTS
POLYPROPYLENE
WITHOUT
NUCLEATING AGENTS
-1.5
-1.0
-0.5
0.0
Heat Flow (W/g)
60 80 100 120 140 160 180 200
Temperature (°C)Exo Up
crystallization
melting
Effect of Nucleating Agents

143
DSC Training Course
What is Isothermal Crystallization?
• A Time-To-Event Experiment
Annealing Temperature
Melt Temperature
Isothermal Crystallization
Temperature
Temperature
Time
Zero Time
DSC Training Course
Isothermal Crystallization
117.4 oC
117.8 oC
118.3 oC
118.8 oC
119.3 oC
119.8 oC120.3 oC
0
1
2
3
4
5
Heat Flow (mW)
-1 1 3 5 7 9
Time (min)
Polypropylene

144
DSC Training Course
Supercooling of Water
-30 -25 -20 -15 -10 -5 0 5 10
-50
0
50
100
150
200
250
Temperature (°C)
Heat Flow (mW)
+-4.36°C
-15.55°C
+