Differential Response of Microglia to Receptor Activation.
31
Differential Response of Microglia to Receptor Activation
-
Upload
samantha-hensley -
Category
Documents
-
view
222 -
download
1
Transcript of Differential Response of Microglia to Receptor Activation.

Differential Response of Microglia to
Receptor Activation

RESTING
(Hanisch and Kettenmann, 2007)
Multiple processes sample surrounding areaSecrete IL-10 (Langmann 2007)
MigrationProliferationPhagocytosisSecretion of cytokines/chemokines
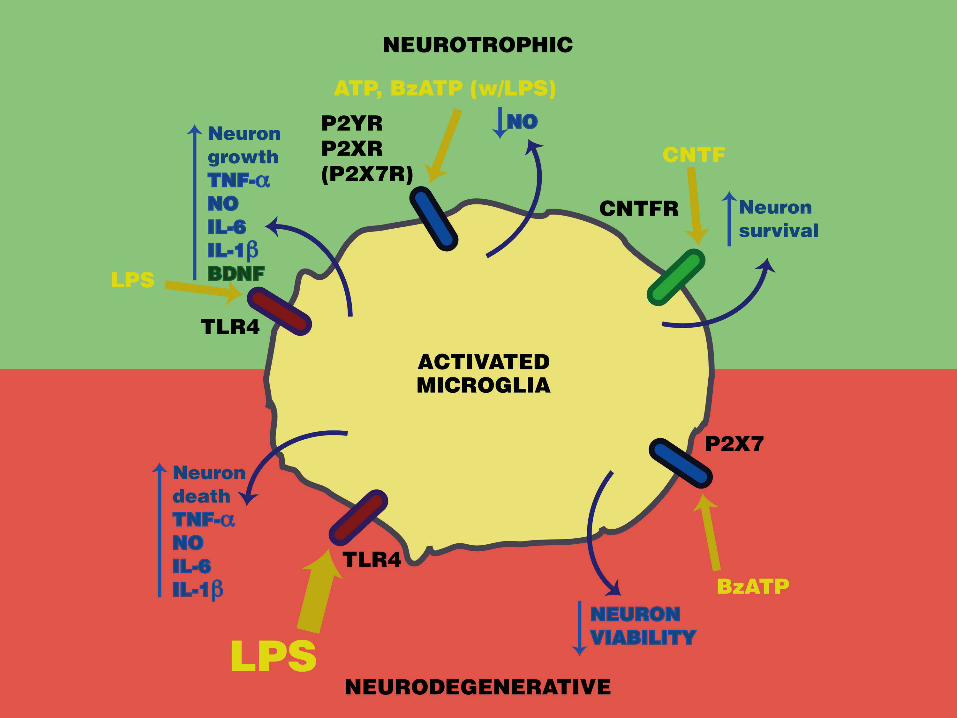
ACTIVATED
May return to resting state after activationLinked to neuron clearing during neural development (Block and Hong, 2005)

(Neumann et al, 2008-2)

Intracellular
Extracellular
Cytoplasmic membrane
PeptidoglycanTLR2
Dr. Porter, MICR 450 lecture, 2008
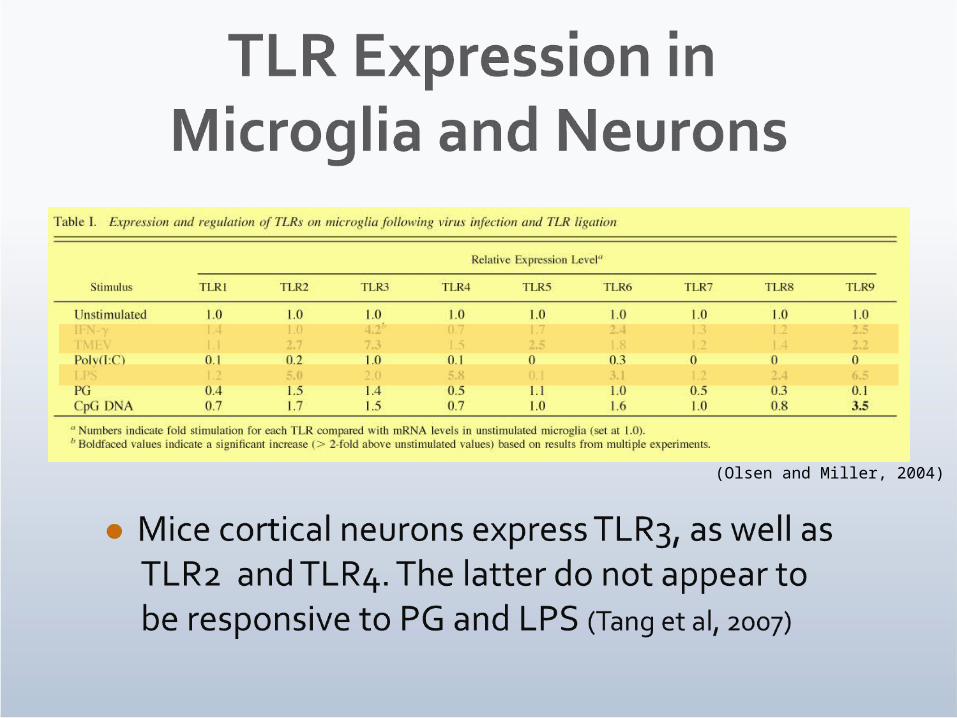
(Olsen and Miller, 2004)

Ligand Receptor Source Reference
Gangliosides TLR4 cell wall Jou et al, 2006
ATP, ADP Purinergic - P2X, P2y
cells Brautigam et al, 2006
HMGB1 RAGE nonhistone DNA-binding protein
Kim et al, 2006
S100B RAGE calcium binding protein
Bianchi et al, 2007
15d-PGJ2 PPAR prostaglandin
Gurley et al 2007

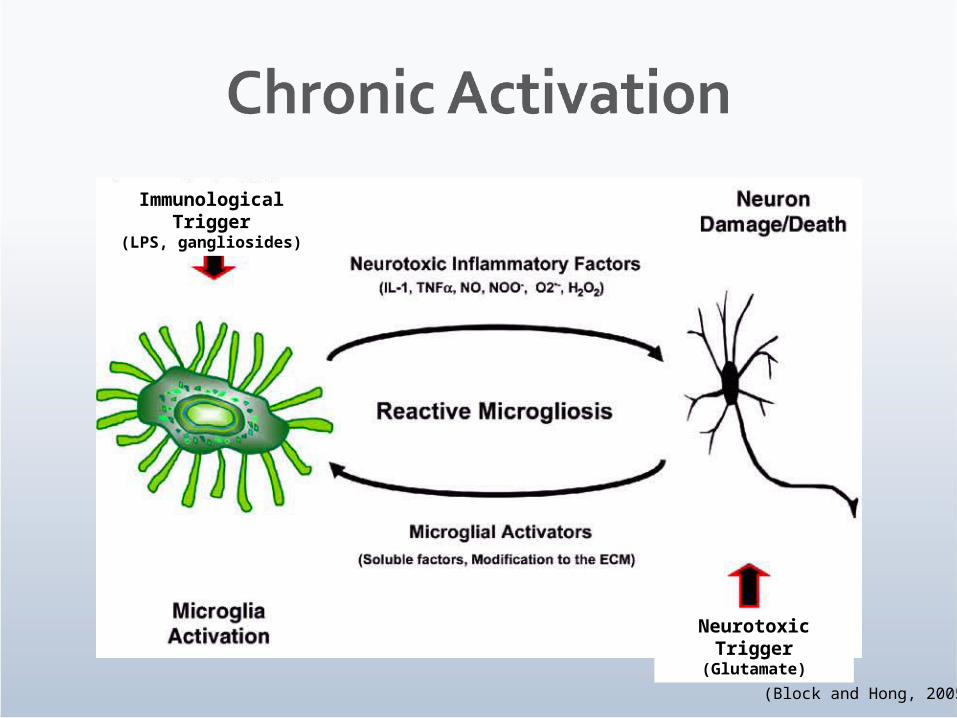
(Block and Hong, 2005)
Immunological Trigger
(LPS, gangliosides)
Neurotoxic Trigger
(Glutamate)

(Block and Hong, 2005)
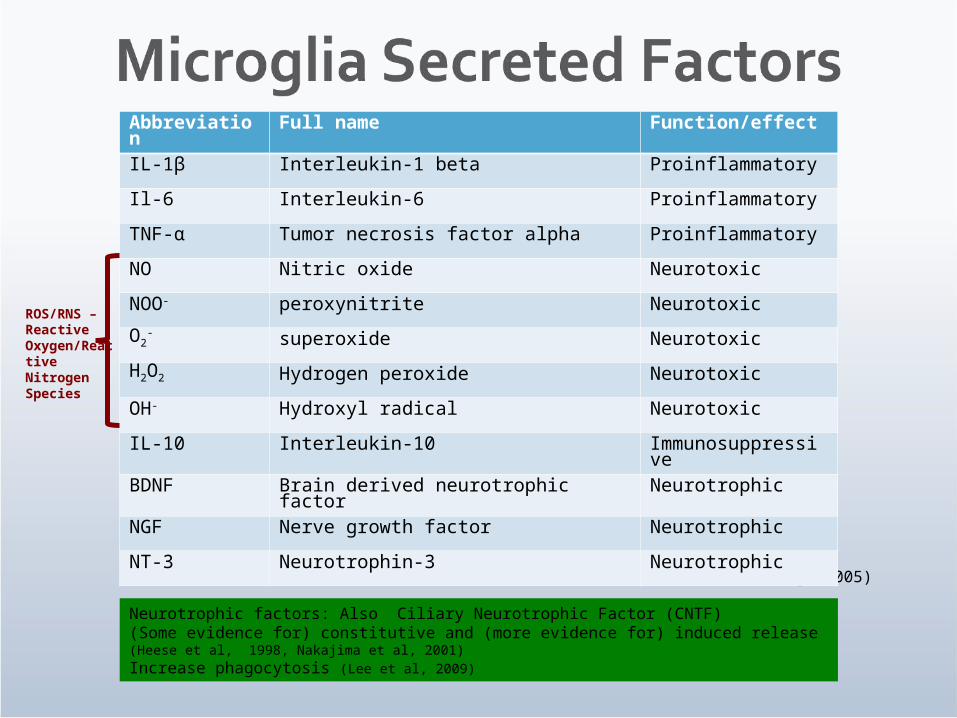
Neurotrophic factors: Also Ciliary Neurotrophic Factor (CNTF)(Some evidence for) constitutive and (more evidence for) induced release (Heese et al, 1998, Nakajima et al, 2001)Increase phagocytosis (Lee et al, 2009)
Abbreviation
Full name Function/effect
IL-1β Interleukin-1 beta Proinflammatory
Il-6 Interleukin-6 Proinflammatory
TNF-α Tumor necrosis factor alpha Proinflammatory
NO Nitric oxide Neurotoxic
NOO- peroxynitrite Neurotoxic
O2- superoxide Neurotoxic
H2O2 Hydrogen peroxide Neurotoxic
OH- Hydroxyl radical Neurotoxic
IL-10 Interleukin-10 Immunosuppressive
BDNF Brain derived neurotrophic factor Neurotrophic
NGF Nerve growth factor Neurotrophic
NT-3 Neurotrophin-3 Neurotrophic
ROS/RNS – Reactive Oxygen/Reactive Nitrogen Species


(Jack et al, 2005)
TLR4TLR3 TLR2
PIC - Poly(inosinic acid):poly(cytidylic acid); PAM - palmitoyl-3-cysteine-serine-lysine-4.ALL FIGURES: Human microglia cell cultures treated for 24 hours with ligands, supernatants tested for cytokines with ELISA. n=3, +/-SEM.
Ab-TLR4 Ab-TLR4
Ab-TLR2
Ab-TLR3
Cell cultures pre-incubated 20 minutes with Ab before ligand treatment. NOTE: TLR3 is predominantly intracellular in microglia (results not shown).

NO Nitrite Nitrate +
Nitrate Nitrite
Nitrate reductase
Nitrite 1% sulphanilamide0.1% N-(1-naphthyl) ethylenediamine-HCl
+
Read absorbance at 540, 570nm, compare to standard curve of sodium nitrite
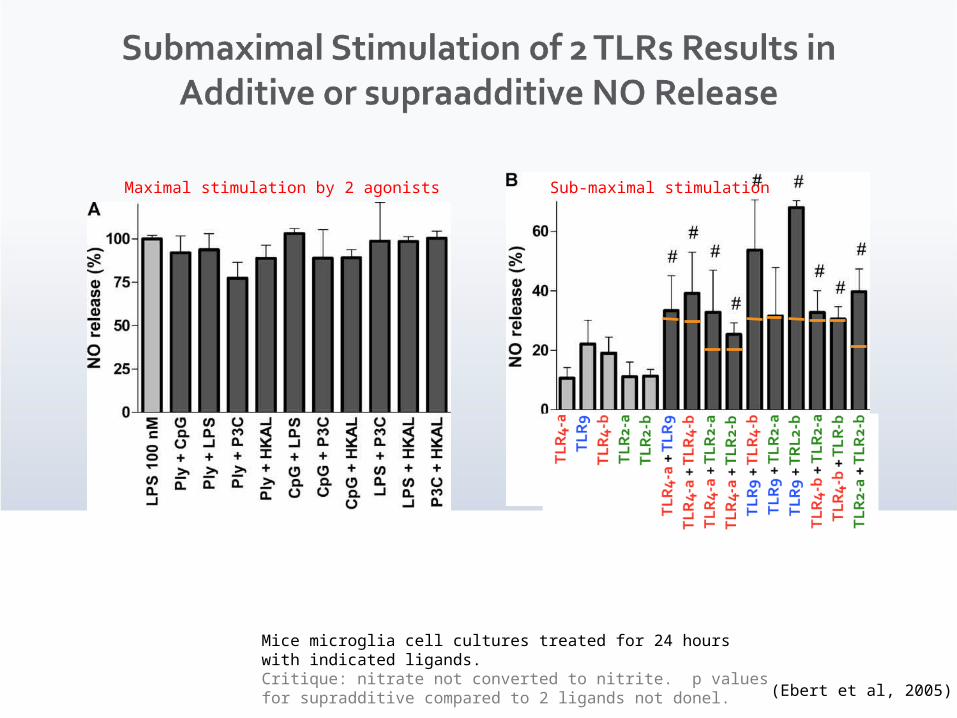
Treatment with 2 ligands, each at 10-30% of individual concentration needed to induce maxium NO release. n=4, +/- STDEV (n=3 for measurements with HKAL)
Sub-maximal stimulation
Treatment with 2 ligands, each at 100% of individual concentration needed to induce maxium NO release. n=6, +/- STDEV
Mice microglia cell cultures treated for 24 hours with indicated ligands.Critique: nitrate not converted to nitrite. p values for supradditive compared to 2 ligands not donel. (Ebert et al, 2005)
Maximal stimulation by 2 agonists
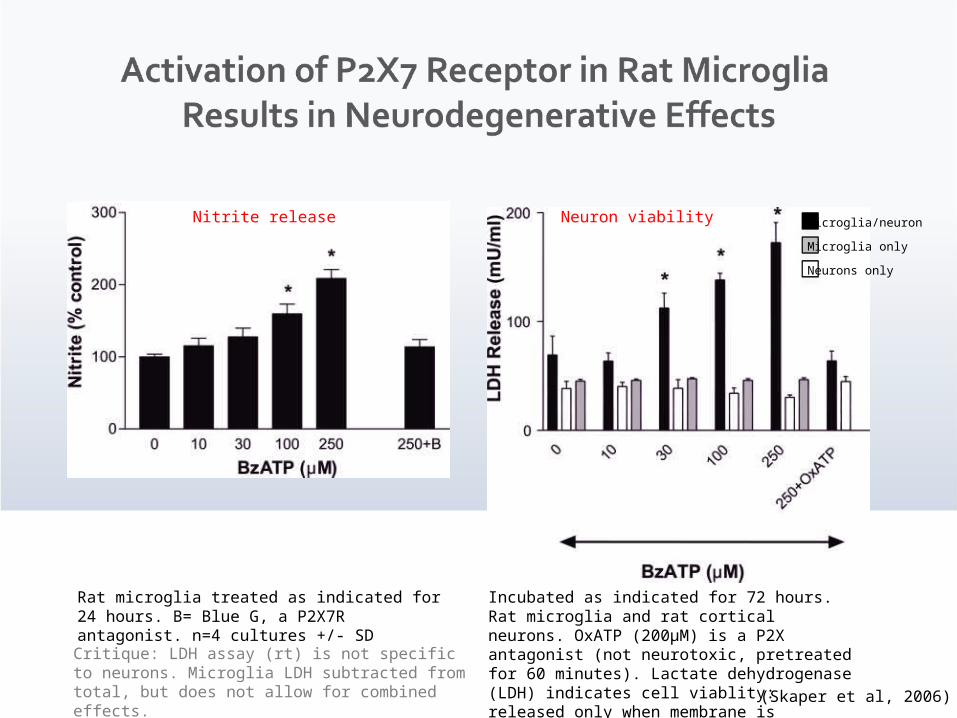
(Skaper et al, 2006)
Rat microglia treated as indicated for 24 hours. B= Blue G, a P2X7R antagonist. n=4 cultures +/- SD
Nitrite release
Critique: LDH assay (rt) is not specific to neurons. Microglia LDH subtracted from total, but does not allow for combined effects.
Incubated as indicated for 72 hours. Rat microglia and rat cortical neurons. OxATP (200μM) is a P2X antagonist (not neurotoxic, pretreated for 60 minutes). Lactate dehydrogenase (LDH) indicates cell viablity: released only when membrane is disrupted. (n=3 exp, 3 cultures each, +/- SD)
Microglia/neuron
Microglia only
Neurons only
Neuron viability

Left: BV-2 cells exposed to indicated LPS concentrations. Cytokines quantified by ELISA. Above: NSC34 (murine motor neuron) cells treated with LPS stimulated BV2 culture media. NSC34 cells incubated for 36 hours with LPS-BV2 culture media. Viability determined by MTS assay.Critique: LPS-BVCM incubation time prior to supernatant collection and application to neurons not furnished.
(Li et al, 2007)
Time course of varying [LPS]-induced cytokine release Viability of murine motor neurons
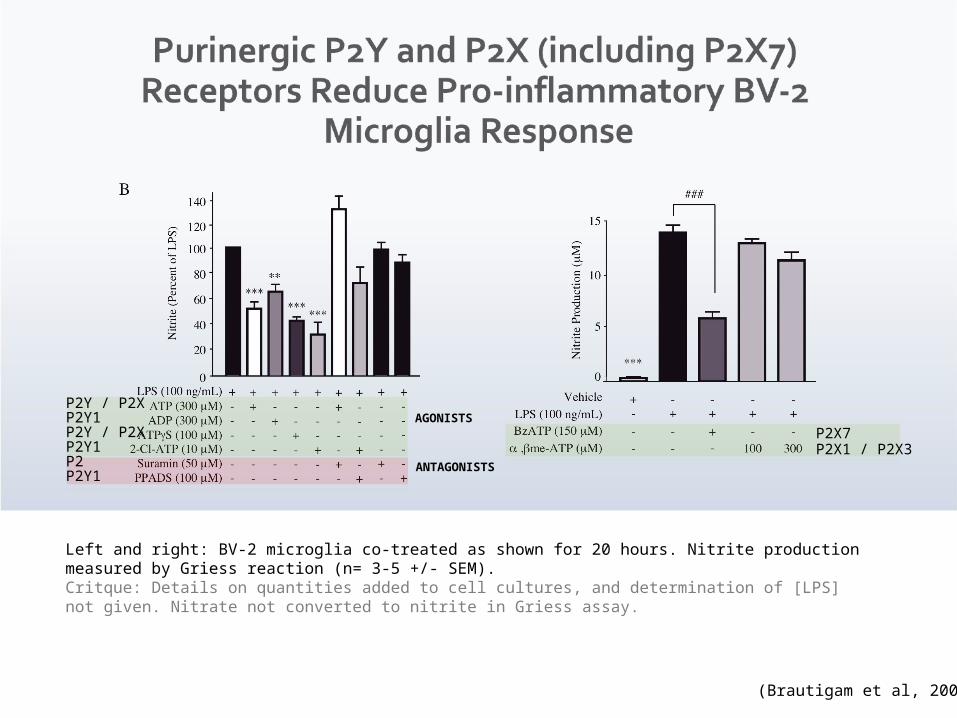
Left and right: BV-2 microglia co-treated as shown for 20 hours. Nitrite production measured by Griess reaction (n= 3-5 +/- SEM).Critque: Details on quantities added to cell cultures, and determination of [LPS] not given. Nitrate not converted to nitrite in Griess assay.
(Brautigam et al, 2005)
P2Y / P2XP2Y1P2Y / P2XP2Y1P2P2Y1
ANTAGONISTS
AGONISTSP2X7P2X1 / P2X3
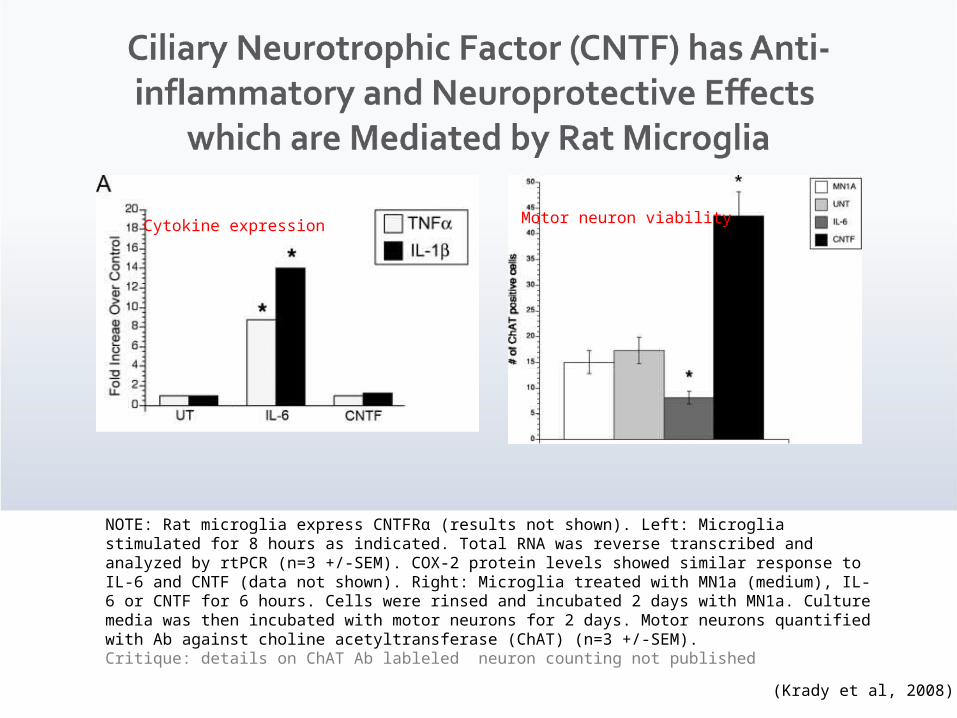
NOTE: Rat microglia express CNTFRα (results not shown). Left: Microglia stimulated for 8 hours as indicated. Total RNA was reverse transcribed and analyzed by rtPCR (n=3 +/-SEM). COX-2 protein levels showed similar response to IL-6 and CNTF (data not shown). Right: Microglia treated with MN1a (medium), IL-6 or CNTF for 6 hours. Cells were rinsed and incubated 2 days with MN1a. Culture media was then incubated with motor neurons for 2 days. Motor neurons quantified with Ab against choline acetyltransferase (ChAT) (n=3 +/-SEM).Critique: details on ChAT Ab lableled neuron counting not published
(Krady et al, 2008)
Motor neuron viabilityCytokine expression

Left: Rat neutrophils and rat primary microglia added simultaneously to rat organotypic hippocampal slice cultures (OHC) after oxygen– glucose deprivation (OGD) (n=9, +/-SEM). RAW 264.7 = mourse macrophage line. Cell death measured by propidium iodide (PI) incorporation into damaged cells (red fluorescent signal).Critque: PI not specific for neurons
(Neumann et al, 2008)

Left: primary rat microglia were incubated for 6 hours with LPS as indicated. Neurotrophin secretion measured by Western blot. n=3, representative blot shown. Above: NO and TNFα are secreted similarily to BDNF. Above: BDNF and TNF-α measured by Western blot. NO measured by exclusive NO analyzer. Values normalized to 6 hours. n=3 +/- SD Also found that BDNF and NGF are secreted constitutively (not shown). BDNF secretion linked to PKC pathway.Critique: graph of actual values in table 1 may have provided more information (relative amounts of release).
(Nakajimai et al, 2001)


Authors Finding used Support critique
Jack et al, 2005 Activation of TLR 2, 3 & 4 induces pro-inflammatory cytokine response in microglia
Partial support (1)
none
Ebert et al, 2005
Submaximal stimulation of 2 TLRs results in additive or supraadditive NO release
Partial support (1)
Nitrate not converted to nitrite. p value for supradditive
Skaper et al, 2006
Activation of P2X7 receptor in rat microglia results in neurodegenerative effects
Does not support (1)support(2)
LDH not specific to neurons.
Li et al, 2007 Microglia secreted factors may be neurotrophic or neurodegenerative depending on degree of LPS stimulation
Support (1,2)
Incubation time of LPS-BVCM not published
Brautigam et al, 2005
P2Y and P2X (including P2X7) receptors reduce pro-inflammatory BV-2 microglia response
Paritial support (1)
Method details mssing. Nitrate not converted to nitrite.
Krady et al, 2008
Ciliary neurotrophic factor (CNTF) has anti-inflammatory and neuroprotective effects which are mediated by rat microglia
Support (1,2)
ChAT Ab labeled neurons counting details not published
Neumann et al, 2008
Rat Primary Microglia Have Neuroprotective Effects Against Neutrophils
Support (2) PI assay is not specific for neurons – relies on prior results w/o PMNs
Nakajimai et al, 2001
LPS induces release of neurotrophins in primary rat microglia
Does not support (1)
Present table as figure

Do microglia have a phenotypically distinct neuroprotective activation state, as measured by
cell surface receptor expression?
2) Check for presence of cell surface receptors (flow cytometry)3) Measure secreted factors
4) Incubate neurons w/ culture media
5) Measure neuron survival
1) Differentially activate microglia
ControlNo activation
NeurodegenerativeHigh [LPS]
NeuroprotectiveCNTF &/or low [LPS]
Known activation markers: CD11b (const.), CD45, MHC1, MHC2, B7-1, B7-2, CD40, ICAM1, Fcγ (Olsen & Miller 2004, Kim and De Vellis, 2005)Receptors linked to anti-inflammatory phagocytosis: TREM-2, PS-R (Neumann et al, 2008-2)
TNF-α, IL-1β, IL-6, IL-10, BDNF, NO(Western blot, ELISA, rtPCR, Griess Assay)
36 – 48 hours(Li et al, 2007, Krady et al 2008)
MTS assay, PI incorporation(Li et al, 2007, Neuman et al, 2008)