Differential effect of liver cirrhosis on the PXR-mediated...
44
DMD #58511 1 Differential effect of liver cirrhosis on the PXR-mediated induction of cytochromes P450 3A1 and 3A2 in the rat. Sara De Martin, Daniela Gabbia, Giovanna Albertin, Maria Martina Sfriso, Claudia Mescoli, Laura Albertoni, Giovanna Paliuri, Sergio Bova, Pietro Palatini. Affiliations Department of Pharmaceutical and Pharmacological Sciences (S.D.M., D.G., G.P., S.B., P.P), Department of Molecular Medicine, Section of Anatomy (G.A., M.M.S.), Department of Medicine, Surgical Pathology & Cytopathology Unit (C.M., L.A.), University of Padova, Padova, Italy. This article has not been copyedited and formatted. The final version may differ from this version. DMD Fast Forward. Published on July 16, 2014 as DOI: 10.1124/dmd.114.058511 at ASPET Journals on December 24, 2019 dmd.aspetjournals.org Downloaded from
Transcript of Differential effect of liver cirrhosis on the PXR-mediated...

DMD #58511
1
Differential effect of liver cirrhosis on the PXR-mediated induction of
cytochromes P450 3A1 and 3A2 in the rat.
Sara De Martin, Daniela Gabbia, Giovanna Albertin, Maria Martina Sfriso, Claudia Mescoli,
Laura Albertoni, Giovanna Paliuri, Sergio Bova, Pietro Palatini.
Affiliations
Department of Pharmaceutical and Pharmacological Sciences (S.D.M., D.G., G.P., S.B., P.P),
Department of Molecular Medicine, Section of Anatomy (G.A., M.M.S.),
Department of Medicine, Surgical Pathology & Cytopathology Unit (C.M., L.A.),
University of Padova, Padova, Italy.
This article has not been copyedited and formatted. The final version may differ from this version.DMD Fast Forward. Published on July 16, 2014 as DOI: 10.1124/dmd.114.058511
at ASPE
T Journals on D
ecember 24, 2019
dmd.aspetjournals.org
Dow
nloaded from

DMD #58511
2
Running Title: Effect of cirrhosis on CYP3A1 and CYP3A2 induction in rats
Corresponding author:
Prof. Pietro Palatini, Department of Pharmaceutical and Pharmacological Sciences, University
of Padova, Largo Meneghetti 2, 35131 Padova, Italy;
Telephone: +39 049 827 5077; Fax: +39 049 827 5093. E-mail: [email protected]
Number of text pages: 32
Number of tables: 3
Number of figures: 7
Number of references: 54
Number of words in the Abstract: 242
Number of words in the Introduction: 736
Number of words in the Discussion: 1489
Abbreviations: DEX, dexamethasone; PXR, Pregnane X Receptor; CYP, Cytochrome P450;
AhR, Aryl Hydrocarbon Receptor; GR, glucocorticoid receptor; CCl4, carbon tetrachloride;
DMSO, Dimethylsulfoxide; SDS-PAGE, sodium dodecylsulfate polyacrylamide gel
electrophoresis; TST, testosterone; ALT, alanine aminotransferase; AST, aspartate
aminotransferase.
This article has not been copyedited and formatted. The final version may differ from this version.DMD Fast Forward. Published on July 16, 2014 as DOI: 10.1124/dmd.114.058511
at ASPE
T Journals on D
ecember 24, 2019
dmd.aspetjournals.org
Dow
nloaded from

DMD #58511
3
Abstract
Conflicting results have been obtained by clinical studies investigating the effect of liver
cirrhosis on enzyme induction. Since ethical concerns do not consent methodologically
rigorous studies in humans, we addressed this question by examining the effect of the
prototypical inducer dexamethasone (DEX) on the Pregnane X receptor (PXR)-mediated
induction of cytochromes P450 (CYPs) 3A1 and 3A2 in a validated animal model of liver
cirrhosis obtained by exposure of rats to carbon tetrachloride. For this purpose, we assessed
mRNA levels, protein expressions and enzymatic activities of both CYP3A enzymes, as well
as mRNA and protein expressions of PXR in rat populations rigorously stratified according to
the severity of liver insufficiency. Constitutive mRNA and protein expressions of CYP3A1
and CYP3A2, and their basal enzyme activities were not affected by liver dysfunction. DEX
treatment markedly increased steady-state mRNA level, protein content and enzymatic
activity of CYP3A1 in healthy and cirrhotic rats, irrespective of the degree of liver
dysfunction. On the contrary, the inducing effect of DEX on gene and protein expressions and
enzyme activity of CYP3A2 was preserved in moderate liver insufficiency, whereas was
greatly curtailed when liver insufficiency became severe. mRNA and protein expressions of
PXR were neither reduced by liver dysfunction nor increased by DEX treatment. These
results indicate that even the inducibility of CYP isoforms under the transcriptional control of
the same nuclear receptor may be differentially affected by cirrhosis and may partly explain
why conflicting results were obtained by human studies.
This article has not been copyedited and formatted. The final version may differ from this version.DMD Fast Forward. Published on July 16, 2014 as DOI: 10.1124/dmd.114.058511
at ASPE
T Journals on D
ecember 24, 2019
dmd.aspetjournals.org
Dow
nloaded from

DMD #58511
4
Introduction
Metabolic interactions, i.e. inhibition and induction of drug-metabolizing enzymes, especially
those of the cytochrome P450 (CYP) superfamily, are the main cause of serious drug-drug
interactions encountered in clinical practice (Lin and Lu, 1998). Although inhibition-mediated
drug interactions are generally considered more dangerous than those due to induction
(Bachmann and Lewis, 2005), serious or even fatal consequences of CYP induction have been
reported, such as transplant rejection and exacerbation of liver failure caused by
acetaminophen overdose (Park et al., 1996; Fuhr, 2000).
In principle, drug interactions can be managed by dose adjustment. However, the wide
interindividual variability in the magnitude of metabolic drug interactions makes this task
difficult. Identification of the factors responsible for this variability is therefore crucial for an
appropriate dose adjustment in clinical practice. The influence of liver functional status on the
magnitude of metabolic interactions has long been investigated. However, whereas it has been
clearly established that liver dysfunction markedly decreases the magnitude of inhibitory drug
interactions (Orlando et al., 2004; Orlando et al., 2006; Orlando et al., 2009; Palatini et al.,
2010), the effect of liver insufficiency on the inducibility of drug-metabolizing enzymes is
still a controversial matter. It has been pointed out that two main factors are probably
responsible for the conflicting results obtained by studies on human beings (Hoyumpa and
Schenker, 1982; Palatini et al., 2008): 1) the variable nature and degree of hepatic dysfunction
in the clinical studies thus far performed; 2) the possible differential susceptibility to liver
insufficiency of the diverse types of inducing effects examined, which are mediated by
different mechanisms.
Early animal studies (Marshall and McLean, 1969; Farrell and Zaluzny, 1984; Wu et al.,
1991) found no cirrhosis-associated modification of the degree of induction of CYP-mediated
This article has not been copyedited and formatted. The final version may differ from this version.DMD Fast Forward. Published on July 16, 2014 as DOI: 10.1124/dmd.114.058511
at ASPE
T Journals on D
ecember 24, 2019
dmd.aspetjournals.org
Dow
nloaded from

DMD #58511
5
metabolic reactions. However, they examined rats with essentially mild liver cirrhosis, which
generally causes minor alterations in the regulation of drug metabolism (Palatini et al., 2008).
Thus, they left unanswered the question of whether inducibility may be compromised in
severe liver insufficiency.
Since ethical constraints do not consent methodologically rigorous studies in human beings,
we recently tried to clarify this question by investigating the Aryl hydrocarbon Receptor
(AhR)-mediated induction of CYP1A1 and CYP1A2 in rats with experimentally induced
cirrhosis, rigorously stratified according to the severity of liver dysfunction (Floreani et al.,
2013). That study showed that the inducibility of CYP1A enzymes is strictly related to the
degree of liver impairment, as it is essentially preserved in the compensated state of cirrhosis,
whereas it becomes severely curtailed when decompensation occurs. However, these results
cannot a priori be extended to the induction of other CYP isoforms, since different nuclear
receptors are involved in the transcription of their CYP genes.
The aim of the present study was to assess the influence of liver dysfunction on the Pregnane
X Receptor (PXR)-mediated induction of CYP3A enzymes, the CYP subfamily most
abundantly expressed in the liver (Shimada et al., 1994), by dexamethasone (DEX), which is
the most effective inducer of rat CYP3A enzymes (Ghosal et al., 1996). For this purpose, we
evaluated the effect of DEX on control and cirrhotic rats obtained by exposure to carbon
tetrachloride (CCl4), which produces animals with compensated or decompesated cirrhosis
depending on the length of treatment (Floreani et al., 2013).
Although 4 CYP3A enzymes are expressed in rat liver (Mahnke et al., 1997), CYP3A2 and
CYP3A1 are regarded as the most metabolically relevant isoforms in male rats; the former,
which is male specific, is the isoform expressed at the highest constitutive level, the latter is
the isoform most susceptible to induction (Ghosal et al., 1996; Jan et al., 2006). Therefore, we
This article has not been copyedited and formatted. The final version may differ from this version.DMD Fast Forward. Published on July 16, 2014 as DOI: 10.1124/dmd.114.058511
at ASPE
T Journals on D
ecember 24, 2019
dmd.aspetjournals.org
Dow
nloaded from
DMD #58511
6
studied the inducing effect of DEX on these two CYP3A enzymes by means of the three
techniques previously used for the assessment of the AhR-mediated CYP1A induction: 1)
determination of CYP3A1 and CYP3A2 mRNA steady-state levels by quantitative real-time
reverse transcription-polymerase chain reaction (Real-Time PCR); b) measurement of the
protein expressions of CYP3A enzymes by means of Western Blot analysis; c) determination
of the kinetic parameters of CYP3A1 and CYP3A2 enzyme reactions by means of kinetic
analysis of testosterone (TST) 6β-hydroxylase activity. Since in vitro experiments (Pascussi et
al., 2000; Huss and Kasper, 2000) have shown that PXR-mediated induction of CYP3A
enzymes by DEX is partly due to a positive regulation of PXR expression by the
glucocorticoid receptor (GR), we also assessed the effects of cirrhosis and DEX on the
mRNA and protein expressions of these two nuclear receptors.
Materials and Methods
Reagents.
NADPH was purchased from Santa Cruz Biotechnology, Inc. (Santa Cruz, CA, USA).
Dimethylsulfoxide (DMSO), 40% acrylamide solution, sodium dodecyl sulfate (SDS), and
Tween 20 were purchased from Sigma-Aldrich Italy (Milan, Italy). Phenobarbital was
obtained from Bracco S.p.A. (Milan, Italy). Acetonitrile (HPLC grade) was from Carlo Erba
Reagenti (Milan, Italy). Ultrapure water was obtained by means of a Pure-Lab Option Q
apparatus (Elga Lab Water, High Wycombe, UK).
Microsomes prepared from baculovirus-infected insect cells expressing rat CYP3A1 or
CYP3A2 (SupersomesTM) were purchased from BD Gentest (Woburn, MA, USA). The
expression levels of CYP3A1 and CYP3A2 were provided by the manufacturer’s data sheets.
This article has not been copyedited and formatted. The final version may differ from this version.DMD Fast Forward. Published on July 16, 2014 as DOI: 10.1124/dmd.114.058511
at ASPE
T Journals on D
ecember 24, 2019
dmd.aspetjournals.org
Dow
nloaded from

DMD #58511
7
Rabbit polyclonal anti-CYP3A1 antibody, sheep polyclonal anti-CYP3A2 antibody, mouse
polyclonal anti-PXR and anti-GR antibodies and rabbit anti-mouse IgG, used as secondary
antibody, were obtained from Abcam (Cambridge, UK); goat anti-rabbit and rabbit anti-sheep
IgG, also used as secondary antibodies, were obtained from Millipore (Billerica, MA, USA).
Mouse monoclonal anti-β-actin antibody was purchased from Santa Cruz Biotechnology, Inc.
(Santa Cruz, CA, USA).
Animals and treatments.
The procedures involving animals and their care were in conformity with institutional
guidelines that comply with national and international laws and policies (European Economic
Community Council Directive 86/609,OJ L 358, 1, Dec.12, 1987; NIH Guide for the Care and
Use of Laboratory Animals, NIH Publication no. 85-23, 1985). The study design was
approved by the Ethics Committee of the University of Padova for the care and use of
laboratory animals (Prot. no. 18758 – March 26, 2010).
Study design
The investigation was performed on male Wistar rats according to the experimental protocol
shown in Fig. 1, which was previously described in detail (Floreani et al., 2013). Briefly,
cirrhosis was induced by exposing animals to CCl4 in an inhalation chamber twice a week,
following a method previously described (Jimenez et al., 1992). Exposure time increased
from 30 sec to 4 min during the first 5 weeks, and was then 5 min from the 6th week to the end
of the treatment. Phenobarbital (0.3 g/l) was added to the drinking water of rats, since it
greatly increases the formation rate of the reactive metabolites of CCl4 responsible for the
development of cirrhosis, thereby drastically reducing the cirrhosis induction time (Jimenez et
This article has not been copyedited and formatted. The final version may differ from this version.DMD Fast Forward. Published on July 16, 2014 as DOI: 10.1124/dmd.114.058511
at ASPE
T Journals on D
ecember 24, 2019
dmd.aspetjournals.org
Dow
nloaded from

DMD #58511
8
al., 1992; Rosa et al., 2010). After a 2-week washout period, which was shown to be
sufficient to allow full withdrawal of the inducing effect of phenobarbital on hepatic CYPs
(Marshall and McLean, 1969; Farrell and Zaluzny, 1984), healthy, non-ascitic and ascitic rats
were divided into two subgroups: induced and control rats. The former received 100 mg/kg
DEX dissolved in 3 ml of corn oil once daily for 3 consecutive days by the intraperitoneal
route; the latter received corn oil according to the same administration protocol. Treatment
with CCl4 was continued until 8 rats per group were obtained.
At the end of treatment, rats were weighed and sacrificed under sevoflurane anaesthesia (2.5%
per litre of oxygen) 24 hours after the last dose of DEX or corn oil. Blood was collected by
cardiac puncture for biochemical tests of liver function [alanine aminotransferase (ALT),
aspartate aminotransferase (AST), serum albumin and total bilirubin concentrations]. After
exsanguination, livers were rapidly removed and weighed, and a piece was excised for
histological examination. The liver was then rinsed in ice-cold 0.9% NaCl and a small piece
(less than 100 mg of hepatic tissue) was placed in an Eppendorf tube for Real-Time PCR
analysis. This sample and the remaining liver were quickly frozen and stored at -80°C until
used.
Histological evaluation.
Immediately after excision, a piece (3-4 g) of each liver was fixed in 4% neutral buffered
formalin for histological examination, as previously described (Floreani et al., 2013). Images
were obtained by means of a Leica SCN400 slide scanner. In order to evaluate the degree of
the CCl4-induced liver damage, the Ishak scoring system was adopted, which scores livers
from 0 to 6 according to the severity of cirrhotic alterations (Ishak et al., 1995).
This article has not been copyedited and formatted. The final version may differ from this version.DMD Fast Forward. Published on July 16, 2014 as DOI: 10.1124/dmd.114.058511
at ASPE
T Journals on D
ecember 24, 2019
dmd.aspetjournals.org
Dow
nloaded from
DMD #58511
9
Preparation of liver microsomal fractions and total protein extracts.
Microsomal fractions were prepared exactly as previously described (Floreani et al., 2013).
Western Blot analysis of PXR expression in hepatic tissue was performed on total liver
protein extracts. For this purpose, frozen hepatic tissue (about 0.2 g) was allowed to thaw in a
modified ice-cold RIPA buffer consisting of 25 mM Tris-HCl (pH 7.4), 150 mM NaCl, 1 mM
EDTA, 1% TritonX-100, 1% sodium deoxycholate, 0.1% SDS, and a Complete Protease
Inhibitor Cocktail (Roche, Milan, Italy). Hepatic tissue was then homogenized in 10 volumes
(w/v) of the same buffer in ice for two 5-sec intervals with an IKA T25 Ultra-Turrax disperser
and processed as previously described (Floreani et al., 2012). Protein concentrations of both
microsomal fractions and total protein extracts were determined by means of a commercial
available kit (Novagen BCA Protein Assay kit) using a standard calibration curve obtained
with known amounts of bovine serum albumin.
Determination of mRNA levels by Real-Time PCR.
In order to determine the mRNA expression of CYP3A1, CYP3A2, PXR and GR, hepatic
tissue was homogenized and total RNA was extracted and purified by means of the SV Total
RNA Isolation System (Promega Corporation, Madison, WI). During RNA extraction, a
DNAse treatment was carried out to remove genomic DNA contamination. Total RNA was
then reverse transcribed to cDNA. Negative controls, used to verify the absence of
contaminating DNA, were obtained by processing samples of RNA in the absence of Reverse
Transcriptase. Real-time PCR was carried out in an I-Cycler iQ system (BioRad Laboratories,
Milan, Italy), as described in detail previously (Albertin et al., 2005), using the primers
reported in Table 1. The PCR program included a denaturation step at 95 °C for 3 min, 40
cycles of two amplification steps (95 °C for 15 s and annealing extension at 60 °C for 30 s)
This article has not been copyedited and formatted. The final version may differ from this version.DMD Fast Forward. Published on July 16, 2014 as DOI: 10.1124/dmd.114.058511
at ASPE
T Journals on D
ecember 24, 2019
dmd.aspetjournals.org
Dow
nloaded from

DMD #58511
10
and a melting curve (60–90 °C with a heating rate of 0.5 °C/10 s). During the exponential
phase, the fluorescence signal threshold was calculated, and the fractional cycle number at
which each sample crossed the threshold (cycle threshold, Ct) was determined. Ct values were
used to calculate the relative mRNA expression, according to the mathematical quantification
model proposed by Pfaffl (Pfaffl, 2001). All samples were amplified in duplicate and
hydroxymethylbilane synthase (HMBS) and β-actin expressions were tested as housekeeping
genes. The results reported in this paper are calculated in reference to β-actin. The specificity
of the amplification procedure was tested at the end of each run by melting curve analysis,
using the I-Cycler software 3.0.
Western Blot analysis.
20 µg per lane of hepatic microsomal proteins, as well as 0.1 pmol of rat recombinant
CYP3A1 and CYP3A2 enzymes as reference standards, were subjected to sodium
dodecylsulfate polyacrylamide gel electrophoresis (SDS-PAGE) on 10% polyacrylamide gels
according to Laemmli (Laemmli, 1970). Anti-CYP3A1 or anti-CYP3A2 primary antibody
was alternatively used to detect CYP3A1 or CYP3A2 protein in the hepatic microsomal
fractions.
Signal intensity of immunoreactive bands was analyzed by the Quantity One software (Bio-
Rad Laboratories S.r.l.) and was expressed as intensity * mm2 (INT*mm2). According to a
previously described procedure for quantification of microsomal CYPs (see e.g., Yoshinari et
al., 2004; Paine et al., 2006), the signal intensity of CYP3A1 or CYP3A2 band was
normalized to a known amount of recombinant CYP3A1 or CYP3A2 microsomal protein
loaded into the gel.
This article has not been copyedited and formatted. The final version may differ from this version.DMD Fast Forward. Published on July 16, 2014 as DOI: 10.1124/dmd.114.058511
at ASPE
T Journals on D
ecember 24, 2019
dmd.aspetjournals.org
Dow
nloaded from

DMD #58511
11
For the evaluation of PXR and GR expressions in liver samples, total liver protein extracts (60
µg of proteins per lane) were used. The signal intensity (INT*mm2) of the immunoreactive
band was normalized to that of the β-actin band.
Determination of testosterone 6β-hydroxylase activity of liver microsomes.
The kinetics of TST 6β-hydroxylase activity, a marker reaction for CYP3A enzymes
(Kobayashi et al., 2002; Walsky and Obach, 2004), was studied under rigorously controlled
initial-rate conditions, by determining the rate of 6β-hydroxy-testosterone (6β-OH-TST)
formation at increasing concentrations of TST. The incubation mixture (total volume: 0.2 ml)
contained 0.1 M KH2PO4 (pH 7.4), 0.5 mM NADPH, increasing concentrations of TST (from
5 to 800 µM, n = 11), and microsomal proteins or recombinant enzymes. For each
microsomal preparation preliminary experiments were performed, at the lowest and highest
substrate concentrations used for the kinetic assays, in order to assess linearity with respect to
incubation time and microsomal protein concentration. Incubation time was 3, 5 or 10 min,
and protein concentration varied according to the activity of the microsomal preparation,
ranging from 10 µg/ml (microsomes from DEX-induced animals) to 125 µg/ml (microsomes
from non-induced rats). Incubation conditions for recombinant enzymes were as described
above, except that 2.5 pmol/ml CYP3A1 and 5 pmol/ml CYP3A2 were used. After a 3-min
thermal equilibration at 37°C, the enzyme reaction was started by the addition of NADPH
and, after shaking in a water bath at 37°C in aerobic conditions, it was stopped by adding 0.1
ml ice-cold acetonitrile and cooling the sample in ice. The mixture was then centrifuged for
10 min at 20000 x g (4°C) to remove denatured proteins. An aliquot (100 ml) of the
supernatant was analyzed for 6β-OH-TST quantification by means of a previously described
HPLC method coupled to UV-VIS detection (Li and Letcher, 2002). Quantitative
This article has not been copyedited and formatted. The final version may differ from this version.DMD Fast Forward. Published on July 16, 2014 as DOI: 10.1124/dmd.114.058511
at ASPE
T Journals on D
ecember 24, 2019
dmd.aspetjournals.org
Dow
nloaded from

DMD #58511
12
determination of 6β-OH-TST was carried out by standard calibration curves obtained with
authentic 6β-OH-TST at concentrations ranging from 1 to 50 nmol/ml (n = 8), processed in
exactly the same way as the samples obtained from kinetic experiments. The calibration
curves were linear in this concentration range (r2 ≥ 0.99), the lowest value of the range
representing the limit of quantification of the assay. Both inter- and intra-assay CVs for 6β-
OH-TST determination (n = 5) were lower than 5% at 1 nmol/ml and lower than 3% at 50
nmol/ml. TST 6β-hydroxylase activity was expressed as pmol of 6β-OH-TST produced per
mg of protein per min.
The inhibitory effect of the selective CYP3A inhibitor clotrimazole (Turan et al., 2001) on
TST 6β-hydroxylase activity was evaluated by using 6 pooled microsomal preparations
obtained from all rats belonging to each of the 6 study groups (control and DEX-treated
healthy, non-ascitic and ascitic rats). The substrate concentration used for these inhibition
experiments (50 µM) was chosen on the basis of the Km value obtained from the kinetic
analyses (see Results). Protein concentrations were 125 µg/ml and 10 µg/ml for controls and
DEX-treated rats, respectively. For assessment of inhibition of recombinant enzymes, 2.5
pmol/ml CYP3A1 and 5 pmol/ml CYP3A2 were used. Clotrimazole, dissolved in 2 µl of
acetonitrile, was added to the incubation mixture, and an equal volume of solvent was added
to control samples. Final inhibitor concentration ranged from 1 to 50 nM.
Kinetic and statistical analyses.
Initial velocity data for 6β-OH-TST formation catalyzed by recombinant CYP3A1 and
CYP3A2, and liver microsomes were evaluated by best-fitting procedures, by means of the
GraphPad Prism software, version 5 (GraphPad Software Inc., San Diego, CA, USA). The F
test was used to discriminate between different kinetic models [one- or two-enzyme
This article has not been copyedited and formatted. The final version may differ from this version.DMD Fast Forward. Published on July 16, 2014 as DOI: 10.1124/dmd.114.058511
at ASPE
T Journals on D
ecember 24, 2019
dmd.aspetjournals.org
Dow
nloaded from

DMD #58511
13
Michaelis-Menten model, one-enzyme Michaelis-Menten kinetics with substrate inhibition or
autoactivation (sigmoidal) kinetics]. Kinetic parameters were estimated by non-linear
regression analysis of untransformed initial velocity data (GraphPad Prism software) using
the appropriate equation. The following kinetic parameters were determined: Vmax, maximum
velocity of the reaction; Km, substrate concentration yielding 50% of Vmax, and CLint, intrinsic
metabolic clearance, calculated as the ratio of Vmax to Km. IC50 values (inhibitor
concentrations causing 50% inhibition of control enzyme activities) were determined by the
use of non-linear regression of relative reaction velocities at increasing inhibitor
concentrations (Eagling et al., 1998).
Statistical analyses were also performed by means of the GraphPad Prism software. Unless
otherwise indicated, the data are presented as mean values ± S.D.. Comparison of the
experimental data obtained from healthy, non-ascitic and ascitic cirrhotic groups was made by
one-way analysis of variance (ANOVA). In case of significant differences (α = 0.05), the
analysis of variance was followed by the Newman-Keuls post-hoc test. Comparison of the
results obtained from control and induced animals within each group was performed by
means of Student’s t-test. P < 0.05 was considered statistically significant.
Results
Serum chemistry and histology of rat livers.
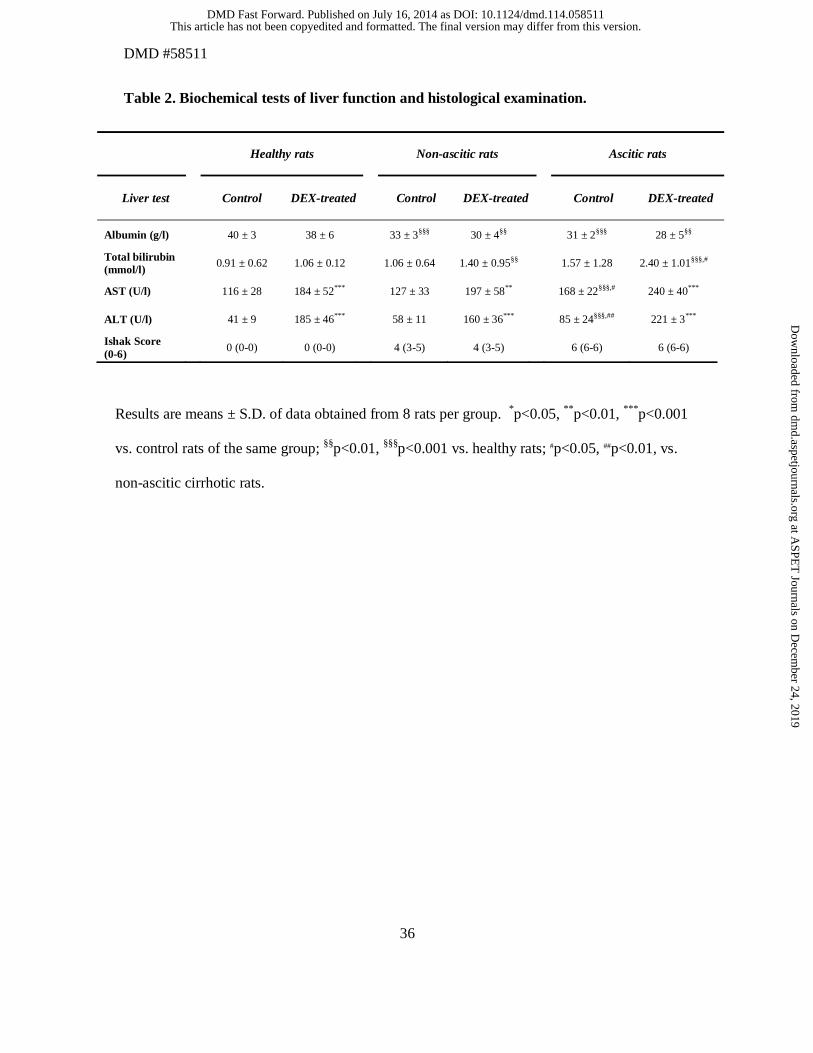
The results of biochemical tests of liver function and histological examination of healthy and
cirrhotic rats are shown in Table 2. Apart from serum albumin, there were only minor,
statistically non-significant differences between healthy and non-ascitic cirrhotic rats. All
indexes of liver function were significantly altered in rats with ascites, indicating advanced
hepatocellular insufficiency. The significantly higher AST and ALT values in DEX-treated
This article has not been copyedited and formatted. The final version may differ from this version.DMD Fast Forward. Published on July 16, 2014 as DOI: 10.1124/dmd.114.058511
at ASPE
T Journals on D
ecember 24, 2019
dmd.aspetjournals.org
Dow
nloaded from

DMD #58511
14
rats of all 3 groups can be ascribed to the inducing effect of DEX on these hepatic enzymes
(Ennulat et al., 2010). Histological examination revealed normal liver architecture in healthy
animals (Fig. 2A), whereas non-ascitic (Fig. 2B) and ascitic (Fig 2C) cirrhotic rats showed
progressive alterations of liver structure, with increasing presence of fibrous septa, which
were never present in healthy animals. Quite similar cirrhosis-associated alterations were
observed in control and DEX-treated rats of each group.
mRNA and protein expressions of CYP3A1 and CYP3A2.
Fig. 3 shows the values of CYP3A1 mRNA and protein expressions relative to those of
control healthy rats. The level of CYP3A1 mRNA did not decrease significantly in cirrhotic
with respect to healthy animals (Fig. 3A). DEX treatment caused a significant increase in
CYP3A1 mRNA expression in all 3 groups of rats, although to a somewhat lesser extent in
ascitic animals. A representative Western Blot (Fig. 3B) shows that the specificity of the anti-
rat CYP3A1 antibody was not absolute, since it cross-reacted, although to a very limited
extent, with CYP3A2. Quantification of the immunodetectable CYP3A1 protein (Fig. 3C)
gave results in substantial agreement with those of Real-Time PCR, since it revealed that
protein expression was similar in the three groups of control rats, and increased significantly
in all groups of DEX-treated animals.
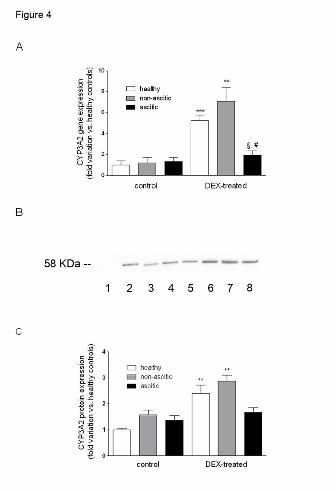
In contrast to CYP3A1, the constitutive mRNA expression of CYP3A2 (Fig. 4A) tended to
increase with the decline of liver function, although to a non-significant extent. At further
variance with CYP3A1, significant DEX induction of CYP3A2 mRNA was only observed in
healthy and non-ascitic rats, whereas it was absent in ascitic animals. The results of Western
Blot analysis (Fig. 4B and C) were in accordance with those of Real-Time PCR experiments,
regarding both the effects of cirrhosis and those of DEX treatment, since there was a slight,
This article has not been copyedited and formatted. The final version may differ from this version.DMD Fast Forward. Published on July 16, 2014 as DOI: 10.1124/dmd.114.058511
at ASPE
T Journals on D
ecember 24, 2019
dmd.aspetjournals.org
Dow
nloaded from

DMD #58511
15
non-significant cirrhosis-associated increase in CYP3A2 protein expression in control
animals, and a significant inducing effect of DEX in healthy and non-ascitic animals, but not
in ascitic ones.
mRNA and protein expressions of PXR and GR.
Since DEX has been reported to induce CYP3A enzymes through both direct activation of
PXR and GR-mediated increase in PXR expression (Pascussi et al., 2000; Huss and Kasper,
2000), we measured the mRNA levels and the protein contents of both PXR and GR. Fig. 5A
shows that PXR gene expression was affected neither by cirrhosis nor by DEX treatment. The
results of Western Blot analysis (Fig. 5B-C) were in agreement with those of Real-Time PCR,
since no significant difference could be observed between healthy and cirrhotic rats or control
and induced ones. Similarly, neither cirrhosis nor DEX treatment caused any statistically
significant modification of mRNA or protein expression of GR (Fig. 6).
Kinetic analysis of testosterone 6β-hydroxylase activity.
Although TST 6β-hydroxylation is currently used as a marker reaction of CYP3A enzymes in
both humans and rats (Kobayashi et al., 2002; Walsky and Obach, 2004), its specificity in the
rat has been questioned (Chovan et al., 2007). Thus, in order to assess the specificity of TST
6β-hydroxylation, we tested the effect of clotrimazole, a potent and selective inhibitor of rat
CYP3A enzymes (Turan et al., 2001), on microsomal preparations of all 6 groups of rats. Fig.
7 shows that clotrimazole-induced inhibition of TST 6β-hydroxylation was always complete
at 50 nM, a concentration which does not appreciably affect the activity of other major CYP
isoforms (Turan et al., 2001). IC50 values were very similar for all microsomal preparations
(6-7 nM and 2-3 nM for microsomes obtained from control and induced rats, respectively),
This article has not been copyedited and formatted. The final version may differ from this version.DMD Fast Forward. Published on July 16, 2014 as DOI: 10.1124/dmd.114.058511
at ASPE
T Journals on D
ecember 24, 2019
dmd.aspetjournals.org
Dow
nloaded from

DMD #58511
16
and similar to those observed with recombinant CYP3A1 (4.6 ± 0.5 nM) and CYP3A2 (2.0 ±
0.2 nM).
In preliminary experiments, we also measured midazolam 4- and 1’-hydroxylations,
alternative marker reactions for rat CYP3A enzymes (Kobayashi et al., 2002). Both these
reactions exhibited Michaelis-Menten kinetics with substrate inhibition, that could not be
fitted to a two-enzyme kinetic model. In the concentration range used in this study (5-800
µM), the TST 6β-hydroxylase activity of rat liver microsomes was best fitted to a two-enzyme
Michaelis-Menten equation, which is consistent with the presence of two main CYP3A
isoforms: CYP3A1 and CYP3A2. In order to distinguish between the activities of these two
enzymes, we determined the kinetic parameters of the reaction using rat recombinant
CYP3A1 and CYP3A2 enzymes. The results (shown in Table 3) indicate that, whereas the
Vmax values of the two enzymes were similar, the mean Km value was 13 times lower for
CYP3A2. Best fitting of the kinetic data obtained with microsomal preparations yielded two
Km values differing by an order of magnitude and similar to those observed with recombinant
enzymes, thereby consenting us to ascribe to CYP3A1 and CYP3A2 the microsomal activities
with greater and lower Km, respectively (Table 3). The results of the best-fitting procedure
were confirmed by the Eadie-Hofstee graphical analysis, the plotting technique most sensitive
to deviations from linearity, which gave markedly curved plots, consistent with the presence
of two enzymes with considerably different Km (Segel, 1975), for all rats examined in this
study (results not shown). Table 3 also shows that liver function impairment, rather than
decreasing the Vmax of CYP3A1 and CYP3A2 activities in control rats, caused a non-
significant increment, particularly in non-ascitic cirrhotic animals, as previously observed
with non-specific CYP probes in the same rat model of cirrhosis (Wu et al., 1991). In full
agreement with mRNA and protein expression data, DEX treatment significantly increased
This article has not been copyedited and formatted. The final version may differ from this version.DMD Fast Forward. Published on July 16, 2014 as DOI: 10.1124/dmd.114.058511
at ASPE
T Journals on D
ecember 24, 2019
dmd.aspetjournals.org
Dow
nloaded from

DMD #58511
17
the Vmax of the CYP3A1-catalyzed reaction in all three groups of rats, although to a somewhat
lower extent in ascitic animals, whereas it increased significantly the Vmax of CYP3A2 only in
healthy and non-ascitic cirrhotic rats. The Km values of both CYP3A1 and CYP3A2 activities
were similar in all groups of rats. As a consequence, the modifications of CLint (the ratio of
Vmax to Km) paralleled those of Vmax. The absolute values of CLint of the recombinant enzymes
were very similar to those previously obtained by Carr et al. (2006) (3.3 and 0.1 µl/min/pmol
CYP for rCYP3A2 and rCYP3A1, respectively), thus confirming the greater catalytic
efficiency of CYP3A2.
Discussion
Induction in human beings has been assessed by measuring modifications of the
pharmacokinetic parameters (half-life or systemic clearance) of a metabolic probe or of the
enzyme activities of liver tissues obtained at biopsy. Although such determinations provide a
reliable measure of the extent of induction, they give no information regarding the mechanism
by which liver cirrhosis may impair enzyme induction. We have recently shown that the use
of an animal model of liver cirrhosis produced by exposure to CCl4 makes it possible to study
the mechanisms by which cirrhosis may affect enzyme induction by means of the
simultaneous determination of the mRNA level, protein expression and enzymatic activity of
the induced enzyme(s) in the liver obtained from sacrificed animals (Floreani et al., 2013).
Previous studies using Long-Evans (Cooper et al., 1993) or Sprague-Dawley (Jan et al., 2006)
male rats found no detectable mRNA level or negligible protein expression of CYP3A1,
respectively. The results of our Real-Time PCR determinations and Western Blot analyses
show that both CYP3A1 and CYP3A2 are constitutively expressed in male Wistar rats and
their mRNA and protein levels are not significantly modified by liver cirrhosis. The latter
This article has not been copyedited and formatted. The final version may differ from this version.DMD Fast Forward. Published on July 16, 2014 as DOI: 10.1124/dmd.114.058511
at ASPE
T Journals on D
ecember 24, 2019
dmd.aspetjournals.org
Dow
nloaded from

DMD #58511
18
finding contrasts with the previous observation regarding CYP1A2 expression in the same
animal model of cirrhosis, since the basal mRNA and protein levels of CYP1A2 were found
to decrease significantly (up to 80%) in proportion to the severity of liver dysfunction
(Floreani et al., 2013). That result was in agreement with the observations of human studies,
which have consistently found a profound fall in CYP1A2 expression in liver cirrhosis
(reviewed in Hasler, 1999). On the contrary, studies of the effect of cirrhosis on the protein
expression of human CYP3A enzymes have generated conflicting results, since no significant
modifications of protein levels have been observed by Guengerich and Turvy (1991) or Lown
et al. (1992), whereas George et al. (1995) observed a significant decrease in hepatocellular,
but not cholestatic cirrhosis. The observation that the metabolic clearance of CYP3A
substrates is generally reduced in decompensated cirrhosis (Verbeeck, 2008) is not
incompatible with a preserved CYP3A expression, since a large body of evidence has
accumulated that other factors, such as reduced number of functional hepatocytes and
impaired drug uptake by the liver, may be more important determinants of the cirrhosis-
associated decrease in drug biotransformation (Morgan and McLean, 1995; Orlando et al.,
2006).
DEX treatment caused highly significant increases in both gene and protein expressions of
CYP3A1 in healthy as well as cirrhotic rats, irrespective of the degree of liver dysfunction. In
contrast, CYP3A2 gene and protein expressions were significantly induced in healthy and
non-ascitic cirrhotic rats, but not in those with ascitic cirrhosis, indicating that the induction of
this CYP isoform is greatly curtailed when liver dysfunction becomes severe. A comparison
of the results of Real-Time PCR and Western Blot determinations reveals a further difference
between these two CYP3A isoforms in their response to DEX treatment, since a quantitatively
similar degree of induction is observed for CYP3A2 mRNA level and protein expression,
This article has not been copyedited and formatted. The final version may differ from this version.DMD Fast Forward. Published on July 16, 2014 as DOI: 10.1124/dmd.114.058511
at ASPE
T Journals on D
ecember 24, 2019
dmd.aspetjournals.org
Dow
nloaded from

DMD #58511
19
whereas the increase in CYP3A1 mRNA level exceeds by one order of magnitude that in
protein expression. Differences in the degree of mRNA and protein expression have been
observed with various proteins including CYP enzymes, and have been attributed to
translational repression by miRNAs (Singh et al., 2011). Thus, our observations suggest that
the translations of CYP3A1 and CYP3A2 mRNAs are subject to different miRNA-mediated
controls.
Since the expression of CYP3A enzymes is under the transcriptional control of PXR, and
PXR upregulation, mediated by DEX activation by GR, has been observed in vitro with both
human (Pascussi et al., 2000) and rat hepatic cell lines (Huss and Kasper, 2000), we assessed
the effects of liver dysfunction and DEX on the mRNA and protein expressions of both PXR
and GR. However, we could not confirm in vivo the results previously obtained with cultured
hepatocytes, since we observed no significant modification of the mRNA or protein
expression of these nuclear receptors. Thus, unlike AhR, whose transcription has been found
to be reduced in vivo in the presence of liver cirrhosis (Floreani et al., 2013), and upregulated
following the administration of various AhR ligands (Floreani et al., 2012; Franc et al., 2001),
PXR mRNA and protein levels are neither appreciably reduced by liver cirrhosis nor
increased by DEX treatment. The former finding is consistent with the observation that the
constitutive expression of both CYP3A enzymes is unaffected by liver dysfunction, and is
also consistent with the observation that CYP3A1 induction is not compromised in liver
cirrhosis, but leaves unanswered the question of why the induction of CYP3A2, which is
transcriptionally activated by the same nuclear receptor, is compromised in decompensated
cirrhosis. Although no certain explanation can be provided on the basis of the present
knowledge of CYP3A2 transcription machinery, it may be hypothesized that, in addition to
mRNA translation, the gene transcription of CYP3A2 is also under the control of a different
This article has not been copyedited and formatted. The final version may differ from this version.DMD Fast Forward. Published on July 16, 2014 as DOI: 10.1124/dmd.114.058511
at ASPE
T Journals on D
ecember 24, 2019
dmd.aspetjournals.org
Dow
nloaded from

DMD #58511
20
regulatory mechanism involving either coactivators or a RNA polymerase more sensitive than
those of CYP3A1 to the modifications associated with severe liver cirrhosis. The observation
that the mRNA level of CYP3A1 is increased to a far greater extent in response to DEX
treatment than that of CYP3A2 is consistent with a different regulatory control of their
transcription. Evidence that the mRNA expressions of CYP3A1 and CYP3A2 are not
coordinately regulated in response to DEX treatment has also been obtained by (Choudhuri et
al., 1995).
Although Real-Time PCR and Western Blot analyses provide information relevant to the
mechanism (altered transcription or translation) underlying changes in CYP expression,
determination of CYP activity provides the unique quantitative measure of changes in CYP-
mediated drug metabolism (Murray et al., 2001), and is the methodological approach
recommended by US FDA (Hewitt et al., 2007). In previous kinetic analyses of TST 6β-
hydroxylation by rat liver microsomes, velocity data were fitted to an one-enzyme hyperbolic
kinetic model (Jimenez et al., 1992; Murray and Butler, 1996; Jiko et al., 2005; Velenosi et
al., 2012) or to a sigmoidal kinetics with low degree of autoactivation [Hill coefficients of
1.2-1.4 (Carr et al., 2006)]. This did not consent a determination of the separate contributions
of the two main CYP3A isoforms (CYP3A1 and CYP3A2) to the measured enzymatic
activity. Based on velocity curves obtained with 11 substrate concentrations in rigorously
controlled initial rate conditions, we could show that the kinetic data were best described by a
two-enzyme Michaelis-Menten model, and that the Km values obtained with liver microsomes
were in good agreement with those of recombinant CYP3A1 and CYP3A2. This has enabled
us to determine for the first time the changes in activity of each of these two CYP isoforms.
The results of these determinations confirm the indications of Real-Time PCR and Western
Blot analyses that both CYP3A1 and CYP3A2 are constitutively expressed in Wistar rats. The
This article has not been copyedited and formatted. The final version may differ from this version.DMD Fast Forward. Published on July 16, 2014 as DOI: 10.1124/dmd.114.058511
at ASPE
T Journals on D
ecember 24, 2019
dmd.aspetjournals.org
Dow
nloaded from

DMD #58511
21
observed changes in Vmax are also in full agreement with those in mRNA and protein
expressions since, a) the constitutive activities of both CYP3A1 and CYP3A2 are not
significantly modified by liver dysfunction; b) the inducibility of CYP3A1 activity is
preserved in both non-ascitic and ascitic cirrhotic rats, whereas that of CYP3A2 is preserved
in rats with moderate liver dysfunction, but significantly decreased when liver dysfunction
becomes severe.
In conclusion, the results of our Real-Time PCR, Western Blot and kinetic analyses all concur
in showing that the induction of CYP3A enzymes is differentially affected by liver function
impairment since, unlike CYP3A1, CYP3A2 is not significantly induced in severe liver
dysfunction. The induction of the latter enzyme is compromised at a pretranslational level,
since proportional reductions in induced mRNA level, protein expression and enzyme activity
are observed in ascitic rats. The effect of liver dysfunction on both the constitutive expression
and the PXR-mediated induction of CYP3A enzymes differs from that on the basal expression
and the AhR-mediated induction of CYP1A enzymes, observed in the same animal model of
liver cirrhosis (Floreani et al., 2013). That study showed that the constitutive expression of
CYP1A2 (the sole CYP1A isoform constitutively expressed in the liver) is decreased in
cirrhosis and the induction of both CYP1A enzymes is well preserved in compensated, but
markedly reduced in decompensated cirrhosis. These effects on both constitutive and induced
enzyme expressions could be ascribed to a decreased transcription of CYP1A genes as a
consequence of a reduced AhR expression. Unlike AhR, PXR expression is not reduced in
liver dysfunction, and the precise mechanism responsible for the selective impairment of
CYP3A2 transcription remains to be determined. Whatever the explanation may be for this
selective effect, the present results make it clear that no general conclusion can be drawn from
the study of any particular CYP isoform, since even the induction of enzymes under the
This article has not been copyedited and formatted. The final version may differ from this version.DMD Fast Forward. Published on July 16, 2014 as DOI: 10.1124/dmd.114.058511
at ASPE
T Journals on D
ecember 24, 2019
dmd.aspetjournals.org
Dow
nloaded from

DMD #58511
22
transcriptional control of the same nuclear receptor may be differentially affected by liver
function impairment. These findings may also partly explain why conflicting results have
been obtained by human studies assessing the effect of liver dysfunction on the induction of
drug metabolism.
This article has not been copyedited and formatted. The final version may differ from this version.DMD Fast Forward. Published on July 16, 2014 as DOI: 10.1124/dmd.114.058511
at ASPE
T Journals on D
ecember 24, 2019
dmd.aspetjournals.org
Dow
nloaded from

DMD #58511
23
Acknowledgments
We thank Mr. Mauro Berto for skilful technical assistance.
Authorship Contributions
Participated in research design: Palatini
Conducted experiments: Gabbia, Sfriso, Mescoli, Albertoni, Paliuri
Performed data analysis: De Martin, Albertin, Mescoli, Bova, Palatini
Wrote or contributed to the writing of the manuscript: De Martin, Palatini
This article has not been copyedited and formatted. The final version may differ from this version.DMD Fast Forward. Published on July 16, 2014 as DOI: 10.1124/dmd.114.058511
at ASPE
T Journals on D
ecember 24, 2019
dmd.aspetjournals.org
Dow
nloaded from

DMD #58511
24
References
Albertin G, Rucinski M, Carraro G, Forneris M, Andreis P, Malendowicz LK, and
Nussdorfer GG. (2005) Adrenomedullin and vascular endothelium growth factor genes are
overexpressed in the regenerating rat adrenal cortex, and AM and VEGF reciprocally enhance
their mRNA expression in cultured rat adrenocortical cells. Int J Mol Med 16:431-435.
Bachmann KA and Lewis JD. (2005) Predicting inhibitory drug-drug interactions and
evaluating drug interaction reports using inhibition constants. Ann Pharmacother 39:1064-
1072.
Carr B, Norcross R, Fang Y, Lu P, Rodrigues AD, Shou M, Rushmore T, and Booth-Genthe
C. (2006) Characterization of the rhesus monkey CYP3A64 enzyme: species comparisons of
CYP3A substrate specificity and kinetics using baculovirus-expressed recombinant enzymes.
Drug Metab Dispos 34:1703-1712.
Choudhuri S, Zhang XJ, Waskiewicz MJ, and Thomas PE. (1995) Differential regulation of
cytochrome P450 3A1 and P450 3A2 in rat liver following dexamethasone treatment. J
Biochem Toxicol 10:299-307.
Chovan JP, Ring SC, Yu E, and Baldino JP. (2007) Cytochrome P450 probe substrate
metabolism kinetics in Sprague Dawley rats. Xenobiotica 37:459-473.
Cooper KO, Reik LM, Jayyosi Z, Bandiera S, Kelley M, Ryan DE, Daniel R, McCluskey SA,
Levin W, and Thomas PE. (1993) Regulation of two members of the steroid-inducible
cytochrome P450 subfamily (3A) in rats. Arch Biochem Biophys 301:345-354.
This article has not been copyedited and formatted. The final version may differ from this version.DMD Fast Forward. Published on July 16, 2014 as DOI: 10.1124/dmd.114.058511
at ASPE
T Journals on D
ecember 24, 2019
dmd.aspetjournals.org
Dow
nloaded from

DMD #58511
25
Eagling VA, Tjia JF, and Back DJ. (1998) Differential selectivity of cytochrome P450
inhibitors against probe substrates in human and rat liver microsomes. Br J Clin Pharmacol
45:107-114.
Ennulat D, Walker D, Clemo F, Magid-Slav M, Ledieu D, Graham M, Botts S, and Boone L.
(2010) Effects of hepatic drug-metabolizing enzyme induction on clinical pathology
parameters in animals and man. Toxicol Pathol 38:810-828.
Farrell GC and Zaluzny L. (1984) Microsomal protein synthesis and induction of cytochrome
P-450 in cirrhotic rat liver. Aust J Exp Biol Med Sci 62 ( Pt 3):291-301.
Floreani M, Gabbia D, Barbierato M, De Martin S, and Palatini P. (2012) Differential
inducing effect of benzo[a]pyrene on gene expression and enzyme activity of cytochromes
P450 1A1 and 1A2 in Sprague-Dawley and Wistar rats. Drug Metab Pharmacokinet 27:640-
652.
Floreani M, De Martin S, Gabbia D, Barbierato M, Nassi A, Mescoli C, Orlando R, Bova S,
Angeli P, Gola E, Sticca A, and Palatini P. (2013) Severe liver cirrhosis markedly reduces
AhR-mediated induction of cytochrome P450 in rats by decreasing the transcription of target
genes. PLoS One 8:e61983.
Franc MA, Pohjanvirta R, Tuomisto J, and Okey AB. (2001) In vivo up-regulation of aryl
hydrocarbon receptor expression by 2,3,7,8-tetrachlorodibenzo-p-dioxin (TCDD) in a dioxin-
resistant rat model. Biochem Pharmacol 62:1565-1578.
Fuhr U. (2000) Induction of drug metabolising enzymes: pharmacokinetic and toxicological
consequences in humans. Clin Pharmacokinet 38:493-504.
This article has not been copyedited and formatted. The final version may differ from this version.DMD Fast Forward. Published on July 16, 2014 as DOI: 10.1124/dmd.114.058511
at ASPE
T Journals on D
ecember 24, 2019
dmd.aspetjournals.org
Dow
nloaded from

DMD #58511
26
George J, Murray M, Byth K, and Farrell GC. (1995) Differential alterations of cytochrome
P450 proteins in livers from patients with severe chronic liver disease. Hepatology 21:120-
128.
Ghosal A, Sadrieh N, Reik L, Levin W, and Thomas PE. (1996) Induction of the male-
specific cytochrome P450 3A2 in female rats by phenytoin. Arch Biochem Biophys 332:153-
162.
Guengerich FP and Turvy CG. (1991) Comparison of levels of several human microsomal
cytochrome P-450 enzymes and epoxide hydrolase in normal and disease states using
immunochemical analysis of surgical liver samples. J Pharmacol Exp Ther 256:1189-1194.
Hasler JA, Estabrook R, Murray M, Pikuleva I, Waterman M, Capdevila J, Holla V, Helvig C,
Falck JR, Farrell G, Kaminsky LS, Spivack SD, Boitier E, Beaune P. (1999) Human
cytochromes P450. Mol Aspects Med 20:1-137.
Hewitt NJ, Lecluyse EL, and Ferguson SS. (2007) Induction of hepatic cytochrome P450
enzymes: methods, mechanisms, recommendations, and in vitro-in vivo correlations.
Xenobiotica 37:1196-1224.
Hoyumpa AM,Jr and Schenker S. (1982) Major drug interactions: effect of liver disease,
alcohol, and malnutrition. Annu Rev Med 33:113-149.
Huss JM and Kasper CB. (2000) Two-stage glucocorticoid induction of CYP3A23 through
both the glucocorticoid and pregnane X receptors. Mol Pharmacol 58:48-57.
This article has not been copyedited and formatted. The final version may differ from this version.DMD Fast Forward. Published on July 16, 2014 as DOI: 10.1124/dmd.114.058511
at ASPE
T Journals on D
ecember 24, 2019
dmd.aspetjournals.org
Dow
nloaded from

DMD #58511
27
Ishak K, Baptista A, Bianchi L, Callea F, De Groote J, Gudat F, Denk H, Desmet V, Korb G,
and MacSween RN. (1995) Histological grading and staging of chronic hepatitis. J Hepatol
22:696-699.
Jan YH, Mishin V, Busch CM, and Thomas PE. (2006) Generation of specific antibodies and
their use to characterize sex differences in four rat P450 3A enzymes following vehicle and
pregnenolone 16alpha-carbonitrile treatment. Arch Biochem Biophys 446:101-110.
Jiko M, Yano I, Okuda M, and Inui K. (2005) Altered pharmacokinetics of paclitaxel in
experimental hepatic or renal failure. Pharm Res 22:228-234.
Jimenez W, Claria J, Arroyo V, and Rodes J. (1992) Carbon tetrachloride induced cirrhosis in
rats: a useful tool for investigating the pathogenesis of ascites in chronic liver disease. J
Gastroenterol Hepatol 7:90-97.
Kobayashi K, Urashima K, Shimada N, and Chiba K. (2002) Substrate specificity for rat
cytochrome P450 (CYP) isoforms: screening with cDNA-expressed systems of the rat.
Biochem Pharmacol 63:889-896.
Laemmli UK. (1970) Cleavage of structural proteins during the assembly of the head of
bacteriophage T4. Nature 227:680-685.
Li H and Letcher RJ. (2002) A high-performance-liquid-chromatography-based method for
the determination of hydroxylated testosterone metabolites formed in vitro in liver
microsomes from gray seal (Halichoerus grypus). J Chromatogr Sci 40:397-402.
Lin JH and Lu AY. (1998) Inhibition and induction of cytochrome P450 and the clinical
implications. Clin Pharmacokinet 35:361-390.
This article has not been copyedited and formatted. The final version may differ from this version.DMD Fast Forward. Published on July 16, 2014 as DOI: 10.1124/dmd.114.058511
at ASPE
T Journals on D
ecember 24, 2019
dmd.aspetjournals.org
Dow
nloaded from

DMD #58511
28
Lown K, Kolars J, Turgeon K, Merion R, Wrighton SA, and Watkins PB. (1992) The
erythromycin breath test selectively measures P450IIIA in patients with severe liver disease.
Clin Pharmacol Ther 51:229-238.
Mahnke A, Strotkamp D, Roos PH, Hanstein WG, Chabot GG, and Nef P. (1997) Expression
and inducibility of cytochrome P450 3A9 (CYP3A9) and other members of the CYP3A
subfamily in rat liver. Arch Biochem Biophys 337:62-68.
Marshall WJ and McLean AE. (1969) The effect of cirrhosis of the liver on microsomal
detoxications and cytochrome P-450. Br J Exp Pathol 50:578-583.
Morgan DJ and McLean AJ. (1995) Clinical pharmacokinetic and pharmacodynamic
considerations in patients with liver disease. An update. Clin Pharmacokinet 29:370-391.
Murray GI, Melvin WT, Greenlee WF, and Burke MD. (2001) Regulation, function, and
tissue-specific expression of cytochrome P450 CYP1B1. Annu Rev Pharmacol Toxicol
41:297-316.
Murray M and Butler AM. (1996) Enhanced inhibition of microsomal cytochrome P450 3A2
in rat liver during diltiazem biotransformation. J Pharmacol Exp Ther 279:1447-1452.
Orlando R, De Martin S, Pegoraro P, Quintieri L, and Palatini P. (2009) Irreversible CYP3A
inhibition accompanied by plasma protein-binding displacement: a comparative analysis in
subjects with normal and impaired liver function. Clin Pharmacol Ther 85:319-326.
Orlando R, Padrini R, Perazzi M, De Martin S, Piccoli P, and Palatini P. (2006) Liver
dysfunction markedly decreases the inhibition of cytochrome P450 1A2-mediated
theophylline metabolism by fluvoxamine. Clin Pharmacol Ther 79:489-499.
This article has not been copyedited and formatted. The final version may differ from this version.DMD Fast Forward. Published on July 16, 2014 as DOI: 10.1124/dmd.114.058511
at ASPE
T Journals on D
ecember 24, 2019
dmd.aspetjournals.org
Dow
nloaded from

DMD #58511
29
Orlando R, Piccoli P, De Martin S, Padrini R, Floreani M, and Palatini P. (2004) Cytochrome
P450 1A2 is a major determinant of lidocaine metabolism in vivo: effects of liver function.
Clin Pharmacol Ther 75:80-88.
Paine MF, Hart HL, Ludington SS, Haining RL, Rettie AE, and Zeldin DC. (2006) The
human intestinal cytochrome P450 "pie". Drug Metab Dispos 34: 880-886.
Palatini P, Orlando R, and De Martin S. (2010) The effect of liver disease on inhibitory and
plasma protein-binding displacement interactions: an update. Expert Opin Drug Metab
Toxicol 6:1215-1230.
Palatini P, De Martin S, Pegoraro P, and Orlando R. (2008) Enzyme inhibition and induction
in liver disease. Curr Clin Pharmacol 3:56-69.
Park BK, Kitteringham NR, Pirmohamed M, and Tucker GT. (1996) Relevance of induction
of human drug-metabolizing enzymes: pharmacological and toxicological implications. Br J
Clin Pharmacol 41:477-491.
Pascussi JM, Drocourt L, Fabre JM, Maurel P, and Vilarem MJ. (2000) Dexamethasone
induces pregnane X receptor and retinoid X receptor-alpha expression in human hepatocytes:
synergistic increase of CYP3A4 induction by pregnane X receptor activators. Mol Pharmacol
58:361-372.
Pearce RE, McIntyre CJ, Madan A, Sanzgiri U, Draper AJ, Bullock PL, Cook DC, Burton
LA, Latham J, Nevins C, and Parkinson A. (1996) Effects of freezing, thawing, and storing
human liver microsomes on cytochrome P450 activity. Arch Biochem Biophys 331:145-169.
This article has not been copyedited and formatted. The final version may differ from this version.DMD Fast Forward. Published on July 16, 2014 as DOI: 10.1124/dmd.114.058511
at ASPE
T Journals on D
ecember 24, 2019
dmd.aspetjournals.org
Dow
nloaded from
DMD #58511
30
Pfaffl MW. (2001) A new mathematical model for relative quantification in real-time RT-
PCR. Nucleic Acids Res 29:e45.
Rosa DP, Bona S, Simonetto D, Zettler C, Marroni CA, and Marroni NP. (2010) Melatonin
protects the liver and erythrocytes against oxidative stress in cirrhotic rats. Arq Gastroenterol
47:72-78.
Segel J. (1975) Enzyme Kinetics. John Wiley and Sons, New York.
Shimada T, Yamazaki H, Mimura M, Inui Y, and Guengerich FP. (1994) Interindividual
variations in human liver cytochrome P-450 enzymes involved in the oxidation of drugs,
carcinogens and toxic chemicals: studies with liver microsomes of 30 Japanese and 30
Caucasians. J Pharmacol Exp Ther 270:414-423.
Singh D, Kashyap A, Pandey RV, and Saini KS. (2011) Novel advances in cytochrome P450
research. Drug Discov Today 16:793-799.
Turan VK, Mishin VM, and Thomas PE. (2001) Clotrimazole is a selective and potent
inhibitor of rat cytochrome P450 3A subfamily-related testosterone metabolism. Drug Metab
Dispos 29:837-842.
Velenosi TJ, Fu AY, Luo S, Wang H, and Urquhart BL. (2012) Down-regulation of hepatic
CYP3A and CYP2C mediated metabolism in rats with moderate chronic kidney disease. Drug
Metab Dispos 40:1508-1514.
Verbeeck RK. (2008) Pharmacokinetics and dosage adjustment in patients with hepatic
dysfunction. Eur J Clin Pharmacol 64:1147-1161.
This article has not been copyedited and formatted. The final version may differ from this version.DMD Fast Forward. Published on July 16, 2014 as DOI: 10.1124/dmd.114.058511
at ASPE
T Journals on D
ecember 24, 2019
dmd.aspetjournals.org
Dow
nloaded from

DMD #58511
31
Walsky RL and Obach RS. (2004) Validated assays for human cytochrome P450 activities.
Drug Metab Dispos 32:647-660.
Wu ZQ, Piche D, Vallieres S, Huet PM, and Gascon-Barre M. (1991) Unimpaired induction
of drug-metabolizing enzymes in hepatocytes isolated from rats with micronodular cirrhosis.
Can J Physiol Pharmacol 69:426-436.
Yoshinari K, Sato T, Okino N, Sugatani J, and Miwa M. (2004) Expression and induction of
cytochromes p450 in rat white adipose tissue. J Pharmacol Exp Ther 311: 147-154.
This article has not been copyedited and formatted. The final version may differ from this version.DMD Fast Forward. Published on July 16, 2014 as DOI: 10.1124/dmd.114.058511
at ASPE
T Journals on D
ecember 24, 2019
dmd.aspetjournals.org
Dow
nloaded from

DMD #58511
32
Footnotes
This work was supported by a grant [# CPDA093519] from the University of Padova, Padova,
Italy.
Presented as a poster at the Italian Society of Pharmacology (Società Italiana di Farmacologia,
SIF) meeting, 2013. Abstract published in the SIF 2013 meeting homepage
(http://congresso.sifweb.org/abs/191.pdf)
Address for reprint requests: Prof. Pietro Palatini, Department of Pharmaceutical and
Pharmacological Sciences, University of Padova, Largo Meneghetti 2, 35131 Padova, Italy;
(email: [email protected]).
This article has not been copyedited and formatted. The final version may differ from this version.DMD Fast Forward. Published on July 16, 2014 as DOI: 10.1124/dmd.114.058511
at ASPE
T Journals on D
ecember 24, 2019
dmd.aspetjournals.org
Dow
nloaded from

DMD #58511
33
Figure legends
Figure 1. Study design. PB: Phenobarbital; DEX: dexamethasone.
Fig. 2. Histological analysis. Representative photomicrographs (Van Gieson stain, 200 x
magnification) of liver sections taken from an healthy (Ishak score = 0) (A), a non-ascitic
(Ishak score = 4) (B), and an ascitic cirrhotic rat (Ishak score = 6) (C).
Figure 3. CYP3A1 gene and protein expressions in control and DEX-treated rats. (A)
Experimental data showing CYP3A1 mRNA levels are reported as fold variation compared
with healthy control rats. (B) Representative Western blot showing the separation of
microsomal proteins obtained from control and DEX-treated rats. As reference standards,
0.125 pmol of rat recombinant CYP3A1 or CYP3A2 protein were loaded in lanes 1 and 2,
respectively. Lanes 3 to 5: healthy, non-ascitic and ascitic control rats; lanes 6 to 8: healthy,
non-ascitic and ascitic DEX-treated rats. (C) Amount of CYP3A1 protein in livers from
control and DEX-treated rats normalized to the signal intensity of the CYP3A1 band and
shown as fold variation compared with healthy control rats. All results are means ± S.E. of
data obtained from 8 rats per group. ***p<0.001 vs. control rats of the same group; §p<0.05 vs.
DEX-treated healthy rats.
Figure 4. CYP3A2 gene and protein expressions in control and DEX-treated rats. (A)
Experimental data showing CYP3A2 mRNA levels are reported as fold variation compared
with healthy control rats. (B) Representative Western blots showing the separation of
microsomal proteins obtained from control and DEX-treated rats. As reference standards,
0.125 pmol of rat recombinant CYP3A1 or CYP3A2 protein were loaded in lanes 1 and 2,
respectively. Lanes 3 to 5: healthy, non-ascitic and ascitic control rats; lanes 6 to 8: healthy,
non-ascitic and ascitic DEX-treated rats. (C) Amount of CYP3A2 protein in livers from
control and DEX-treated rats normalized to the signal intensity of the CYP3A2 band and
This article has not been copyedited and formatted. The final version may differ from this version.DMD Fast Forward. Published on July 16, 2014 as DOI: 10.1124/dmd.114.058511
at ASPE
T Journals on D
ecember 24, 2019
dmd.aspetjournals.org
Dow
nloaded from
DMD #58511
34
shown as fold variation compared with healthy control rats. All results are means ± S.E. of
data obtained from 8 rats per group. **p<0.01, ***p<0.001 vs. control rats of the same group;
§p<0.05 vs. DEX-treated healthy rats; #p<0.05 vs. DEX-treated non-ascitic cirrhotic rats.
Figure 5. PXR mRNA and protein expressions in control and DEX-treated rats. (A)
Experimental data showing PXR mRNA levels are reported as fold variation compared with
healthy control rats. (B) Representative Western blots showing the separation of total liver
protein extracts obtained from control and DEX-treated rats. Lanes 1 to 3: healthy, non-ascitic
and ascitic control rats; lanes 4 to 6: healthy, non-ascitic and ascitic DEX-treated rats. (C)
Amount of PXR protein in livers from control and DEX-treated rats normalized to the signal
intensity of the corresponding β-actin band (43 kDa) and shown as fold variation compared
with healthy control rats. All results are means ± S.E. of data obtained from 8 rats per group.
Figure 6. GR mRNA and protein expressions in control and DEX-treated rats. (A)
Experimental data showing GR mRNA levels are reported as fold variation compared with
healthy control rats. (B) Representative Western blots showing the separation of total liver
protein extracts obtained from control and DEX-treated rats. Lanes 1 to 3: healthy, non-ascitic
and ascitic control rats; lanes 4 to 6: healthy, non-ascitic and ascitic DEX-treated rats. (C)
Amount of GR protein in livers from control and DEX-treated rats normalized to the signal
intensity of the corresponding β-actin band (43 kDa) and shown as fold variation compared
with healthy control rats. All results are means ± S.E. of data obtained from 8 rats per group.
Figure 7. Inhibitory effect of clotrimazole on TST-6β-hydroxylase activities of pooled
microsomal preparations obtained from control (left column) and DEX-treated (right
column) rats. Results are the means ± S.E. of 3 separate determinations performed in
duplicate. S.E. is not shown where the size of data points is larger than the S.E. bar.
This article has not been copyedited and formatted. The final version may differ from this version.DMD Fast Forward. Published on July 16, 2014 as DOI: 10.1124/dmd.114.058511
at ASPE
T Journals on D
ecember 24, 2019
dmd.aspetjournals.org
Dow
nloaded from

DMD #58511
35
Table 1. Primer sequences used in this study, NCBI reference sequences and amplicon sizes
(base pairs).
Gene Forward primer Reverse primer RefSeq Size (bp)
CYP3A1 5’- cca-tca-cgg-aca-cag-aaa-tg - 3’ 5’ – ctt-tcc-cca-taa-tcc-cca-ct - 3’ NM013105 102
CYP3A2 5’ – agt-ggg-gat-tat-ggg-gaa-ag - 3’ 5’ – caa-tga-tgg-gga-aca-tct-cc - 3’ NM153312 119
PXR 5’ – caa-atc-tgc-cgt-gta-tgt-gg - 3’ 5’ – gtt-tca-tgg-ccc-ttc-tga-aa - 3’ NM052980 97
GR 5’- ggt-gat-tga-acc-cga-ggt-gt - 3’ 5’ – tgg-tat-cgc-ctt-tgc-cca-tt - 3’ NM012576 136
HMBS 5’ – ccc-ttg-tga-tgc-tgt-tgt-ttt - 3’ 5’ – tgt-tga-ggt-ttc-ccc-caa-ta - 3’ NM013168 161
β-ACTIN 5’ – gcc-acc-agt-tcg-cca-tgg-a - 3’ 5’ – ttc-tga-ccc-ata-ccc-acc-at - 3’ NM031144 163
This article has not been copyedited and formatted. The final version may differ from this version.DMD Fast Forward. Published on July 16, 2014 as DOI: 10.1124/dmd.114.058511
at ASPE
T Journals on D
ecember 24, 2019
dmd.aspetjournals.org
Dow
nloaded from
DMD #58511
36
Table 2. Biochemical tests of liver function and histological examination.
Healthy rats
Non-ascitic rats
Ascitic rats
Liver test
Control DEX-treated
Control DEX-treated
Control DEX-treated
Albumin (g/l)
40 ± 3 38 ± 6
33 ± 3§§§ 30 ± 4§§
31 ± 2§§§ 28 ± 5§§
Total bilirubin (mmol/l)
0.91 ± 0.62 1.06 ± 0.12
1.06 ± 0.64 1.40 ± 0.95§§
1.57 ± 1.28 2.40 ± 1.01§§§,#
AST (U/l)
116 ± 28 184 ± 52***
127 ± 33 197 ± 58**
168 ± 22§§§,# 240 ± 40***
ALT (U/l)
41 ± 9 185 ± 46***
58 ± 11 160 ± 36***
85 ± 24§§§,## 221 ± 3***
Ishak Score (0-6)
0 (0-0) 0 (0-0)
4 (3-5) 4 (3-5)
6 (6-6) 6 (6-6)
Results are means ± S.D. of data obtained from 8 rats per group. *p<0.05, **p<0.01, ***p<0.001
vs. control rats of the same group; §§p<0.01, §§§p<0.001 vs. healthy rats; #p<0.05, ##p<0.01, vs.
non-ascitic cirrhotic rats.
This article has not been copyedited and formatted. The final version may differ from this version.DMD Fast Forward. Published on July 16, 2014 as DOI: 10.1124/dmd.114.058511
at ASPE
T Journals on D
ecember 24, 2019
dmd.aspetjournals.org
Dow
nloaded from

DMD #58511
37
Table 3. Kinetic parameters for TST-6β-hydroxylase activities of recombinant CYPs and
microsomal preparations obtained from control and DEX-treated rats.
CYP3A1 CYP3A2
Vmax
a
Km (µM)
CLintb
Vmax
a
Km (µM)
CLintb
Recombinant CYP3A1
5.3 ± 1.0 34 ± 1 0.15 ± 0.04 - - -
Recombinant CYP3A2
- - - 7.4 ± 0.3 2.6 ± 0.1 2.8 ± 0.1
Healthy Control 984 ± 636 54 ± 25 19 ± 12 374 ± 175 2.9 ± 1.9 128 ± 64
Healthy DEX-treated 5275 ± 1091*** 45 ± 9 119 ± 32*** 1561 ± 903*** 2.7 ±1.4 643 ± 274***
Non-ascitic Control 1224 ± 325 48 ± 13 27 ± 11 508 ± 267 4.2 ± 1.6 119 ± 35
Non-ascitic DEX-treated
4302 ± 1215*** 47 ± 17 99 ± 35* 2453 ± 1302** 3.8 ± 2.5 645 ± 333**
Ascitic Control 1081 ± 298 55 ± 15 22 ± 11 468 ± 224 4.6 ± 0.6 106 ± 43
Ascitic DEX-treated 3330 ± 423***,§ 48 ± 9 72 ± 19*** 990 ± 598#,§ 2.8 ± 2.4 350 ± 211**
Results for recombinant enzymes are the means ± S.D. of three separate determinations performed in duplicate;
those for liver microsomes are the means ± S.D. of data obtained from 8 rats per group.
a Vmax is expressed as pmol/min/mg protein for liver microsomes and pmol/min/pmol CYP for recombinant
enzymes.
b CLint is expressed as µl/min/mg protein for liver microsomes and µl/min/pmol CYP for recombinant enzymes.
*p<0.05, **p<0.01, ***p<0.001 vs. control rats of the same group; §p<0.05 vs. healthy rats; #p<0.05 vs. non ascitic
cirrhotic rats.
This article has not been copyedited and formatted. The final version may differ from this version.DMD Fast Forward. Published on July 16, 2014 as DOI: 10.1124/dmd.114.058511
at ASPE
T Journals on D
ecember 24, 2019
dmd.aspetjournals.org
Dow
nloaded from

This article has not been copyedited and formatted. The final version may differ from this version.DMD Fast Forward. Published on July 16, 2014 as DOI: 10.1124/dmd.114.058511
at ASPE
T Journals on D
ecember 24, 2019
dmd.aspetjournals.org
Dow
nloaded from

This article has not been copyedited and formatted. The final version may differ from this version.DMD Fast Forward. Published on July 16, 2014 as DOI: 10.1124/dmd.114.058511
at ASPE
T Journals on D
ecember 24, 2019
dmd.aspetjournals.org
Dow
nloaded from

This article has not been copyedited and formatted. The final version may differ from this version.DMD Fast Forward. Published on July 16, 2014 as DOI: 10.1124/dmd.114.058511
at ASPE
T Journals on D
ecember 24, 2019
dmd.aspetjournals.org
Dow
nloaded from
This article has not been copyedited and formatted. The final version may differ from this version.DMD Fast Forward. Published on July 16, 2014 as DOI: 10.1124/dmd.114.058511
at ASPE
T Journals on D
ecember 24, 2019
dmd.aspetjournals.org
Dow
nloaded from

This article has not been copyedited and formatted. The final version may differ from this version.DMD Fast Forward. Published on July 16, 2014 as DOI: 10.1124/dmd.114.058511
at ASPE
T Journals on D
ecember 24, 2019
dmd.aspetjournals.org
Dow
nloaded from

This article has not been copyedited and formatted. The final version may differ from this version.DMD Fast Forward. Published on July 16, 2014 as DOI: 10.1124/dmd.114.058511
at ASPE
T Journals on D
ecember 24, 2019
dmd.aspetjournals.org
Dow
nloaded from

This article has not been copyedited and formatted. The final version may differ from this version.DMD Fast Forward. Published on July 16, 2014 as DOI: 10.1124/dmd.114.058511
at ASPE
T Journals on D
ecember 24, 2019
dmd.aspetjournals.org
Dow
nloaded from