Differential Absorption Lidar Measurements of VOC ... · Crude Oil Export and Metering This plant...
49
NPL Report COEM 13 Differential Absorption Lidar Measurements of VOC Emissions from Wytch Farm Crude Oil Gathering Stati~()n R A Robinson, A S Andrews, T D Gardiner, I J Uprichard and P T Woods ABSTRACT This report describeswork funded by Department for the Environment, Transport and Regions (DETR) and carried out by the National Physical Laboratory (NPL), with support from the National Environmental Technology Centre, to measurethe gaseous emissions from an onshore crude stabilisation plant. The measurements were made using the NPL Differential Absorption Lidar (DIAL) facility at the BP Exploration Wytch Farm Gathering Station. This site receives crude oil from local wellsites, stabilises the crude, separates LPG and natural gas, and then exports the products by pipelines. The DIAL facility was used to measurecontrolled and fugitive emissions of VOCs from all areas of the site. Measurementstook place over a 5 day campaign, from 23/3/97 to 27/3/98. The measurementswere used to determine an estimate of the total site emission factor of -0.04% +- 0.005% by mass.
Transcript of Differential Absorption Lidar Measurements of VOC ... · Crude Oil Export and Metering This plant...

.
NPL Report COEM 13
...
Differential Absorption Lidar Measurements of VOC Emissions fromWytch Farm Crude Oil Gathering Stati~()n
.....
R A Robinson, A S Andrews, T D Gardiner, I J Uprichardand P T Woods
............
ABSTRACT
.
This report describes work funded by Department for the Environment, Transport andRegions (DETR) and carried out by the National Physical Laboratory (NPL), withsupport from the National Environmental Technology Centre, to measure the gaseousemissions from an onshore crude stabilisation plant. The measurements were madeusing the NPL Differential Absorption Lidar (DIAL) facility at the BP ExplorationWytch Farm Gathering Station. This site receives crude oil from local wellsites,stabilises the crude, separates LPG and natural gas, and then exports the products bypipelines. The DIAL facility was used to measure controlled and fugitive emissions ofVOCs from all areas of the site. Measurements took place over a 5 day campaign, from23/3/97 to 27/3/98. The measurements were used to determine an estimate of thetotal site emission factor of -0.04% +- 0.005% by mass.
..........

NPL Report COEM 13
....
@ Crown copyright 1998Reproduced by permission of the Controller of HMSO
.
ISSN COEM -1369 6807
National Physical LaboratoryQueens Road, T eddington, Middlesex, TWll aL W
Extracts from this report may be reproduced provided the source is acknowledged
.......
Approved on behalf of Managing Director, NPLby D H Nettleton, Head of Centre for Optical and Environmental Metrology
......

.
NPL Report COEM 13
..
CONTENTS
.
Page
.1.
INTRODUCTION 1
.2..
OBJECTIVES OF THE MEASUREMENT CAMPAIGN 2
.3.
THE WYTCH FARM GATHERING STATION SITE 2
.
4.
..
MEASUREMENT TECHNIQUE AND METHODOLOGY 44.1 DIAL TECHNIQUE 4
4.1.1 Validation and Uncertainty of the NPL DIAl.. Measurements 44.2 METEOROLOGICAL MEASUREMENTS 54.3 AMBIENT AIR SAMPLES 54.4 VOLATILE ORGANIC SPECIES MEASURED DURlNG CAMPAIGN 5
..
5. WORK PROGRAMME 6
.
6.
.....
RESULTS FROM THE MEASUREMENT CAMPAIGN 76.1 MEASUREMENTS OF VOC EMISSIONS FROM TIm PROCESS
AREAS 86.2 MEASUREMENTS OF EMISSIONS FROM THE LPG STORAGE AND
CRUDE OIL EXPORT AREAS 96.3 MEASUREMENTS OF EMISSIONS FROM FLARE~;, THE HOT OIL
HEATER AND WATER INJECTION SYSTEM 96.4 MEASUREMENTS OF THE VOC EMISSIONS AT ~;ITE
BOUNDARIES 96.5 AMBIENT AIR ANAL YSIS 1D6.6 DETERMINATION OF THE EMISSION FACTOR ]:;OR THE SITE 1D
..
7.
.....
COMPARISON OF THE MEASURED EMISSIONS WI1~H THEES TIMA TED EMISS IONS 107.1 MEASUREMENTS OF EMISSIONS FROM PROCE:5S AREAS 117.2 MEASUREMENTS OF EMISSIONS FROM THE LPG AND CRUDE
OIL EXPORT AREAS 117.3 MEASUREMENTS OF THE VOC EMISSIONS FRaIM THE GROUND
FLARES AND THE WATER RE-INJECTION PLAI'IJT 127.4 MEASUREMENTS OF VOC EMISSIONS AT THE ~;ITE
BOUNDARIES 13SUMMARY 14
.
8.
.
ACKN OWLEDG EMENTS 15
9..
, " 1610. REFERENCES
.....

.
NPL Report COEM 13
......
LIST OF FIGURES 171. Site Map showing Potential Emission Sources 172. The DIAL Principle 173. The NPL DIAL Facility. 174. View of DIAL Facility showing Telescope 175. Flux Measurement Technique. 176. Site Map showing DIAL Measurement Locations, Lines-of-sight and
the Location of the Meteorological Monitoring Equipment. 177. Site Map showing locations of air samples 178. Hydrocarbon Concentrations from Ambient Air Samples. 17
.....
LIST OF TABLES 261. Detection Sensitivities of Species Measured 262. Summary of Meteorological Conditions 263. Summary of DIAL Measurement .Scans 264. Measurements of Process emissions on 24/03/98 265. Measurements of Process emissions on 24/03/98 266. Measurements of Process emissions on 25/03/98 267. Measurements of Process emissions on 26/03/98 268. Measurements of LPG and Crude Export emissions on 27/03/98 269. Measurements of LPG emissions on 27/03/98 2610. Measurements of Flare emissions on 23/03/98 2611. Measurements of site north boundary emissions 2612. Measurements of eastern site boundary emissions on 26/03/98 2613. Analysis of Air Samples Taken at Wytch Farm Gathering Station 2614. Total throughput figures for Wytch Farm Gatherin~~ Station 2615. Summary of results from DIAL measurements at W'ytch Farm
Gathering Station 26
........
APPENDIX 1
.
Al.lOVERVIEW OF THE DIAL TECHNIQUE 38Al.2 DESCRIPTION OF THE THEORY OF DIAL MEASUREMJENTS 38Al.3 DESCRIPTION OF FACILITY OPERATED BY NPL 39
...
APPENDIX 2
.
A2.1 DIAL DATA AUDIT TRAIL
........
.
NPL Report COEM 13
...
Differential Absorption tidar Measurements ofVOC Emissions from Wytch Farm Crude Oil Gatheri:ng Station
.
by
..
R A Robinson, A S Andrews, T D Gardiner"I J Uprichard, and P T Woods
Centre for Optical and Environmental MetrologyNational Physical Laboratory
Teddington, Middlesex Twn OL W
...1.
INTRODUCTION
..
This Report describes work carried out by the National Physical Laboratory (NPL),with support from the National Environmental Technology Centre, under fundingfrom the Department of the Environment, Transport and Regions (DETR), to measurenon methane volatile organic compound(s) (NMVOC) emissions to atmosphere fromthe BP Exploration Wytch Farm Crude Oil Gathering Station. This site gathers crudeoil from the local onshore well sites, stabilises the crude and separates liquidpetroleum gas (LPG) and natural gas components. The aim of the work was to locateand quantify emissions to atmosphere of VOCs from different clreas of the site anddetermine emission factors for NMVOCs. The Differential Absorption Lidar (DIAL)facility developed by NPL was used in a five day measur4~ment campaign' toundertake these measurements.
.......
AEA Technology provides technical policy support to the Department ofEnvironment, Transport and Regions (DETR), Air Quality Division, on a range ofissues relating to atmospheric emissions and air quality in the U:K. One of the majorareas of this programme is to provide valid estimates of the emissions of volatileorganic compounds (VOCs) to atmosphere [1]. These VOC emissions arise from awide variety of industrial sectors. Work to date has shown that the oil andpetrochemical industries contribute significantly to the total UK emissions of VOCs,but the emission estimates for these industries are of low data quality. Recently,measurements have been made with a mobile remote-sensing differential absorptionLidar facility developed by the National Physical Laborator;{ (NPL) which hasprovided more accurate data on some of the sources of emissions within oil refinery,petrochemical plant [2, 3] and Retail Petroleum Filling Stations [4, 5]. As aconsequence, a constructive dialogue has been established with representatives ofthe refinery and petrochemical industries, with resulting improvements in theirestimated emissions.
..........
The emissions from the industry involved with the upstream supply of crudeproduct, however, still has significant uncertainties and requires additional research.The current emission factors recommended by United Kingdom Offshore OperatorsAssociation (UKOOA) {6] for the UK's Onshore Oil Terminals are based on APIfigures for onshore terminals obtained for American installation.." in 1980. There havebeen no recent measurements of total VOC emissions from oil te:rminals[7].
.....

.
NPL Report COEM 13
..
The measurements described within this report have been undertaken in order toimprove the emission inventory for such facilities.
..
2. OBJECTIVES OF THE MEASUREMENT CAMPAIGN
.
2.1 To measure, using NPL remote monitoring technology, the total fluxes ofvolatile organic compounds emitted to atmosphere by a Crude Oil Terminalwhich processes crude oil to stabilise it and to produces LPG and sales gas for
export.
...
2.2
.
To compare the measured emission fluxes with the industry's estimationtechniques [6,7].
.
2.3 To use the results of these VOC flux measurements to improve the UKinventory of VOC emissions from identified process units.
..
Produce a report with content suitable for inclusion in the Task ForceEmission Inventories (TFEI) Atmospheric Emission Invl~ntories Guidebookwhere appropriate [8].
L.4...3.
THE WYTCH FARM GATHERING STATION SITE
.
Figure 1 is a map of the Wytch Farm Gathering Station site, with key areashighlighted. It is important to note that all directions given in this report are withrespect to site north.
...
This facility, operated by BP, uses plant which is typical of the onshore oil terminalsin the UK (Wytch Farm, Flotta, St. Fergus, Mossmoran, and Sullom Voe ). The totalemissions of VOCs from the plant at the site were monitored, together withemissions from on site storage. The site also utilises ground flares, and these weremonitored as a part of the exercise. The results of the measurement work will beused to compare with the emission estimates, provided by industry, which arecurrently used in the National Atmospheric Emissions Inventory (NAEI) [9].
.....
For the purposes of this study the site was divided into five principle areas :-
...
Process plant (including stabilisation, power generation and water
treatment)This plant includes the de-ethaniser, de-butaniser and de-propaniser, gascompression plant, refrigerant plant, odourisation plant, trle gas turbine powergeneration plant and the water treatment system. There afle potentially fugitiveemissions from all the hot/ pressurised systems, from operl settling pools in thewater treatment area and the site discharge interceptors. There is one stackassociated with each of the two gas turbines.
...... 2.

.
NPL Report COEM 13
....
LPG StorageThis area contains 12 covered pressurised LPG bullets and associated plant.Emissions from the storage tanks are expected to be low I however the highpressure plant associated with them may be a source of emissions.
....
Crude Oil Export and MeteringThis plant area, which is close to the LPG plant, is associated with the meteringof crude oil exported from the site. There is the possibility of fugitive emissionsfrom the high volume metering and valve systems in this plant.
....
Water InjectionThere is a small potential for emissions from re-circulated water which maycontain low concentrations of hydrocarbons.
...
FlaresThe 3 flares at Wytch Farm, are ground flares. Each flare is associated withdifferent process units and these are known as the low temp (LT), low pressure(LP) and high pressure (HP) flares respectively. They each consist of a set ofburners contained within an open topped box. There is a potential for emissionsof unburned hydrocarbons if the burners are not operating at high combustionefficiency. The burners are continuously purged with fue! gas to prevent thebuild-up of explosive mixtures.
.....
The above sources can be categorised using the Selected Nomenclature for AirPollution 1994 (SNAP94) [8]. Most of the sources are categorised under SNAP groupOS, 'Extraction and Distribution of Fossil Fuels' , more specifically 05.02.01 -'Extraction, First Treatment and Loading of Liquid Fossil Fuels -Land BasedActivities'. Combined oil and gas extraction facilities are explicitly. grouped under thiscode. This excludes flaring which is included under SNAP code 09.02.08 andcombustion processes which are included under SNAP code 01.05 more specificallythe main on-site combustion sources are the gas turbines which are included underSNAP code 01.05.04 .
......
The TFEI Atmospheric Emission Inventories Guidebook [8] lists some emissionfactors for sources under the above categories, however few are relevant to WytchFarm. Under SNAP code 05.02.01 the guidebook lists measured emissions forcombined facilities, however these only cover vented emissions. Wytch FarmGathering Station does not vent any emissions, all controlled emissions are flared(although there are vented emissions at the associated well sites). The guidebookalso quotes an equation for fugitive emissions which is very general and is based onoffshore platform operations.
.......... 3.

.
NPL Report COEM 13
..
4. MEASUREMENT TECHNIQUE AND METHODOLOG'Y
..
DIAL TECHNIQUE4.1
.......
The National Physical Laboratory (NPL) has, for a number of years, been involvedwith the development of new techniques for remote measurements of industrial andurban pollution, and for monitoring air quality [10, 11, 12]. These techniques operateon spectroscopic principles using wavelength-tunable sources. 1.'hey rely on the factthat each gaseous species in the atmosphere has a characteristic a.bsorption spectrum,
and that the wavelength of the source can be chosen so that it coincides with one
feature of this spectrum. Then, tuning the source wavelength on and off the spectral
absorption feature and measuring the absorption that occurs, allows the concentrationof the selected species to be determined. The performance of these remote techniqueshave been extended continually at NPL, particularly in terms of the number of gaseousspecies that are detectable, their detection sensitivities, and the Jmeasurement range.Field trials have been carried out regularly to demonstrate the extending capabilities of
these new measurement techniques. One of these remote monitoring facilities uses a
principle similar to optical radar, known as differential-absorption lidar (DIAL).
.....
A full description of the DIAL facility developed and operated by NPL is given inAppendix 1. The following section describes some of the sources of uncertaintypresent within this measurement campaign.
...
Validation and Uncertainty of the NPL DIAL Measurements4.1.1
..
There are a large number of different sources of uncertainty \ll/hich can effect theaccuracy of flux measurements made using the DIAL technique. Some of the moresignificant of these are listed below:
..
-the meteorological conditions experienced at the time of measurement.
.
-the accuracy of the absorption coefficients used for a particular species.
.
-the concentration levels of the target species present in the atmosphere.
..
-the presence of any interfering species.
-the accuracy of the wind field measurements.
.All of these factors, and more, need to be taken into account when determining theuncertainty in a particular measurement.
... 4.

.
NPL Report COEM 13
..
A number of flux validation experiments have been undertaken with the NPL DIALfacility I some of which are described in Appendix 1. These experiments have indicatedan accuracy of between 10% and 20% for flux measurements made with the NPL DIAL
facility.
...
4.2 METEOROLOGICAL MEASUREMENTS
..
Meteorological measurements of wind speed and direction were made throughout theperiod. Figure 6 shows the location of the fixed meteorological station which wasoperated continuously throughout the campaign. This mast moUIlted two monitoringarms at 15 m and 8m elevation and measured wind speed and dirE~ction at each height.A third wind station, installed on a 15 m mast attached to the DIAL facility, was alsoused whenever DIAL measurements were being made.
....
The results of these meteorological measurements were combined with the DIALconcentration measurements to generate the mass flux results desc:ribed in section 6.
..
AMBIENT AIR SAMPLES4.3
..
A small number of ambient air samples were taken at various locations around the siteto determine the compositional distribution of volatile organic compounds (VOCs) ateach location. The samples were drawn into previously-evacuated gas cylinders whichhave specially-passivated internal walls to ensure that their interiors are inert to theVOCs being sampled. The sampling procedure entailed opening the valve of thecylinder so that the flow rate into the 5 litre capacity cylinder was about 1 1/ minute.The sampling time for a particular cylinder was therefore usually 5 minutes Thecylinder valve was then closed and the contents were analysed at NPL using gaschromatography (detection sensitivity achievable -2 parts iIl lOll by volume).Calibration was carried out using internationally-validated gravimetricmulticomponent VOC standards held at NPL. This method thus provides short-termsnapshots of the concentrations of a very wide range of hydrocarbon species present inthe atmosphere. The results obtained during this exercise are discl.lssed in Section 6.5.
........
VOLA TILE ORGANIC SPECIES MEASURED DURING CAMPAIGN
.
4.4
.
The accuracy of the DIAL technique depends critically on the wav'elengths selected fora given measurement application. These wavelengths are chosen to avoid interferencedue to gaseous atmospheric species which may potentially have overlapping spectraand to avoid spectral interference from other gaseous pollutants which may be
present.
...Before any field measurement exercise is carried out, a list of possible species emittedfrom the selected site is studied and spectral regions unique to the target molecules arechosen for the measurements. An in-house spectroscopic facility at NPL enables targetwavelengths for a large number of gaseous species to be selected j:rom their absorption
.... 5.

.
NPL Report COEM 13
..
coefficients, which are available on a comprehensive database. The gas mixtures usedto produce this database are generally prepared gravimetrically at NPL.
..
For the measurements at Wytch Farm the DIAL system was tuned to wavelengthswhich are sensitive to a range of hydrocarbons typical of emissions from industrialfacilities. The exact wavelengths were carefully selected to give mass equivalentabsorptions for each of the alkanes (C3-C7) which were nearly identical. In this waythe measurement of total mass of detectable hydrocarbons is not sensitive to therelative concentrations of these hydrocarbons. The absorption coefficient used wasderived from measurements of the absorption spectra, at thes4~ wavelengths, of aknown mass of petroleum vapour. This absorption coefficient is then adjusted to takeinto account the mass of the species present in the vapour to which the DIAL system,at these wavelengths, has a lower sensitivity.
......
For provisional data analysis it was assumed that the hydroca.rbon mixture beingmeasured had a similar ratio as petroleum vapour, of detected to non-detectedhydrocarbons. In most situations this assumption is valid. The results were thencorrected using data from the analyses of ambient air samples taken at Wytch Farm(see Section 4.3). This correction particularly took into account the relatively highlevels of ethane which were present, to which the DIAL system had a lower responseat the chosen wavelengths, and therefore resulted in a higher proportion by mass ofundetected hydrocarbons for a given measured absorption. The results quoted in thisreport are the corrected values. A different correction has been applied for each sourcemeasured, based on the different air samples taken. For the boundary fencemeasurements, where a number of sources contributed, an average correction has beenapplied. The correction does not take into account the levels of methane present, whichwas not measured by the DIAL system as it was configured at Wytch Farm nor by theambient air analyses. (Note, the NPL DIAL facility is capable of measuring methaneemissions specifically -but this was not part of the requirements for this project). Thefigures quoted in this report are in units of mass of total NMVO<: (irrespective of therelative concentrations of individual VOCs) .The speciation may be obtained from theambient air analysis.
............
The process unit contains plant associated with coolant processing. The spectra of therefrigerants used in this process were checked and no potential interference wasfound. There were no other potentially significant sources of interference at, or near,the site.
...
Table 1 gives the DIAL measurement wavelengths and the approximate detectionlimits under the conditions experienced during the measurement campaign.
..
WORK PROGRAMME5.
.A programme of work was defined, in collaboration with AEA Technologyand in consultation with DETR, to employ NPL remote monitoringtechnology to determine, for Wytch Farm Gathering Station, the emissionfactors of volatile organic compounds.
5.1
.... 6.

.
NPL Report COEM 13
..
5.2 A prellininary site visit took place on 3/3/98. During this visit the scope of themeasurements was agreed with Mr R Finney of BP. A site survey also tookplace to identify suitable monitoring locations.
..
5.3 A measurement exercise was carried out at the site using the NPL DIALfacility. This determined:
..
the fluxes of volatile organic compounds emitted to atmospherefrom identified plant on the BP site, including valve andswitching areas;
..
the fluxes of volatile organic compounds emitted to atmospherefrom storage areas on site;
..
the fluxes of volatile organic compounds emitted to atmospherefrom flaring areas of the site;
..
the total fluxes of volatile organic compounds emitted toatmosphere from the whole site;
..
The five day measurement campaign took place between 23/3/98 and 27/3/98.
.
The required meteorological parameters, including wind speed and direction, werelogged continuously throughout the measurement period.
..
Preliminary results of the DIAL measurements were reviewed in near-real time byNPL. This information was used to plan the ongoing measurement strategy.
..
As noted in Section 4.3 ambient air samples were taken at various locations around thesite (see Figure 7), and subsequently analysed at NPL using gas chromatography.
..
RESULTS FROM THE MEASUREMENT CAMPAIGN6.
.
A total of 79 measurement scans were carried out during the measurement period.Each scan measured the concentration distribution of VOCs in a vertical plane definedby the measurement line-of-sight. Table 3 lists all these scans, and also contains thefollowing information:
...
the date of the measurement;
..
the location of the DIAL facility. Each location is shown in Figure 6;
.
the data me containing the scan results;
.the scan ill within the data file;
.the time of the scan;
.. 7.

.
NPL Report COEM 13
..
the measurement line-of-sight (LoS) along which the concentrationdistribution was being measured -these lines-of-sight are also shown inFigure 6.
..
the vector-averaged wind speed and wind direction during the scan. Thisdata is taken from the 15 m and 8 m elevation wind measurements locatedat fixed sites (location M on Figure 6). The 15 m elevation wind directionwas generally used as being most representative of wind directions acrossthe plant.
....
The results of the measurements are presented in sections 6.1 to 6.4 below. Each tableshows the date and time of the individual measurements made of the emissions from aparticular area, and gives VOC mass emission fluxes. The individual flux results havethen been averaged to give a mean flux for that measurement set.
...
An entry in the flux column of 'sat.' indicates that a mass flux could not be determinedfor a particular measurement due to intermittent saturation of the backscattered DIALsignal. This had a variety of causes but was mainly due to rain or mist. It is importantto note that this does !1Q! indicate a high concentration of the measured species, justthat enhanced backscatter had saturated the detector so that the differential absorptioncould not be accurately calculated.
....
The average values obtained for the emissions from each plcmt area have beenannualised. These values have been obtained by assuming a pro-rata emission overthe year. To achieve this, it has been assumed that the emissions measured during thiscampaign are representative of the average operating state of the plant. It is alsoassumed that the site throughput is representative of normal operations. Thisassumption should be recognised when interpreting the annualised DIAL figures.
....
The published annual throughput for Wytch Farm in 1996 was 4728,000 tonnes peryear, which is equivalent to 539726 kg/hour. Assuming the samE~ annual throughputfor 1998, and comparing this figure with those in Table 14, we carl see that during theperiod of the measurements the site was operating at 9% abov'e the 1996 pro-ratathroughput. The annualised figures calculated within this Report have not beencorrected for this.
.....
The following table summarises the meteorological conditions wblich occurred duringthe measurement campaign.
..
MEASUREMENTS OF VOC EMISSIONS FROM THE PROCESS AREAS6.1
.
Several sets of measurements were made of emissions from the main process areas ofthe site. This area included the stabilisation plant, the power generation plant and tothe south east, the waste-water treatment area.
...Tables 4, 5, 6 and 7 present the results of these measurements. Each set was made on adifferent day under different meteorological and process conditions. The averages ofeach set of measurements are 18.4 :!:3.2 kg/hr, 37.5 :t5.4 kg/hr, 16.9:t 2.0 kg/hr and
.. 8.

.
NPL Report COEM 13
..
25.2 :t 1.3 kg/hr respectively. It is possible the last value contains a contribution fromthe LPG and crude export areas. These figures correspond to emissions of 0.003 -0.006percent (by mass) of the total plant crude throughput. Thle average of thesemeasurement sets is 24.5:t 4.7 kg/hr. In producing this average it has been assumedthat these measurements are samples of a population representing; the mean operatingstate for the plant. The uncertainty in this figure is thus derived from the spread of themean values of the separate measurement sets. The spread of tllese values is largerthan the individual uncertainties of each mean value which inlplies that there areprocess and other factors which vary over timescales greater tharl the periods of eachmeasurement set (typically from half an hour to 2 hours). The average emissions fromthe process area are equivalent to an annual emission value of 215:t 42 tonnes ofNMVOC.
........
Further sets of measurements along the eastern boundary indicate low localised«3kg/hr) emissions from the waste-water treatment area, though it is was notpossible separate and quantify them.
...
6.2 MEASUREMENTS OF EMISSIONS FROM THE LPG STORAGE ANDCRUDE OIL EXPORT AREAS
..
Tables 8 and 9 list the results of measurements of the emissions b'om the LPG storageand crude export areas. Table 9 lists measurements which include a minimalcontribution from the crude export plant. These give an emission value for the LPGstorage of 34.5 :t 2.7 kg/hr. Subtracting this figure from the measurement of thecombined emission from LPG and crude export given in Table 9 produces an estimateof 75.2:t 14.8 kg/hr for the crude export plant alone. These figures are equivalent to anemission of 303 :t 24 tonnes per year from the LPG storage and 658 :t 130 tonnesNMVOC per year from the crude oil export plant.
......
6.3 MEASUREMENTS OF EMISSIONS FROM FLARES, THE HOT OIL HEATERAND WATER INJECTION SYSTEM
..
Table 10 lists measurements of emissions from the LT flare wInch proved to be alocalised and significant source of VOC emissions and was active:ly flaring at the timeof the measurements. The average of these measurements was 1013.9:!: 5.7 kg/hr. Twosingle measurements confirmed the low level of emissions from the LP and :f-n:> flareswhich were not actively flaring during the measurement perjiod but were beingpurged with a constant flow of fuel gas. These two flares have ,emissions which areeach approximately 5 kg/hr. No significant emissions were attributable to the hot oilheater.
......MEASUREMENTS OF THE VOC EMISSIONS AT SITE BOUNDARIES6.4
.Two sets of measurements were made along the site boundaries. One set along thenorthern edge, is summarised in Table II, and one along the eas1:ern edge, is given in
.. 9.
.
NPL Report COEM 13
..
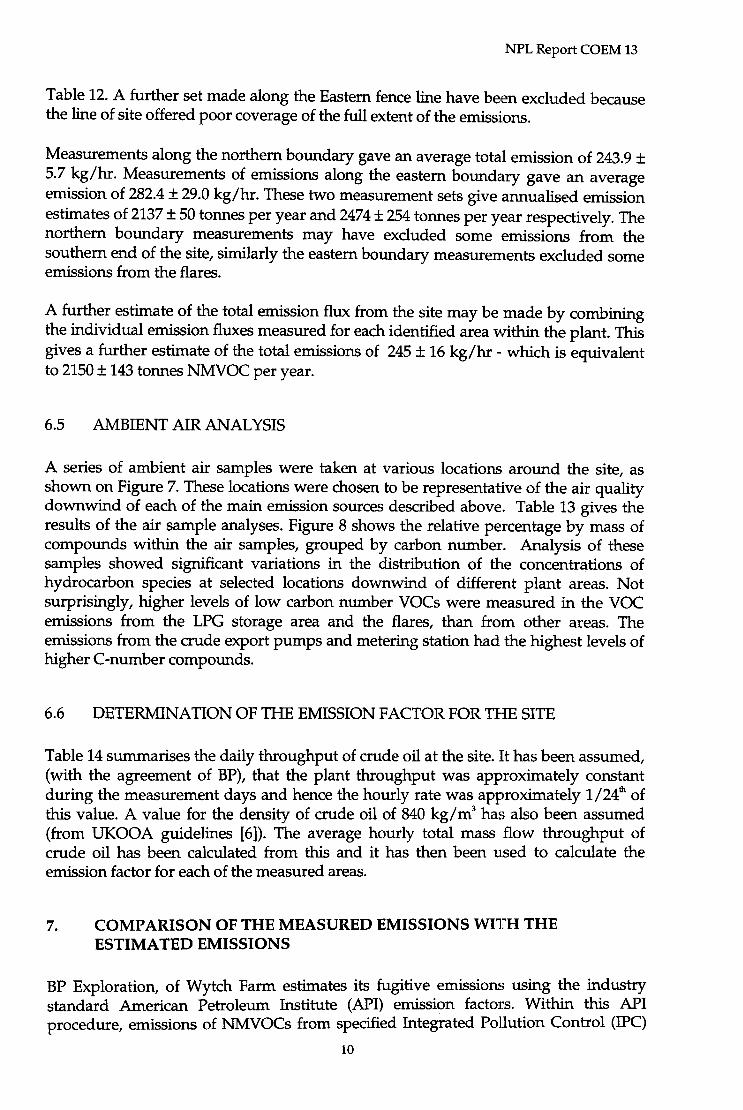
Table 12. A further set made along the Eastern fence line have been excluded becausethe line of site offered poor coverage of the full extent of the emissions.
..
Measurements along the northern boundary gave an average total emission of 243.9 ::t5.7 kg/hr. Measurements of emissions along the eastern boundary gave an averageemission of 282.4::t 29.0 kg/hr. These two measurement sets give annualised emissionestimates of 2137 ::t 50 tonnes per year and 2474 ::t 254 tonnes per year respectively. Thenorthern boundary measurements may have excluded some emissions from thesouthern end of the site, similarly the eastern boundary measurements excluded someemissions from the flares.
.....
A further estimate of the total emission flux from the site may be made by combiningthe individual emission fluxes measured for each identified area vvithin the plant. Thisgives a further estimate of the total emissions of 245::!: 16 kg/hr -which is equivalentto 2150::!: 143 tonnes NMVOC per year.
...
AMBIENT AIR ANALYSIS6.5
..
A series of ambient air samples were taken at various locations around the site, asshown on Figure 7. These locations were chosen to be representative of the air qualitydownwind of each of the main emission sources described above. Table 13 gives theresults of the air sample analyses. Figure 8 shows the relative percentage by mass ofcompounds within the air samples, grouped by carbon number. Analysis of thesesamples showed significant variations in the distribution of ftle concentrations ofhydrocarbon species at selected locations downwind of different plant areas. Notsurprisingly, higher levels of low carbon number VOCs were measured in the VOCemissions from the LPG storage area and the flares, than from other areas. Theemissions from the crude export pumps and metering station had the highest levels ofhigher C-number compounds.
.......
DETERMINATION OF THE EMISSION FACTOR FOR THE SITE6.6
..
Table 14 summarises the daily throughput of crude oil at the site. It has been assumed,(with the agreement of BP), that the plant throughput was approximately constantduring the measurement days and hence the hourly rate was approximately 1/24th ofthis value. A value for the density of crude oil of 840 kg/m3 ha~; also been assumed(from UKOOA guidelines [6]). The average hourly total mass flow throughput ofcrude oil has been calculated from this and it has then been u.sed to calculate theemission factor for each of the measured areas.
.....
COMPARISON OF THE MEASURED EMISSIONS Wl1rH THEESTIMATED EMISSIONS
7.
..BP Exploration, of Wytch Farm estimates its fugitive emissioru; using the industrystandard American Petroleum Institute (API) emission factors. Within this APIprocedure, emissions of NMVOCs from specified Integrated Pollution Control (IPC)
10...

.
NPL Report COEM 13
..
regulated sources (eg Gas Turbines, Ground Flares and the Hot Oil Heater stacks) arederived from fuel gas usage by application of the appropriate IPC-assigned emissionfactor. These emission estimates are determined in tonnes per year and these areannually verified by external auditors as required by the site's EMAS registration. Theresults are then reported to the Environment Agency and BP Group for publication inBP Facts and hence are available in the public domain.
....
The measured values have been annualised. In order to compare the measuredemissions with current estimation teclmiques. To convert to annual figures, the hourlyemission values have been multiplied pro-rata as discussed in Section 6, and thisshould be noted when interpreting the annualised figures. The following Sectionspresent a comparison of the results obtained from annualised measured emissions andfrom the API calculated estimated values and the advantages arld limitations of thetwo approaches are also summarised.
....
7.1 MEASUREMENTS OF EMISSIONS FROM PROCESS AREAS
..
BP Wytch Farm's internally reported fugitive emissions from the process areas of 157.1tonnes per year of NMVOCs in 1995, with a calculated reduction of ~ 18% to 128.0tonnes per year of NMVOCs in 1997. There are no controlled ve]:lted emissions fromthe plant area, since all process vents are piped to the flares.. These figures arecalculated from field screening values obtained in accordance wilth US EP A Method21, using the API correlation equations, in keeping with the recommendations ofUnited Kingdom Offshore Operators Association (UKOOA) and t:he BP Group. Theyare therefore dependent on the total crude oil throughput of the plimt.
.....
There are two stacks within the process area which vent flue gas from the gas turbines.The reported emissions in 1997 were 9.15 tonnes per year of ~JMVOCs, calculatedusing the IPC Licence emission factor of 0.00042 tonnes per torme of fuel gas. Thefigure of 9.15 tonnes per year is equivalent to 1 kg/hI which is below the DIALdetection limit achievable during this campaign. There were no mLeasurable emissionsobserved from this stack during the monitoring campaign I which is consistent withthis.
.....
The NPL DIAL measurements produced an average annualised value of 215 ::t 42tonnes per year for the process area. This includes emissions from the gas turbines, thestabilisation plant, gas compression plant, gas odourisation and refrigerant plant. Thisfigure is similar to the reported calculated annual emission estirnate for 1995 of 157tonnes per year. The ratio of DIAL measured values are equivalerlt to a loss of 0.004%(by mass) of crude oil throughput, with the assumption that all other crude oil passesthrough the process units.
.....
MEASUREMENTS OF EMISSIONS FROM THE LPG AND CRUDE OILEXPORT AREAS
7.2
..The reported emissions from the LPG storage at Wytch Farm Gatl1.ering Station in 1995were 16 tonnes per year, calculated using the API factors. It shotLld be noted that the
.. 11.

.
NPL Report COEM 13
..
emissions from the crude oil export plant are included in the reported plant fugitiveemissions estimate but are not reported specifically.
..
The DIAL estimates are equivalent to an annual NMVOC emission of 303 :t 24 tonnesper year for the LPG store and 658 :t 130 tonnes per year from the stabilised crude oilexport plant. The figure for loss from the LPG storage is significantly higher than theAPI calculated values. During the period of measurements the ,contents of the LPGstorage was approximately 1111 tonnes of LPG (both butane and propane). The DIALmeasurements of LPG storage are equivalent to an emission of 0.83 tonnes of NMVOCper day, which is equivalent to a loss of 0.07% (by mass) of the total LPG storage. Theemissions from crude export plant are equivalent to a loss of 0.013% (by mass) of totalplant throughput (this calculation does not take into account the losses and removalsfrom the crude volume before it reaches the export plant. However the correctionfrom total throughput to exported volume is considered negligible (ie <0.5%) ).Fugitive losses associated with export of stabilised crude would be expected to besmall, given that the more volatile components have been removed prior to this phase.This has been verified by previous fugitive emissions surveys ,at Wytch Farm andother similar sites.
.
EJJ
........
7.3 MEASUREMENTS OF THE VOC EMISSIONS FROM THI~ GROUNDFLARES AND THE WATER RE-INJECTION PLANT
..
The annualised total emissions of NMVOC from the flares at Wytch Farm GatheringStation which were derived from the NPL DIAL measurements are 974 ::!: 51 tonnes peryear (2.67 ::!: 0.1 tel day) .This assumes however, that active flaring is occurring at alevel similar to that from the L T flare (which had measured emis~;ions of NMVOCs of100.9 kg/hr or 02.42 tel day during the measurement period) continuously throughoutthe year; this however is not necessarily the case. Operational flal-ing occurs at WytchFarm only during trips, shutdowns and the start-up after shutdown. For theremainder of the time, the flares are purged with low volumes of fuel gas, which willhave emissions similar to those recorded for the LP and HP units during the DIALexperiment i.e. 5kg/hr. NMVOC per flare (0.12 tel day).
......
The reported estimated emissions of NMVOCs in 1997, calculated from actual gasflared using the emission factor assigned by the site IPC Licence was 487 tonnes peryear. This is comfortably within the IPC consent level of 1020 tonnes per yearNMVOCs.
...
The metered flare fuel gas rate during the period of the DIAL flare measurements was29.9 tonnes per day. Using the site NMVOC emission factor for ground flare efficiencyof 0.0203 te/te produces an emission estimate equivalent to 222 tonnes NMVOC peryear. The DIAL measurements correspond to an emission factor of 8.9% NMVOC bymass for all the flares.
...The breakdown of metered gas to each flare was 6.9 tel day to the LP flare, 14.9tel day to the LT flare and 7.7 telday to the ffi> flare. The DIAL measurements of eachflare produce emission factors of 16.2% NMVOC by mass for the L T flare and 1.6%
... 12.

.
NPL Report COEM 13
.
NMVOC by mass from the LP and HP flares. These figures highlight the relativeinefficiency of the L T flare during flare operations.
.
Previous studies at Wytch Farm in Summer 1997 showed there to be damage toseveral flare burner units causing combustion inefficiencies. Defective burner unitswere replaced during a scheduled site shutdown in May 1998. Thus additionalperformance improvement is likely in the short term. Wytch Farntl in accordance withthe policy of the BP Group, is actively pursuing measures to mirliInise flaring and toreduce emissions associated with flaring and is converting the gro"und flares to a purgewith inert nitrogen during 1998.
...
7.4 MEASUREMENTS OF VOC EMISSIONS AT THE SITE BOUNDARIES
.
The prevailing wind direction in the locality is from the south-west and this was truefor the DIAL measurement period. Hence, to obtain estimates of the total emissionsburden from the Gathering Station, measurements were taken downwind of the site,beyond the northern and eastern boundaries. The two sets of boundary fencemeasurements gave annualised total site NMVOC emissions of ~~137 :t 50 tonnes peryear at the northern boundary and 2474:!: 254 tonnes per year at the eastern boundary.The measurements at the north boundary will not have included all emissions fromthe southern end of the site, similarly the measurements of the eastern boundary willnot have included emissions from the flares. The estimated emissions of NMVOC in1997 from the Wytch Farm Gathering Station were 504 tonnes per year, calculatedusing industry-standard emission factors. This is a factor of 4-5 lower than the DIALvalues. The average total site emissions burden derived from the two DIAL estimatesis 2137:t 143 tonnes NMVOC per year. This is equivalent to a totcU mass loss of 0.04%NMVOC by mass of the total crude throughput.
......
The total reported emissions for the site in 1996 were 1098 tonnes NMVOC, including941 tonnes NMVOC reported under IPC (flares, hot oil heater arLd gas turbines) and157 tonnes NMVOC reported as estimated fugitives derived from API factors. Thetotal site production was 4728 ktonnes. The estimated total site emission factor,combining all separately estimated emissions was 0.0235.
........ 13.

.
NPL Report COEM 13
..8.
SUMMARY
..
The emissions monitored at Wytch Farm are summarised in thE~ following Table 15,which gives the total annualised emission figures and the emission factors (intonne/tonne) for each area, together with its SNAP code.
..
Table 15: Summary of results from DIAL measurements at Wytch Farm GatheringStation
..
Area Snap Code AnnualisedEmission(tonnes)
Currentemission factor(tonne/tonne)[IPC]or(kg/hr.)
[API]
.
Emission fac:torby mass 1
(tonne/tonne)
..
Process( inc gas
turbines)
05.02.01(01.05.04)
215 :t 42 0.00004 Gas turbines0.00042 [ !PC];
.
Valves 9.76xlO-OS.(SV)O.96[API]3)
...
05.02.01Crude Export 658:t 130 0.00013 Valves 9.76xlO-05(SV)O.96 [API]
Flares 09.02.08 974:t 51 (total) Ground Flares0.0203 [IPC](of flared gas)
..
0.089 (ofmetered gas toflare)0.00019 (of total
sit~oughput)LPG storage 05.02.01 303 :t 24 0.0006 (of totcu
LPG stora~e) -Valves 9.76xlO-05(SV)O.96JNIl
.
1101.05.II Hot Oil Heater <5<5
I 0.00042 fIPCl,
.
" Water iniection I N/A
....
1 The emission factor is by m-ass of total site throughput unless otherwise stated,
derived from the DIAL measured NMVOC emission values.2 This is the current emission factor used at BP Wytch Farm.3 The total process fugitives calculated for 1996 using the API factor were' 157 tonnes/year
NB API specifies separate correlation factors for different plant components i.e. valves,connections, compressors etc.SV refers to screening value derived from survey according to US EP A Method 21.
.
The following bullet points surnmarise the results of this measureIJtlent campaign.
..
In general the DIAL measurements produced higher NMVOC: emissions than theestimated values, although the figures were generally of the SaJl1e order.
.
Comparison with existing estimates within the TFEI Guidebook is difficult as nofigures for this type of on shore facility have been produced. Data exist for ventingactivities, as estimates per facility. However at Wytch Farm all controlled releasesare flared, so no venting was measured.
14....

.
NPL Report COEM 13
...
The emission estimates are calculated by BP using two techniiques; IPC factors forflares, hot oil heaters and gas turbines and API factors, bilged on componentcounts, for process fugitives.
...
The DIAL measured the total emissions of NMVOC by plant area, some of theseareas contained both fugitive and !PC regulated emission sources.
...
The major sources identified were process fugitives, including crude oil exportfugitives, LPG storage and processing fugitives and losses dule to flare efficiency,particularly from the L T flare.
....
The NMVOC emissions measured by DIAL were equivalent to 0.04% NMVOC bymass of the total throughput of crude. This is comparable to the sum of the 1996estimated emissions which were 0.023% NMVOC by mass of the total throughputof crude.
...
9. ACKNOWLEDGEMENTS
..
The authors of this Report would like to acknowledge the Department of theEnvironment, Transport and Regions, Air Quality and Environment Division for theirsponsorship of this important research activity. We would also like to acknowledgethe help and support of the staff at BP Exploration Wytch Farm Gi~thering Station andRob Finney of BP Group HSE, Sunbury for valuable input into this report. We wouldalso like to thank Mike Woodfield and his colleagues at AEA Tec:hnology, NETCENfor their interest and support.
....
The NPL staff who have been involved in this project areRod RobinsonTony AndrewsTom GardinerIan UprichardPeter WoodsHansa d'SouzaDes Alphonso
............. 15.

.
NPL Report COEM 13
..
10. REFERENCES
..
[1] Emission of VolatiIe Organic Compounds from Stationary sources in UK. N RPassant, WSL Report LR990, December 1993.
.
[2]
.
Measurements at a Chemical Works to improve the UK Elnission Inventory ofVolatile Organic Compounds. P T Woods et aI, NPL Report QmlO8. (Includesemission from road tanker operations).
..
[3] A Determination of the Emissions of Volatile Organic Compounds from OilRefinery Storage Tanks. P T Woods et al, NPL Report DQM(A)96, 1993.
.
[4] Measurements of the Emissions of Volatile Organic Compo'unds Produced by aRetail Petrol Filling Station, R A Robinson et aI, NPL Report QMl12, October1995. (Includes emission measurements of Road Tanker Operations).
..
[5] Measurements of the Emissions of Volatile Organic CompOtunds produced by aRetail Petrol Filling Stations Fitted with Vapour Recovery, R A Robinson, et aI,NPL Report QMS 110, August 1996.
..
[6]
..
[7]
Guidelines on Atmospheric Emissions Inventory, UK Offshore OperatorsAssociation (Environment Committee), 1995.
Atmospheric Emissions from UK Oil and Gas Exploration and ProductionFacilities in the UK Continental Shelf Area, Brown and Roo1: Environment, 1993.
..[8]
Atmospheric Emission Inventory Guidebook, EMEP -Co-operative Programmefor Monitoring and Evaluation of the Long Range Transmission of AirPollutants in Europe and CORINAIR -The Atmospheric Emission Inventory ofEurope. Available at http://www.eea.dk/aegb/Default.htm,15 July 1998.
..[9]..
rl01
..
[11]
.
National Atmospheric Emissions Inventory, Available athttp:/www.aeat.co.uk/netcen/ airqual/ emissions/welcoml~.htm1, 15 July 1998.
P T Woods, Remote and Open-path Teclmiques for FugitivE~ Loss MonitoringGas Detection and Air Pollution Measurements. Proc. Seminar on ProcessFugitive Emissions, IBC Ltd, London, November 1993.
P T Woods, Remote Sensing Teclmiques for Gas Detection, Air Pollution andFugitive Loss Monitoring, Jour. Air and Waste Management Associated, SpecialPublication M, 3-29,1992.
.
[12] DIAL Measurements for air pollution and fugitive loss monitoring. R ARobinson et aI, Proceeding of Air Pollution and Visibility Measurements,Volume 2506-17, June 1995.
..
Calibration of DIAL and open-path systems using external i!?;as cells. M J TMilton et aI, Proceedings of Air Pollution and Visibility Measurements, Volume2506-85, June 1995
)3]
..... 16.

.
NPL Report COEM 13
..
LIST OF FIGURES
..
1. Site Map showing Potential Emission Sources.
..2.
The DIAL Principle.
..
The NPl DIAL Facility.3.
..
4. View of DIAL Facility showing Telescope.
.
Flux Measurement Technique.5.
..
Site Map showing DIAL Measurement Locations, Lines-of-sight and theLocation of the Meteorological Monitoring Equipment.
6....
Site Map showing locations of air samples,
7..
Hydrocarbon Concentrations from Ambient Air Sampl.~s.
.
8.
.............. 17.

8
NPL Report COEM 13

.
NFL Report COEM 13
..
aj~tJ=1-4~..,J-<0
QJ~~
....
N
....................... 19.

............................ 20
NPL Report COEM 13


.
NPL Report COEM 13
.................
=OJ
8OJ""=(I)IUOJ
~><=-
~
....
1ri
........... 22
.

.
NPL Report COEM 13
.......
.
........
-+-..c+-".Q> cU)Q)
oE(/)Q.Q) 's.~ 0--JLlJ
cliO)C C0 .~=t= 0
o:t=() C0 0-J~-+-c-Q) 8E --
Q)O),,-.Q
::J 0(/) "-0 0
Q)!;12~ Q)-J~~"'O0 Q)0) -~
c'f---Q)
~..co-+-
..c'f-(/) 0
Q.c0 .Q
~oQ) ()
:t= 0U)-J
-Q)'-O..cQ)-+-"-"'0::J c0)--0
U-
................. 23
.

...............
I!J]
............... 24
NPL Report COEM 13


.
NPL Report COEM 13
..
LIST OF TABLES
..
1, Detection Sensitivities of Species Measured
.2.
Summary of Meteorological Conditions
..
3. Summary of DIAL Measurement Scans
..
4. Measurements of Process emissions on 24/03/98
..5.
Measurements of Process emissions on 24/03/98
..6.
Measurements of Process emissions on 25/03/98
.7.
Measurements of Process emissions on 26/03/98
..
8. Measurements of LPG and Crude Export emissions on 27/03/98
..9.
Measurements of LPG emissions on 27/03/98
.
10. Measurements of Flare emissions on 23/03/98
..
11. Measurements of site north boundary emissions
.
Measurements of eastern site boundary emissions on 26/03/9812.
..
Analysis of Air Samples Taken at Wytch Farm Gathering Station13.
..
Total throughput figures for Wytch Farm Gathering Station14.
..Summary of results from DIAL measurements at Wytch Farm GatheringStation
15,
... 26.

.
NPL Report COEM 13
.....
Table 1: Measurement Wavelengths and Estimated DetectioJI1 Sensitivities ofSpecies Measured
........
c Table 2: Summary of Meteorological ConditioJIlS
.
Date Maximum daytimetemDerature
Minimum daytime~~perature.Wind Direction
.
23/3/9824/3/9825/3/9826/3/9827/3/98
lOA ° C
7.4°C
7.9°C10.2 ° C
10.4 ° C
NWSES
SW
SW
8.7°C5.6°C6.7°C8.7°C9.6°C
...........27
..

NPL Report COEM 13
Table 3:. Summary of DIAL Measurement Scans
Date Location Raw File Scan Time LoS Windspeed 15m
(m/s)
Windspeed 8m
(mls)
Winddirection(")
23/3/98 rosA mar231. wfx A 13:56-14:17 Al
B 14:37-14:55 Ai
c 15:00-15:09 A2
rnar232.wfx A 15:11-15:22 A2
B 15:23-15:47 A2
mar233.wfx A 15:49-16:15 A2 2.70 1.79 287
B 16:16-16:40 A2 2.32 1.57 292
mar234. wfx A 16:43-16:56 A3 2.67 1.79 283
B 16:57-17:07 A2 2.17 0.97 305
c 17:09-17:23 A4 1.71 0.85 322
mar235.wfx 17:25-17:35 AS 1.42A 0.73 335
B 17:35-17:41 A4 1.42 0.73 335
c 17:42-17:54 A4 1.33 0.61 330
17:56-18:13D A4 1.45 0.69 335
24/3/98 PosA mar241.wfx A 10:16-10:34 2.11A6 1.71 125
B 10:36-10:46 2.96A6 2.33 148
c 10:47-10:52 A7 2.77 2.23 144
mar242.wfx 10:54-11:02 A7 2.10A 1.66 155
B 11:03-11:19 AS 2.71 2.20 145
c 11:23-11:33 A6 2.98 2.43 153
PosH mar243.wfx 13:01A Bl 2.53 2.06 156
13:41B BI 2.53 2.06 156
mar244.wfx A 13:43-14:27 Bl 2.72 2.13 157
mar245.wfx A 14:03-15:02 82 2.62 2.08 153
B 15:02-15:23 82 2.60 2.01 155
mar246. wfx 15:24-15:53 82 2.23 1.75 153A
B 15:55-16:01 B2 2.60 2.17 156
mar247.wfx 16:04-17:05 81 2.16 1..71 149A
B 17:09-17:23 81 2.17 1.64 149
mar248.wfx 17:28-17:40 83 1.56 1.21 120A
17:41-17:50 B3 1.63 1.21 145B
c 17:52-17:59 83 1.63 1.21 145
A9 3.63 3.02 16925/03/98 PosA rnar251.wfx A 10:07-10:27
10:28-10:44 A9 4.29 3.51 170B
10:48-11:08 A9 4.28 3.52 174mar252.wfx A
B 11:09-11:25 A9 4.33 3.57 175
12:04-12:18 81 3.98 3.31 178PosB mar253.wfx A
28

NPL Report COEM 13
Date Location Raw File Scan Time LoS Windspeed 15m
(m/s)
Windspeed 8m
(m/s)
Winddirection('~
B 12:21-12:33 Bl 3.48 2.90 178
c 12:34-12:46 BI 4.46 3.75 173
mar254.wfx A 12:49-13:06 Bl 3.80 3.03 179
PosC mar255.wfx A 13:27-13:47 CI 3.63 3.09 195
B 13:47-14:05 CI 4.01 3.38 199
c 14:05-14:30 Cl 3.47 3.13 199
mar256.wfx A 14:31-14:55 CI 3.46 2.89 197
mar257 .wfx A 14:58-15:23 CI 3.67 3.08 189
B 15:26-15:39 CI 3.82 3.24 192
rnar258.wfx A 15:43-16:02 Cl 3.95 3.09 181
B 16:03-1624 Cl 4.02 3.28 175
PasO mar259.wfx A 16:38-17:05 01 3.21 2.86 194
B 17:06-17:18 01 3.98 3.23 197
mar25A.wfx 17:20-17:41 DlA 4.03 3.48 2.01
26/03/98 PosE mar261.wfx A 11:29-11:41 El 8.02 6.46 210
B 11:45-12:05 El 7.30 5.99 215
mar262.wfx A 12:11-12:21 El 6.66 5.29 220
B 12:34-12:51 EI 7.10 5.62 221
mar263.wfx A 12:54-13:04 EI 5.88 4.81 218
B 13:06-13:16 EI 6.37 5.14 218
c 13:17-13:28 El 6.30 5.28 218
PosA mar264. wfx 14:04-14:59A A'I 6.94 5.63 218
B 15:00-15:16 A'I 6.80 5.43 221
mar265.wfx 15:.18-15:32A A'I 6.76 5.31 224
B 15:34-15:45 A'I 5.56 4.60 233
c 15:46-15:55 A'I 6.18 5.16 233
mar266.wfx 15:57-16:09A A'I 5.86 4.81 224
PosD B 16:36-16:56 01 5.07 3.98 226
mar267.wfx A 16:59-17:19 DI 4.85 4.00 230
B 17:23-17:40 01 5.53 3.49 225
mar268.wfx 17:42-17:57 01 4.52 3.58 226A
B 17:57-18:09 Dl 4.53 3.58 227
09:57-10:19 Bl 3.95 3.3627/03/98 Pos B mar2?!. wfx A 212
10:24-10:50 81 4.48 3.74 208B
10:52-11:07 81 4.10 3.50 215rnar272.wfx A
B 11:01-11:19 Bl 4.23 3.62 215
11:22-11:46 Bl 4.67 3.96 212mar273.wfx A
3.18B 11:50-12:05 81 3.77 223
29

NPL Report COEM 13
Date Location Raw File Scan Time LoS Windspeed 15m
(m/s)
Windspeed 8m
(m/s)
Winddirection(U)
mar274.wfx A 12:08-12:23 81 4.19 3.42 221
B 12:25-12:41 81 4.60 3.97 213
mar275.wfx A 12:43-12:58 81 4.39 3.76 220
B 12:59-13:18 Bl 4.33 3.77 215
30

.
NPL Report COEM 13
..
Table 4: Measurements of Process emissions on 2~IfO3/98
..
Position: Pos AWind direction: 125-148Sources: Process area including water treatment.
........
Table 5: Measurements of Process emissions on 241JO3/98
...
Position: Pos BWind direction: 156-149Sources: Process area including water treatment.
................31
.

.
NPL Report COEM 13
..
Table 6: Measurements of Process emissions on 25/03/98
..
Position: Pos BWind direction: 175-199Sources: Process area including water treatment.
...........
Table 7: Measurements of Process emissions on 2fj!O3!98
..
Position: Pos DWind direction: 226-233Sources: Process area including water treatment, possible contribution from LPG andcrude export far upwind, however these will be dispersed into broad plumes and havebeen removed as background.
...
Scan Id
mar266bmar267amar267bmar268amar268b
Flux (k.eJhr)
.
23.227.428.922.723.7
...
25.21.3
0.0043%
AverageStdev of mean
..
Percentage emission(of total throughput)
.....32
[]

.
NPL Report COEM 13
..
Table 8: Measurements of LPG and Crude Export emissions on 27/03/98
..
Position: Pos BWind direction: 213-221Sources: LPG storage area and crude export / metering area.
........
Table 9: Measurements of LPG emissions on 27/1[)3/98
...
Position: Pos BWind direction: 213-221Sources: LPG area, excluding crude export.
................. 33
.

.
NPL Report COEM 13
..
Table 10: Measurements of Flare emissions on 2~1/03/98
.
Position: Pos AWind direction: 175-199Sources: Flare LP ,Ill' ,L T
...
Scan Id
Flare L T only:mar234bmar234cmar235bmar235cmar235d
Flux (kg/hr)
.
116.4102.287.392.7
106.1
....
AverageSt.Devofmean
100.9~
5.7
..
Flare LP and HP
.
mar234a 10.3
.
Flare HP only
..
mar235a 4.7
.
Total all flares 111.2
0.019%
.
Percentage emission for all flares
M!Qt&!h!'2ughput)
............34
.

.
NPL Report COEM 13
..
Table 11: Measurements of site north boundary enlissions
..
Position: Pos AWind direction: 155 -175Sources: All of North site + most of southern site, however some of southern siteemissions may have been missed due to dispersion.
..........
* This measurement excludes some of the emissions from LPG / export and is not
included in the average.
..
Table 12: Measurements of eastern site boundary -Southern ~)ite emissions on26/03/98
...
Position: Pos A'Wind direction: 175-199Sources: Process area including water treatment, LPG storage and. crude export plant.
.............35
.

NPL Report COEM 13
Table 13: Analysis of Air Samples Taken at Wytch Farm G.~thering Station
Grab Samples from Wytch Farm---I
Analysis by Gas Chromatography for C2-C9 hydrocarbons", c i
I~Lylmder No: Iclm 7963
Iclm
7975
'export pump
Iclm
7609Iprocess
Iclm
7977I~~-windt~ Iclm 7964 I
Igasst~liSa-mole Location
(ppb by Molefraction)
ppb ppb ppb ppb ppb
ethaneethenepropane
879.78.1
290.7*
20.739.92.8*
9.42.2
234.80.74.48.217.71.43.82.14.30.73.21.52.8
3.68.15.99.0
13.40.887.5
*
11.523.2
65.31.0
44.~)
11.41.2
69.8
Iii-butane 4.810.~b1.2
83.999.1
*
0.9*
0.40.7
cis-2-butenei-pentanen-pentane
:
4.55.7
*
1.92.7**
I?~o~~e,. i
;.l,3-butadiene
1.51.8
2&3-methylpentanen-hexane
2.31.8 0.4
**
0.4
ISO rene
C6n-heptane ,..
0.7 1.4
IC7
5.85.37.02.65.910.2
6.926.9
1.90.6*****
3.3
IItoluene
01-
0.7 0.8
nonaneethylbenzenemp-xylene
a-xylene
0.20.20.7
IIrq 2.8
1 An internal source of benzene was identified with some samples taken and so this
species has not been reported.* Below detectable limits
36

.
NPL Report COEM 13
..
Table 15: Total throughput figures for Wytch Farm Gathering Station
.......
(*) Assuming density of crude of 840
.....................37
..

.
NPL Report COEM 13
...
APPENDIX 1.DESCRIPTION OF DIFFERENTIAL ABSORPTION LIDAR FACILITY
OPERA TED BY NPL
...
AI.I OVERVIEW OF THE DIAL TECHNIQUE
.
The Differential Absorption Lidar (DIAL) technique is a laser-based remotemonitoring technique which enables range-resolved concentration measurements to bemade of a wide range of atmospheric species. This Appendix explains the theory of theDIAL technique and describes the NPL system in detail.
...
Al.2 DESCRIPllON OF THE THEORY OF DIAL MEASUREMENTS
..
The atmospheric return signal measured by a DIAL system is given by the LightDetection and Ranging (Lidar) equation, a simplified form of which is given inEquation 1.
...
(1)
.
where Dx is a range independent constant, C(r) is the concentration of an absorber withabsorption coefficient ax and Ax(r) is the absorption coefficient due to all otheratmospheric absorption, Ex is the transmitted energy and B" is the backscattercoefficient for the atmosphere at wavelength x.
...
The equation has three basic components:
...
a backscatter term based on the strength of the signal scattering mediumparameters associated with the DIAL systema term which is a measure of the amount of absorption of the signal which hasoccurred due to the presence of the target species.
.
In the DIAL technique, the laser is operated alternately at two adjacent wavelengths.One of these, the "on-resonant wavelength", is chosen to be at a wavelength which isabsorbed by the target species. The other, the "off-resonant wavelength", is chosen tobe at a wavelength which is not absorbed significantly by the target species.
..
Pairs of on- and off-resonant signals are then acquired and averaged separately untilthe required signal to noise ratio is achieved.
.
The two wavelengths used are close together, hence the atmospheric terms Ax{r) andBx{r) in the lidar equation can be assumed to be the same for both wavelengths. Theseterms are then cancelled by taking the ratio of the two returned signals.
...38
..

.
NPL Report COEM 13
..
The path-integrated concentration (CL) may be derived (Equation 2) by multiplyingthe logarithm of the ratio of the signals by the ratio of the absorption of the twowavelengths by the target species.
.
(2)
..
where N is the number of pulse pairs averaged, L\a = ~FF-~)N is the differentialabsorption coefficient and S represents the received power after normalisation for theon- and off-resonant signals respectively.
..
This path-integrated concentration represents the total concen1:ration of the targetspecies in the atmosphere along the measured line-of-sight out to 1:he range r.
..
The range-resolved concentration can then be derived by diffE!rentiating the path-integrated concentration (Equation 3).
..
r,..,T.. \UL-L..I rJ
drC( r) = (3)
.
where C(r) is the point concentration at range r along the line-ai-sight.
..
Al.3 DESCRIPllON OF FACILITY OPERA TED BY NPL
.
The DIAL system operated by NPL is housed in a mobile laboratory, shown in Figure3. It can operate in the infrared, visible and ultraviolet spectt'al regions allowingcoverage of a large number of atmospheric species. A scanner system, shown in Figure4, directs the output beam and detection optics, giving almost full coverage in both thehorizontal and vertical planes.
....
The system also contains ancillary equipment for meteorolo~~cal measurements,including an integral 14 m mast with wind speed, direction, temperature andhumidity measurements, and point monitors for measuring a variety of atmospheric
gases.
...
The system is fully self contained, with power provided by an on board generator, andhas full air conditioning to allow operation in a range of ambient conditions.
..
The following sections describe the DIAL system in more detail.
.
Al.3.1 Source
.
The source and transmission system employs two independent N,d-YAG pumped dyelasers, each with a repetition rate of 10 Hz. These two systems can be usedconcurrently to allow simultaneous monitoring of two species. The output laser pulselength is -10 fig. A small fraction of the output beam in each channel is split off by abeam splitter and measured by a pyroelectric detector (PED) to provide a value for thetransmitted energy with which to normalise the measured backscatter return. It is alsopossible to transmit a separate one micron Nd- Y AG beam w}lich allows a single
39
.....

.
NPL Report COEM 13
..
wavelength lidar channel to be operated simultaneously with the DIAL channels.Various non-linear optical techniques are used in the infrared system to achieve therequired output wavelength and energy.
..
Al.3.2 Detection
.
The returned atmospheric backscatter signal is collected by the scanning telescope.This directs the collected light into three paths for the infrared, visible/ultraviolet andlidar channels. The returned light passes through band pass filters relevant to eachdetection channel and is then focused onto the detection elements. Solid-statecryogenically-cooled detectors are used in the infrared channel and low-noisephotomultipliers in the ultraviolet. The one micron lidar signal is detected using ahigh-speed avalanche photo-diode.
.....
After amplification the signals from these detectors are digitised using 20 MHz 10 bitdigitisers. The digitisers are clocked using an external clock generator triggered by anoptical detector in the transmission chain. This ensures the range gating is correctlysynchronised to the laser pulse transmission. The signals from the PED monitoring thetransmitted energy are also digitised and stored.
....
Al.3.3 Data Analysis
.
The data acquired are analyzed, using the standard DIAL techniques described below,to give the range-resolved concentration along each line-of-sight.
..
The data analysis process consists of the following steps:
.
i) Normalisation for variation in transmitted ener~
.
The two signal returns are normalised using the monitored values of the transmittedenergy. The mean transmitted energy is used to normalise the averaged return signal.For this application, this has been shown to be equivalent to normalising individualshots against transmitted energy and then averaging the normalised values.
...
ii) Background subtraction
.
Following normalisation for transmitted energy any DC background value issubtracted from the signals. This measured background takes account of any DCsignal offset which may be present due to electronic offsets and from incidentbackground radiation. The background level is derived from the average value of thefar field of the returned lidar signal where no backscattered light is present.
....
iii) Calculation of l2ath-integrated concentration
.
The path-integrated concentration of the target species, out to the range r, is calculatedby multiplying the log of the ratio of the returned norma1.ised signals by thedifferential absorption, as described in section Al..2.
.... 40.

.
NPL Report COEM 13
..
The absorption coefficients used in this calculation are derived from high resolutionspectroscopy carried out using reference gas mixtures at NPL.
.
iv) Derivation of range-resolved concentrations.
..
In order to better visualise the data the integrated concentration proffies are piecewisedifferentiated to give the range-resolved concentration along the line-of-sight, asdescribed in section Al.2.
..
v) Calculation of emission fluxes
.
Range-resolved concentration measurements along different lines-of-sight arecombined to generate a concentration profile. The emission flux is then determinedusing the concentration profile together with meteorological data.
...
The emitted flux is calculated using the following mathematical steps:-
.
(a) The product is formed of the gas concentration measured with the DIALtechnique at a given point in space, and the component of the wind velocityperpendicular to the DIAL measurement plane at the same location.
..
This product is computed at all points within the measured concentrationprofile, to form a two-dimensional array of data.
(b)
..
(c) This array of results is then integrated over the complete concentration profileto produce a value for the total emitted flux.
..
Considerable care is needed in applying the meteorological data, particularly when theconcentration profile measured by the DIAL technique has large and complex spatialvariations since, for example, errors in the wind speed in regions where largeconcentrations are present will significantly affect the accuracy of the results. In suchcases, a more complex procedure is used which employs a further software package tocombine the data from the set of anemometers with that of an additionalmeteorological model, to generate the complete wind field over the concentrationprofile. This model calculates the variation of wind speed with height, as a function ofvarious parameters (such as the roughness of the terrain). The calculated wind field isthen combined with the measured gas concentration profile using the proceduredescribed above.
.......
Al.3.4 Calibration
.
The NPL DIAL system has several in-built calibration techniques imd procedures. Themost important are the in-line gas calibration cells. The gas cells are filled with knownconcentrations of the target species, from NPL standard gas mixtures which aretraceable to national standards. A fraction of the transmitted beam is split off anddirected through a gas cell to a PED, in the same way as the beam for the transmittedenergy monitors. This provides a direct measurement of the differential absorption atthe operating wavelengths by the target gas. The transmission tru'ough the gas cells iscontinuously monitored during the operation of the system to detect any possible drift
.....41
..

.
NPL Report COEM 13
..
in the laser wavelengths. The system also employs a wavemeter to monitor all thewavelengths transmitted during operation. The calibration cells are also periodicallyplaced in the output beam to show the concentration response of the whole system isas expected.
...
A number of field comparisons have been undertaken to demonstrate the accuracy ofthe measurements obtained with the DIAL system. Examples of these are detailedbelow :-
..
i) Intercomparisons have been carried out in the vicinity of chemical andpetrochemical plants where a large number of different volatile organic speciesare present. In these intercomparisons, the DIAL radiation was directed alongthe same line of sight as a line of point samplers. The point samplers wereoperated either by drawing air into internally-passivated, evacuated gascylinders or by pumping air at a known rate, for a specified time, through aseries of absorption tubes which efficiently absorb all hydrocarbon species inthe range C2 -Ca. The results obtained for the total concentrations of VOCsmeasured by the point samplers and those measured by the infrared DIALtechnique agreed within ::t 15%. The concentrations of atmospheric toluenemeasured by the ultraviolet DIAL system agreed with those obtained by thepoint samplers to within ::t 20%.
........
ii) The ultraviolet DIAL system was used to monitor the fluxes and concentrationsof sulphur dioxide produced from combustion and emitted by industrialstacks. These stacks were instrumented with calibrated in-stack samplinginstruments. The results of the two sets of measurements agreed to within:t 12%.
...
ill)
.
DIAL Measurements of controlled releases of methane from a stack agreedwith the known emission fluxes to within:t 15%.
.
NPL have also developed and operate a full-scale facility for the calibration of longpath monitors, including DIAL. This consists of a 10 m long windowless cell able tomaintain a uniform, independently-monitored concentration of a gaseous speciesalong its length. This facility has already been employed to demonstrate the accuracyof the infrared DIAL measurement technique [13].
...........42
..

.
NPL Report COEM 13
..
APPENDIX 2QUALITY ASSURANCE AND DATA AUDIT TRAIL
...
The National Physical Laboratory has a comprehensive quality system covering itslaboratory and field activities, whose scope and operation has been certified by Lloyd'sRegister Quality Assurance as complying with the international standard ISO 9001.
..
Details of the calibration procedures used for the DIAL measUJ~ements are given inAppendix I, with the use of reference gases traceable to National Standards. Theuncertainty of DIAL results is also discussed. These depend upon. a number of factors,including the meteorological conditions during the measu]~ement, so a fixeduncertainty cannot be given. However a number of validation exercises have beencarried out, and these indicate that the typical uncertainty in a DIAL measurement isin the range 10-20%.
.
f[]
...
All raw data collected during the course of this measurement carn.paign will be held ina data store for at least six years.
..
DIAL DATA AUDIT TRAILi"\.L..J.
.
Raw Data stored on PDP format 8.5 inch floppies located in DIAL.
..
Files referenced in Data Summary Sheets held in folders in DIAL(one folder per day of measurement).
.
File Name: mmmddn. WFX
..
where mmm = month eg JAN, dd = day number eg 08,n = sequential file number (1-9 then A-Z)
.
Each file can hold up to 60 records (numbered 0-59)
..
PROCESSED DATA STAGE 1 :
.
DIAL summary spreadsheets
.
WFXDSUM1.xls [held on PC 'RACK' in DIAL]WFXSUM.xlsII]
.
These spreadsheets (cross referenced by scan identifier) :
...
lists all raw data files and the dates acquired.identifies the measurement scans within each file.lists the record numbers constituting each scan.gives the times of each scangives the wind data used to process each scan.
.43
..

.
NPL Report COEM 13
..
The wind data is derived from files held on PC 'TOSH' in Rm 256, indirectory C: \ \. Filename example: 15m2303.x1s, referringto data from the 15m mast on 23/03/98. A printout of the wind measurementsis held with the DIAL data summary sheets (in DIAL).
...
Individual DIAL records have been processed to give column dataon DIAL processing system (LSI in DIAL) using D4V51P.SA V.See previous analysis notebook Q9ES31- ANAL YSIS-Ol for procedure used.
..
Processed data transferred to PC format (again see previous analysisnotebook for procedure). See notebook Q9ES5801 -02 for notes onthe individual files transferred.
...
The PC data files have the same root name as the raw data files with a txt extension(mmmddn.txt)and are held in directory C:\wfx\mmmdd on PC 'TORSTEN' and PC 'RACK' both inDIAL, where mmm is the month and dd is the date of the scan.
..
PROCESSED DATA STAGE 2
.
Individual scans were loaded into Matlab and processed using scr:ipt WFXPROC.m(this calls scripts which are part of DIAL data processing package PROCGA2.M).
..
Notes on individual scan results are in notebook Q9ES58 -02.
.....
Input file: one file holding all data for that scan.Input data:
Wind direction (degrees) -from WFXSUM.XLSWind speed (m/s) -from WFXSUM.XLSLine of Sight angles (LoS) -read from raw data files on LSI.Angle of elevation for each record -read from raw data files.Range and column results -from .col files (see above)Conversion factor for the species being measured -see notebookQ9ES58 01.
....
Output filematlab data file holding all data used to process a scan
saved as mmmddns.mat where mmmddn is as above and the character's'denoted which individual flux measurement the scan data refers to. Files storedin data directory c: \ wfx \on PC 'Rack' in DIAL
..
Output dataOutput is the flux in kg/ill and peak concentration in ppm, stored inspreadsheet WFXDSUMl.xls. -sheet 'scan summary' on PC 'Rack' in DIAL
.....44
.

.
NPL Report COEM 13
PROCESSED DATA STAGE 03
..
Scan results (flux in kg/ill) were grouped by source mea,sured. The averages(mean) and standard deviations of the mean were calculated lliiing excel functions.
.
Input dataFlux results from WFXDSUMl.xls sheet 'scan summary' on PC 'RACK' in DIALSite throughput of crude oil from BP supplied summary data in 'opus.xIs' on PC'Rack' in DIAL
...
Output dataAverage fluxes and standard deviations for groups of measurements of the samesources. -WFXDSUM1.xls sheet 'Emission Calc' on PC 'Rack' in DIAL
..
These output data used this draft report, on PC 'Rack' in DIAL and PC'Thunderchild' in rm 257 B95
.....................45
..