Different types of La Niña events and different … Yuan Y, Yan H M. Different types of La Niña...
10
© The Author(s) 2012. This article is published with open access at Springerlink.com csb.scichina.com www.springer.com/scp *Corresponding author (email: [email protected]) Article SPECIAL TOPICS: Atmospheric Science January 2013 Vol.58 No.3: 406 415 doi: 10.1007/s11434-012-5423-5 Different types of La Niña events and different responses of the tropical atmosphere YUAN Yuan 1* & YAN HongMing 2 1 National Climate Center, China Meteorological Administration, Beijing 100081, China; 2 Yunnan Climate Center, Kunming 650034, China Received May 7, 2012; accepted July 18, 2012; published online August 27, 2012 Historical La Niña events since 1950 are divided into Eastern Pacific (EP) type and Central Pacific (CP) type, and the SSTA de- veloping features as well as the different responses of the tropical atmosphere are further analyzed by using multiple datasets. Classification of different types La Niña is based on the normalized Niño3 and Niño4 indices and the SSTA distribution pattern during the mature phase. The minimum negative SSTA for CP La Niña is located over the equatorial central Pacific near the date- line, more westward than that of EP La Niña. It has stronger intensity and larger east-west zonal difference of SSTA over the equatorial Pacific than EP La Niña. Influenced by the different SSTA distribution pattern, CP La Niña induces more westward location of the anomalous sinking motion and the anomalous low-level divergent and high-level convergent winds over the equa- torial eastern Pacific. The different response of the tropical atmospheric circulation between EP and CP La Niña is more signifi- cant in the upper troposphere than in the lower troposphere. However, the tropical precipitation patterns during the mature phase of EP and CP La Niña are much similar, except the less (more) precipitation over the equatorial central Pacific (eastern Indian Ocean-western Pacific) during CP La Niña than during EP La Niña. La Niña, Eastern Pacific (EP) type, Central Pacific (CP) type, tropical atmosphere, Walker circulation, precipitation Citation: Yuan Y, Yan H M. Different types of La Niña events and different responses of the tropical atmosphere. Chin Sci Bull, 2013, 58: 406415, doi: 10.1007/ s11434-012-5423-5 El Niño-Southern Oscillation (ENSO) is one of the most important signals in the interannual climate variability. It not only directly induces weather and climate anomaly over the tropical Pacific, but also indirectly influences the cli- mate in the extratropics and even all over the world through teleconnection. As early as the 1980s, scientists have no- ticed that ENSO events have two types of developing pro- cesses. One is the South American coastal warming and westward propagation of the sea surface temperature anom- aly (SSTA) and the other is the central Pacific warming and eastward propagation of the SSTA [1–6]. In recent years, it is found that the SSTA distribution during the mature phase of most El Niño events after 1990s shifts more westward to the central Pacific as compared to those before the 1990s, which also leads to significant changes in the convection, vertical motion and precipitation in the tropics [7–9]. This “new” type of El Niño is named as dateline El Niño [10], El Niño Modoki [7], warm-pool El Niño [11], or central Pacif- ic (CP) El Niño [12]. Correspondingly, the original type of El Niño with the maximum SSTA mostly confined to the equatorial eastern Pacific is called typical El Niño, conven- tional El Niño, cold-tongue El Niño, or eastern Pacific (EP) El Niño. Since there is no uniform name, EP and CP type are used in this paper. Except for westward movement of the maximum SSTA during the mature phase, CP El Niño also show different features in physical mechanism [11,12], SSTA development, responses of the tropical atmosphere [7,9], as well as impact on the global climate as compared with EP El Niño. Influ- enced by the global warming, especially the decadal warm- ing in the equatorial Pacific, CP El Niño has been becoming more frequent and more intense after the 1990s [7,13,14].
Transcript of Different types of La Niña events and different … Yuan Y, Yan H M. Different types of La Niña...

© The Author(s) 2012. This article is published with open access at Springerlink.com csb.scichina.com www.springer.com/scp
*Corresponding author (email: [email protected])
Article
SPECIAL TOPICS:
Atmospheric Science January 2013 Vol.58 No.3: 406415
doi: 10.1007/s11434-012-5423-5
Different types of La Niña events and different responses of the tropical atmosphere
YUAN Yuan1* & YAN HongMing2
1 National Climate Center, China Meteorological Administration, Beijing 100081, China; 2 Yunnan Climate Center, Kunming 650034, China
Received May 7, 2012; accepted July 18, 2012; published online August 27, 2012
Historical La Niña events since 1950 are divided into Eastern Pacific (EP) type and Central Pacific (CP) type, and the SSTA de-veloping features as well as the different responses of the tropical atmosphere are further analyzed by using multiple datasets. Classification of different types La Niña is based on the normalized Niño3 and Niño4 indices and the SSTA distribution pattern during the mature phase. The minimum negative SSTA for CP La Niña is located over the equatorial central Pacific near the date-line, more westward than that of EP La Niña. It has stronger intensity and larger east-west zonal difference of SSTA over the equatorial Pacific than EP La Niña. Influenced by the different SSTA distribution pattern, CP La Niña induces more westward location of the anomalous sinking motion and the anomalous low-level divergent and high-level convergent winds over the equa-torial eastern Pacific. The different response of the tropical atmospheric circulation between EP and CP La Niña is more signifi-cant in the upper troposphere than in the lower troposphere. However, the tropical precipitation patterns during the mature phase of EP and CP La Niña are much similar, except the less (more) precipitation over the equatorial central Pacific (eastern Indian Ocean-western Pacific) during CP La Niña than during EP La Niña.
La Niña, Eastern Pacific (EP) type, Central Pacific (CP) type, tropical atmosphere, Walker circulation, precipitation
Citation: Yuan Y, Yan H M. Different types of La Niña events and different responses of the tropical atmosphere. Chin Sci Bull, 2013, 58: 406415, doi: 10.1007/ s11434-012-5423-5
El Niño-Southern Oscillation (ENSO) is one of the most important signals in the interannual climate variability. It not only directly induces weather and climate anomaly over the tropical Pacific, but also indirectly influences the cli-mate in the extratropics and even all over the world through teleconnection. As early as the 1980s, scientists have no-ticed that ENSO events have two types of developing pro-cesses. One is the South American coastal warming and westward propagation of the sea surface temperature anom-aly (SSTA) and the other is the central Pacific warming and eastward propagation of the SSTA [1–6]. In recent years, it is found that the SSTA distribution during the mature phase of most El Niño events after 1990s shifts more westward to the central Pacific as compared to those before the 1990s, which also leads to significant changes in the convection,
vertical motion and precipitation in the tropics [7–9]. This “new” type of El Niño is named as dateline El Niño [10], El Niño Modoki [7], warm-pool El Niño [11], or central Pacif-ic (CP) El Niño [12]. Correspondingly, the original type of El Niño with the maximum SSTA mostly confined to the equatorial eastern Pacific is called typical El Niño, conven-tional El Niño, cold-tongue El Niño, or eastern Pacific (EP) El Niño. Since there is no uniform name, EP and CP type are used in this paper.
Except for westward movement of the maximum SSTA during the mature phase, CP El Niño also show different features in physical mechanism [11,12], SSTA development, responses of the tropical atmosphere [7,9], as well as impact on the global climate as compared with EP El Niño. Influ-enced by the global warming, especially the decadal warm-ing in the equatorial Pacific, CP El Niño has been becoming more frequent and more intense after the 1990s [7,13,14].

Yuan Y, et al. Chin Sci Bull January (2013) Vol.58 No.3 407
Some recent studies have revealed the different impacts of EP El Niño and CP El Niño on the frequencies of Atlantic hurricanes [15] and northwestern Pacific tropical cyclones [16], on the western American winter precipitation [17], on the austral spring and autumn rainfall in Australia [18,19], as well as on the temperature and precipitation over East and Southeast Asia [9,20–25]. A number of statistical anal-yses and numerical simulations have proved that different types of El Niño would exert significantly different climate impacts on various regions all over the world.
However, the above latest studies mainly focus on dif-ferent types of El Niño. Limited researches have concerned different types of La Niña, though some have mentioned that La Niña events can also be divided into EP and CP types [7,12]. The classification of El Niño is mainly based on normalized winter (December-January-February, DJF) Niño3 and Niño4 index [11,13] or normalized DJF Niño3 index and El Niño Modoki indices (EMI) [7]. However, there are few La Niña classifications till now. Some re-searches even suggest that La Niña events cannot be classi-fied into EP and CP types, because both the SSTA distribu-tion and the tropical precipitation pattern are much the same [11,26,27]. Therefore, we tend to answer two questions in this study: Can La Niña events be divided into two types? Is there any difference of the tropical atmosphere responses between EP La Niña and CP La Niña?
In recent two years, the National Climate Center (NCC) in the Chinese Meteorological Administration has carried out real-time monitoring and climate diagnostics of CP El Niño events (http://cmdp.ncc.cma.gov.cn/cn/monitoring.htm#ac). However, the operational work concerning different types of La Niña has not been fully developed. Previous studies have revealed that in the winter of La Niña, more precipita-tion may occur in North China, while less precipitation happens in South China [28]. However, during January- February 2008 and January 2011, South China experienced severe snow and ice storm, which have exerted serious im-pacts on the traffic, electricity, agriculture, and mass pro-duction and life. During DJF 2012, the rainfall in South China was again above normal. The above three winters all occurred during the mature phase of La Niña. If the short- time climate forecasters followed the previous statistic fea-tures of the rainfall pattern in South China during the ma-ture phase of La Niña, it would be hard to predict the pre-cipitation anomaly in South China accurately. The real-time ENSO monitoring shows that during the mature phase (DJF) of the above three La Niña events, the minimum negative SSTA was not located in the equatorial eastern Pacific, but in the central Pacific near the dateline. Therefore, similar to El Niño event, there may exist CP La Niña and its impact on the climate should also be different from the convention-al EP La Niña. Researches on different types of La Niña are equally important to El Niño. It will be benefit for us to fully understand the impact of La Niña on the climate in China and East Asia, which should play an important role in
improving the accuracy of the short-time climate prediction.
1 Data and methods
The datasets used in this study include: (1) monthly atmos-pheric reanalysis data from the National Centers for Envi-ronmental Prediction/National Center for Atmospheric Re-search (NCEP/NCAR) with 2.5° longitude/latitude resolu-tion [29], (2) monthly Hadley Centre Global Sea Ice and Sea Surface Temperature (HadISST) data with 1° longitude/ latitude resolution [30], and (3) monthly precipitation anomalies over global land and oceans from the precipita-tion reconstruction (PREC) dataset, with 2.5° longitude/ latitude resolution [31]. The period of most data is from January 1950 to December 2011, except the PREC precipi-tation data from January 1950 to May 2011. Anomalies of all variables are obtained by removing the means of 1950– 2011.
In this study, the Niño3 index is defined by the SSTA av-eraged in the Niño3 region (5°S–5°N, 90°–150°W), and Ni-ño4 index is defined by the SSTA averaged in the Niño4 re-gion (5°S–5°N, 160°E–150°W). EMI is defined as [SSTA]C- 0.5[SSTA]E–0.5[SSTA]W, where [SSTA]C, [SSTA]E, and [SSTA]W stand for the area-mean SSTA over the central (10°S–10°N, 165°E–140°W), eastern (15°S–5°N, 110°– 70°W), and western (10°S–20°N, 125°–145°E) Pacific, re-spectively [7,17,20].
Composite analysis is the main method used in this study and the difference between two composite groups is tested by the Student’s t-test [32]. Two variables are xi and yi, each with N1 and N2 years, respectively. The average of each
variable is 1
1
1
N
i
i
x x N
and 2
21
.
N
ii
y y N Assuming that
the there is little difference between their total averages, the
statistics 1 1
1/ 2
2
1 11 2 1 2
1 1 1 1
N N
i ii i
t x y sN N N N
accords
with the t distribution with the degree of freedom N1+N2−2,
in which 1 1
2 2 21 2
1 1
( ) ( ) ( 2)
N N
i ii i
s x x y y N N is
the unbiased estimator of their standard deviation.
2 Classification of La Niña and the SSTA developing features
Figure 1 shows the normalized three-month running mean Niño3 and Niño4 indices from Jan 1950 to Dec 2011. Based on the criterion that the Niño3 or Niño4 index should be below −0.5°C and persist for at least five months, we get 14 La Niña events: 1954–1957, 1964–1965, 1967–1968, 1970–1971, 1973–1974, 1975–1976, 1978, 1983–1985, 1988–1989, 1995–1996, 1998–2001, 2005–2006, 2007–

408 Yuan Y, et al. Chin Sci Bull January (2013) Vol.58 No.3
Figure 1 Normalized three-month running mean Niño3 (red line) and Niño4 (blue line) indices (°C) for 1950–1960 (a), 1960–1970 (b), 1970–1980 (c), 1980–1990 (d), 1990–2000 (e), and 2000–2011 (f).
2008 and 2010–2011. Two La Niña events (1967–1968 and 1978) are not included in the historical La Niña events on the United States Climate Prediction Center (CPC) website (http://www.cpc.ncep.noaa.gov/products/analysis_monitoring/ ensostuff/ensoyears.shtml), since their monitoring is based on Niño3.4 index.
Similar to the classification of El Niño events, we divide historical La Niña events into EP and CP types based on normalized Niño3 and Niño4 indices. It can be seen from Figure 1 that during the mature phase of some La Niña events, the absolute value of Niño3 is larger than Niño4, while during the mature phase of some other La Niña events,
the absolute value of Niño4 is larger than Niño3. We clas-sify the former group as EP La Niña, and the latter group as CP La Niña. The normalized Niño3 and EMI show a similar result (figures not shown). Since the EMI is suggested to be unsuitable for CP La Niña monitoring [27], we mainly focus on Niño3 and Niño4 indices in this study.
Except for comparing the normalized Niño3 and Niño4 indices, we also compare the time-longitude profile of the equatorial SSTA variation for each La Niña event (figures not shown), which displays more clearly the location of the minimum negative SSTA and the timing when negative SSTA reaches the minimum. The mature phase of EP (CP)

Yuan Y, et al. Chin Sci Bull January (2013) Vol.58 No.3 409
La Niña is defined as the month when the Niño3 (Niño4) index reaches the minimum and the months before and after that month. Considering the SSTA distribution pattern dur-ing the mature phase of each La Niña event, we define the event with the minimum negative SSTA located in the equatorial eastern (central) Pacific as EP (CP) La Niña. It shows that most of EP La Niña events occur before the 1980s, while most of CP La Niña events happen after the 1980s (Table 1). This feature is similar to the decadal varia-bility of the two types of El Niño events [8,13].
In accordance with the definition of EP and CP La Niña, the composite SSTA distributions show that the minimum center of negative SSTA during the mature phase of EP La Niña is mostly confined to the equatorial eastern Pacific, with large negative SSTA in the Niño3 and Niño1+2 re-gions whereas near normal or small negative SSTA in the Niño4 region (Figure 2(a)). For CP La Niña, however, the negative SSTA shifts more westward to the equatorial cen-tral Pacific, mostly in the Niño4 and Niño3.4 regions. Small negative SSTA covers the Niño3 and Niño1+2 regions, with SSTA in the Niño1+2 region even near normal (Figure 2(b)).
Significant difference can also be observed in the inten-sity of the minimum negative SSTA, with CP La Niña stronger than EP La Niña. This feature is just opposite to EP and CP El Niño (EP El Niño is usually stronger than CP El Niño) [8,12]. Moreover, the east-west zonal SSTA differ-ence is also different between EP La Niña and CP La Niña. During the mature phase of CP La Niña, significant positive
Table 1 EP La Niña and CP La Niña events from 1950 to 2011
Type La Niña Mature phase SSTA propagating
direction
EP
1954–1957 Nov 1955–Jan 1956 east to west
1964–1965 Oct–Dec 1964 east to west
1967–1968 Jan–Mar 1968 east to west
1970–1971 Jul–Sep 1970 east to west
1978 Jun–Aug 1978 east to west
1995–1996 Sep–Nov 1995 east to west
2005–2006 Nov 2005–Jan 2006 east to west
CP
1973–1974 Nov 1973–Jan 1974 east to west
1975–1976 Sep–Nov 1975 west to east
1983–1985 Nov 1984–Jan 1985 west to east
1988–1989 Nov 1988–Jan 1989 east to west
1998–2001 Jan–Mar 2000 west to east
2007–2009 Jan–Mar 2008 east to west
2010–2012 Nov 2010–Jan 2011 west to east
SSTA covers the equatorial northwestern Pacific, central North Pacific, and central South Pacific. The SSTA pattern in the Pacific forms a typical “horseshoe” pattern (Figure 2(b)). During the mature phase of EP La Niña, however, positive SSTA in both the northwestern Pacific and high- latitudes of Pacific is very small, and the east-west zonal SSTA difference is insignificant (Figure 2(a)). Although cold SSTA in the tropical Indian Ocean tends to occur with La Niña [33–35], negative SSTA in the tropical Indian Ocean is negligible during CP La Niña. It might be due to
Figure 2 Composite SSTA (°C) during the mature phase of EP (a) and CP (b) La Niña. Composite time-longitude variation of the equatorial (5°S–5°N) SSTA for EP (c) and CP (d) La Niña, with ‘0000’ (‘0001’) in the y-axis meaning the onset (following) year of La Niña.
410 Yuan Y, et al. Chin Sci Bull January (2013) Vol.58 No.3
the decadal warming of Indian Ocean, or the distribution type of ENSO events [9,12,25].
Except for different SSTA distribution pattern between EP La Niña and CP La Niña, the time-longitude variation of the equatorial SSTA also exhibits different features. For EP La Niña, negative SSTA usually develops from the eastern part of the equatorial eastern Pacific and then propagates westward to the equatorial central Pacific. During the ma-ture phase, the minimum negative SSTA is confined to the equatorial eastern Pacific. Positive SSTA is small in the equatorial western Pacific, causing a small east-west zonal SSTA difference. During the year before and after EP La Niña, anomalous warm SSTA tends to happen in the equa-torial eastern-central Pacific (Figure 2(c)).
For CP La Niña, the composite negative SSTA also firstly exists in the eastern part of the equatorial eastern Pa-cific. However, negative SSTA with a larger intensity de-velops in the equatorial central Pacific at the same time (Figure 2(d)). With positive SSTA in the equatorial western Pacific, the east-west zonal SSTA difference is larger than that of EP La Niña. During the mature phase of CP La Niña, the minimum negative SSTA shifts to the equatorial central Pacific near the dateline, thus forming a different distribu-tion pattern as compared with EP La Niña. CP La Niña tends to occur earlier and end later than EP La Niña. During the year before the onset of CP La Niña, SSTA in the equa-torial eastern-central Pacific is warm than normal. During the year after the end of CP La Niña, however, cold SSTA persists for a longer time, which indicates that CP La Niña is more likely to last for at least two years than EP La Niña. This feature can also be seen in Figure 1 and Table 1 that 1983–1985, 1998–2001, 2007–2009 and 2010–2012 are all CP La Niña which persist for at least two years. During EP La Niña, however, only 1954–1957 La Niña persists for more than two years.
Table 1 also lists the SSTA propagating direction for
each La Niña event. It shows that during almost all of the EP La Niña events, the negative SSTA moves from east to west along the equator. For CP La Niña events, however, some exhibit east-to-west propagating feature, whereas others display west-to-east propagating feature. After the 1980s, the west-to-east propagation occurs more frequently [5], which might induce more CP La Niña during the period.
3 Different responses of the tropical atmos-phere
In section 2, we have divided the historical La Niña events during the past 60 years into EP type and CP type, and compared their different SSTA distribution and evolution features. Then, is there any difference of the responses of the tropical atmosphere between them?
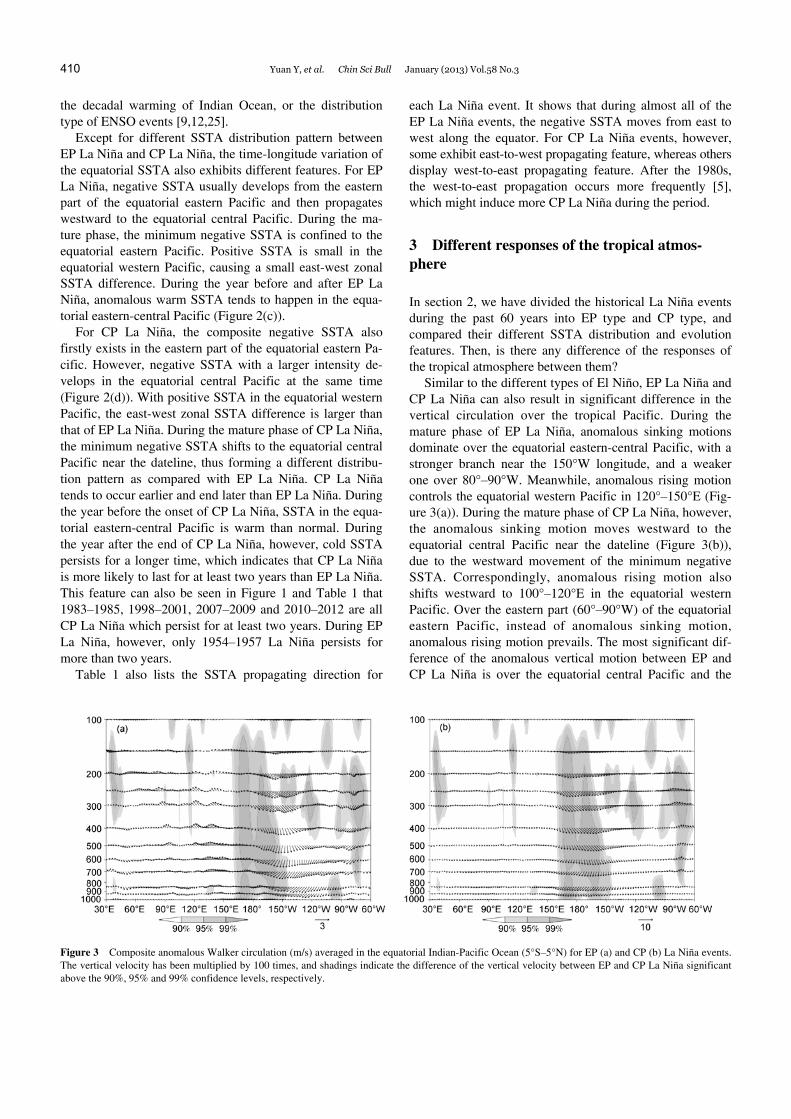
Similar to the different types of El Niño, EP La Niña and CP La Niña can also result in significant difference in the vertical circulation over the tropical Pacific. During the mature phase of EP La Niña, anomalous sinking motions dominate over the equatorial eastern-central Pacific, with a stronger branch near the 150°W longitude, and a weaker one over 80°–90°W. Meanwhile, anomalous rising motion controls the equatorial western Pacific in 120°–150°E (Fig-ure 3(a)). During the mature phase of CP La Niña, however, the anomalous sinking motion moves westward to the equatorial central Pacific near the dateline (Figure 3(b)), due to the westward movement of the minimum negative SSTA. Correspondingly, anomalous rising motion also shifts westward to 100°–120°E in the equatorial western Pacific. Over the eastern part (60°–90°W) of the equatorial eastern Pacific, instead of anomalous sinking motion, anomalous rising motion prevails. The most significant dif-ference of the anomalous vertical motion between EP and CP La Niña is over the equatorial central Pacific and the
Figure 3 Composite anomalous Walker circulation (m/s) averaged in the equatorial Indian-Pacific Ocean (5°S–5°N) for EP (a) and CP (b) La Niña events. The vertical velocity has been multiplied by 100 times, and shadings indicate the difference of the vertical velocity between EP and CP La Niña significant above the 90%, 95% and 99% confidence levels, respectively.
Yuan Y, et al. Chin Sci Bull January (2013) Vol.58 No.3 411
eastern part of the eastern Pacific, as highlighted by the shading in Figure 3.
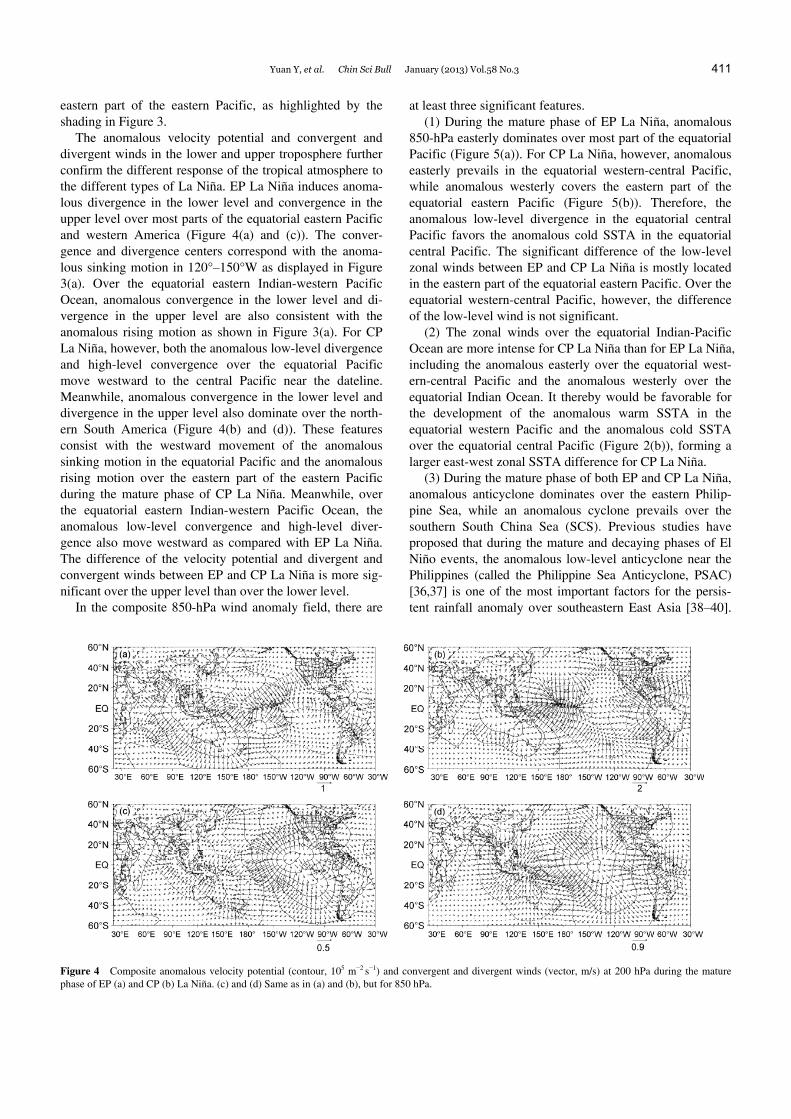
The anomalous velocity potential and convergent and divergent winds in the lower and upper troposphere further confirm the different response of the tropical atmosphere to the different types of La Niña. EP La Niña induces anoma-lous divergence in the lower level and convergence in the upper level over most parts of the equatorial eastern Pacific and western America (Figure 4(a) and (c)). The conver-gence and divergence centers correspond with the anoma-lous sinking motion in 120°–150°W as displayed in Figure 3(a). Over the equatorial eastern Indian-western Pacific Ocean, anomalous convergence in the lower level and di-vergence in the upper level are also consistent with the anomalous rising motion as shown in Figure 3(a). For CP La Niña, however, both the anomalous low-level divergence and high-level convergence over the equatorial Pacific move westward to the central Pacific near the dateline. Meanwhile, anomalous convergence in the lower level and divergence in the upper level also dominate over the north-ern South America (Figure 4(b) and (d)). These features consist with the westward movement of the anomalous sinking motion in the equatorial Pacific and the anomalous rising motion over the eastern part of the eastern Pacific during the mature phase of CP La Niña. Meanwhile, over the equatorial eastern Indian-western Pacific Ocean, the anomalous low-level convergence and high-level diver-gence also move westward as compared with EP La Niña. The difference of the velocity potential and divergent and convergent winds between EP and CP La Niña is more sig-nificant over the upper level than over the lower level.
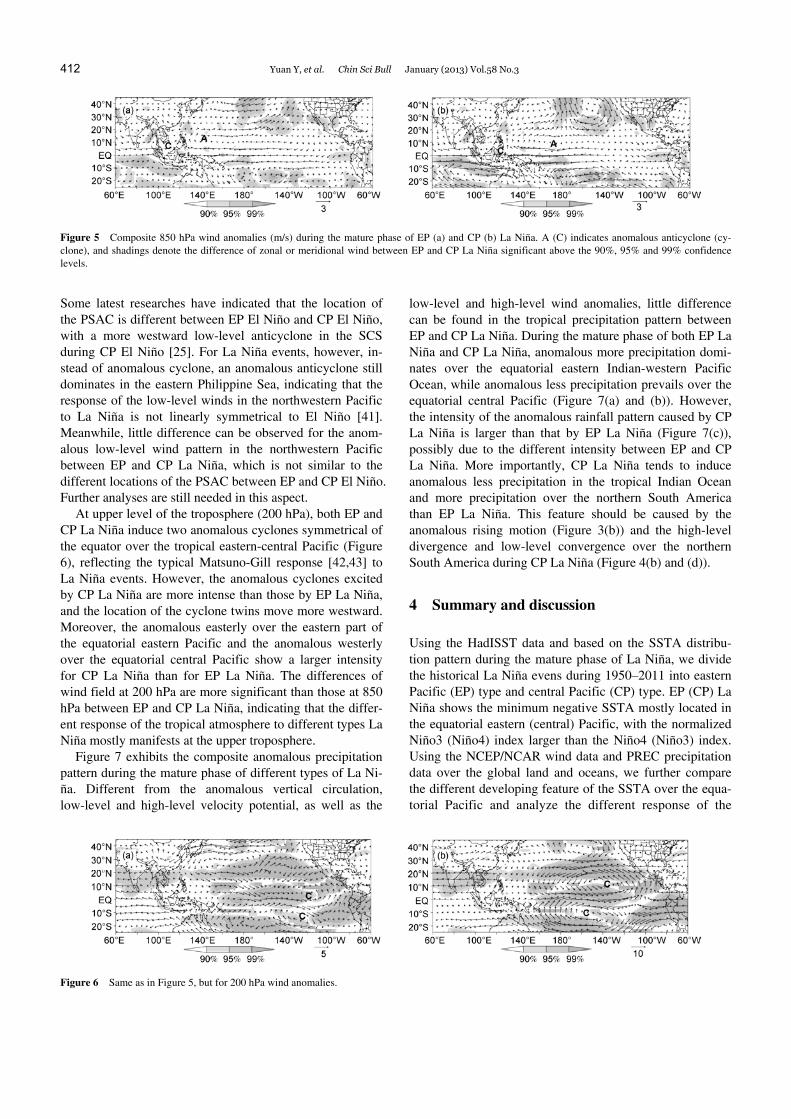
In the composite 850-hPa wind anomaly field, there are
at least three significant features. (1) During the mature phase of EP La Niña, anomalous
850-hPa easterly dominates over most part of the equatorial Pacific (Figure 5(a)). For CP La Niña, however, anomalous easterly prevails in the equatorial western-central Pacific, while anomalous westerly covers the eastern part of the equatorial eastern Pacific (Figure 5(b)). Therefore, the anomalous low-level divergence in the equatorial central Pacific favors the anomalous cold SSTA in the equatorial central Pacific. The significant difference of the low-level zonal winds between EP and CP La Niña is mostly located in the eastern part of the equatorial eastern Pacific. Over the equatorial western-central Pacific, however, the difference of the low-level wind is not significant.
(2) The zonal winds over the equatorial Indian-Pacific Ocean are more intense for CP La Niña than for EP La Niña, including the anomalous easterly over the equatorial west-ern-central Pacific and the anomalous westerly over the equatorial Indian Ocean. It thereby would be favorable for the development of the anomalous warm SSTA in the equatorial western Pacific and the anomalous cold SSTA over the equatorial central Pacific (Figure 2(b)), forming a larger east-west zonal SSTA difference for CP La Niña.
(3) During the mature phase of both EP and CP La Niña, anomalous anticyclone dominates over the eastern Philip-pine Sea, while an anomalous cyclone prevails over the southern South China Sea (SCS). Previous studies have proposed that during the mature and decaying phases of El Niño events, the anomalous low-level anticyclone near the Philippines (called the Philippine Sea Anticyclone, PSAC) [36,37] is one of the most important factors for the persis-tent rainfall anomaly over southeastern East Asia [38–40].
Figure 4 Composite anomalous velocity potential (contour, 105 m−2 s−1) and convergent and divergent winds (vector, m/s) at 200 hPa during the mature phase of EP (a) and CP (b) La Niña. (c) and (d) Same as in (a) and (b), but for 850 hPa.
412 Yuan Y, et al. Chin Sci Bull January (2013) Vol.58 No.3
Figure 5 Composite 850 hPa wind anomalies (m/s) during the mature phase of EP (a) and CP (b) La Niña. A (C) indicates anomalous anticyclone (cy-clone), and shadings denote the difference of zonal or meridional wind between EP and CP La Niña significant above the 90%, 95% and 99% confidence levels.
Some latest researches have indicated that the location of the PSAC is different between EP El Niño and CP El Niño, with a more westward low-level anticyclone in the SCS during CP El Niño [25]. For La Niña events, however, in-stead of anomalous cyclone, an anomalous anticyclone still dominates in the eastern Philippine Sea, indicating that the response of the low-level winds in the northwestern Pacific to La Niña is not linearly symmetrical to El Niño [41]. Meanwhile, little difference can be observed for the anom-alous low-level wind pattern in the northwestern Pacific between EP and CP La Niña, which is not similar to the different locations of the PSAC between EP and CP El Niño. Further analyses are still needed in this aspect.
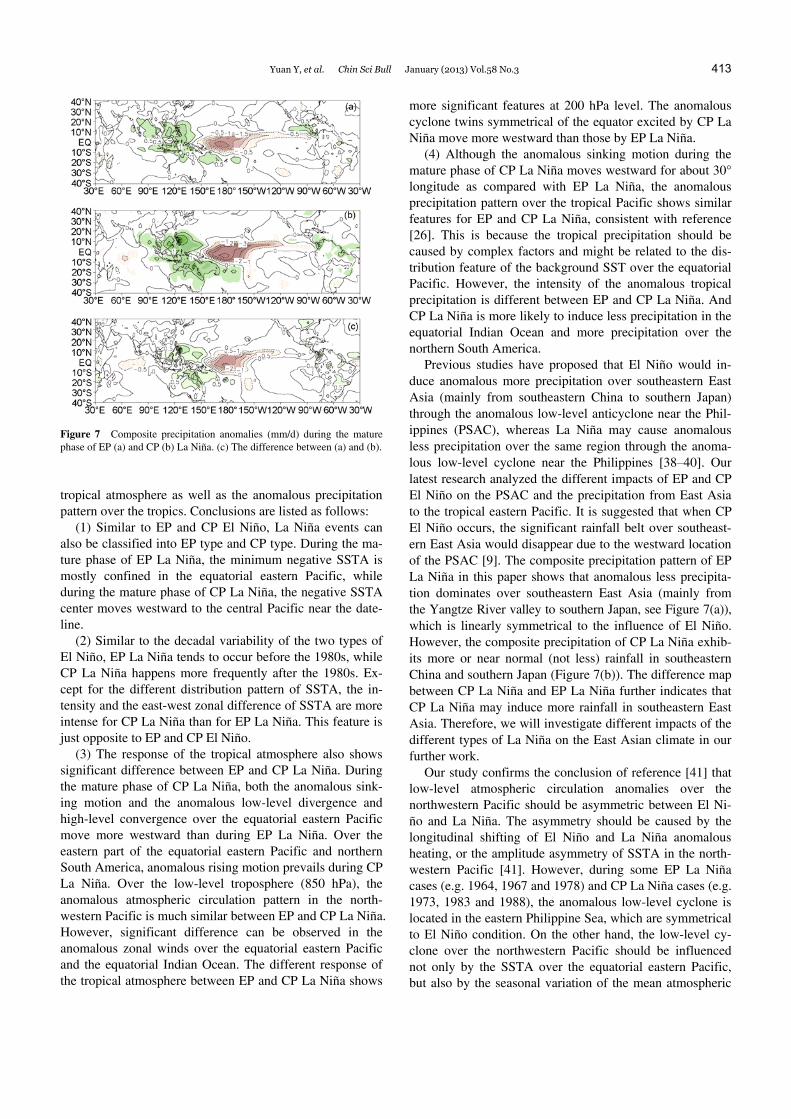
At upper level of the troposphere (200 hPa), both EP and CP La Niña induce two anomalous cyclones symmetrical of the equator over the tropical eastern-central Pacific (Figure 6), reflecting the typical Matsuno-Gill response [42,43] to La Niña events. However, the anomalous cyclones excited by CP La Niña are more intense than those by EP La Niña, and the location of the cyclone twins move more westward. Moreover, the anomalous easterly over the eastern part of the equatorial eastern Pacific and the anomalous westerly over the equatorial central Pacific show a larger intensity for CP La Niña than for EP La Niña. The differences of wind field at 200 hPa are more significant than those at 850 hPa between EP and CP La Niña, indicating that the differ-ent response of the tropical atmosphere to different types La Niña mostly manifests at the upper troposphere.
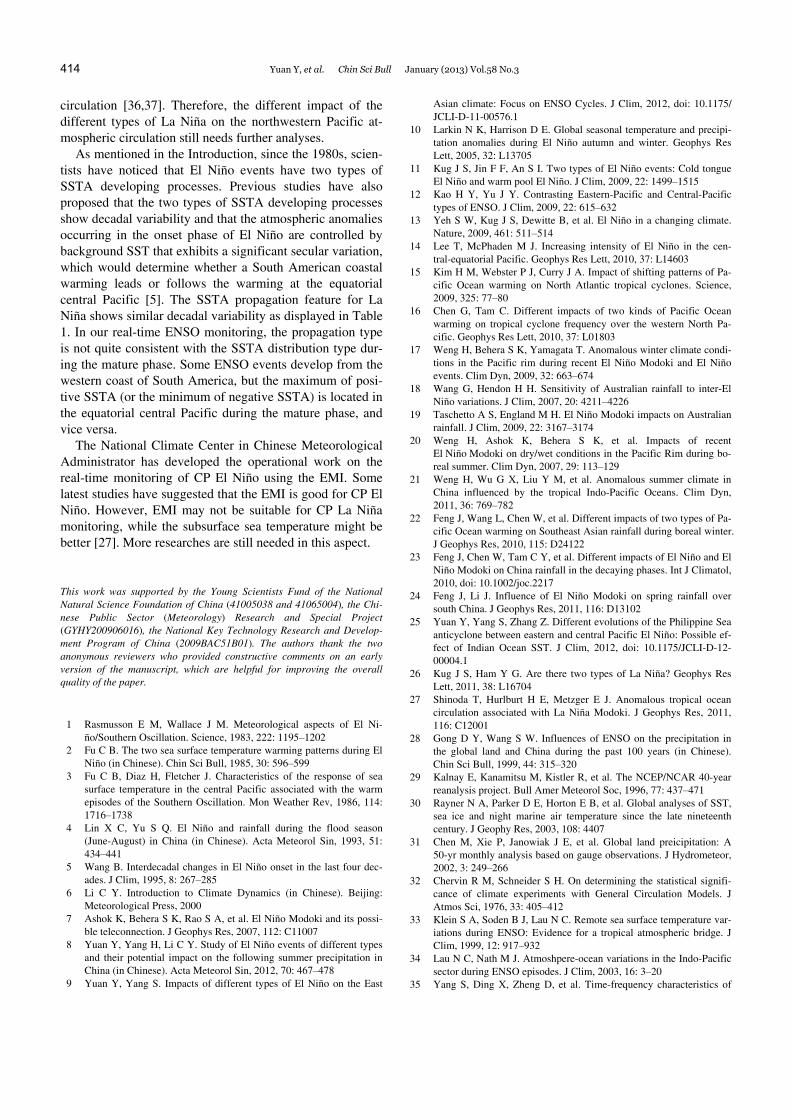
Figure 7 exhibits the composite anomalous precipitation pattern during the mature phase of different types of La Ni-ña. Different from the anomalous vertical circulation, low-level and high-level velocity potential, as well as the
low-level and high-level wind anomalies, little difference can be found in the tropical precipitation pattern between EP and CP La Niña. During the mature phase of both EP La Niña and CP La Niña, anomalous more precipitation domi-nates over the equatorial eastern Indian-western Pacific Ocean, while anomalous less precipitation prevails over the equatorial central Pacific (Figure 7(a) and (b)). However, the intensity of the anomalous rainfall pattern caused by CP La Niña is larger than that by EP La Niña (Figure 7(c)), possibly due to the different intensity between EP and CP La Niña. More importantly, CP La Niña tends to induce anomalous less precipitation in the tropical Indian Ocean and more precipitation over the northern South America than EP La Niña. This feature should be caused by the anomalous rising motion (Figure 3(b)) and the high-level divergence and low-level convergence over the northern South America during CP La Niña (Figure 4(b) and (d)).
4 Summary and discussion
Using the HadISST data and based on the SSTA distribu-tion pattern during the mature phase of La Niña, we divide the historical La Niña evens during 1950–2011 into eastern Pacific (EP) type and central Pacific (CP) type. EP (CP) La Niña shows the minimum negative SSTA mostly located in the equatorial eastern (central) Pacific, with the normalized Niño3 (Niño4) index larger than the Niño4 (Niño3) index. Using the NCEP/NCAR wind data and PREC precipitation data over the global land and oceans, we further compare the different developing feature of the SSTA over the equa-torial Pacific and analyze the different response of the
Figure 6 Same as in Figure 5, but for 200 hPa wind anomalies.
Yuan Y, et al. Chin Sci Bull January (2013) Vol.58 No.3 413
Figure 7 Composite precipitation anomalies (mm/d) during the mature phase of EP (a) and CP (b) La Niña. (c) The difference between (a) and (b).
tropical atmosphere as well as the anomalous precipitation pattern over the tropics. Conclusions are listed as follows:
(1) Similar to EP and CP El Niño, La Niña events can also be classified into EP type and CP type. During the ma-ture phase of EP La Niña, the minimum negative SSTA is mostly confined in the equatorial eastern Pacific, while during the mature phase of CP La Niña, the negative SSTA center moves westward to the central Pacific near the date-line.
(2) Similar to the decadal variability of the two types of El Niño, EP La Niña tends to occur before the 1980s, while CP La Niña happens more frequently after the 1980s. Ex-cept for the different distribution pattern of SSTA, the in-tensity and the east-west zonal difference of SSTA are more intense for CP La Niña than for EP La Niña. This feature is just opposite to EP and CP El Niño.
(3) The response of the tropical atmosphere also shows significant difference between EP and CP La Niña. During the mature phase of CP La Niña, both the anomalous sink-ing motion and the anomalous low-level divergence and high-level convergence over the equatorial eastern Pacific move more westward than during EP La Niña. Over the eastern part of the equatorial eastern Pacific and northern South America, anomalous rising motion prevails during CP La Niña. Over the low-level troposphere (850 hPa), the anomalous atmospheric circulation pattern in the north-western Pacific is much similar between EP and CP La Niña. However, significant difference can be observed in the anomalous zonal winds over the equatorial eastern Pacific and the equatorial Indian Ocean. The different response of the tropical atmosphere between EP and CP La Niña shows
more significant features at 200 hPa level. The anomalous cyclone twins symmetrical of the equator excited by CP La Niña move more westward than those by EP La Niña.
(4) Although the anomalous sinking motion during the mature phase of CP La Niña moves westward for about 30° longitude as compared with EP La Niña, the anomalous precipitation pattern over the tropical Pacific shows similar features for EP and CP La Niña, consistent with reference [26]. This is because the tropical precipitation should be caused by complex factors and might be related to the dis-tribution feature of the background SST over the equatorial Pacific. However, the intensity of the anomalous tropical precipitation is different between EP and CP La Niña. And CP La Niña is more likely to induce less precipitation in the equatorial Indian Ocean and more precipitation over the northern South America.
Previous studies have proposed that El Niño would in-duce anomalous more precipitation over southeastern East Asia (mainly from southeastern China to southern Japan) through the anomalous low-level anticyclone near the Phil-ippines (PSAC), whereas La Niña may cause anomalous less precipitation over the same region through the anoma-lous low-level cyclone near the Philippines [38–40]. Our latest research analyzed the different impacts of EP and CP El Niño on the PSAC and the precipitation from East Asia to the tropical eastern Pacific. It is suggested that when CP El Niño occurs, the significant rainfall belt over southeast-ern East Asia would disappear due to the westward location of the PSAC [9]. The composite precipitation pattern of EP La Niña in this paper shows that anomalous less precipita-tion dominates over southeastern East Asia (mainly from the Yangtze River valley to southern Japan, see Figure 7(a)), which is linearly symmetrical to the influence of El Niño. However, the composite precipitation of CP La Niña exhib-its more or near normal (not less) rainfall in southeastern China and southern Japan (Figure 7(b)). The difference map between CP La Niña and EP La Niña further indicates that CP La Niña may induce more rainfall in southeastern East Asia. Therefore, we will investigate different impacts of the different types of La Niña on the East Asian climate in our further work.
Our study confirms the conclusion of reference [41] that low-level atmospheric circulation anomalies over the northwestern Pacific should be asymmetric between El Ni-ño and La Niña. The asymmetry should be caused by the longitudinal shifting of El Niño and La Niña anomalous heating, or the amplitude asymmetry of SSTA in the north-western Pacific [41]. However, during some EP La Niña cases (e.g. 1964, 1967 and 1978) and CP La Niña cases (e.g. 1973, 1983 and 1988), the anomalous low-level cyclone is located in the eastern Philippine Sea, which are symmetrical to El Niño condition. On the other hand, the low-level cy-clone over the northwestern Pacific should be influenced not only by the SSTA over the equatorial eastern Pacific, but also by the seasonal variation of the mean atmospheric
414 Yuan Y, et al. Chin Sci Bull January (2013) Vol.58 No.3
circulation [36,37]. Therefore, the different impact of the different types of La Niña on the northwestern Pacific at-mospheric circulation still needs further analyses.
As mentioned in the Introduction, since the 1980s, scien-tists have noticed that El Niño events have two types of SSTA developing processes. Previous studies have also proposed that the two types of SSTA developing processes show decadal variability and that the atmospheric anomalies occurring in the onset phase of El Niño are controlled by background SST that exhibits a significant secular variation, which would determine whether a South American coastal warming leads or follows the warming at the equatorial central Pacific [5]. The SSTA propagation feature for La Niña shows similar decadal variability as displayed in Table 1. In our real-time ENSO monitoring, the propagation type is not quite consistent with the SSTA distribution type dur-ing the mature phase. Some ENSO events develop from the western coast of South America, but the maximum of posi-tive SSTA (or the minimum of negative SSTA) is located in the equatorial central Pacific during the mature phase, and vice versa.
The National Climate Center in Chinese Meteorological Administrator has developed the operational work on the real-time monitoring of CP El Niño using the EMI. Some latest studies have suggested that the EMI is good for CP El Niño. However, EMI may not be suitable for CP La Niña monitoring, while the subsurface sea temperature might be better [27]. More researches are still needed in this aspect.
This work was supported by the Young Scientists Fund of the National Natural Science Foundation of China (41005038 and 41065004), the Chi-nese Public Sector (Meteorology) Research and Special Project (GYHY200906016), the National Key Technology Research and Develop-ment Program of China (2009BAC51B01). The authors thank the two anonymous reviewers who provided constructive comments on an early version of the manuscript, which are helpful for improving the overall quality of the paper.
1 Rasmusson E M, Wallace J M. Meteorological aspects of El Ni-ño/Southern Oscillation. Science, 1983, 222: 1195–1202
2 Fu C B. The two sea surface temperature warming patterns during El Niño (in Chinese). Chin Sci Bull, 1985, 30: 596–599
3 Fu C B, Diaz H, Fletcher J. Characteristics of the response of sea surface temperature in the central Pacific associated with the warm episodes of the Southern Oscillation. Mon Weather Rev, 1986, 114: 1716–1738
4 Lin X C, Yu S Q. El Niño and rainfall during the flood season (June-August) in China (in Chinese). Acta Meteorol Sin, 1993, 51: 434–441
5 Wang B. Interdecadal changes in El Niño onset in the last four dec-ades. J Clim, 1995, 8: 267–285
6 Li C Y. Introduction to Climate Dynamics (in Chinese). Beijing: Meteorological Press, 2000
7 Ashok K, Behera S K, Rao S A, et al. El Niño Modoki and its possi-ble teleconnection. J Geophys Res, 2007, 112: C11007
8 Yuan Y, Yang H, Li C Y. Study of El Niño events of different types and their potential impact on the following summer precipitation in China (in Chinese). Acta Meteorol Sin, 2012, 70: 467–478
9 Yuan Y, Yang S. Impacts of different types of El Niño on the East
Asian climate: Focus on ENSO Cycles. J Clim, 2012, doi: 10.1175/ JCLI-D-11-00576.1
10 Larkin N K, Harrison D E. Global seasonal temperature and precipi-tation anomalies during El Niño autumn and winter. Geophys Res Lett, 2005, 32: L13705
11 Kug J S, Jin F F, An S I. Two types of El Niño events: Cold tongue El Niño and warm pool El Niño. J Clim, 2009, 22: 1499–1515
12 Kao H Y, Yu J Y. Contrasting Eastern-Pacific and Central-Pacific types of ENSO. J Clim, 2009, 22: 615–632
13 Yeh S W, Kug J S, Dewitte B, et al. El Niño in a changing climate. Nature, 2009, 461: 511–514
14 Lee T, McPhaden M J. Increasing intensity of El Niño in the cen-tral-equatorial Pacific. Geophys Res Lett, 2010, 37: L14603
15 Kim H M, Webster P J, Curry J A. Impact of shifting patterns of Pa-cific Ocean warming on North Atlantic tropical cyclones. Science, 2009, 325: 77–80
16 Chen G, Tam C. Different impacts of two kinds of Pacific Ocean warming on tropical cyclone frequency over the western North Pa-cific. Geophys Res Lett, 2010, 37: L01803
17 Weng H, Behera S K, Yamagata T. Anomalous winter climate condi-tions in the Pacific rim during recent El Niño Modoki and El Niño events. Clim Dyn, 2009, 32: 663–674
18 Wang G, Hendon H H. Sensitivity of Australian rainfall to inter-El Niño variations. J Clim, 2007, 20: 4211–4226
19 Taschetto A S, England M H. El Niño Modoki impacts on Australian rainfall. J Clim, 2009, 22: 3167–3174
20 Weng H, Ashok K, Behera S K, et al. Impacts of recent El Niño Modoki on dry/wet conditions in the Pacific Rim during bo-real summer. Clim Dyn, 2007, 29: 113–129
21 Weng H, Wu G X, Liu Y M, et al. Anomalous summer climate in China influenced by the tropical Indo-Pacific Oceans. Clim Dyn, 2011, 36: 769–782
22 Feng J, Wang L, Chen W, et al. Different impacts of two types of Pa-cific Ocean warming on Southeast Asian rainfall during boreal winter. J Geophys Res, 2010, 115: D24122
23 Feng J, Chen W, Tam C Y, et al. Different impacts of El Niño and El Niño Modoki on China rainfall in the decaying phases. Int J Climatol, 2010, doi: 10.1002/joc.2217
24 Feng J, Li J. Influence of El Niño Modoki on spring rainfall over south China. J Geophys Res, 2011, 116: D13102
25 Yuan Y, Yang S, Zhang Z. Different evolutions of the Philippine Sea anticyclone between eastern and central Pacific El Niño: Possible ef-fect of Indian Ocean SST. J Clim, 2012, doi: 10.1175/JCLI-D-12- 00004.1
26 Kug J S, Ham Y G. Are there two types of La Niña? Geophys Res Lett, 2011, 38: L16704
27 Shinoda T, Hurlburt H E, Metzger E J. Anomalous tropical ocean circulation associated with La Niña Modoki. J Geophys Res, 2011, 116: C12001
28 Gong D Y, Wang S W. Influences of ENSO on the precipitation in the global land and China during the past 100 years (in Chinese). Chin Sci Bull, 1999, 44: 315–320
29 Kalnay E, Kanamitsu M, Kistler R, et al. The NCEP/NCAR 40-year reanalysis project. Bull Amer Meteorol Soc, 1996, 77: 437–471
30 Rayner N A, Parker D E, Horton E B, et al. Global analyses of SST, sea ice and night marine air temperature since the late nineteenth century. J Geophy Res, 2003, 108: 4407
31 Chen M, Xie P, Janowiak J E, et al. Global land preicipitation: A 50-yr monthly analysis based on gauge observations. J Hydrometeor, 2002, 3: 249–266
32 Chervin R M, Schneider S H. On determining the statistical signifi-cance of climate experiments with General Circulation Models. J Atmos Sci, 1976, 33: 405–412
33 Klein S A, Soden B J, Lau N C. Remote sea surface temperature var-iations during ENSO: Evidence for a tropical atmospheric bridge. J Clim, 1999, 12: 917–932
34 Lau N C, Nath M J. Atmoshpere-ocean variations in the Indo-Pacific sector during ENSO episodes. J Clim, 2003, 16: 3–20
35 Yang S, Ding X, Zheng D, et al. Time-frequency characteristics of

Yuan Y, et al. Chin Sci Bull January (2013) Vol.58 No.3 415
the relationships between tropical Indo-Pacific SSTs. Adv Atmos Sci, 2007, 24: 343–359
36 Wang B, Wu R, Fu X. Pacific-east Asian teleconnection: How does ENSO affect East Asian climate? J Clim, 2000, 13: 1517–1536
37 Wang B, Zhang Q. Pacific-east Asian teleconnection. Part II: How the Philippine Sea anomalous anticyclone is established during El Niño development? J Clim, 2002, 15: 3252–3265
38 Zhang R, Sumi A, Kimoto M. Impact of El Niño on the East Asian monsoon: A diagnostic study of the '86/87 and '91/92 events. J Mete-orol Soc Jpn, 1996, 74: 49–62
39 Zhang R, Sumi A, Kimoto M. A diagnostic study of the impact of El Niño on the precipitation in China. Adv Atmos Sci, 1999, 16: 229–
241 40 Wang B, Yang J, Zhou T, et al. Interdecadal changes in the major
modes of Asian-Australian monsoon variability: Strengthening rela-tionship with ENSO since the late 1970s. J Clim, 2008, 21: 1771– 1789
41 Wu B, Li T, Zhou T J. Asymmetry of atmospheric circulation anom-alies over the western North Pacific between El Niño and La Niña. J Clim, 2010, 15: 4807–4822
42 Matsuno T. Quasi-geostrophic motions in the equatorial area. J Me-teorol Soc Jpn, 1966, 44: 25–43
43 Gill A E. Some simple solutions for heat induced tropical circulation. Quart J Roy Meteor Soc, 1980, 106: 447–462
Open Access This article is distributed under the terms of the Creative Commons Attribution License which permits any use, distribution, and reproduction
in any medium, provided the original author(s) and source are credited.