
Differences Between Regular and Non-Regular Video Games ...
50
Differences Between Regular and Non-Regular Video Games Players’ Attention Levels in Regards to Change Blindness Jessica Maher Submitted in partial fulfilment of the requirements of the BA Hons in Psychology at Dublin Business School, School of Arts, Dublin. Supervisor: Dr.Katriona O’Sullivan Head of Department: Dr. Sinead. Eccles March 2014 Department of Psychology Dublin Business School
Transcript of Differences Between Regular and Non-Regular Video Games ...

Differences Between Regular and Non-Regular
Video Games Players’ Attention Levels
in Regards to Change Blindness
Jessica Maher
Submitted in partial fulfilment of the requirements of the BA Hons in Psychology at
Dublin Business School, School of Arts, Dublin.
Supervisor: Dr.Katriona O’Sullivan
Head of Department: Dr. Sinead. Eccles
March 2014
Department of Psychology
Dublin Business School

2
CONTENTS
Acknowledgments…………………………………………………………………………….4
Abstract……………………………………………………………………………………….5
1. Introduction……………………………………………………………………….……….6
1.1. A Brief History of Video Games………………………………………………………………………………….6 1.2. Video Games, Aggression and Negative Associations within the General Media………………………...8 1.3.Positive Aspects of Video Game Playing………………………………………………………………….…9 1.4.Emotional and Motivational Benefits of Video Game Playing……………………………………………..11 1.5.Social Benefits of Video Game Playing………………………………………………………………………..12 1.6.Cognitive Benefits of Video Game Playing…………………………………………………………………....12 1.7.The Purpose of This Study……………………………………………………………………………………….14 1.8. Hypotheses…………………………………………………………………………………………………………15
Methodology………………………………………………………………………………...16
2.1. Participants……………………………………………………………………………………………………16 2.2. Design………………………………………………………………………………………………………….16 2.3. Materials………………………………………………………………………………………………………17 2.4.Apparatus…………………………………………………………………………………………………......18 2.5.Procedural Overview………………………………………………………………………………………...18 2.6.Completion of Demographic Questionnaire……………………………………………………………...19 2.7. Flicker Task………………………………………………………………………………………………......19 2.8. Change Blindness (CB) Task…………………………………………………………………………..…...23 2.9. Change Blindness Inducing Video………………………………………………………………....………27
Results…………………………………………………………………………………….…30
3.1. Descriptive Statistics…………………………………………………………………………………………30 3.2. Gamers vs. Non-Gamers in Relation to the Number of Correct Responses for the Flicker and CB Tasks…………………………………………………………………………………………………..……31 3.3. Gender Differences in Relation to the Number of Correct Responses for the Flicker and CB Tasks ……………………………………………………………………………………………………………32 3.4. Age Differences in Relation to the Number of Correct Responses for the Flicker and CB Tasks…32 3.5.Differences in the Number of Correct Responses for the CB and Flicker Tasks in Relation to Participants’ Genre and Platform Preferences……………………………………………………………..…33 3.6. CB Video Results……………………………………………………………………………………………..34

3
Discussion……………………………………………………………………………………36 4.1. Hypotheses Revisited…………………………………………………………………………………………36 4.2. Limitations/Critiques of This Study………………………………………………………………………..38 4.3. Implications for Future Research…………………………………………………………………...……..40 4.4 Conclusion……………………………………………………………………………………………………..41
References…………………………………………………………………………………...42
Appendix…………………………………………………………………………………….45

4
ACKNOWLEDGEMENTS
I would like to thank all those involved with the making of this experiment. I would
particularly like to thank Michael Nolan for his help and guidance throughout the creation of
the attention tasks used within this experiment, and all those who took the time to participate
in this study. I would also like to thank Dr. Katriona O’Sullivan for her valuable and
insightful guidance throughout this study.

5
ABSTRACT
This study aims to contribute further research regarding video game playing and attention
levels. An experiment was conducted, involving several attention tasks such as; a Flicker
task, a Change Blindness task, and a Change Blindness video. Thirty participants (M=11,
F=19) partook in this experiment and were classified as either regular video game players
(N=15) or non-regular video game players (N=15) depending on the number of days they
reported to have played video games over the previous six months. The results from this
experiment revealed a significant difference between regular and non-regular video game
players in relation to the number of correct responses given within the Flicker and Change
Blindness tasks. The other variables tested against the total number of correct scores on the
Flicker and Change Blindness tasks, including; platform preference, genre preference, age
and gender, showed no indications towards significant results.

6
INTRODUCTION
1.1 A Brief History of Video Games
Video games have been at the centre of media attention since their arrival into society
in the 1960’s. Since the arrival of ‘Spacewar!’,(credited as the first widely available computer
game)technology, knowledge and expertise have evolvedimmensely, and so too have the
playable pastimes that are now enjoyed by over 90% of children between the ages of 2 and 17
in the United States of America (NPD Group, 2011).In 1971, the world’s first commercially
available video game, ‘Computer Space’, began the technological revolution, and paved the
way for the evolution of video games, as we currently know them. Up until 1972, video
games were exclusively available for certain computers; however with the release of the
Magnavox Odyssey, an entire new level was unlocked in gaming history.The first arcade
video games were also created and mass produced during this era, including the still instantly
recognisable favourites, ‘Pong’ and ‘Space Invaders’.1976, now referred to as the “8-bit era”,
saw the development of second generation video game consoles,whichfurther boosted the
popularity of video games, as well as sales and profits, allowing more funding to go towards
the evolution of consoles that were then available.However, the video game industry as it is
known today was almost lost in the 1980’s due to several reasons including an overwhelming
amount of third party games that lacked quality, and the then increasing influence of personal
computers (PCs). Subsequently, a gap was left in the video game market, which was filled by
Nintendo, who were able to recuperate the interest in home consoles, with their first
instalment, the Nintendo Entertainment System (NES), which also included ‘Super Mario
Bros.’, one of the bestselling video games of all time. Throughout the rest of the decade, a
console war was initiated between Nintendo and Sega, which was ultimately won by the
former, as they released what became the best-selling handheld gaming console for the next
20 years, the Gameboy.

7
Since then, Nintendo, Sega, and other corporations such as Microsoft and Sony have
all evolved, and produced many new generations of gaming consoles, allowing gaming to
level up from 8-bit pixels into 3D graphics.Current technology within gaming consoles has
allowed gamers and the general public to; get fitfrom the comfort of their living rooms
through the use of the PlayStation(PS)’s ‘Move’ the Wii’s ‘Wii Fit’ and the Xbox 360’s
‘Kinect’, complete basis simple brain exercises on a daily with puzzle solving games such as
‘Dr Kawashima’s Brain Training: How Old Is Your Brain?’ and the ‘Professor Layton’
series, and improve hand eye co-ordination through such games as ‘Link’s Crossbow
Training’, ‘Duck Hunt’ and ‘Wii Sports’, which may explain why a “nationally representative
study of U.S. teenagers found that up to 99% of boys and 94% of girls” regularly engage in
video game playing (Lenhart et al., 2008).It is predicted that several thousand more members
of the public, of all ages, may also be drawn into playing video games more often with the
release of next generation consoles such as the Xbox One, Wii U, and PS4 and the
presentation of new Virtual Reality (VR) equipment, to accompany a number of games such
as;the Virtuix Omni, the Oculus Rift, the Delta 6 controller and the As Real As It Gets
(ARAIG) Gaming Vest. The Virtuix Omni is described as “an omnidirectional treadmill
video game peripheral” by its founding company, Virtuix, is said to allow players to fully
control the movement of characters in games such as ‘Skyrim’ and be used in conjunction
with the Oculus Rift, a virtual reality head-mounted display which will soon be available
commercially. Both of which may also be paired with the Delta 6 controller and ARAIG
Gaming Vest, if so desired in order to give players a completely immersed feel when playing
video games, and by doing so, may heighten or further develop visual attention, spatial
recognition, or general problem solving skills (Presnky, 2012). Although there have been
countless advances within the video games industry, the views of the media have not
followed suit.

8
1.2. Video Games, Aggression and Negative Associations within the General Media
In recent years, video games have received an increasing rate of bad publicity, in
regards to associations with aggressiveness, shootings, and random killing
sprees.Willoughby, Adachi and Good (2012) found, as a result of their study, that “greater
violent video game play predicted higher levels of aggression over time”, however it was also
noted that higher levels of aggressive behaviour were not predicted for those who played non-
violent games. More recently, Hasan and Bushman (2013) also found similar results in
regards to whether or not violent video games increase aggression by a means of inducing
stress in players. By using cardiac coherence, which was defined as “the synchronisation of
the rhythm of breathing to the rhythm of the heart”, Hasan and Bushman were able to deduce
that, those who played violent video games in their study had lower cardiac coherence levels
and higher stress levels than those who played non-violent video games.
In 2010, Anderson et al., investigated the effects of violent video games on aggressive
behaviour, aggressive cognition, aggressive effect, physiological arousal, empathy,
desensitisation and prosocial behaviour. This experiment was different from others similar to
it at the time, as Anderson et al., stated, it had, “more restrictive methodological quality
inclusion criteria than past meta-analyses, cross cultural comparisons, longitudinal students,
conservative statistical controls, multiple moderator analyses and sensitivity analyses”.
Results from this study revealed that there were significant effects for all of the six outcome
variables, which strongly suggested that exposure to violent video games is a causal risk
factor for increased aggressive behaviour, aggressive cognition,aggressive effect and a
decrease in empathy and prosocial behaviour.It was also noted that there was little evidence
to suggest that there are any cultural differences in susceptibility to aggressive behaviour, and
no evidence of any gender differences in susceptibility.
Other behavioural and emotional problems have also been linked to video game

9
playing, including depression, sleep deprivation and increased irritability. In 2011, Lemola et
al. carried out a study that examined “whether the amount and circadian time of habitual
computer game playing” was related to “depressive symptoms in adolescents and young
adults”. 646 young adults and adolescents between the ages of 13 and 30, who regularly play
the MMO (Massively Multiplayer Online) game, ‘World of Warcraft’ (WoW), were asked to
complete an online questionnaire in relation to their playing habits. Results from these
questionnaires allowed Lemola et al., to draw several conclusions. It was found that playing
‘WoW’ regularly between the hours of 10pm and 6am, was linked with an increased risk of
high depression scores, regardless of the total amount of playing time. It was also found that
those between the ages of 13 and 17 were most at risk of developing depression when
routinely playing during 10pm and 12pm, whereas those between the ages of 18 and 22 years
displayed more signs of vulnerability when playing after 2am. Lemola et al., found that the
effects on young adults and adolescents from playing ‘WoW’ throughout the night, were
“partly mediated by daytime sleepiness but not by sleep loss or insomnia problems”.
1.3. Positive Aspects of Video Game Playing
Despite their negative reputation with the media, video games have many redeeming
qualities. Ferguson (2007) conducted an experiment that examined both the positive and
negative effects of violent video games. The results gained, “indicated that publication bias
was a problem for studies of both aggressive behaviour and visuospatial cognition”,
suggesting that the outcomes of various studies looking into this particular topic, may have
been swayed by what the public wanted to read, in order to be able to place blame on
something or someone else, rather than accept their own responsibilities. This lead to
Ferguson claiming that once the publication bias was corrected “studies of video game
violence provided no support for the hypothesis that violent video game playing is associated
with higher aggression”. However, it should be noted that, while the playing of violent video

10
games had no effect on aggression levels, it remained associated with higher levels of
visuospatial cognition. Earlier research in 1994 by Greenfield, Brannon and Lohr examined
similar aspects in relation to cognition, such as the development of spatial representational
skills in conjunction with regular and non-regular video game playing. Findings from this
study indicated that short term video game playing had no effect on a mental exercise
specifically aimed to test spatial representation, however it was concluded that “video
game expertise, developed over the long-term, had a beneficial effect on the spatial skill”
test that was conducted.
Many studies, papers and experiments have been conducted, in relation to the positive
aspects and effects of video game playing. In accordance to recent tragic events research has
been carried out in order to determine whether or not these random acts of homicide are/were
in any way affected or influenced by video games.In 2008, Ferguson examined the
relationship between violent video game usage and school shootings. After carrying out
strenuous research, Ferguson was able to conclude that “no significant relationship between
violent video game exposure and school shootings” were found, leaving readers with the title
question of his paper “Is ‘The School Shooting/Violent Video Game Link: a Causal
Relationship or Moral Panic’?”. Ferguson and Olsenalso found similar results in 2013, when
examining the association between the playing of violent video games and increased bullying
or criminality in children with either “clinically elevated depressive or attention deficit
symptoms”. It was found to have opposite effects, in that the playing of the video games had
a “very slight calming effect on youth with attention deficit symptoms” and even helped to
decrease their behaviour in regards to aggression and bullying. While confirming that no
evidence was found between playing video games and an increase in bullying or criminal
behaviour amongst young adults and adolescents with “clinically elevated mental health
symptoms”,Ferguson also commented on the connection between violent video games and

11
school shootings claiming that, “Statistically speaking it would actually be more unusual if a
youth delinquent or shooter did not play violent video games, given that the majority of youth
and young men play games at least occasionally”. This and other research (Feng, Spence
&Pratt, 2007; Mitchell & Savill-Smith, 2004; Griffiths, 2002) has led to advances within the
area of the positive aspects of video game playing, leading to the prediction that video games
may soon be accepted rather than shunned by the media and used as scapegoats,rather than
understand the complex social and moral issues regarding mass homicide.
1.4. Emotional and MotivationalBenefits of Video Game Playing
In relation to this and other positive aspects of video game playing, Granic et al.,
(2013) investigated and summarised the benefits of playing video games on four main
categorises; cognitive, motivational, emotional, and social. Regarding the motivational
domain, it was found that games provide environments that promote a persistent and
optimistic motivational style that may also extend to other contexts such as school and work.
Research into the emotional domain lead to reappraisal, an emotion-regulation strategy
(Gross & John, 2003), that is an essential aspect for multiple video games. Granic et al.,
(2013) were able to apply this strategy to many games that continuously deliver new
objectives and missions, challenging players to re-evaluate already established strategies in
order to reach their goals, such as in ‘Portal’, where players must solve problems by
manipulating the rules of physics. Once a problem has been solved, the rules and strategies
needed to solve the next problem change suddenly, causing frustration and anxiety in players,
as they must “unlearn” what knowledge they previously used and change their appraisal
systems in order to uncover the new method needed to solve the next puzzle. This was also
seen by Granic et al., (2013) in other games such as ‘Pokémon’, ‘Guild Wars’ and ‘Final
Fantasy’, which require player to develop a number of characters, each with unique skills,
strengths and weaknesses, and associated social behaviours, meaning that players must

12
switch between these characters, and by doing so, quickly reappraise any “emotional
experiences”. By doing so, players learn the benefits of dealing with emotions such as
frustration and anxiety in efficient and adaptive ways.
1.5. Social Benefits of Video Game Playing
In relation to the work of Lenhart et al., (2008), Granic et al., (2013)claimed that
“Contrary to stereotypes, the average gamer is not a socially isolated, inept nerd who spends
most of his (or her) time alone loafing on the couch”. Research in relation to social skills and
video game playing has provided valuable information, as several studies have found an
association between community service and gamers. For example Lenhart et al., (2008) found
that those who play ‘Guild Wars’ and other similar MMOs are more likely to participate in
charitable and communal services in their daily lives by volunteering and raising money for
charities. However, it should be noted that this study did not distinguish a causal effect
relationship between the two.The research of Ewoldsen et al., (2012) and Velez et al., (2012)
has also provided insight into how the cooperative playing of violent video games, increases
prosocial and cooperative behaviour outside of gameplay, in comparison to competitive play.
1.6. Cognitive Benefits of Video Game Playing
“Contrary to conventional beliefs that playing video games is intellectually lazy and
sedating, it turns out that playing these games promotes a wide range of cognitive skills. This
is particularly true for shooter (or action) video games, many of which are violent in nature,
e.g. ‘Halo 4’, ‘Grand Theft Auto IV’)” (Granic et al., 2013). Green & Bavelier provided
similar insight by conducting a study in relation to cognitive abilities and regular video game
playing in 2012. Results from this study concluded that, in comparison to those who very
rarely played video games, regular gamers conveyed “faster and more accurate attention
allocation, higher spatial resolution in visual processing, and enhanced mental rotation

13
abilities” (Granic et al., 2013).A meta-analysis by Uttal et al., (2013) examined the
differences in cognitive enhancements between video game players and individuals
participating in a formal, educational course, which focused on improving spatial skills.
Results from this study showed that the skill improvements from playing video games were at
the same level, if not higher, than those of the participants who paid to undertake a course
specifically designed for the same results. These results show that the playing of video games
can have very similar, if not greater improvements in certain skills, to peer reviewed courses,
which, it is theorised, that the general public will seek out, in an ongoing effort to improve
themselves.
A recent investigation by Tanaka et al., (2013) revealed similar results of “superior
visuospatial cognitive performance in action video game experts”, through the use of
magnetic resonance imaging (MRI) analysis of grey matter volume in participants. It was
found that those who were considered “video game experts” had larger grey matter volume
within their right posterior parietal cortices, when compared to “non-experts”, which was
suggested to be linked habitual video game playing. However, in 2009, Durlach, Kring and
Bowens, were unable to arrive at the same conclusions as Green and Bavelier’s (2003) study,
which they were attempting to replicate, as they failed “to find evidence that habitual action
video game players were superior to non-players when it came to change detection”. Despite
this, results gathered by Castel, Pratt and Drummond (2005), whilst investigating the
relationship between video games and visual selective attention, showed that regular video
game players “possess faster stimulus-response mappings in visual attention tasks”. The
division of visual attention was also examined in relation to video game playing by
Greenfield et al., in 1994. In this investigation, the effects of video game playing expertise
on divided visual attention were examined through a number of visual tests, taken by
college students who either played at an expert, novice, skilful or less skilful level. The

14
experiments conducted in this study, displayed that “video game experts were similar to
novices in manifesting an attentional benefit”, however, unlike the novices, the experts did
not show what was labelled as an “attentional cost” i.e. a slower response time during the
more advanced stage in testing throughout the experiment. Similarly, Bavelier et al.,
(2012) unveiled through a functional magnetic resonance imaging (fMRI) study of
mechanisms such as the fronto-parietal network (FPN), that mediate attention allocation
“were less active during a challenging pattern-detection task in regular gamers than in non-
gamers”, suggesting that regular video game players have the ability to distribute their
attention more resourcefully and discard irrelevant information more appropriately than
those who do not regularly play video games.
1.7. The Purpose of This Study
Although research in relation to both the effects of video games and cognitive
processes is available, many studies have found conflicting results in regards to how effective
video game playing is on attention levels and even fewer studies have discovered a direct link
between video game playing and individuals’ ability to detect change. In order to further add
to the research in this area, this study aims to examine the differences in attention levels, and
abilities to detect minute changes in the environment, between those who regularly play video
games, and those who rarely play video games, through the means of a quasi-experimental
design. This study also aims to contribute to the literature regarding attentional levels, change
blindness, and both the positive and negative effects of playing video games. By doing so,
this study may produce useful information to both professionals and the general public, in
regards to knowing the dangers of change blindness, such as failing to see a speeding car
changing lanes or an item of personal property being stolen until it is too late, and potential
methods in regards to possibly overcoming this visual phenomenon.

15
1.8. Hypotheses
With this in mind, several hypotheses will be put forward and examined in this study.
It is hypothesised that those who play video games regularly will have significantly greater
attention levels than those who do not play video games as frequently, attention levels will be
assessed by participants’ results in regards to the attention tasks used in this experiment.
Participants will also be asked which platform they prefer to play video games on in this
study, therefore it is hypothesised that there will be a significant difference in attention levels
in regards to participants’ personal preferences. It is also hypothesised that there will be a
significant difference in attention levels in regards to participant’s video game genre
preferences. Furthermore, it is hypothesised that there will be significant differences between
the genders and ages of participants’ attention levels. Finally, it is also hypothesised that non
regular video game players will score significantly lower than regular video game players on
the change blindness video task. Overall, the results from this study will contribute to
literature regarding attention levels, change blindness and the general effects of playing video
games, and may also produce useful information to both professionals, and the general
public, in regards to knowing the dangers of change blindness.

16
METHODOLOGY
2.1. Participants
The convenience sample used in this study included thirty (M=11, F=19) participants
consisting of friends, family members and college and university students within the
Republic of Ireland. Participants for this study were recruited by email, social networks and
oral invitations. All participants took part in this study willingly and were not offered any
rewards. All participants received the same questionnaire and set of tasks for this experiment,
however the order of trials within each task was randomised for each participant, in an
attempt to resolve experimenter bias.
Inclusion criteria for this experiment required participants to be eighteen or older. The
exclusion criteria for this experiment were outlined on the consent form given to each
participant, which they were required to sign before the experiment could begin, and did not
allow those who met any of the following conditions to partake: being younger than eighteen
years old or suffering from epilepsy, poor/uncorrected vision, colour vision deficiency
(colour blindness), or any negative side/effects from flashing lights/screens. Participants were
categorised into two groups; regular video game players (M=9, F=6)and non-video game
players (M=2, F=13), based on their answers to the demographic questionnaire and previous
studies by Green and Bavelier (2003) and Castel et al. (2005).
2.2. Design
This study used a quasi-experimental design, which was selected based on the aim of
this study; to establish a causal relationship between video game playing and attention levels.
The independent variable within this experiment consisted of the number of hours
participants spent recreationally playing video games. The dependent variables in this
experiment consisted of participants’ total scores in regards to the cognitive tasks (i.e. the

17
number of times each participant responded correctly), and participants’ platform
preferences. The cognitive tasks administered in this experiment included; a Change
Blindness (CB) task (Beck & Levin, 2003), a Flicker task (Rensink, O’Regan & Clark, 1997)
and a change blindness inducing video, based on the work by Simons and Chabris (1999).
Participants in this experiment included those who regularly played video games and
those who very rarely played, if at all, and were divided accordingly. This experiment
followed the same criterion as Green and Bavelier (2003) and Castel et al. (2005) to
categorise participants as either regular, or non-regular video game players. Regular video
game players were defined as those who played for four or more days a week, for the past six
months, whereas non-regular video game players were distinguished by not meeting the
criterion to be classed as a regular video game player.
2.3. Materials
This experiment was conducted throughout various different settings, as there were no
particular environmental issues required in order to complete the questionnaire and tasks
provided, other than the exception of a lack of excessive noise and/or similar distractors. All
essential materials for this experiment were self-provided, such as pen and paper
questionnaires with attached consent forms. Chairs and tables for the participants’ comfort
were already made available in the settings or environments in which the experiment took
place. The questionnaire used throughout this experiment, was created by the experimenter,
and was utilised in order to gain demographic information, and record certain responses for
the tasks completed by participants. Both the questionnaire and consent form used in this
experiment can be seen in full in the appendices.

18
2.4. Apparatus
The attention tasks within this experiment were generated by a 15.6" High-Definition
LED HP Brightview Display (1366 x 768) HP Pavilion G6, with the software, E-Run. Each
attention task was self-created, self-supplied, and based on previous research as referenced
accordingly, through the use of E-Prime, Bandicam and SuperLab versions 4.0.8-5.0. In the
case of the Flicker task (Rensink, O’Regan & Clark, 1997), participants’ responses were
reported verbally and were recorded on paper by the experimenter. Participant’s responses in
the CB task (Beck & Levin, 2003) were recorded electronically, through the software E-
Prime. The responses for the CB video were recorded on paper, in the space provided at end
of the distributed questionnaire. All responses were later entered into IBM’s Statistical
Package for the Social Sciences (SPSSv21) software, for further analysis.
2.5. Procedural Overview
The convenience sample for this experiment were asked to participate either verbally,
or through written invitation through emails and social network messaging. Once
participants’ agreement to take part in this study was confirmed, an agreed time was assigned
to each member of the sample. Participants were met at their convenience, in generally quiet
environments, so as they were not to be disturbed during the experiment.
Upon meeting with the potential participant, it was suggested to move to the quietest
place possible within the vicinity, in an attempt to avoid distraction, and gain the most
accurate results possible. Once the optimal level of noise and lack of distractors had been
reached, the experimental procedure was fully explained to each participant, after which, they
were invited to ask any questions they may have had in relation to the experiment itself, or
anything in relation to the research and/or topic of this study. All participants were then
informed, both verbally and later through the use of the distributed consent form, that the

19
results obtained from this study were anonymous, and that they were free to leave at any
point during the experiment with no negative consequences. A questionnaire with an attached
consent form was then distributed to each participant. Participants were required to read
through and tick the appropriate box, declaring that they were over the age of eighteen and
did not suffer from any of the health issues outlined, before the experiment began.
Anonymity was ensured by placing completed questionnaires and consent forms in a sealed
envelope. Each participant was given a number determined by sequential order, which was
solely used to connect results from questionnaires and cognitive tasks. This number in no
way allowed the experimenter to determine the identity of participants. This was explained in
full to each member of the sample before the experiment began.
2.6. Completion of Demographic Questionnaire
The experiment began once participants had completed the first section of the self-
provided questionnaire, which involved purely demographic questions. The software, E-Run
was then initiated, and the appropriate experiment file was opened. Participants could begin
the cognitive tasks presented throughout this experiment, at their own pace, by pressing the
spacebar; this instruction was given both verbally, and presented as a written instruction at
the beginning of the experiment. Participants were then required to complete a CB task
(Beck & Levin, 2003), Flicker task (Rensink, O’Regan & Clark, 1997) and CB video, based
on the work by Simons and Chabris (1999). The tasks within this experiment could not be
administered at random, due to restrictions within E-Prime, however it was possible to
randomise the trials within each task.
2.7. Flicker Task
The Flicker task used in this experiment was designed and based upon the information
provided in Rensink, O’Regan and Clark’s paper, published in 1997. Within this paper,

20
several experiments were conducted, all of which followed a similar general method. This
method explained that the Flicker sequences were “composed of an original image A” and a
“modified version A’, displayed in the sequence A, A, A’, A’ ” (see Figure. 1). Each image
throughout the Flicker task was displayed for 240ms, and was followed by an 80ms
interstimulus interval (ISI), which erased the screen, causing a ‘flicker’. It was noted by the
original experimenters that each image was to be presented twice before being modified or
changed in any way in order to create “a degree of temporal uncertainty as to when the
change was being made”.
The Flicker task used in this experiment followed the same general method as
described above, and used “forty-eight colour images of real-world scenes” to create forty-
eight trials within this task. Attempts were made by the experimenter to contact the original
researchers in an effort to gain access to the original images. This however proved
unsuccessful, leading to the images used in this task being self-supplied by the experimenter.
Within each of these trials, a distinct change; either colour, location, or presence/absence was
made to a particular section in the modified (A’) picture.
Due to the software, E-Prime, not being able to carry out the functions that were
required to create this task, the experimenter was required to create each trial for this task
within SuperLab, before transferring the final output into E-Prime. This was achieved by
developing each trial within this task individually, to follow the sequence A, A, A’, A’, for a
duration of sixty seconds, and then running the trial, whilst using the screen capture software,
Bandicam, to create sixty second videos of each Flicker. This was a necessary step, as it
allowed for participants to be able to stop the trial at any time, in order to signal that they
noticed a change, rather than having to wait for the full sixty seconds for the entire sequence
to finish, before being able to comment.

21
Before starting the forty-eight trials within this task, participants were given a series
of instructions, explaining the possible types of changes that may occur between images, and
to press the spacebar when these changes were noticed. Further instructions explained to
participants that once they had noticed the change occurring, and had pressed the spacebar,
they were to verbally describe the change that they believed to have occurred. These
responses were recorded on paper by the experimenter, and were later analysed to determine
whether or not they were correct. In order for a response to be considered correct, participants
were required to both state the object that was being modified, and the change that was taking
place. Participants were then informed that they would be taking part in six practice trials for
this task, in order to fully understand what the task would entail. Once the participants had
completed the practice trials, they were informed that the real trials for this task would begin
after they pressed the spacebar. The practice and real trials within this task were shown
Figure 1. An explanation of the sequence of images occurring within each trial in the Flicker Task as seen in Rensink, O’Regan and Clark’s (1997) paper.

22
atrandom, within their respective sections. Three practice trials demonstrating each of the
possible types of changes occurring within the images can be seen in Figures 2-4.
Figure 2. Flicker Task Practice Trial 1 - demonstrating a colour change (circled) that could occur during the trials in this task.
Figure 3. Flicker Task Practice Trial 4 - demonstrating a location change (circled) that could occur during the trials in this task.

23
2.8. Change Blindness (CB) Task:
The CB task used in this experiment was centred around the work of Beck and Levin
in 2003. Similarly to Rensink, O’Regan and Clark’s paper (1997), Beck and Levin (2003)
conducted a number of experiments, all of which followed the same general method.
However, it should be noted that there were slight differences between each of the
experiments carried out by Beck and Levin (2003), and that the CB task within this
experiment focused mainly on “Experiment 1”. The CB task used in this experiment,
involved an array of images that were created using the two-hundred-and-sixty images found
in Snodgrass and Vanderwart’s (1980) paper. During the creation and design of this task,
great detail and care were taken by the experimenter in order to ensure that each image was
equal in size, by measuring each image to be approximately 4.5cm high or wide. This task
consisted of sixty trials, four of which, were practice trails, added by the experimenter, in
order to maximise the probability of obtaining accurate results.
During their creation, these trials were divided into four categories by the
experimenter; Line Modification, Line Replacement, Scatter Modification and Scatter
Figure 4. Flicker Task Practice Trial 6 - demonstrating a presence/absence change (circled) that could occur during the trials in this task.

24
Replacement, in an attempt to replicate the original paper’s use of pre and postchange arrays,
in the fairest way possible. Arrays of pre and postchange images were described to “vary in
size from 3 to 16 objects”, and it was explained that within each trial of this experiment “all
objects were the same except that 1 of the objects in the postchange array (postchange object)
was different from the corresponding location of the prechange array (prechange object).”
These differences could involve either the replacement or modification of the postchange
object. Following Beck and Levin’s (2003) original paper, the “objects were randomly
chosen” for each array of images and the “postchange object was randomly chosen from all
images except those already in the prechange array”.
Similarly to the Flicker task, E-Prime was not able to carry out the required functions
to create the CB task for this experiment. Therefore, the same general steps regarding the
procedure for creating the Flicker tasks were carried out during the production of the trials for
this task. This involved setting up each trial individually in SuperLab and running the
experimental file, whilst using the screen capture software, Bandicam, to create four second
videos of each array of images. These videos were then transferred and used to create the
trials for this task, within E-Prime.
This task began with the presentation of onscreen instructions, detailing that the
participants would be shown a number of trials. It was explained that in each of these trials,
participants would be shown an array of images for two seconds, followed by a brief gap (a
350ms ISI in which the screen was erased) and finally the same array of images with a slight
difference, for a further two seconds. Participants were informed that their task was to
identify and select the object which they believed to have changed. A question screen was
presented after each set of images, prompting participants to select, what they believed to be
the object that had been modified or replaced by pressing the A, B, C, or D button on the
keyboard. The results for this task were recorded electronically by E-Run as the experiment

25
was being carried out.Each trial within this task was programmed to identify the correct
response key and to be able to detect whichoption participants had chosen. For example, E-
Run was able to determine if participants had selected the correct answer by pressing the D
key, or if they had selected an incorrect answer, by pressing the A key. An example of each
of the practice trials for this task, outlining the different types of changes that took place
throughout this experiment, as well their corresponding question screens, can be seen in
Figures 5.1-8.2. In an effort to ensure that this task was as fair as possible, the four practice
and fifty-six real trials were also randomised in the respective sections.
Figure 5.2. CB Task Practice Trial 1 - question screen.
Figure 5.1. CB Task Practice Trial 1 - demonstrating a modification change (circled) that could occur during the trials in this task.
26
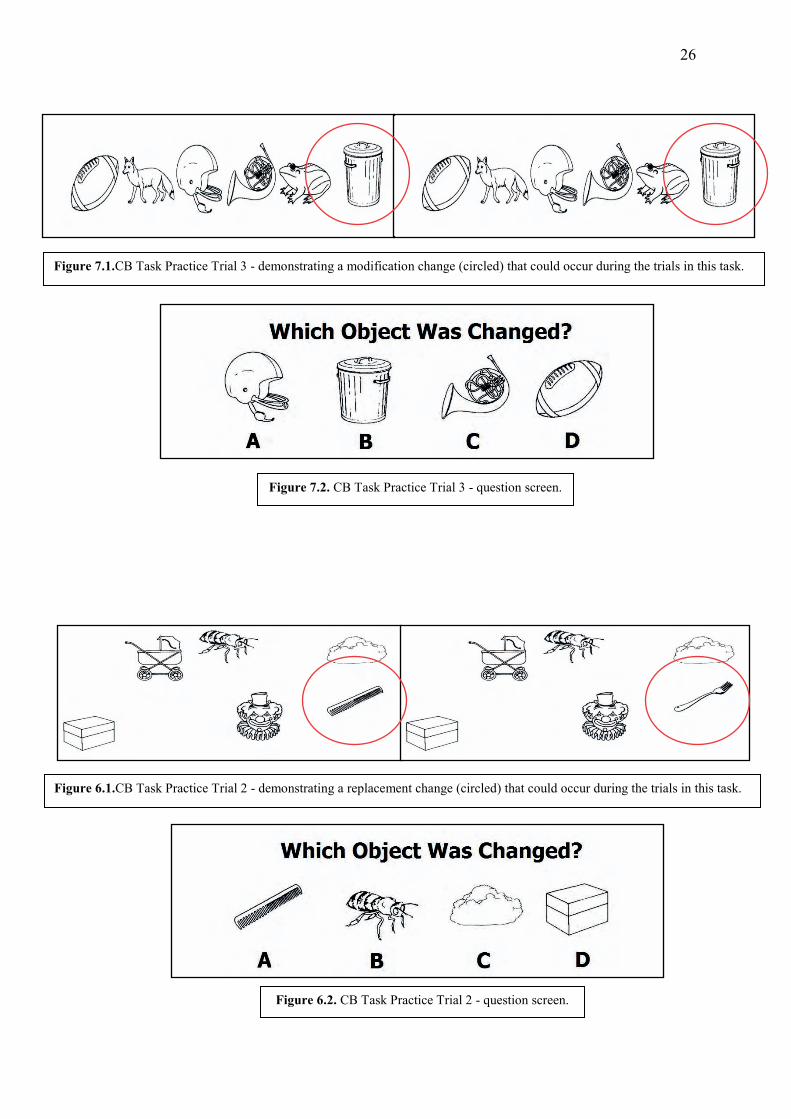
Figure 7.2. CB Task Practice Trial 3 - question screen.
Figure 7.1.CB Task Practice Trial 3 - demonstrating a modification change (circled) that could occur during the trials in this task.
Figure 6.2. CB Task Practice Trial 2 - question screen.
Figure 6.1.CB Task Practice Trial 2 - demonstrating a replacement change (circled) that could occur during the trials in this task.

27
2.9. Change Blindness Inducing Video:
This experiment also included a thirty-two second video clip, which was edited
appropriately by the experimenter through the use of Windows Movie Maker. This clip was
designed to induce change blindness and was based on the work by Simons and Chabris
(1999). Before this video clip was shown, participants were given onscreen instructions,
explaining that they would be shown a brief video, and to press the spacebar when they
wished to begin the task. At this point, it was also brought to the attention of the participants
to turn to page four of the questionnaire before progressing any further. Upon pressing the
spacebar, the video began with additional onscreen instructions to “Count the number of
times the seagull drops the stick” before showing the actual change blindness inducing clip.
The video shown consisted of a beach setting with a number of seagulls, one of which was
seen to ‘drop’ or ‘throw’ a stick five times throughout the duration of the video. At the end of
this brief scene, participants were asked if they noticed anything unusual, and if they did, to
Figure 8.2. CB Task Practice Trial 4- question screen.
Figure 8.1.CB Task Practice Trial 4 - demonstrating a replacement change (circled) that could occur during the trials in this task.

28
record their answers/comments in the space provided on the questionnaire. It was later
recorded electronically by the experimenter, through the use of SPSS 21, whether or not
participants answered the question accurately regarding the number of times the seagull
dropped the stick, and whether or not they noticed the large and prominent crocodile at the
bottom right hand corner of the screen. Responses for this task were recorded on paper
(within the relevant section on the questionnaire) by the participants, and were later analysed
by the experimenter. Responses for the number of times the seagull dropped the stick were
either deemed correct, if it was reported that the seagull dropped the stick five times, or
incorrect if participants answered otherwise. Responses to the question regarding anything
unusual being seen in this video were also recorded in this way. These responses were
analysed by the experimenter and deemed as either being correct; i.e. participants answered
yes to noticing something unusual and correctly identified the crocodile and its position, or
no i.e. participants did not report seeing anything unusual throughout the video.A number of
screenshots of this video, including the point at which the crocodile is present, can be seen in
Figures 10, 11 and 12. This video, rather than the original video shown in Simons and
Chabris’ (1999) study, was used in an attempt to gain the most reliable results, as many of the
participants involved in this study were students of psychology and had previously seen the
“Gorillas in our midst” video and therefore may have been considered a biased sample.

29
Figure 10. CB Video Task – seagull shown holding the stick (circled).
Figure 11. CB Video – seagull shown dropping the stick (circled).
Figure 12. CB Video – crocodile (circled), shown roughly seventeen seconds into the clip.

30
RESULTS
A total of thirty participants partook in this experiment, nineteen were female (F=19)
and eleven were male (M=11). Each participant was exposed to all conditions of this
experiment; therefore there were no group divisions. This study aimed to test the differences
in attention levels between people who regularly played video games and those who do not.
The data collected in this experiment was tested for normality through the use of skewness
and kurtosis analysis in SPSS results showed that the data met criteria for parametric
analysis.
3.1. Descriptive Statistics
Descriptive statistics were run for the following variables within this study; age,
whether or not participants liked to play video games, how often participants spent playing
games, and were split based on whether or not participants were classified as gamers (i.e.
those who played video games for 4-5 days or more per week) or non-gamers (i.e. those who
played video games less than 4-5 days per week). Descriptive statistics for the above
variables included mean, standard deviation, range, minimum and maximum. Gamers had a
mean age of 22.47 (SD = 4.49), whereas non gamers had a mean age of 29.80 (SD = 11.86).
The mean number of hours per day spent by non-gamers playing video games was
1.13 (SD = .516) whereas gamers spent a mean of 2.47 (SD = 1.06) hours per day playing
video games. Gamers reported to have spent a mean of 2.73 (SD = 1.21) hours per week
playing video games, and non-gamers reported to have spent a mean of 1 (SD = .00) hour per
week of video game playing.

31
27.53
41.13
23.07
37.8
0
5
10
15
20
25
30
35
40
45
Mean number of correct scores on the Flicker Task Mean number of correct scores on the CB Task
Num
ber o
f cor
rect
scor
es
Average Number of Correct Responses From Participants In Relation To The Flicker and CB Tasks
Gamers
3.2. Gamers vs. Non-Gamers in Relation to the Number of Correct Responses for the
Flicker and CB Tasks
In relation to gamers and non-gamers, an independent t-test was utilised to determine
the differences for overall correct results for the Flicker task. Gamers (mean = 27.53, SD =
5.93) were found to have a greater number of correct responses in regards to the flicker task,
than non-gamers (mean = 23.07, SD = 5.15). The 95% confidence limits show that the
population mean difference of the variables lies somewhere between .315 and 8.618. An
independent samples t-test found that there was a statistically significant difference between
the number of correct responses of the flicker task of gamers and non-gamers (t (28) = 2.20, p
= .036). Therefore the null hypothesis was rejected. Similarly gamers (mean =41.13, SD =
2.17) were found to have more correct responses in relation to the CB task distributed in this
experiment, than non-gamers (mean = 37.80, SD = 4.93) leading to the discovery, through the
use of another independent samples t-test, of a statistically significant difference between the
number of correct responses within the CB task of gamers and non-gamers (t (28) = 2.04, p =
.023). Therefore the null hypothesis was again rejected. See Table 1.
Table 1. Bar chart showing significant results in relation to the average number of correct scores in the Flicker and CB tasks between gamers and non-gamers.

32
3.3. Gender Differences in Relation to the Number of Correct Responses for the Flicker
and CB Tasks
An independent samples t-test was administered in relation to gender differences and
the number of total correct responses for participants in relation to the Flicker and CB tasks.
Although, males (mean = 27.73, SD = 8.13) were found to have answered more trials
correctly than females in regards to the Flicker Task (mean = 23.89, SD = 3.73). No
significant difference was found between males and females in regards to the number of
correct answers reported for the Flicker task. Therefore the null could not be rejected. The
independent samples t-test revealed similar results in relation to the number of correct
responses within the CB task although, males (mean = 41.18, SD = 3.46) were found to have
answered more trials correctly than females in regards to the CB task (mean = 38.47, SD =
4.21) the difference was not significant, therefore the null was accepted.
3.4. Age Differences in Relation to the Number of Correct Responses for the Flicker and
CB Tasks
For the purpose of this analysis, participants were divided into two age groups;
twenty-five and below(N=20), and twenty-six and over(N=10). Those twenty-five and below
had a greater number of correct responses in relation to the Flicker task (mean = 26.65, SD =
5.86) than those who were twenty-six and older (mean = 22.60, SD = 2.75). The independent
samples t-test used found that there was not a significant difference between the age groups
regarding the number of correct answers reported for the Flicker task. Therefore, in this case,
the null was accepted. Similar results were derived in relation to the number of correct
responses in the CB task between the two age groups (25 and below mean = 39.75, SD =
3.28, 26 and above mean = 38.90, SD = 5.59), as the independent samples t-test resulted in no
significant difference, therefore the null was accepted.

33
3.5. Differences in the Number of Correct Responses for the CB and Flicker Tasks in
Relation to Participants’ Genre and Platform Preferences
A Pearson’s R Correlation was also used during the analysis of the data presented in
this experiment. This method of data analysis was usedto examinethe differences between
genre preferences and the number of correct responses within the Flicker and CB tasks. The
twelve genres within this experiment were categorised into four sections during this analysis
of results. These categories included Genre AAF (Action, Adventure, FPS), Genre SDS
(Sports, Driving, Simulation), Genre HON (Horror, Other, None) and Genre MMO (MMO,
RPG, Puzzle). A Pearson Correlation Coefficient found that there was no significant
relationship between the number of correct responses for the Flicker task and AFF genre
preference group (r (30) = .426, p > .05), or between the number of correct responses for the
CB Task and AFF genre preference group (r (30) = .596, p > .05). Both null hypotheses were
accepted. A Pearson Correlation Coefficient found that there was no significant relationship
between the number of correct responses for the Flicker task and SDS genre preference group
(r (30) = .168, p > .05), or between the number of correct responses for the CB Task and SDS
genre preference group (r (30) = .608, p > .05). The null hypotheses were accepted. No
significant relationship was shown between the number of correct responses to the Flicker
task and HON genre (r (30) = .833, p > .05) or the number of correct responses to the CB task
and HON genre (r (30) = .187, p > .05). The null hypotheses were accepted. A Pearson
Correlation Coefficient found that there was no significant relationship between the number
of correct responses for the Flicker task and MMO genre preference group (r (30) = .191, p >
.05), or between the number of correct responses for the CB Task and MMO genre preference
group (r (30) = .748, p > .05). The null hypotheses could not be rejected.
The difference between platforming preferences and the number of correct responses
in the CB and Flicker tasks were also examined. The twelve platforms within this experiment

34
were categorised into four main sections during this analysis of results. These categories
included Nintendo (Wii, Wii U, Nintendo 3DS, DS(i)(Lite)(XL)), Microsoft (Xbox360,
XboxOne), Sony (PS3, PS4, PSP) and PC/Other (PC, Other, None). ‘Other’ platforms
included iPads, IOS and Android Phones, GameCubes and Super Nintendo Entertainment
Systems (SNES’). A Pearson Correlation Coefficient found that there was no significant
relationship between the number of correct responses for the Flicker task and Nintendo
preference group (r (30) = .840, p > .05), or between the number of correct responses for the
CB Task and AFF genre preference group (r (30) = .133, p > .05). Both null hypotheses were
accepted. A Pearson Correlation Coefficient found that there was no significant relationship
between the number of correct responses for the Flicker task and Sony preference group (r
(30) = .175, p > .05), or between the number of correct responses for the CB Task and Sony
preference group (r (30) = .676, p > .05). The null hypotheses were accepted. No significant
relationship was shown between the number of correct responses to the Flicker task and
Microsoft (r (30) = .728, p > .05) or the number of correct responses to the CB task and
Microsoft preference (r (30) = .351, p > .05). The null hypotheses were accepted. A Pearson
Correlation Coefficient found that there was no significant relationship between the number
of correct responses for the Flicker task and PC/Other preference (r (30) = .366, p > .05), or
between the number of correct responses for the CB Task and PC/Other preference (r (30) =
.456, p > .05). The null hypotheses could not be rejected.
3.6. CB Video Results
It was noted that none of the thirty participants noticed the crocodile, shown in the CB
video and Figure 12, therefore the hypothesis that gamers would be more accurate in relation
to the detection of changes within the video clip shown, was disproven, and is therefore
rejected. The bar chart shown below (see Table 2) provides illustrative information, in

35
1
0 0
3
2
6
0
1 1
0
1
0 0 0 0
5
6
2
1 1
0 0 0
1
2
3
4
5
6
7
0 1 2 3 4 5 6 7 8 9 10
Num
ber o
f par
ticip
ants
Number of times the seagull dropped the stick
Participants' Responses in Regards to How Many Times the Seagull Dropped the Stick
Gamers
Non-Gamers
regards to the accuracy of all participants, in relation to the number of times the seagull in the
video was shown to drop the stick.
Table 2. A bar chart illustrating the frequency table used to statistically analyse participants’ responses in relation to the number of times the seagull was believed to have dropped the stick during the CB video.

36
DISCUSSION
The aim of this study was to examine if there were any differences in attention levels,
particularly in regards to change blindness, between those who regularly play video games
and those who do not. This study also aimed to add to the current positive information in
regards to video games such as the findings put forward by Granic et al., (2013), as the
majority of information made public focuses mainly on negative aspects of video games such
as; aggression (Willoughby, Adachi & Good, 2012; Hasan & Bushman, 2013) social
problems, emotional instability, sleeping problems, and increased irritability (Lemola et al.,
2011).
The findings of this study contradict those of Durlach, Kring and Bowens (2009) who
failed to notice any direct link between video games and attention levels. This study did
however provided similar findings as Green and Bavelier (2003),Castel, Pratt and Drummond
(2005), and Ferguson (2007) in relation to a significant difference between those who
regularly play video games and those who do not, in regards to attention tasks. This suggests
that there may be other advantages to playing video games, such as “superior visuospatial
cognitive performance” (Tanaka et al., (2013) and a larger “development of spatial
representational skills” (Greenfield, Brannon & Lohr, 1994)other than merely boosting
attentional levels, as was somewhat demonstrated in this study.
4.1. Hypotheses Revisited
It was hypothesised that there would be a significant difference between regular and
non-regular video game players in relation to the ability to detect change blindness, by
examining the results gathered from the distributed questionnaire. However, this study
concluded no significant results in relation to this hypothesis, as every participant in this
experiment failed to notice the occurrence of the change blindness image (i.e. the crocodile),

37
during the presentation of the CB video. This may have been influenced by an inability to see
the screen at an adequate level, due to gleam/sunlight, or because of lack of information from
participants in regards to the true nature of eyesight. Another reason suggests that participants
may simply have not been paying full attention to the video whilst it was being shown, due to
distractors or lack of interest. Future experiments involving CB videos are advised to ensure
the maximum quality of the videos used is reached, before their administration to
participants.
It was also hypothesised that there would be a significant difference between regular
and non-regular video game players in relation attention levels. Attention levels were
determined by the number of correct responses given by the participants in the Flicker and
CB tasks. A significant result was found in this case, revealing that regular gamers, scored
significantly higher in terms of the number of correct answers in the Flicker and CB tasks,
than non-regular gamers. This may have been due to the competitive nature of the regular
video game playing participants, as witnessed by the experimenter, or simply because of
superior cognitive skills. This may also have been due to the learned helplessness displayed
by some non-regular video game players, whilst completing the CB task.
A hypothesis in relation to differences in gender and attention levels was also
suggested. No significant results were gained from this investigation. This may have been
due to the uneven ratio of females to males within this experiment (19:11). This may also
have been related to the uneven ratio of regular and non-regular video game players, within
each gender, i.e. there were thirteen non-regular gaming females, and only six regular gaming
females, as well as there being two non-regular gaming males, and nine regular gaming
males. Future studies may be able to investigate this hypothesis further, and provide more
valuable results, with an even number of regular and non-regular video game playing males
and females.

38
It was also hypothesised that there would be a significant difference in regards to the
age of participants and their attention levels. An independent samples t-test found no
significant result for this hypothesis, which may have again been due to an uneven
distribution of participants, as there were twenty people who claimed to be twenty-six years
old or older, and only ten people who claimed to be twenty-five years old or younger.
Furthermore, it was hypothesised that there would be a significant relationship
between participant’s platforming preferences and their attention levels. No significant results
were found in relation to this. As previously stated, this hypothesis may have again been
affected by an uneven distribution of platform preferences amongst participants. Five
participants reported preferring to play the Wii, Wii U, Nintendo DS (3DS/DS i/DS Lite/DS
XL), nine participants claimed that they preferred to play the Xbox360 or XboxOne, three
participants reported to prefer playing the PS3, PS4 or PSP, and the majority of participants
(N=18) claimed to prefer playing the PC, other consoles, or to have no preference at all.
Finally, it was hypothesised that there would be a significant difference in attention
levels between the participants’ personal preferences in relation to video game genres. Again,
no significant results were found in relation to this hypothesis. This may have been due to the
grouping of similar genres by the experimenter, in an attempt to ease the difficulty when
examining the relationship. Future studies may be able to rectify this error, by diving future
experiments into segments, to examine one particular genre preference at a time. Further
analysis of this relationship may provide a valuable source of information for console
producing companies which, in turn, may be used as marketing campaign, or during the
production of new products.
4.2. Limitations/Critiques of This Study
Several limitations were met during the development, and administration of the
experiment used within this study. Firstly, the softwares required in order to create the

39
experiments used within this experiment were not readily available due to licensing
requirements and purchases. Two computers with one of the softwares, were made available
by Dublin Business School (DBS), however, due to the heavy demand that was currently
placed on these computers at the time of creation of this experiment, accesses to these
computers was very limited. Therefore, reliance on the head of information technology within
the establishment was necessary, which caused significant time delays, as said IT consultant
was also faced with the task of assisting at least fifty other students simultaneously. It was
also noticed by the experimenter that those who were known to be fanatic and regular video
game players were sometimes classed as otherwise, due to the focus of the question being
presented. Participants were asked ‘Over the past six months, roughly, how many days per
week have you played video games?’ therefore, it should be noted that due to the timing in
which this study was conducted, several participants were under copious amounts of stress to
meet deadlines, and therefore may not have played video games as much as they usually
would, if they had a lighter workload. Participants for this experiment consisted mainly of
those in full time education, or in full time work, therefore this study was slightly limited, as
several of the participants used in this study were difficult to pinpoint and reach on desired
occasions. In contrast to this, it also found that certain participants who readily expressed
desire to take part in this experiment, were unfortunately not over the age of eighteen, and
therefore did not meet the criteria necessary to take part.
The experiment used in this study was also rather time consuming, as it took
participants roughly five to ten minutes to complete the demographic questionnaire, and
anywhere from thirty to sixty minutes to complete the attention tasks. This caused some
participants to become aggravated during the administration of the experiment, which may
have affected their responses to the questions asked, which may also have caused participants
to display symptoms of learned helplessness, as mentioned above. This limitation was

40
resolved however, through the experimenter’s use of appealing to the competitive nature of
the participants, by challenging them to produce greater scores than those of the other
participants known to them to have been a part of the experiment.
Furthermore, it was noted that some of the participants who volunteered in this
experiment, did not speak English as their first language. Therefore, some difficulties were
met, in regards to the understanding of the onscreen written instructions, when completing
the attention tasks and completing the questionnaire. Finally, it was noted by several
participants that there were rather prominent lags on some of the trials in the Flicker task.
This may be because of the restrictions the experimenter endured when creating the trials and
tasks, as in certain occasions, there were only demonstrative versions of the softwares
required available. This may have been rectified by using the computers made available
within DBS, however, due to time and resource restrictions, this was not a reliable option.
4.3. Implications for Future Research
As a result of a statistically significant difference in regardto attention levels (i.e. the
total number of correct responses within the Flicker and CB tasks), the main implication of
this study will be an indication and foundation for future research and studies in the area.
Although no significant findings were drawn from the analysis of other variables, an
encouraging start has been made in relation to the examination of attention levels,
platforming and genre preferences, which will provided the basis of future studies. This study
may also be expanded by the experimenter at a higher level of education so as to continue
and further positive research within the field of video games and their effects. The results and
research found from this study will also highlight the visual phenomenon that is change
blindness, and have several implications in relation to the general publics’ awareness and
attention levels, as it has been made particularly clear, through the use of the experiment

41
within this study, that human beings have not yet fully adapted to detecting everything within
their environment and immediate proximity. By doing so, this study will highlight the
dangers of change blindness which, in turn, will provide eye opening information so as to
avoid any unnecessary road collisions, hit and run incidents, or other similar situations which
involve spilt second changes in the environment.
4.4. Conclusion
In conclusion, this study has broadened the current knowledge in relation to video
game playing and attention levels. Several significant observations have been discovered,
suggesting that the playing of video games, despite what has been previously negatively
reported, may actually provide various benefits, such as a heightened ability to notice and
detect changes in the environment. Although the null hypotheses were accept in certain
aspects of this study, the foundations in relation to platforming and genre preferences and
their effects on attention levels have been laid. This study has also helped to provide more
positive information for video game playing and has outlined how dangerous and slightly
unnerving change blindness and lacks in attention can be, as it has been demonstrated that
several of the participants within this study could not identify a change that was repeatedly
changing in front of their eyes.

42
REFERNCES
Anderson, C., A., Ihori, N., Bushman, B., J., Rothstein, H., R., Shibuya, A., Swing, E., L.,
Sakamoto, A., Saleem, M. (2010) Violent Video Game Effects on Aggression, Empathy, and
Prosocial Behaviour in Eastern and Western Countries: A Meta-Analytic Review.
Psychological Bulletin, Vol. 136, 2, 151-173.
Bavelier, D., Achtman, R. L., Mani, M., & Föcker, J. (2012). Neural bases of selective
attention in action video game players. Vision Research, 61, 132–143.
doi:10.1016/j.visres.2011.08.007
Beck, M.R. & Levin, D.T (2003).The role of representational volatility in recognizing pre-
and postchange objects. Perception & Psychophysics, 65, 458-468.
Castel, A. D., Pratt, J., & Drummond, E. (2005) The effects of action video game
experience on the time course of inhibition of return and the efficiency of visual search. Acta
Psychologica 119 (2005) 217–230
Durlach, P. J., Kring, J. P., & Bowens, L. D. (2009).Effects of Action Video Game
Experience on Change Detection.Military Psychology (Taylor & Francis Ltd), 21(1), 24-39.
doi:10.1080/08995600802565694
Ewoldsen, D. R., Eno, C. A., Okdie, B. M., Velez, J. A., Guadagno, R. E., & DeCoster, J.
(2012). Effect of playing violent video games cooperatively or competitively on subsequent

43
cooperative behaviour.Cyberpsychology, Behaviour, and Social Networking, 15, 277–280.
doi: 10.1089/cyber.2011.0308
Feng, J., Spence, I., and Pratt, J. (2007). Playing an action video game reduces gender
differences in spatial cognition. Psychol. Sci. 18, 850–855.
Ferguson, C. J. (2007). The Good, The Bad and the Ugly: A Meta-analytic Review of
Positive and Negative Effects of Violent Video Games. Psychiatric Quarterly, 78(4), 309-
316. doi:10.1007/s11126-007-9056-9
Ferguson, C. J. (2008). The school shooting/violent video game link: causal relationship or
moral panic?.Journal Of Investigative Psychology & Offender Profiling, 5(1/2), 25-37
Ferguson C .J, Olson C. (2013). Video game violence among ‘vulnerable’ populations: the
impact of violent games on delinquency and bullying among children with clinically elevated
depression or attention deficit symptoms, Journal of Youth and Adolescence. DOI
10.1007/s10964-013-9986-5
Granic, I., Lobel, A., & Engels, R. E. (2013).The Benefits of Playing Video Games.American
Psychologist, doi:10.1037/a0034857
Green, C. S. & Bavelier, D. (2003). Action video game modifies visual selective attention.
Nature, 423, 534-537.
Green, C. S., & Bavelier, D. (2012).Learning, attentional control, and action video
games.Current Biology, 22, 197–206. doi:10.1016/j.cub .2012.02.012

44
Greenfield, P. M., DeWinstanley, P., Kilpatrick, H. & Kaye, D. (1994). Action video games
and informal education: Effects on strategies for dividing visual attention. Journal of Applied
Developmental Psychology, 15, 105-123
Greenfield, P. M., Brannon, C. & Lohr, D. (1994). Two-dimensional representation of
movement through three-dimensional space: The role of video game expertise. Journal of
Applied Developmental Psychology, 15, 87-103
Griffiths, M. (2002) The Educational Benefits of Video Games. Education and Health, 20
(3), 47-51.
Gross, J. J., & John, O. P. (2003). Individual differences in two emotion regulation processes:
Implications for affect, relationships, and wellbeing. Journal of Personality and Social
Psychology, 85, 348–362. doi:10.1037/0022-3514.85.2.348
Hasan, Y., Bègue, L., & Bushman, B. J. (2013). Violent Video Games Stress People Out and
Make Them More Aggressive. Aggressive Behaviour, 39(1), 64-70. doi:10.1002/ab.21454
Lemola, S., Brand, S., Vogler, N., Perkinson-Gloor, N., Allemand, M., & Grob, A. (2011).
Habitual computer game playing at night is related to depressive symptoms. Personality and
Individual Differences ,51 (2), 117-122. DOI: 10.1016/j.paid.2011.03.024
Lenhart, A., Kahne, J., Middaugh, E., Macgill, A. R., Evans, C., & Vitak, J. (2008). Teens,
video games, and civics: Teens’ gaming experiences are diverse and include significant social
interaction and civic engagement. Pew Internet

45
APPENDIX
Copy of the consent form and questionnaire used in this experiment:
Hi, my name is Jessica Maher. I’m a final year undergraduate Psychology student at Dublin Business School, currently doing my thesis and would like to enlist your help. I’m conducting an experiment in relation to the differences in attention levels between those who regularly play video games and those who do not. My study will consist of filling out the attached survey and completing a few cognitive tasks. Please only fill out this survey if you are 18 years old or over, and do not suffer from any of the following:
Epilepsy Poor/uncorrected vision Colour Vision Deficiency (Colour Blindness) Any negative side/effects from flashing lights/screens
All data gathered will be anonymous, so please do not include your name or student number on any part of this form. All data gathered from this study will be stored on a password protected hard drive and deleted a year after my final examinations in April/May 2014. As participation in this experiment is completely anonymous, it will not be possible to withdraw from participation once the experiment is completed.
This survey will take approximately 5 to 10 minutes to complete. The cognitive tasks will take approximately 30-45 minutes to complete. Please feel free to ask any questions you may have at any time during this experiment. By ticking the box below you are confirming that you are over the age of 18 and do not suffer for any of the health problems mentioned above.
I have read the above terms for participating in this experiment and confirm that I am over 18 years of age and do not suffer from any of the health issues mentioned above.

46
Thank you for taking the time to fill out this form, your help is greatly appreciated.
Please circle the answer that applies most to you.
Age: ________
Gender: Male Female
Do you like to play video games? Yes No
Over the past six months, roughly how many days per week have you played video games?
0-1 1-2 2-3 3-4 5+
Over the past six months, roughly how many hours per day have you played video games? 0-1 1-2 2-3 3-4 5+
Over the past six months, roughly how many hours per week have you played video games? 0-5 5-10 10-15 15+
Which is/are your favourite genre(s) of video games?
Action / Adventure / Horror / Role-Playing Game (RPG) / Sport / Driving / Simulation / Massively Multiplayer Online (MMO) / First Person Shooter (FPS) / Puzzle / Other / None
If Other, please specify _______________________________________________________

47
Please circle the answer that applies most to you.
What gaming platform(s) do you currently own?
Wii / Wii U / Xbox360 / Xbox One / PS3 / PS4 / PC / Nintendo DS(i)(Lite)(XL) /Nintendo 3DS / Sony PSP / Other / None
If Other, please specify _______________________________________________________
Which gaming platform(s) do you prefer?
Wii / Wii U / Xbox360 / Xbox One / PS3 / PS4 / PC / Nintendo DS(i)(Lite)(XL) /Nintendo 3DS / Sony PSP / Other / No Preference
If Other please specify________________________________________________________

48
SEE
VIDEO

49
How many times did the seagull drop the stick? ____________________________
Did you notice anything unusual? Please specify: ___________________________________________________________________________
___________________________________________________________________________

50
Please remove this sheet if you would like to avail of the services mentioned below, or would like to get in touch in regards to any other questions or the results of this experiment.
If you feel you may be affected by any of the questions or images shown throughout this experiment, there are some useful support services provided below:
The Aware Helpline: 1890 303 302 or email [email protected] Available Monday – Sunday 10am-10pm.
Samaritans Ireland: 1850 60 90 90 or email [email protected] Available 24 hours a day, 365 days a year.
DBS student services
Thanks for participating in this study. Please direct any questions in relation to this experiment to