Diet reconstrucion isotopes
10
Diet Reconstruction and Resource Partitioning of a Caribbean Marine Mesopredator Using Stable Isotope Bayesian Modelling Alexander Tilley 1,2 *, Juliana Lo ´ pez-Angarita 2,3 , John R. Turner 1 1 School of Ocean Sciences, Bangor University, Menai Bridge, Anglesey, United Kingdom, 2 Talking Oceans Foundation, Bogota ´ DC, Colombia, 3 Environment Department, University of York, York, United Kingdom Abstract The trophic ecology of epibenthic mesopredators is not well understood in terms of prey partitioning with sympatric elasmobranchs or their effects on prey communities, yet the importance of omnivores in community trophic dynamics is being increasingly realised. This study used stable isotope analysis of 15 N and 13 C to model diet composition of wild southern stingrays Dasyatis americana and compare trophic niche space to nurse sharks Ginglymostoma cirratum and Caribbean reef sharks Carcharhinus perezi on Glovers Reef Atoll, Belize. Bayesian stable isotope mixing models were used to investigate prey choice as well as viable Diet-Tissue Discrimination Factors for use with stingrays. Stingray d 15 N values showed the greatest variation and a positive relationship with size, with an isotopic niche width approximately twice that of sympatric species. Shark species exhibited comparatively restricted d 15 N values and greater d 13 C variation, with very little overlap of stingray niche space. Mixing models suggest bivalves and annelids are proportionally more important prey in the stingray diet than crustaceans and teleosts at Glovers Reef, in contrast to all but one published diet study using stomach contents from other locations. Incorporating gut contents information from the literature, we suggest diet-tissue discrimination factors values of D 15 N ~ 2.7% and D 13 C ~ 0.9% for stingrays in the absence of validation experiments. The wide trophic niche and lower trophic level exhibited by stingrays compared to sympatric sharks supports their putative role as important base stabilisers in benthic systems, with the potential to absorb trophic perturbations through numerous opportunistic prey interactions. Citation: Tilley A, Lo ´ pez-Angarita J, Turner JR (2013) Diet Reconstruction and Resource Partitioning of a Caribbean Marine Mesopredator Using Stable Isotope Bayesian Modelling. PLoS ONE 8(11): e79560. doi:10.1371/journal.pone.0079560 Editor: Simon Thrush, National Institute of Water & Atmospheric Research, New Zealand Received July 22, 2013; Accepted September 29, 2013; Published November 13, 2013 Copyright: ß 2013 Tilley et al. This is an open-access article distributed under the terms of the Creative Commons Attribution License, which permits unrestricted use, distribution, and reproduction in any medium, provided the original author and source are credited. Funding: This research was funded in part by the Ulysses S. Seal Conservation Award from the Minnesota Zoo and received logistical support from the Glovers Reef Research Station (Wildlife Conservation Society). The funders had no role in study design, data collection and analysis, decision to publish, or preparation of the manuscript. Competing Interests: The authors have declared that no competing interests exist. * E-mail: [email protected] Introduction Understanding the trophic niche and ecological role of elasmobranchs in community structure is of crucial management and conservation importance [1,2]. It is becoming increasingly evident that omnivores provide stability to food webs [3]. Natural systems representing a mix of strong and weak trophic interac- tions, are said to be resistant to trophic perturbations and cascade [4,5]. However, in marine systems subject to selective fishing pressure, the community-wide impacts of fishing are stronger than expected because fishing preferentially targets strongly interacting apex predator species whose removal can destabilize the food web [5]. The likelihood of trophic cascades occurring after the depletion of these strong interactors will thus depend on the relative fraction of strong omnivory [5]. In light of global shark population declines, the trophic ecology of marine mesopredators is becoming rapidly more pertinent, as predation (or a release from it) can significantly affect community structure [6,7]. Stingrays have received scant attention despite their position in marine systems as important omnivorous mesopredators, struc- turing sediments and communities [8,9]. Demersal stingrays feed on a range of epibenthic prey including crustaceans, molluscs and fish, and infauna such as polychaetes and sipunculids [10,11]. Traditionally diet composition has involved the invasive, often lethal process of gut contents analysis, yet a common criticism of this technique is its over-representation of hard-to-digest prey items, such as those with exoskeletons [12], and subsequent underestimation of soft-bodied prey in diet composition. The less invasive analysis of stable isotopes in tissues, is now a widely used method of assessing food web interactions [13–15]. Due to the close link between the isotopic ratios of consumers and their prey, Stable Isotope Analysis (SIA) provides a means of reconstructing diet composition and quantifying the ecological niche an animal occupies within its trophic system [16], allowing for more robust diet composition analysis over time, compared to the snapshot sampling of stomach contents. The composition of stable isotopes (commonly 13 C and 15 N) in tissues changes relatively predictably as elements cycle through ecosystems, as a result of the trophic interactions of species [14]. By calculating the area of 2D space occupied on bionomic axes of d 13 C and d 15 N [2,17], we can visualise the ecological role of a species within their community, as its niche will incorporate all trophic interactions with prey species. Stable isotope analysis can also highlight temporal diet variability [13] and ontogenic diet PLOS ONE | www.plosone.org 1 November 2013 | Volume 8 | Issue 11 | e79560
description
Diet reconstruction isotopes
Transcript of Diet reconstrucion isotopes

Diet Reconstruction and Resource Partitioning of aCaribbean Marine Mesopredator Using Stable IsotopeBayesian ModellingAlexander Tilley1,2*, Juliana Lopez-Angarita2,3, John R. Turner1
1 School of Ocean Sciences, Bangor University, Menai Bridge, Anglesey, United Kingdom, 2 Talking Oceans Foundation, Bogota DC, Colombia, 3 Environment Department,
University of York, York, United Kingdom
Abstract
The trophic ecology of epibenthic mesopredators is not well understood in terms of prey partitioning with sympatricelasmobranchs or their effects on prey communities, yet the importance of omnivores in community trophic dynamics isbeing increasingly realised. This study used stable isotope analysis of 15N and 13C to model diet composition of wildsouthern stingrays Dasyatis americana and compare trophic niche space to nurse sharks Ginglymostoma cirratum andCaribbean reef sharks Carcharhinus perezi on Glovers Reef Atoll, Belize. Bayesian stable isotope mixing models were used toinvestigate prey choice as well as viable Diet-Tissue Discrimination Factors for use with stingrays. Stingray d15N valuesshowed the greatest variation and a positive relationship with size, with an isotopic niche width approximately twice that ofsympatric species. Shark species exhibited comparatively restricted d15N values and greater d13C variation, with very littleoverlap of stingray niche space. Mixing models suggest bivalves and annelids are proportionally more important prey in thestingray diet than crustaceans and teleosts at Glovers Reef, in contrast to all but one published diet study using stomachcontents from other locations. Incorporating gut contents information from the literature, we suggest diet-tissuediscrimination factors values of D15N ~ 2.7% and D13C ~ 0.9% for stingrays in the absence of validation experiments. Thewide trophic niche and lower trophic level exhibited by stingrays compared to sympatric sharks supports their putative roleas important base stabilisers in benthic systems, with the potential to absorb trophic perturbations through numerousopportunistic prey interactions.
Citation: Tilley A, Lopez-Angarita J, Turner JR (2013) Diet Reconstruction and Resource Partitioning of a Caribbean Marine Mesopredator Using Stable IsotopeBayesian Modelling. PLoS ONE 8(11): e79560. doi:10.1371/journal.pone.0079560
Editor: Simon Thrush, National Institute of Water & Atmospheric Research, New Zealand
Received July 22, 2013; Accepted September 29, 2013; Published November 13, 2013
Copyright: � 2013 Tilley et al. This is an open-access article distributed under the terms of the Creative Commons Attribution License, which permitsunrestricted use, distribution, and reproduction in any medium, provided the original author and source are credited.
Funding: This research was funded in part by the Ulysses S. Seal Conservation Award from the Minnesota Zoo and received logistical support from the GloversReef Research Station (Wildlife Conservation Society). The funders had no role in study design, data collection and analysis, decision to publish, or preparation ofthe manuscript.
Competing Interests: The authors have declared that no competing interests exist.
* E-mail: [email protected]
Introduction
Understanding the trophic niche and ecological role of
elasmobranchs in community structure is of crucial management
and conservation importance [1,2]. It is becoming increasingly
evident that omnivores provide stability to food webs [3]. Natural
systems representing a mix of strong and weak trophic interac-
tions, are said to be resistant to trophic perturbations and cascade
[4,5]. However, in marine systems subject to selective fishing
pressure, the community-wide impacts of fishing are stronger than
expected because fishing preferentially targets strongly interacting
apex predator species whose removal can destabilize the food web
[5]. The likelihood of trophic cascades occurring after the
depletion of these strong interactors will thus depend on the
relative fraction of strong omnivory [5]. In light of global shark
population declines, the trophic ecology of marine mesopredators
is becoming rapidly more pertinent, as predation (or a release from
it) can significantly affect community structure [6,7].
Stingrays have received scant attention despite their position in
marine systems as important omnivorous mesopredators, struc-
turing sediments and communities [8,9]. Demersal stingrays feed
on a range of epibenthic prey including crustaceans, molluscs and
fish, and infauna such as polychaetes and sipunculids [10,11].
Traditionally diet composition has involved the invasive, often
lethal process of gut contents analysis, yet a common criticism of
this technique is its over-representation of hard-to-digest prey
items, such as those with exoskeletons [12], and subsequent
underestimation of soft-bodied prey in diet composition. The less
invasive analysis of stable isotopes in tissues, is now a widely used
method of assessing food web interactions [13–15]. Due to the
close link between the isotopic ratios of consumers and their prey,
Stable Isotope Analysis (SIA) provides a means of reconstructing
diet composition and quantifying the ecological niche an animal
occupies within its trophic system [16], allowing for more robust
diet composition analysis over time, compared to the snapshot
sampling of stomach contents.
The composition of stable isotopes (commonly 13C and 15N) in
tissues changes relatively predictably as elements cycle through
ecosystems, as a result of the trophic interactions of species [14].
By calculating the area of 2D space occupied on bionomic axes of
d13C and d15N [2,17], we can visualise the ecological role of a
species within their community, as its niche will incorporate all
trophic interactions with prey species. Stable isotope analysis can
also highlight temporal diet variability [13] and ontogenic diet
PLOS ONE | www.plosone.org 1 November 2013 | Volume 8 | Issue 11 | e79560

shifts [18]. Delta (d) represents the ratio of 13C or 15N relative to
their lighter isotopes 12C and 14N in tissues. Carbon is conserved
through trophic systems, and d13C values are used to determine
the source of carbon from primary producers [19], such as
differentiating between oceanic (phytoplankton) and coastal (algae,
seagrass and detritus) systems [15]. 15N is enriched through the
trophic system, with consumers typically having ,3.2% higher
percentage mass of 15N than the mean value of their prey species
[14,19].
Recent studies of elasmobranch diet illustrate that tissue type
greatly affects uptake and elimination rates of stable isotopes [20]
and that Diet Tissue Discrimination Factors (DTDFs) cannot be
assumed equal across tissues [21]. Muscle tissue shows extremely
slow uptake, with over 1 year to equilibrium with diet [20] whereas
metabolically active tissues such as liver are significantly quicker at
both uptake and elimination of nitrogen [20]. This has a critical
relevance for studies of wild populations where isotopic values in
muscle tissue may not be representative of current prey species,
but rather those of a spatially or temporally distinct zone (in highly
migratory species). It is suggested that multi-tissue sampling
produces more robust analysis of trophic position for individual
species, however results may be confounded if values from
different tissues (e.g. muscle and fin) are directly compared, due
to different DTDFs [21].
The majority of stable isotope studies to date have used DTDFs
from Post [15] (see [22] for review). However, significant variation
in DTDF has been found between tissue types and species, even
those of the same genus [19], so the need for species-specific
validation experiments has been strongly stated [22]. To date
there are only two known experimental studies of DTDFs in
elasmobranchs [23,24]. Given the long duration and logistical
difficulties in conducting DTDF validation experiments on large
elasmobranchs, there is an opportunity for important DTDF
information to be reconstructed from stomach content data. If
consumers are not in equilibrium with their diet, isotope analysis
will be compromised [22,25], however, species characterised by
restricted movements within the same base isotope system (i.e.
coastal or oceanic), for which prior stomach contents data exists,
can be utilised to generate DTDF estimates based on SIA [22].
Southern stingrays, Dasyatis americana, are distributed throughout
the Western Atlantic stretching from New Jersey to Brazil [26–30].
They are commonly found in shallow reef and lagoon habitats of
coastal areas and offshore atolls, where they can reach extremely
high densities [31]. D. americana shows very restricted movements
and high site fidelity in areas characterised by sand flats, patch
reefs and seagrass beds [32]. The diet of D. americana is relatively
well characterised from six known stomach content studies
[6,10,11,26,33,34].
The simplification of marine ecosystems due to selective
overfishing [35] and subsequent increases in occurrence of trophic
cascades [1,36], highlight the need of building a more robust
baseline knowledge on trophic ecology of tropical marine
mesopredators. Generalist mesopredators such as stingrays are of
particular relevance, given their potential role in stabilizing food
webs [4]; and as targeted commercial fisheries increase, the need
for greater understanding of this abundant and widespread species
becomes more urgent. In this study we use SIA to gain initial
insight into the trophic ecology of D. americana using Bayesian
mixing models to reconstruct diet, and Bayesian ellipse analysis to
evaluate ecological niche in comparison to sympatric reef-dwelling
elasmobranchs, the nurse shark Ginglymostoma cirratum and Carib-
bean reef shark, Carcharhinus perezi. Finally, we evaluate proposed
DTDF values from the literature for use with stingrays, and
propose suitable values for further work in the absence of
experimental validation studies.
Materials and Methods
All of the research (including the handling of marine life, the
interruption of stingray and shark behaviour, and biopsy tissue
sampling) was undertaken with research permits granted by the
Belize Fisheries Department. The handling and biopsy tissue
sampling of marine life complied with the Bangor University
Research Ethics framework and ethical policy, and was approved
by the College of Natural Sciences Animal Ethics Committee.
Study site and animal samplingGlovers Reef Atoll (GRA) (W -87.8 N 16.8) is the southernmost
of four coral atolls in the Mesoamerican Barrier Reef System,
situated approximately 40 km east of the Belizean coast, and
20 km east of the main barrier reef. The atoll covers approxi-
mately 254 km2, most of which is shallow lagoon, surrounded by a
reef crest (Fig. 1).
Southern stingrays are present in the lagoon in very high
densities (,245 rays per km2) throughout the year [31]. Rays were
caught primarily in shallow lagoon sand flat and seagrass habitat
in the south east of the atoll (Fig. 1) between June 2009 and August
2010. All rays were captured individually using a gill net or long-
lines in the lagoon and one by hook and line on the forereef. Rays
were brought onboard and basic data was collected on sex and size
(curved disk width) and capture location. Rays were biopsied using
a 5 mm diameter medical muscle punch, taking a plug (,1 g) of
white muscle tissue and skin from the dorsal musculature.
Nurse sharks G. cirratum and Caribbean reef sharks C. perezi were
captured using standard long lines as part of a wider research
project at GRA in June 2009 and May 2010. Muscle and skin
plugs (,1 g) were taken from C. perezi dorsal musculature below
the dorsal fin. Skin toughness of G. cirratum prevented muscle
biopsy so only fin clips were taken from live nurse sharks for
comparison with skin samples from sympatric species, to limit
animal stress and handling time. One juvenile G. cirratum found
recently dead by plastic pollution in September 2009, was
opportunistically sampled for white muscle tissue during dissec-
tion, so was used as a coarse verification of fin clip tissue values.
Muscle tissue was separated from skin and sinew in all biopsy
samples and all samples were stored frozen prior to drying in foil
cups in a solar oven. Biopsy sampling of all sharks and rays was
non-lethal and no animals were sacrificed in this study. Putative
prey species (teleosts & invertebrates) identified in diet studies in
the literature were collected during core sediment sampling using a
vacuum pump and opportunistically during fieldwork between
June 2008 and Aug 2010. Fish, conch and lobster samples were
obtained from fishermen’s catches with their permission.
Trophic levelTypical diet composition of D. americana was obtained using four
literature studies where stomach contents had been identified at
least to phyla and ranked [6,10,11,33].
Mean trophic levels of four prey phyla (Mollusca, Crustacea,
Chordata & Annelida) were used to calculate the trophic level of
D. americana (TLk) following Cortes [37]:
TLk~1zX6
j~1
Pj|TLj
!
Trophic Ecology of the Southern Stingray
PLOS ONE | www.plosone.org 2 November 2013 | Volume 8 | Issue 11 | e79560

Where Pj is the proportion of each prey category (j) in diet
analyses, and TLj is their trophic level. Following analysis using
stable isotope mixing models, trophic level was reassessed
considering modelled diet results.
Stable isotope ratio mass spectrometryAnimal tissue samples (,1 mg) were analysed using automated
continuous-flow isotope ratio mass spectrometry [12,38] by the
Boston University Stable Isotope Laboratory. The samples were
combusted in an elemental analyser (EuroVector) and analysed
using a GVI IsoPrime isotope ratio mass spectrometer (GV
Instruments). Ratios of 13C/12C and 15N/14N were expressed as
the relative per mil (%) difference between the samples and
international standards (Vienna PDB carbonate and N2 in air,
respectively) where:
d13C~
13C12C
� �sample
13C12C
� �standard
{1
0BBB@
1CCCA|1000 %ð Þ
and
d15N~
15N14N
� �sample
15N14N
� �standard
{1
0BBB@
1CCCA|1000 %ð Þ
In addition to carbon and nitrogen isotopes from the same sample,
continuous flow also reported % C and % N data. Urea was not
removed from the muscle tissue samples for processing. Isotope
ratio mass spectrometry precision was ,0.1% for carbon and
,0.2% for nitrogen. Lipid extraction was not carried out on
sampled tissues due to mean C : N ratios being much lower than
3.5 [39].
Multiple tissue analysis and ontogenic diet shiftsd13C and d15N values from D. americana, sharks, teleost fish and
invertebrates from GRA were tested for normality, and data was
analysed for differences between tissue types, species and
correlation with individual size using JMP 10 (SAS Institute).
Where significant differences existed between tissue types, they
were treated independently in all analyses thereafter.
Isotopic niche and prey partitioningd13C and d15N values from tissues of D. americana, G. cirratum and
C. perezi were plotted in 2D isotopic space and partitioning was
visualised using kernel density estimation in JMP10 (Fig. 2).
The R package ‘Stable Isotope Bayesian Ellipses in R’ (SIBER)
[17] was used to generate Bayesian ellipses of isotopic space for the
three elasmobranch species. Standard Ellipse Areas (SEA) were
corrected (SEAc) for low sample size using SEAc = SEA(n-1)(n-
2)21 [17]. Values were also analysed with Layman’s metrics [40]
using convex hulls of niche space, for area comparisons with
Bayesian ellipses.
Mixing models and diet-tissue discrimination factorsd13C and d15N values from D. americana and benthic prey species
from GRA were plotted in 2D isotopic space (Fig. 3). DTDFs from
experimental and modelling studies in the literature (Table 1) were
then applied to prey source values and plotted in bivariate space to
analyse overlap with values from D. americana muscle tissue. The
DTDF used from Caut et al. [19] was calculated using their
equation for source values for fish. Additionally a DTDF was
calculated for rays from d15N values using the linear regression
y = 5.02+0.77x compiled from various studies in Robbins et al.
Figure 1. Study site location. (A) Glovers Reef Atoll within Belize, (B) Map of Glovers Reef Atoll, (C) Enlarged satellite image of the main samplingarea on Glovers Reef Atoll.doi:10.1371/journal.pone.0079560.g001
Trophic Ecology of the Southern Stingray
PLOS ONE | www.plosone.org 3 November 2013 | Volume 8 | Issue 11 | e79560

[41]. Due to small sample sizes for individual prey species, mean
D15N and D13C values were calculated for each prey species and
then combined into a mean value for use in mixing models.
d13C and d15N values of prey species identified from stomach
contents studies in the literature [6,10,11,26,33,34] were plotted to
assess prey groupings in 2D isotopic space as prior information to
enhance the accuracy of Bayesian mixing models. C : N ratios
were used to evaluate differences between trophic groups for use in
mixing models. Teleost fish and crab samples showed no
significant difference (Wilcoxon, Z = 20.9684, p = 0.2453) so were
combined as a prey category (Fish_crab) for mixing models.
Similarly, shrimp and lobster values showed no significant
difference so were grouped as decapods in models (Wilcoxon
Z = 0.74353, p = 0.4407). The remaining 3 prey categories of
bivalve, annelid and conch were significantly different, and were
treated as independent groups.
The diet compositions of D. americana and G. cirratum were
modelled using Stable Isotope Analysis in R (SIAR), a Bayesian
stable isotope mixing model that generates probability distribu-
tions for proportions of prey items based on their relationship with
consumer tissue values [42]. SIAR models were generated using
d13C and d15N values for consumers (stingray and sharks) and
putative prey items sampled from GRA, and run using DTDFs (6
SD) as described above (Table 1).
Results
Muscle and skin samples were gathered from 14 D. americana
individuals of size range 29–77 cm disk width between June 2008
and August 2010. Eight G. cirratum (49–300 cm) and 9 C. perezi
(90–200 cm) were caught in lagoon and forereef habitats and
sampled for fin clips and muscle biopsies respectively.
Trophic levelCrustaceans, predominantly crabs were proportionately the
most significant prey group from gut contents studies in the
literature (Table 2). Trophic level (TL) calculation for D. americana
was considerably dependent on the TL attributed to teleost fish
prey. Use of a TL value reflective of herbivorous teleost prey
returned a value of 3.39, whereas inclusion of a value reflecting
more carnivorous fish (,3.4) returned a value of 3.65. Without
more detailed information on species specific diet, a mean value of
2.8 from Fishbase was used for teleost fish [22,43]. TL was
calculated to be 3.52 (60.31) for D. americana, corroborating the
figure reported for this species in Fishbase [43]. Variation in the
proportion of annelid and hemichordate prey (TL ,2.5) in diet, as
between findings of Gilliam & Sullivan [11] and Randall [10], had
no influence on trophic level, likely due to the proportion of
crustaceans at similar trophic level placement (TL ,2.52).
Multiple tissue analysis and ontogenetic shiftd13C values showed greater intra-species variation in elasmo-
branch species sampled than d15N values. Mean d15N values from
D. americana were not significantly different between skin
(6.6%60.9) and white muscle tissue (7.4%61.1) (t-test
t(24) = P,0.06), however, mean d13C values for skin
(27.1%61.9) were significantly higher than those for white
muscle (28.5%61.0) (t(24) = 2.49, P = 0.02).
Figure 2. Density contour plot of d13C vs. d15N values for C. perezi fin (blue) and muscle tissues (red), G. cirratum fin (brown) and muscle(grey) and D. americana skin (purple) and muscle (green) sampled from wild populations at Glovers Reef Atoll, Belize. Different colourtones represent quartile volume contours constructed using kernel density estimation.doi:10.1371/journal.pone.0079560.g002
Trophic Ecology of the Southern Stingray
PLOS ONE | www.plosone.org 4 November 2013 | Volume 8 | Issue 11 | e79560

d15N values in D. americana skin tissue showed a significant
positive tendency with individual size, (Spearman’s r(8) = 0.62
P = 0.01) (Fig. 4A) however the relationship with muscle tissue was
non-significant (Spearman’s r(11) = 0.36, P = 0.28) (Fig. 4B).
The mean (6 SD) C : N ratio for D. americana muscle tissue was
1.12%60.27; G. cirratum fin tissue was 0.81%60.079; and C. perezi
muscle tissue was 1.08%60.098.
d15N and d13C values were unaffected by calendar month
sampled (ANOVA F = 1.72, df = 7, P = 0.26 and ANOVA
F = 2.22, df = 7, P = 0.16 respectively) however, not all calendar
months were sampled.
The mean d15N (6 SD) value of skin tissue was 6.6%60.9 for
D. americana and 9.03%60.46 for G. cirratum illustrating a
significant difference (Wilcoxon Z = 4.66 P,0.001). Mean d13C
values showed no significant difference (D. americana
28.32%62.62; G. cirratum 28.53%61.12; Wilcoxon Z = 1.57
P = 0.22).
Isotopic niche and prey partitioningFor muscle tissue only, isotopic niche space of D. americana was
larger than sympatric species using both analytical measures of
Figure 3. Bivariate plot of d13C vs. d15N values from tissue samples collected from D. americana, potential prey species, andsympatric shark species at Glovers Reef between 2008–2010. Values for D. americana, G. cirratum and C. perezi are displayed as combinedmean (6 SD) skin and muscle tissues (d13C 28.0961.7, d15N 7.3661.5; d13C 28.3262.62, d15N 9.0360.46; d13C 29.3760.98, d15N 8.760.32respectively).doi:10.1371/journal.pone.0079560.g003
Table 1. Diet-Tissue Discrimination Factors from theliterature.
Label D15N (%) SD D13C (%) SD Source
a) 3.39 63.03 20.22 62.33 (Calculated from[19])*
b) 3.7 0.4 1.7 60.5 [23]
c) 2.29 0.22 0.9 60.33 [24]
d) 3.4 0.98 0.39 61.3 [15]
e) 3.49 0.13 0.05 60.36 [62]
f) 2.75 0.22 0.9 60.33 [52]
g) 2.57 - (0.39) - [41]
This DTDF were used to adjust prey species values of d13C and d15N in d15N vs.d13C plots, and in stable isotope mixing models of stingray diet composition.SD = Standard Deviation.*A D13C value (or SD values) was not published in Robbins et al. [41], so themedian value from all studies (0.39) was used in these plots.doi:10.1371/journal.pone.0079560.t001
Trophic Ecology of the Southern Stingray
PLOS ONE | www.plosone.org 5 November 2013 | Volume 8 | Issue 11 | e79560
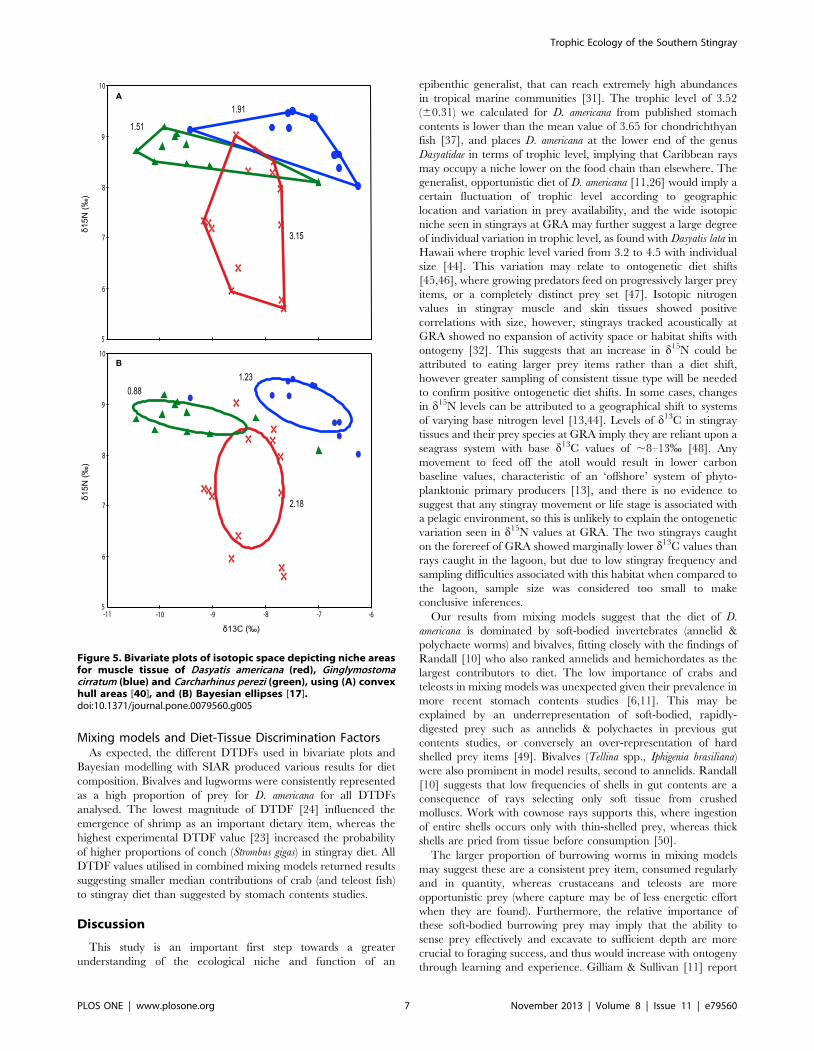
area calculation. Convex hulls presented a niche space for
southern stingrays of 3.15, with 1.91 and 1.51 for nurse sharks
and reef sharks respectively (Fig. 5A). Corrected Bayesian ellipse
areas calculated D. americana niche space as 2.18 and G. cirratum
and C. perezi as 0.88 and 1.23 respectively (Fig. 5B). D. americana
exhibited a much wider range of d15N values (3.42%) than G.
cirratum (1.48%) and C. perezi (1.09%). The opposite was true for
the range of d13C values, with G. cirratum (3.18%) and C. perezi
(3.45%) exhibiting higher values than D. americana (1.51%).
Table 2. Major prey identified from stomach analysis studies of D. americana, according to lowest taxonomic group (as stated insource).
Source Location N Prey group
[11] Exuma Cays Land and Sea Park, The Bahamas 18 46% Decapods & Portunids
18% Teleosts
7% Stomatopods
[33] Indian River Lagoon, Florida 3 Portunids
Caridea
Teleosts
[10] Puerto Rico & Virgin Islands 25 38% Sipunculids/Polychaetes
22% Teleosts
18% Crabs
11% Bivalves
8% Shrimps
[34] Florida Bay, Florida 5 Decapods
Stomatopods
Portunids
Caridea
[6] Cape Hatteras, North Carolina 2 99% Decapods
,1% Teleosts
,1% Polychaetes
[26] Bimini, The Bahamas 15 Stomatopods
Shrimps
Crabs
Worms
Fish
Prey groups are listed in order of decreasing proportional volume where data available. Unnumbered prey indicates prey proportions were not ranked. Column Nrepresents the number of rays sampled in each study.doi:10.1371/journal.pone.0079560.t002
Figure 4. Relationship between d15N values and individual size (disk width) for D. americana skin (A) and muscle (B). Red shaded areasrepresent 95% bivariate normal confidence ellipses for correlative relationships (A) Spearman’s r(8) = 0.75 P,0.034 (B) Spearman’s r(11) = 0.47,P = 0.15.doi:10.1371/journal.pone.0079560.g004
Trophic Ecology of the Southern Stingray
PLOS ONE | www.plosone.org 6 November 2013 | Volume 8 | Issue 11 | e79560
Mixing models and Diet-Tissue Discrimination FactorsAs expected, the different DTDFs used in bivariate plots and
Bayesian modelling with SIAR produced various results for diet
composition. Bivalves and lugworms were consistently represented
as a high proportion of prey for D. americana for all DTDFs
analysed. The lowest magnitude of DTDF [24] influenced the
emergence of shrimp as an important dietary item, whereas the
highest experimental DTDF value [23] increased the probability
of higher proportions of conch (Strombus gigas) in stingray diet. All
DTDF values utilised in combined mixing models returned results
suggesting smaller median contributions of crab (and teleost fish)
to stingray diet than suggested by stomach contents studies.
Discussion
This study is an important first step towards a greater
understanding of the ecological niche and function of an
epibenthic generalist, that can reach extremely high abundances
in tropical marine communities [31]. The trophic level of 3.52
(60.31) we calculated for D. americana from published stomach
contents is lower than the mean value of 3.65 for chondrichthyan
fish [37], and places D. americana at the lower end of the genus
Dasyatidae in terms of trophic level, implying that Caribbean rays
may occupy a niche lower on the food chain than elsewhere. The
generalist, opportunistic diet of D. americana [11,26] would imply a
certain fluctuation of trophic level according to geographic
location and variation in prey availability, and the wide isotopic
niche seen in stingrays at GRA may further suggest a large degree
of individual variation in trophic level, as found with Dasyatis lata in
Hawaii where trophic level varied from 3.2 to 4.5 with individual
size [44]. This variation may relate to ontogenetic diet shifts
[45,46], where growing predators feed on progressively larger prey
items, or a completely distinct prey set [47]. Isotopic nitrogen
values in stingray muscle and skin tissues showed positive
correlations with size, however, stingrays tracked acoustically at
GRA showed no expansion of activity space or habitat shifts with
ontogeny [32]. This suggests that an increase in d15N could be
attributed to eating larger prey items rather than a diet shift,
however greater sampling of consistent tissue type will be needed
to confirm positive ontogenetic diet shifts. In some cases, changes
in d15N levels can be attributed to a geographical shift to systems
of varying base nitrogen level [13,44]. Levels of d13C in stingray
tissues and their prey species at GRA imply they are reliant upon a
seagrass system with base d13C values of ,8–13% [48]. Any
movement to feed off the atoll would result in lower carbon
baseline values, characteristic of an ‘offshore’ system of phyto-
planktonic primary producers [13], and there is no evidence to
suggest that any stingray movement or life stage is associated with
a pelagic environment, so this is unlikely to explain the ontogenetic
variation seen in d15N values at GRA. The two stingrays caught
on the forereef of GRA showed marginally lower d13C values than
rays caught in the lagoon, but due to low stingray frequency and
sampling difficulties associated with this habitat when compared to
the lagoon, sample size was considered too small to make
conclusive inferences.
Our results from mixing models suggest that the diet of D.
americana is dominated by soft-bodied invertebrates (annelid &
polychaete worms) and bivalves, fitting closely with the findings of
Randall [10] who also ranked annelids and hemichordates as the
largest contributors to diet. The low importance of crabs and
teleosts in mixing models was unexpected given their prevalence in
more recent stomach contents studies [6,11]. This may be
explained by an underrepresentation of soft-bodied, rapidly-
digested prey such as annelids & polychaetes in previous gut
contents studies, or conversely an over-representation of hard
shelled prey items [49]. Bivalves (Tellina spp., Iphigenia brasiliana)
were also prominent in model results, second to annelids. Randall
[10] suggests that low frequencies of shells in gut contents are a
consequence of rays selecting only soft tissue from crushed
molluscs. Work with cownose rays supports this, where ingestion
of entire shells occurs only with thin-shelled prey, whereas thick
shells are pried from tissue before consumption [50].
The larger proportion of burrowing worms in mixing models
may suggest these are a consistent prey item, consumed regularly
and in quantity, whereas crustaceans and teleosts are more
opportunistic prey (where capture may be of less energetic effort
when they are found). Furthermore, the relative importance of
these soft-bodied burrowing prey may imply that the ability to
sense prey effectively and excavate to sufficient depth are more
crucial to foraging success, and thus would increase with ontogeny
through learning and experience. Gilliam & Sullivan [11] report
5
6
2.18
B
Figure 5. Bivariate plots of isotopic space depicting niche areasfor muscle tissue of Dasyatis americana (red), Ginglymostomacirratum (blue) and Carcharhinus perezi (green), using (A) convexhull areas [40], and (B) Bayesian ellipses [17].doi:10.1371/journal.pone.0079560.g005
Trophic Ecology of the Southern Stingray
PLOS ONE | www.plosone.org 7 November 2013 | Volume 8 | Issue 11 | e79560

D. americana consuming at least 65 prey types, and as many as 30
items per individual throughout the day [11], further supporting a
fairly continuous and opportunistic feeding strategy. Three out of
the four diet studies using ranked stomach contents for D. americana
showed diet to be predominated by crustaceans and teleosts,
however evidence of D. americana feeding exclusively on lancelets
(Branchiostoma floridae) in Florida [51] suggests that local environ-
mental variability in prey abundance is a strong driver in dietary
choice for such a generalist mesopredator.
The only known study of stingray trophic position utilised an
assumed DTDF of 2.7% [44], equating to that proposed by
Vanderklift & Ponsard [52]. In mixing models, all values of DTDF
(2.29–3.7%) supported the primary importance of bivalves and
annelids in stingray diet at GRA. Recent studies suggest that the
magnitude of DTDF relates to the nitrogen properties of the
predator diet, where prey items containing a high percentage of
quality protein, will result in smaller DTDFs [19,41,53]. The
predominantly invertebrate diet of D. americana represents a source
of relatively low quality protein compared to large sharks on a
proteinaceous diet. Experimental feeding studies on sharks have
shown highly variable DTDFs for nitrogen ranging from 2.2%[24] to 3.7% [23], a wide range that could significantly bias or
confound ecological interpretations. Our bivariate plots and
mixing models suggest that a DTDF for nitrogen in D. americana
muscle tissue would not exceed 3%, and that the DTDF for
carbon in muscle tissue is relatively high at ,1%. Additional
information on stingray diet studies from the literature support our
findings and make the D15N ~ 2.7% and D13C ~ 0.9% DTDF
values suggested by Vanderklift & Ponsard [52] the most
appropriate; fitting closely to regression lines in Robbins et al.
(2010); and also corroborating results for brown stingrays, D. lata,
using this same value [44]. Lipid extraction is often performed to
standardise SIA across species and tissue types [54]. However,
mean C : N ratios of stingray and shark tissues were well below
values recommended for correction or extraction (,3.5) [15,55]
and showed very little variance, so this is unlikely to have affected
our results.
A diverse prey base is supported by isotopic niche analysis using
both Layman’s metrics and Bayesian ellipses, where southern
stingrays exhibited a much greater trophic niche than G. cirratum
and C. perezi, indicating large individual variation characterised by
a generalist diet with a considerable number of prey interactions
on different trophic levels. Conversely, C. perezi exhibited a very
restricted niche implying more specific proteinaceous diet prefer-
ences as we might expect, likely to be characterised by a few strong
interactions [5]. G. cirratum values indicated it feeds at the same
trophic level as C. perezi, but the little overlap of d13C value ranges
represented may suggest effective prey resource partitioning
between these sympatric reef dwelling shark species, however
further sampling focused on these species is needed. Diet studies
on G. cirratum suggest they prey on squids, shrimps, crabs, spiny
lobsters, sea urchins and predominantly herbivorous fishes
[10,26,56], accounting for the larger trophic niche than C. perezi.
The location of both shark isotopic niches at higher values of d15N
is indicative of feeding at a consistently higher trophic level than D.
americana. Isotopic space from Bayesian ellipses, in correcting for
small sample size, provide further evidence to suggest that very
little prey partitioning occurs with sympatric shark species, but
rather nurse sharks and stingrays appear to feed at different
trophic levels (Fig. 5). Greater sampling would allow for stronger
inferences to be made, however this finding provides further
insight into the potential importance of stingrays as omnivores,
and highlights the need for further work on their role in stabilising
lower levels of the foodweb to trophic cascade, following removal
of apex predators.
The diversity of prey items consumed by stingrays as
opportunistic generalists may complicate and confound the use
of SIA in studying diet [22], where location and sampling season
may cause significant variations as seen in the common stingray
Dasyatis pastinaca in the Black sea [49]. This would suggest that diet
variations recorded in D. americana are responses to different
sampling period, however the Glovers Reef lagoon is a relatively
stable environment with low flushing rates, limited wave action
and stable sediments, and no variation with sampling month was
observed at GRA within the sampled months. Given the high site
fidelity of stingrays and restricted movement within the same base
isotope system [32], stark seasonal variations to diet are unlikely,
however, more complete seasonal sampling will be necessary to
more confidently assess this.
Natural variation between sampling regions is likely to account
for some dietary differences, where rays have been shown to
respond to: environmental and temporal variations in prey
communities and abundances [51,57]; differing substrate com-
plexity and prey availability [58]; or the response to ecological
forces of predation and competition controlling the foraging
intensity of rays in different habitats. Without combined sampling
of both stomach contents and SIA, the reasons for these differences
are speculative, however, SIA provides a metric for trophic niche
of sympatric species, and important insight into the ecological role
of mesopredators in marine benthic communities.
The different isotopic characteristics seen in skin and muscle
tissues from stingrays highlight the need for sampling consistency,
yet may also represent important ecological information as skin
exhibit significantly higher levels of d13C, and would be expected
to have a faster isotopic turnover rate than muscle [21]. Further
analysis using different tissue types from rays may allow for
comparison of long and short-term dietary preferences or temporal
shifts. In addition, given the limited sampling of stingrays larger
than the documented female maturity size of ,70 cm [59], further
sampling of large rays will be needed to confirm ontogenetic diet
trends. If positive relationships seen between individual size and15N continue to increase with ontogeny, this may suggest possible
resource competition between large rays and sympatric nurse
sharks illustrated by overlapping niches in stingray upper trophic
range.
The small sample size of our study limits the resolution of our
inference of prey choice and trophic dynamics between sympatric
elasmobranchs, however given the growing body of evidence
pointing to the importance of omnivores in stabilising marine
communities to trophic cascade [4,60] especially as a consequence
of selective fishing pressure [5], our study highlights the need for
more information on the trophic ecology of generalist mesopre-
dators. Furthermore, the increased targeting of large-bodied
mesopredators in developing nation fisheries [28,30,61] adds
additional urgency in discovering the knock on effects of their
removal from marine communities. This study provides important
preliminary information on stingray diet and trophic niche, on
which to base further work and conservation action.
Acknowledgments
This work is dedicated to the memory of Nick Paige (1988–2012), a
passionate biologist and friend who volunteered on this project. Our
grateful thanks to Demian Chapman and Stony Brook University for field
assistance and tissue samples; Nigel Hussey, for manuscript comments; and
to Bryan Edwards, Ray Tilley and all volunteers who assisted with
fieldwork. Research permits were granted by the Belize Fisheries
Trophic Ecology of the Southern Stingray
PLOS ONE | www.plosone.org 8 November 2013 | Volume 8 | Issue 11 | e79560

Department. This is contribution #52 from the Glovers Reef Research
Station.Author Contributions
Conceived and designed the experiments: AT JLA JRT. Analyzed the
data: AT JLA. Wrote the paper: AT JLA.
References
1. Baum JK, Worm B (2009) Cascading top-down effects of changing oceanic
predator abundances. J Anim Ecol 78: 699–714. doi:10.1111/j.1365-2656.2009.01531.x.
2. Newsome SD, Martinez del Rio C, Bearhop S, Phillips D (2007) A niche for
isotopic ecology. Front Ecol Environ 5: 429–436. doi:10.1890/060150.1.
3. Fagan W (1997) Omnivory as a stabilizing feature of natural communities. Am
Nat 150: 554–567.
4. O’Gorman E, Tompkins E (2009) Perturbations to trophic interactions and the
stability of complex food webs. PNAS 106: 13393–13398.
5. Bascompte J, Melian C, Sala E (2005) Interaction strength combinations and theoverfishing of a marine food web. PNAS 102: 5443–5447.
6. Bowman R, Stillwell C, Michaels W, Grosslein M (2000) Food of northwestAtlantic fishes and two common species of squid. NOAA Technical
Memorandum NMFS-NE-155.
7. Vaudo J, Heithaus M (2011) Dietary niche overlap in a nearshore elasmobranch
mesopredator community. MEPS 425: 247–260. doi:10.3354/meps08988.
8. Thrush SF (1999) Complex role of predators in structuring soft-sedimentmacrobenthic communities: Implications of changes in spatial scale for
experimental studies. Aust J Ecol 24: 344–354.
9. O’Shea OR, Thums M, van Keulen M, Meekan MG (2011) Bioturbation by
stingrays at Ningaloo Reef, Western Australia. Mar Freshwater Res 63: 189–197.
10. Randall J (1967) Food Habits of Reef Fishes of the West Indies. Stud TropOceanogr 5: 665–847.
11. Gilliam D, Sullivan KM (1993) Diet and Feeding Habits of the Southern
Stingray Dasyatis americana in the Central Bahamas. Bull Mar Sci 52: 1007–1013.
12. Wetherbee BM, Cortes E (2004) Food consumption and feeding habits. In:
Musick JA, Heithaus M, Carrier JC, editors. Sharks and their relatives I. BocaRaton, Florida: CRC Press, Vol. 1. pp. 225–246.
13. Michener R, Kaufman L (2007) Stable isotope ratios as tracers in marine foodwebs: An update. In: Michener R, Lajtha K, editors. Stable Isotopes in Ecology
and Environmental Science. Blackwell Publishing. pp. 238–270.
14. Peterson B, Fry B (1987) Stable isotopes in ecosystem studies. Annu Rev Ecol
Syst 18: 293–320.
15. Post DM (2002) Using stable isotopes to estimate trophic position: models,methods, and assumptions. Ecology 83: 703–718.
16. Bearhop S, Adams C, Waldron S, Fuller R, Macleod H (2004) Determiningtrophic niche width: a novel approach using stable isotope analysis. J Anim Ecol
73: 1007–1012.
17. Jackson A, Inger R, Parnell A, Bearhop S (2011) Comparing isotopic niche
widths among and within communities: SIBER – Stable Isotope BayesianEllipses in R. J Anim Ecol 80: 595–602.
18. Arthur K, Boyle M, Limpus C (2008) Ontogenetic changes in diet and habitat
use in green sea turtle (Chelonia mydas) life history. MEPS 362: 303–311.
doi:10.3354/meps07440.
19. Caut S, Angulo E, Courchamp F (2009) Variation in discrimination factors (D15N and D 13C): the effect of diet isotopic values and applications for diet
reconstruction. J Appl Ecol 46: 443–453. doi:10.1111/j.1365-
2664.2009.01620.x.
20. MacNeil M, Drouillard KG, Fisk AT (2006) Variable uptake and elimination ofstable nitrogen isotopes between tissues in fish. Can J Fish Aquat Sci 63: 345–
353. doi:10.1139/f05-219.
21. Hussey NE, Chapman DD, Donnelly E, Abercrombie DL, Fisk AT (2011) Fin-
icky samples: an assessment of shark fin as a source material for stable isotopeanalysis. Limnol Oceanogr-Meth 9: 524–532. doi:10.4319/lom.2011.9.524.
22. Hussey NE, MacNeil MA, Olin JA, McMeans BC, Kinney MJ, et al. (2012)Stable isotopes and elasmobranchs: tissue types, methods, applications and
assumptions. J Fish Biology 80: 1449–1484.
23. Kim SL, Casper DR, Galvan-Magana F, Ochoa-Dıaz R, Hernandez-Aguilar
SB, et al. (2012) Carbon and nitrogen discrimination factors for elasmobranchsoft tissues based on a long-term controlled feeding study. Environ Biol Fish 95:
37–52.
24. Hussey NE, Brush J, McCarthy ID, Fisk AT (2009) d15N and d13C diet–tissue
discrimination factors for large sharks under semi-controlled conditions.Comparative Biochemistry and Physiology, Part A 155: 1–9. doi:10.1016/
j.cbpa.2009.09.023.
25. Hussey NE, Wintner S, Dudley SFJ, Cliff G, Cocks DT, et al. (2010) Maternal
investment and size-specific reproductive output in carcharhinid sharks. J AnimEcol 79: 184–193. doi:10.1111/j.1365-2656.2009.01623.x.
26. Bigelow H, Schroeder W (1953) Fishes of the Western North Atlantic. Memoir
Sears Foundation for Marine Research. 1 pp.
27. CONAPESCA-INP (2004) Plan de Acci o n Nacional para el
Manejo y Conservacion de Tiburones, Rayas y Especies Afines en Mexico.MazatlanMexico: Comision Nacional de Acuacultura y Pesca e Instituto
Nacional de la Pesca, Secretarıa de Agricultura, Ganaderıa, Desarrollo Rural,Pesca y Alimentacion. 1 p.
28. Grijalba-Bendeck M, Polo-Silva C, Acero A (2007) Una aproximacion a la
abundancia de los Batoideos capturados artesanalmente en Santa Marta(Colombia). Bol Invest Mar Cost 36: 251–268.
29. Aguiar A, Valentin J, Rosa RS (2009) Habitat use by Dasyatis americana in a
south-western Atlantic oceanic island. J Mar Biol Ass 89: 1147–1152.
doi:10.1017/S0025315409000058.
30. Garro A, Vargas R, Zanella I, Le Foulgo L (2009) Analisis de las capturas detiburones y rayas en las pesquerıas artesanales de tarcoles, pacıfico central de
Costa Rica. Rev Mar y Cost 1: 145–157.
31. Tilley A, Strindberg S (2013) Population density estimation of southern stingrays
Dasyatis americana on a Caribbean atoll using distance sampling. Aquatic Conserv23: 202–209. doi:10.1002/aqc.2317.
32. Tilley A, Lopez-Angarita J, Turner JR (2013) Effects of scale and habitatdistribution on the movement of the southern stingray Dasyatis americana on a
Caribbean atoll. MEPS 482: 169–179. doi:10.3354/meps10285.
33. Snelson F Jr, Williams S (1981) Notes on the occurrence, distribution, and
biology of elasmobranch fishes in the Indian River Lagoon system, Florida.Estuaries 4: 110–120.
34. Smith K, Herrnkind W (1992) Predation on early juvenile spiny lobsters Panulirus
argus (Latreille): influence of size and shelter. J Exp Mar Bio Ecol 157: 3–18.
35. Howarth LM, Roberts CM, Thurstan RH, Stewart BD (2013) The unintended
consequences of simplifying the sea: making the case for complexity. Fish andFisheries. doi:10.1111/faf.12041.
36. Baum JK, Myers RA, Kehler DG, Worm B, Harley SJ, et al. (2003) Collapseand conservation of shark populations in the Northwest Atlantic. Science 299:
389–392.
37. Cortes E (1999) Standardized diet compositions and trophic levels of sharks.
ICES J Mar Sci 56: 707–717.
38. Preston T, Owens NJP (1983) Interfacing an automatic elemental analyser withan isotope ratio mass spectrometer: the potential for fully automated total
nitrogen and nitrogen-15 analysis. Analyst 108: 971–977. doi:10.1039/an9830800971.
39. Post DM, Layman CA, Albrey Arrington D, Takimoto G, Quattrochi J, et al.(2007) Getting to the fat of the matter: models, methods and assumptions for
dealing with lipids in stable isotope analyses. Oecologia 152: 179–189.
40. Layman CA, Arrington DA, Montana CG, Post DM (2007) Can Stable Isotope
Ratios Provide for Community-Wide Measures of Trophic Structure? Ecology88: 42–48.
41. Robbins C, Felicetti LA, Florin S (2010) The impact of protein quality on stablenitrogen isotope ratio discrimination and assimilated diet estimation. Oecologia
162: 571–571579.
42. Parnell AC, Inger R, Bearhop S, Jackson AL (2010) Source Partitioning UsingStable Isotopes: Coping with Too Much Variation. PLoS ONE 5: e9672.
doi:10.1371/journal.pone.0009672.
43. Froese R, Pauly D (2000) FishBase 2000, concepts, design and data sources.
Froese R, Pauly D, editors Los Banos, Laguna, Philippines, ICLARM. 1 p.
44. Dale J, Wallsgrove N, Popp B, Holland KN (2011) Nursery habitat use and
foraging ecology of the brown stingray Dasyatis lata determined from stomachcontents, bulk and amino acid stable isotopes. MEPS 433: 221–236.
doi:10.3354/meps09171.
45. Ward-Campbell BMS, Beamish FWH (2005) Ontogenetic changes in morphol-
ogy and diet in the snakehead, Channa limbata, a predatory fish in westernThailand. Environ Biol Fish 72: 251–257. doi:10.1007/s10641-004-1744-9.
46. Cummings D, Booth D, Lee R, Simpson S, Pile A (2010) Ontogenetic diet shifts
in the reef fish Pseudanthias rubrizonatus from isolated populations on the North-
West Shelf of Australia. MEPS 419: 211–222. doi:10.3354/meps08827.
47. Werner EE (1984) The Ontogenetic Niche and Species Interactions in Size-Structured Populations. Annu Rev Ecol Syst 15: 393–425. doi:10.1146/
annurev.ecolsys.15.1.393.
48. Lin HG, Banks T, Sternberg L (1991) Variations in 13C values for the seagrass
Thalassia testudinum and its relations to mangrove carbon. Aquat Bot 40: 333–341.
49. Saglam H, Ak O, Kutlu S, Aydin I (2010) Diet and feeding strategy of the
common stingray Dasyatis pastinaca (Linnaeus, 1758) on the Turkish coast ofsoutheastern Black Sea. Cah Biol Mar 51: 37–44.
50. Smith J, Merriner J (1985) Food habits and feeding behavior of the cownose ray,
Rhinoptera bonasus, in lower Chesapeake Bay. Estuaries 8: 305–310.
51. Stokes M, Holland N (1992) Southern Stingray (Dasyatis americana) Feeding on
Lancelets (Branchiostoma floridae). J Fish Biology 41: 1043–1044.
52. Vanderklift M, Ponsard S (2003) Sources of variation in consumer-diet d 15 N
enrichment: a meta-analysis. Oecologia 136: 169–182.
53. Robbins C, Felicetti LA, Sponheimer M (2005) The effect of dietary proteinquality on nitrogen isotope discrimination in mammals and birds. Oecologia
144: 534–540. doi:10.1007/s00442-005-0021-8.
54. Hussey NE, Olin JA, Kinney MJ, McMeans BC, Fisk AT (2012) Lipid extraction
effects on stable isotope values (d13C and d15N) of elasmobranch muscle tissue.J Exp Mar Bio Ecol 434–5: 7–15.
Trophic Ecology of the Southern Stingray
PLOS ONE | www.plosone.org 9 November 2013 | Volume 8 | Issue 11 | e79560

55. Matich P, Heithaus M, Layman CA (2010) Contrasting patterns of individual
specialization and trophic coupling in two marine apex predators. J Anim Ecol80: 294–305. doi:10.1111/j.1365-2656.2010.01753.x.
56. Cortes E, Gruber SH (1990) Diet, feeding habits and estimates of daily ration of
young lemon sharks, Negaprion brevirostris (Poey). Copeia: 204–218.57. Peterson C, Fodrie FJ, Summerson HC, Powers S (2001) Site-Specific and
Density-Dependent Extinction of Prey by Schooling Rays: Generation of aPopulation Sink in Top-Quality Habitat for Bay Scallops. Oecologia 129: 349–
356.
58. Valentine J, Heck K Jr, Harper P (1994) Effects of bioturbation in controllingturtlegrass (Thalassia testudinum Banks ex Konig) abundance: evidence from field
enclosures and observations in the Northern Gulf of Mexico. J Exp Mar Bio Ecol178: 182–192.
59. Henningsen A (2000) Notes on reproduction in the Southern Stingray, Dasyatis
americana (Chondrichthyes : Dasyatidae), in a captive environment. Copeia 3:
826–828.
60. O’Gorman E, Enright RA, Tompkins E (2008) Predator diversity enhances
secondary production and decreases the likelihood of trophic cascades.
Oecologia 158: 557–567. doi:10.1007/s00442-008-1165-0.
61. Smith WD, Cailliet GM, Cortes E (2008) Demography and elasticity of the
diamond stingray, Dasyatis dipterura: parameter uncertainty and resilience to
fishing pressure. Mar Freshwater Res 59: 575. doi:10.1071/MF07020.
62. Vander Zanden M, Rasmussen JB (2001) Variation in d15N and d13C trophic
fractionation: implications for aquatic food web studies. Limnol Oceanogr 46:
2061–2066.
Trophic Ecology of the Southern Stingray
PLOS ONE | www.plosone.org 10 November 2013 | Volume 8 | Issue 11 | e79560