Diet and food insecurity University of Warwick 16 th April 2015.
24
Diet and food insecurity University of Warwick 16 th April 2015
-
Upload
madison-wade -
Category
Documents
-
view
215 -
download
0
Transcript of Diet and food insecurity University of Warwick 16 th April 2015.

Diet and food insecurityUniversity of Warwick 16th April 2015
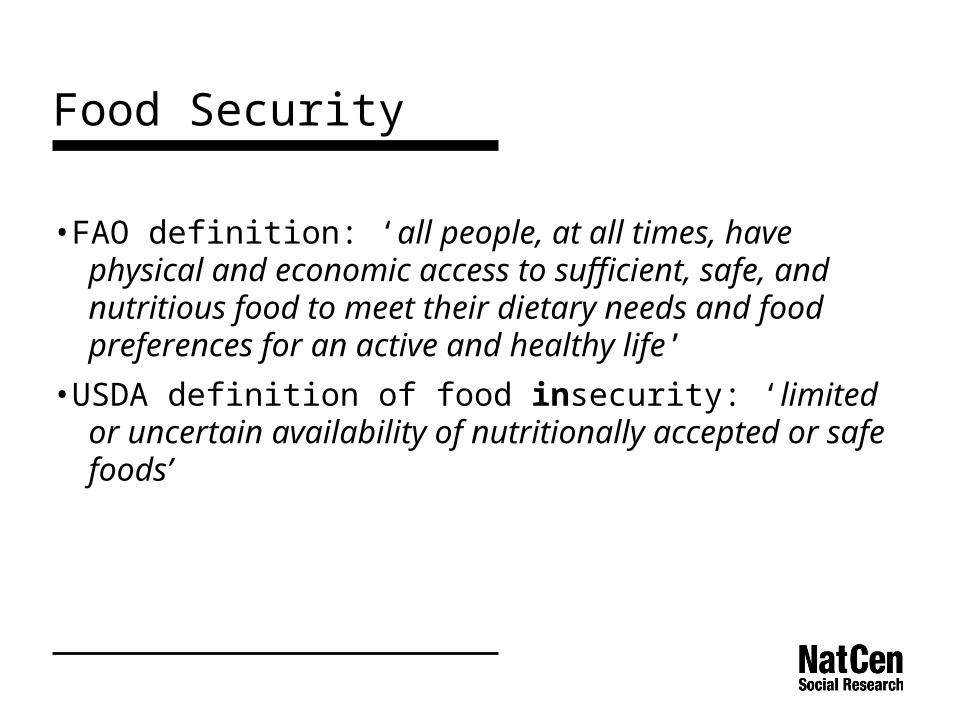
Food Security
•FAO definition: ‘all people, at all times, have physical and economic access to sufficient, safe, and nutritious food to meet their dietary needs and food preferences for an active and healthy life’
•USDA definition of food insecurity: ‘limited or uncertain availability of nutritionally accepted or safe foods’
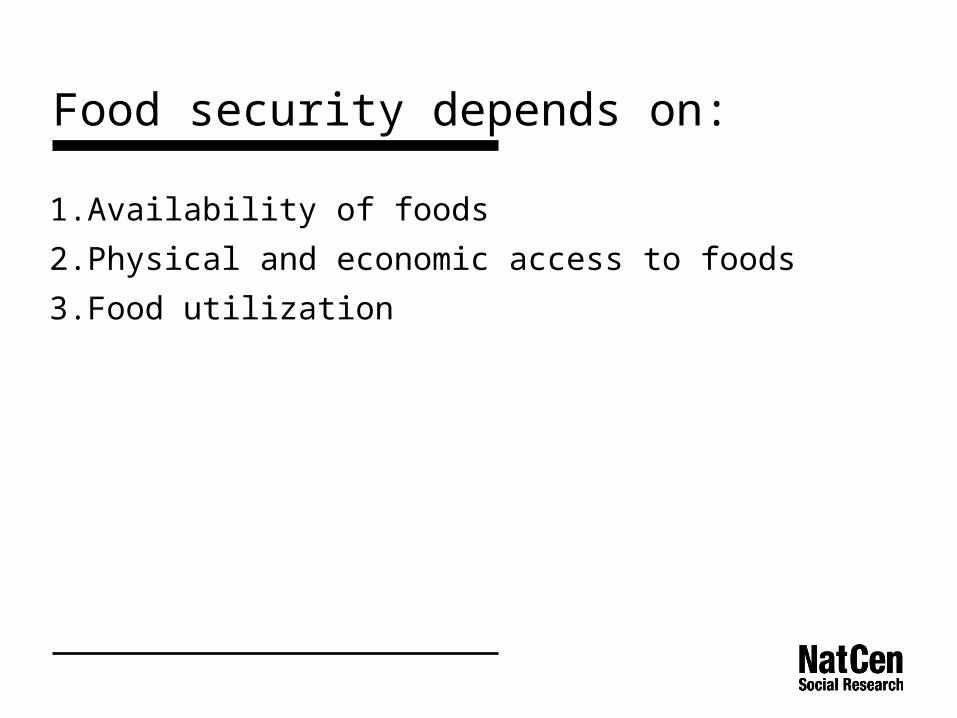
1. Availability of foods
2. Physical and economic access to foods
3. Food utilization
Food security depends on:

• Food insecurity not routinely measured in UK surveys
• Income, SES or other measure of deprivation most commonly used
What is the evidence for the impact of food insecurity on diet in the UK?
• Spend more
• Buy less
• Trade down
Changes to food purchasing in response to higher food prices
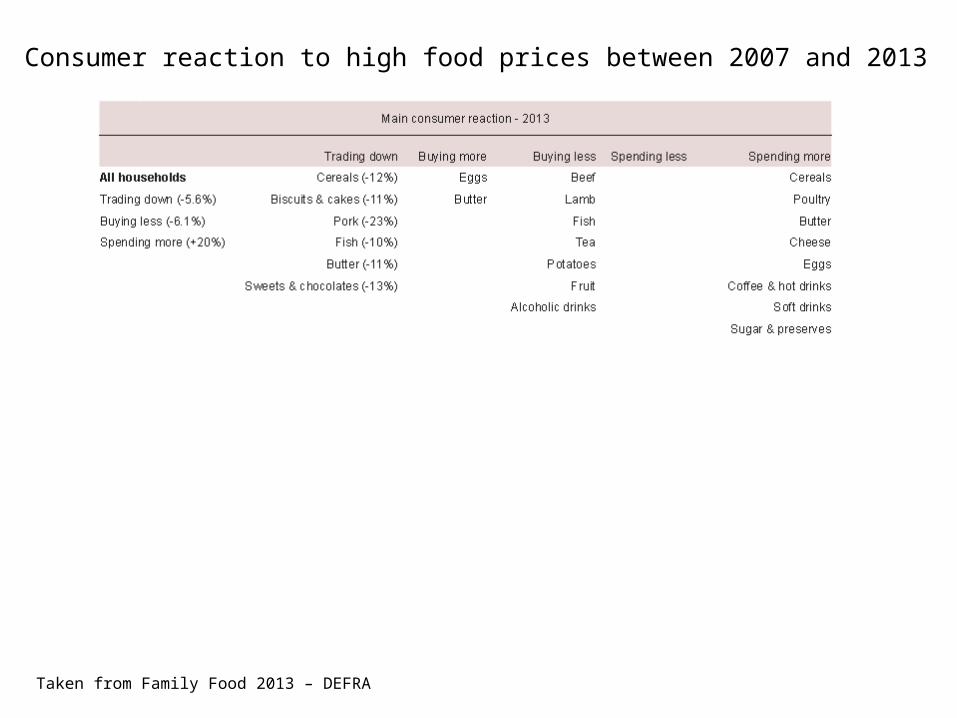
Consumer reaction to high food prices between 2007 and 2013
Taken from Family Food 2013 – DEFRA
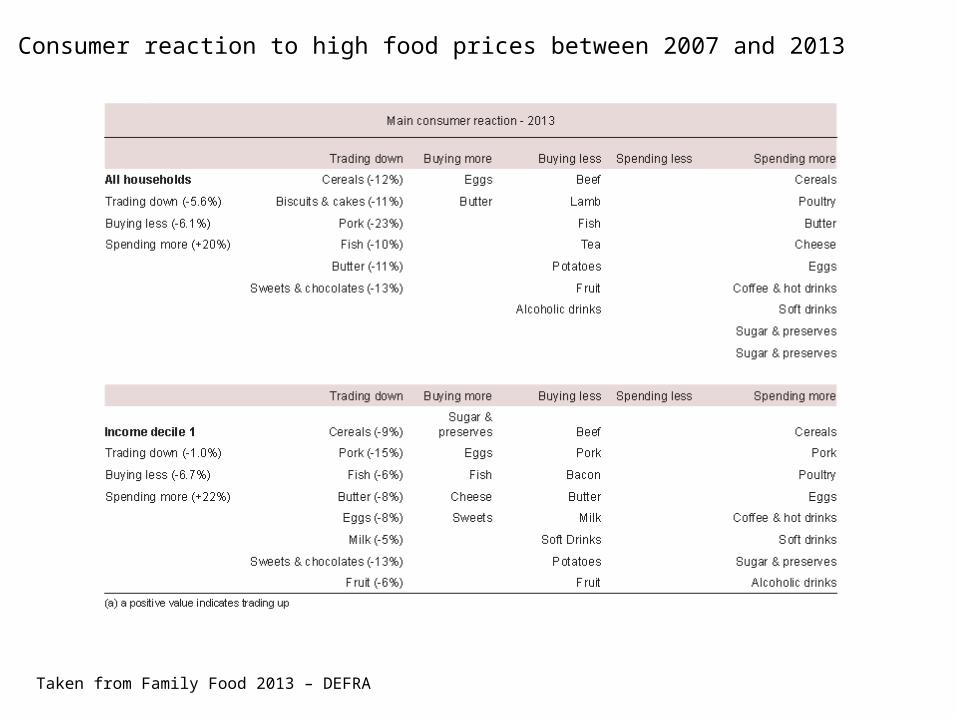
Consumer reaction to high food prices between 2007 and 2013
Taken from Family Food 2013 – DEFRA
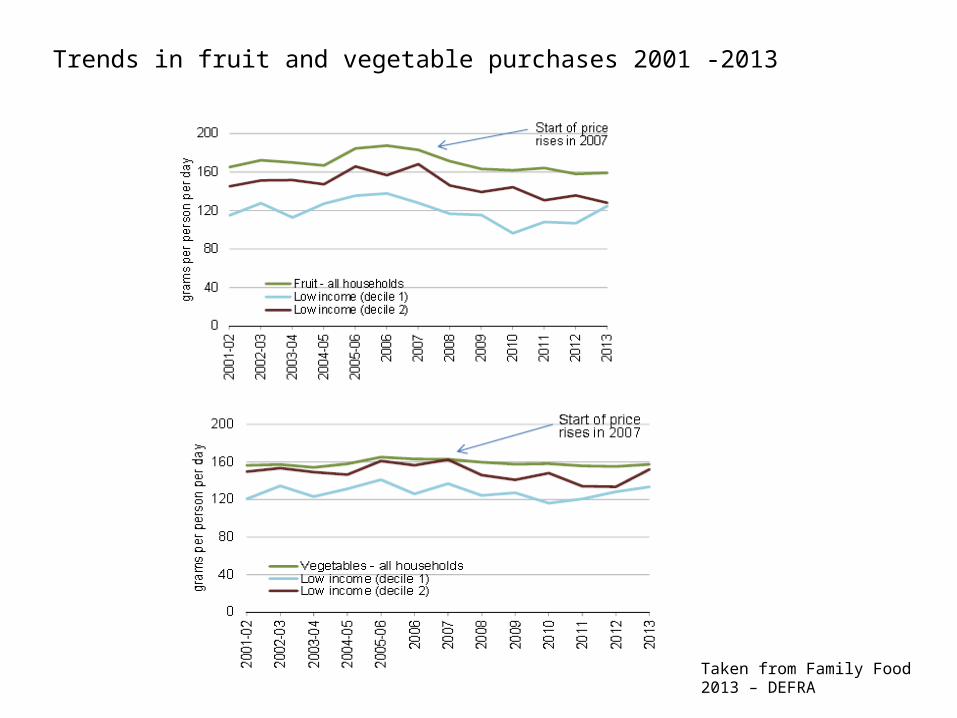
Trends in fruit and vegetable purchases 2001 -2013
Taken from Family Food 2013 – DEFRA

Mean price of foods by Eatwell food group, 2002–2012.
Jones NRV, Conklin AI, Suhrcke M, Monsivais P (2014) The Growing Price Gap between More and Less Healthy Foods: Analysis of a Novel Longitudinal UK Dataset. PLoS ONE 9(10): e109343. doi:10.1371/journal.pone.0109343http://127.0.0.1:8081/plosone/article?id=info:doi/10.1371/journal.pone.0109343

Mean price of foods by Food Standards Agency nutrient profiling score category, 2002–2012
Jones NRV, Conklin AI, Suhrcke M, Monsivais P (2014) The Growing Price Gap between More and Less Healthy Foods: Analysis of a Novel Longitudinal UK Dataset. PLoS ONE 9(10): e109343. doi:10.1371/journal.pone.0109343http://127.0.0.1:8081/plosone/article?id=info:doi/10.1371/journal.pone.0109343

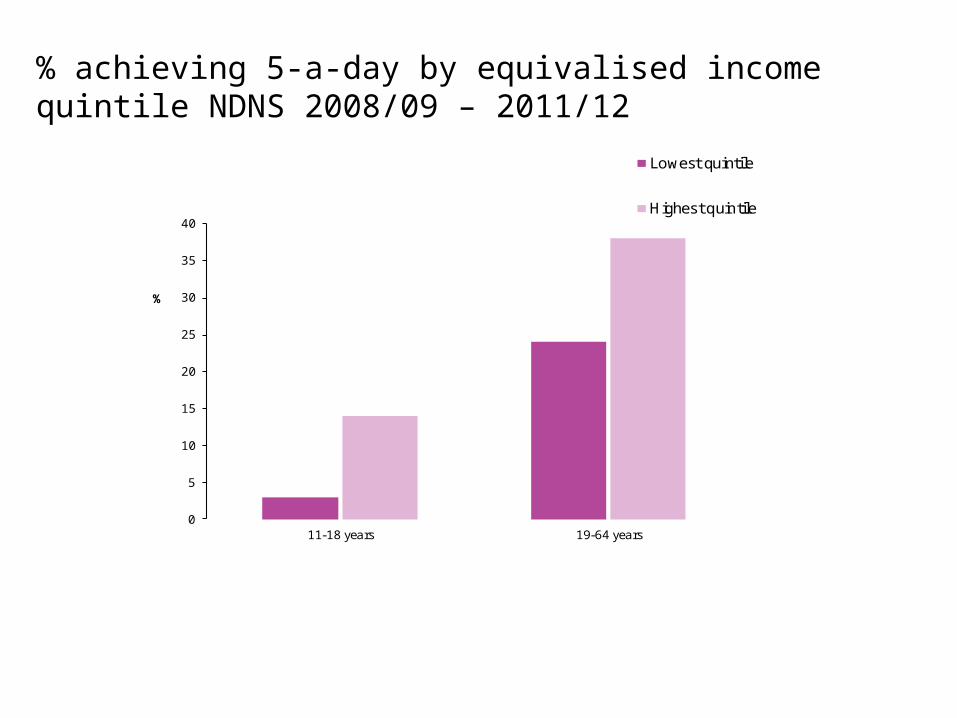
% achieving 5-a-day by equivalised income quintile NDNS 2008/09 – 2011/12
0
5
10
15
20
25
30
35
40
11-18 years 19-64 years
%
Lowest quintile
Highest quintile

Proportion adults aged 16 years and over achieving 5-a-day by income Health Survey for England 2011
Taken from Social and economic inequalities in diet and physical activity – Public Health England 2013
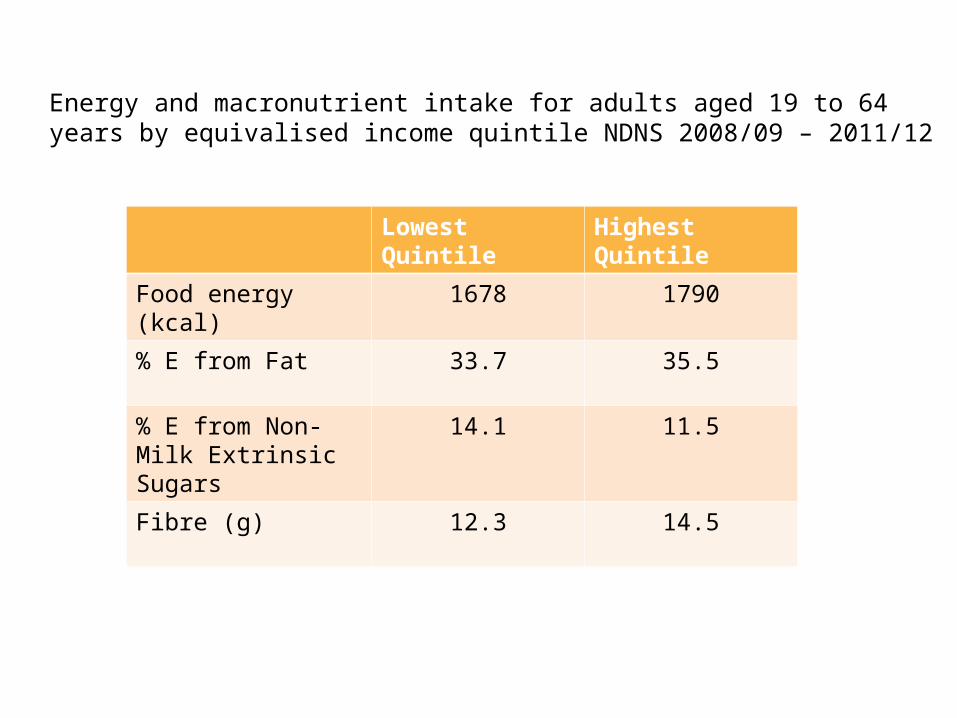
Energy and macronutrient intake for adults aged 19 to 64 years by equivalised income quintile NDNS 2008/09 – 2011/12
Lowest Quintile
Highest Quintile
Food energy (kcal) 1678 1790
% E from Fat 33.7 35.5
% E from Non-Milk Extrinsic Sugars
14.1 11.5
Fibre (g) 12.3 14.5
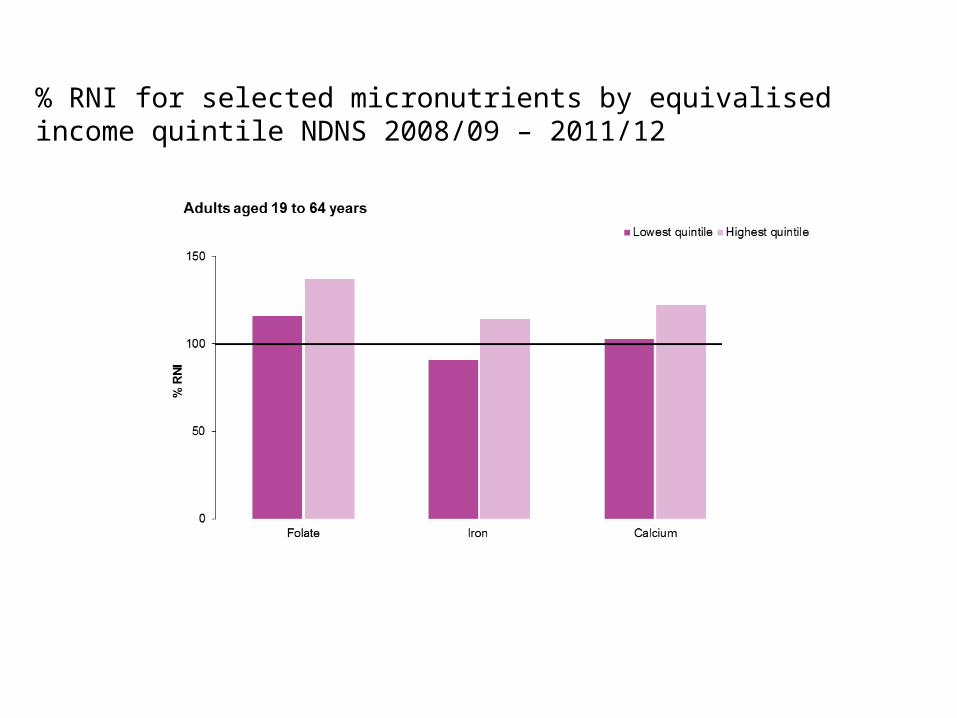
% RNI for selected micronutrients by equivalised income quintile NDNS 2008/09 – 2011/12

% with iron intake below LRNI by equivalised income quintile NDNS 2008/09 – 2011/12
0
10
20
30
40
50
Iron
%
Lowest quintile
Highest quintile
Women aged 19 to 64 years
Low Income Diet and Nutrition Survey (LIDNS)
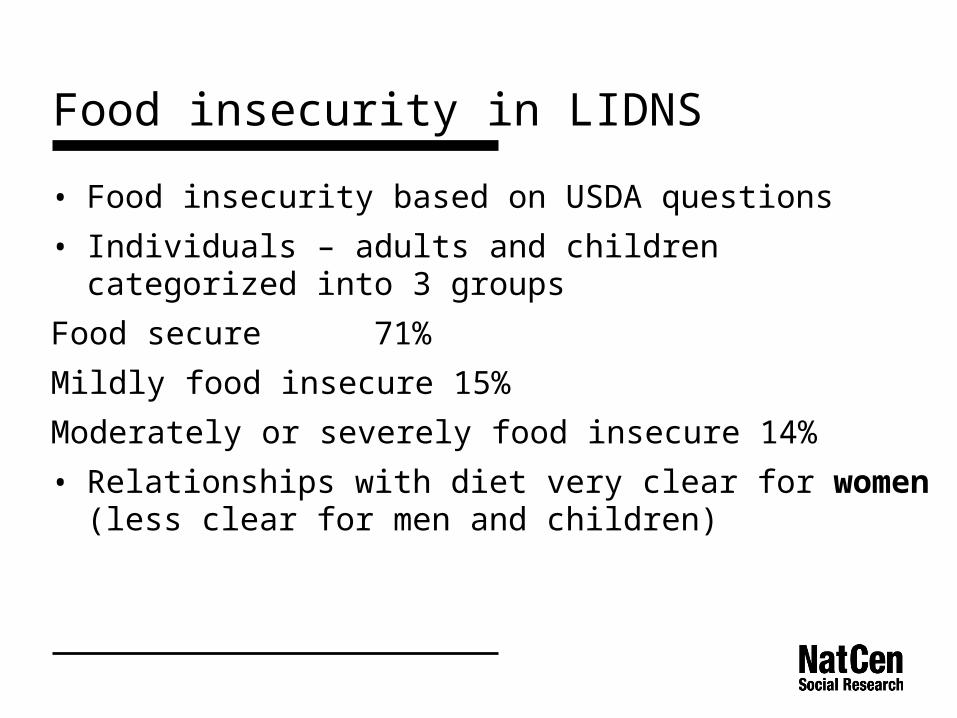
• Food insecurity based on USDA questions
• Individuals – adults and children categorized into 3 groups
Food secure 71%
Mildly food insecure 15%
Moderately or severely food insecure 14%
• Relationships with diet very clear for women (less clear for men and children)
Food insecurity in LIDNS
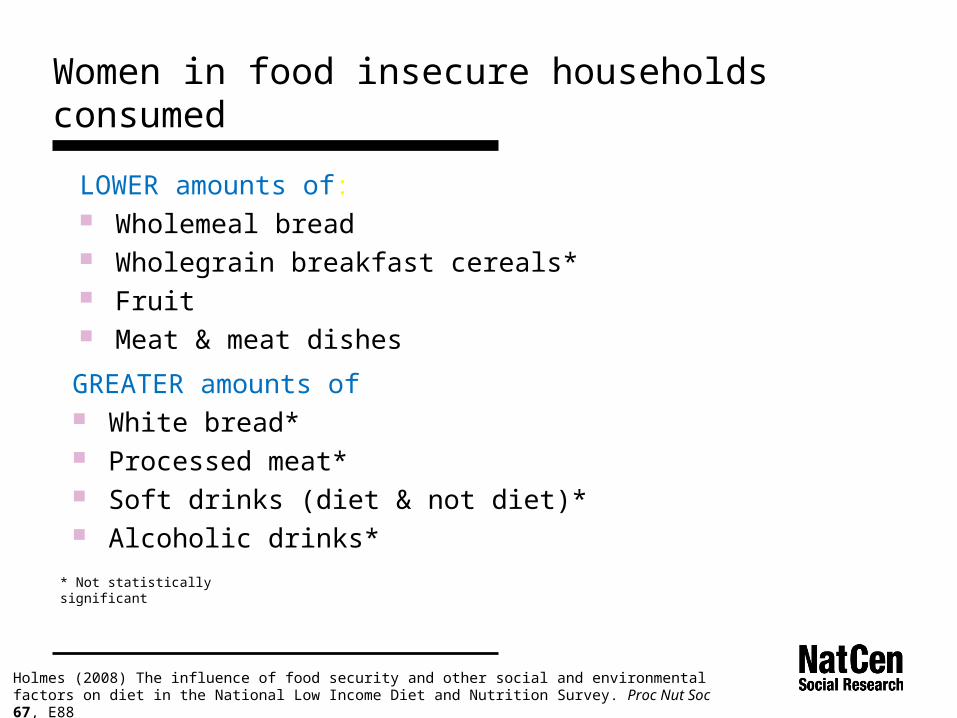
LOWER amounts of: Wholemeal bread Wholegrain breakfast cereals* Fruit Meat & meat dishes
GREATER amounts of White bread* Processed meat* Soft drinks (diet & not diet)* Alcoholic drinks*
* Not statistically significant
Women in food insecure households consumed
Holmes (2008) The influence of food security and other social and environmental factors on diet in the National Low Income Diet and Nutrition Survey. Proc Nut Soc 67, E88

0
20
40
60
80
100
120
140
160
180
Thiamin Folate Zinc Iron Magnesium
Food secure
Food insecure: mild
Food insecure: moderate/severe
% RNI by food security (women)
Holmes (2008) The influence of food security and other social and environmental factors on diet in the National Low Income Diet and Nutrition Survey. Proc Nut Soc 67, E88

0
10
20
30
40
50
60
Iron Potassium Magnesium Zinc
Food secure
Food insecure: mild
Food insecure: moderate/severe
% below the LRNI by food security (women)
Holmes (2008) The influence of food security and other social and environmental factors on diet in the National Low Income Diet and Nutrition Survey. Proc Nut Soc 67, E88

Adults in food insecure households more likely to have type 2 diabetes and hypertension (Seligman 2007) have increased predicted 10 year cardiovascular disease
risk (Ford 2013) be overweight - women only (Townsend 2001; Basiotis
2002; Ford 2013)
Food insecurity and health
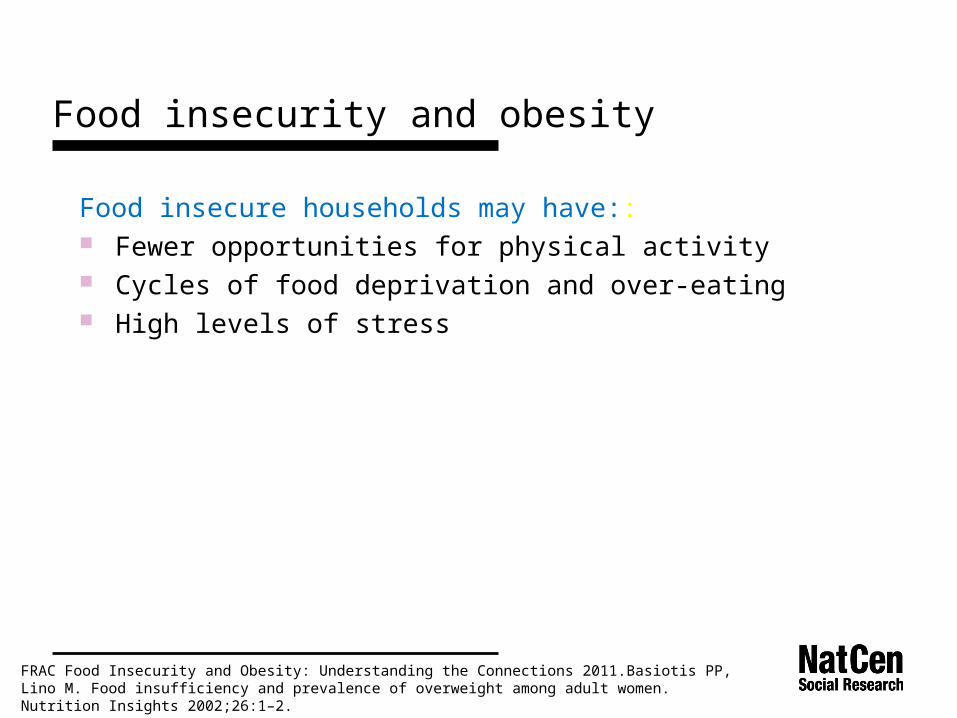
Food insecure households may have:: Fewer opportunities for physical activity Cycles of food deprivation and over-eating High levels of stress
Food insecurity and obesity
FRAC Food Insecurity and Obesity: Understanding the Connections 2011.Basiotis PP, Lino M. Food insufficiency and prevalence of overweight among adult women. Nutrition Insights 2002;26:1–2.

Future
• Need to include food security measures in UK national health surveys – like NDNS or HSE??
• Longitudinal data to determine causal link?