Diel-scale temporal dynamics recorded for bacterial groups ...
12
1 SCIENTIFIC REPORTS | 7:40189 | DOI: 10.1038/srep40189 www.nature.com/scientificreports Diel-scale temporal dynamics recorded for bacterial groups in Namib Desert soil Eoin Gunnigle 1 , Aline Frossard 1 , Jean-Baptiste Ramond 1 , Leandro Guerrero 1 , Mary Seely 2,3 & Don A. Cowan 1 Microbes in hot desert soil partake in core ecosystem processes e.g., biogeochemical cycling of carbon. Nevertheless, there is still a fundamental lack of insights regarding short-term (i.e., over a 24-hour [diel] cycle) microbial responses to highly fluctuating microenvironmental parameters like temperature and humidity. To address this, we employed T-RFLP fingerprinting and 454 pyrosequencing of 16S rRNA-derived cDNA to characterize potentially active bacteria in Namib Desert soil over multiple diel cycles. Strikingly, we found that significant shifts in active bacterial groups could occur over a single 24-hour period. For instance, members of the predominant Actinobacteria phyla exhibited a significant reduction in relative activity from morning to night, whereas many Proteobacterial groups displayed an opposite trend. Contrary to our leading hypothesis, environmental parameters could only account for 10.5% of the recorded total variation. Potential biotic associations shown through co-occurrence networks indicated that non-random inter- and intra-phyla associations were ‘time-of-day-dependent’ which may constitute a key feature of this system. Notably, many cyanobacterial groups were positioned outside and/or between highly interconnected bacterial associations (modules); possibly acting as inter-module ‘hubs’ orchestrating interactions between important functional consortia. Overall, these results provide empirical evidence that bacterial communities in hot desert soils exhibit complex and diel-dependent inter-community associations. Macro- and micro-environmental parameters are critical in governing community assembly and function 1,2 . is is especially true in hot desert ecosystems, where extreme environmental conditions have led to discrete adap- tations (i.e., collectively leading to niche specialization) for many plants and animal species 3–5 . Such extreme conditions are also considered to be key drivers of both the structure and function of edaphic microbial commu- nities 6–8 . Given that climate change models predict major shiſts in future temperature and precipitation regimes for dry-land regions (e.g., 10–30% reduced precipitation in subtropical arid zones by the end of the 21st century 9 ), changes in complex multi-trophic responses over short and long time scales are likely to impact significantly on core ecosystem processes (e.g., carbon storage in soils 10 ). In consequence, ecologists have become increasingly interested in further understanding the influence of temporality in shaping community structures and functions in hot desert soils 11–13 , which in turn can aid in predicting future ecological impacts. To date, research on microbial temporal dynamics in hot deserts has been largely focused on diversity patterns over seasonal and yearly scales 14–17 and/or aſter a wetting event 18–20 . Although key insights into the causative factors (deterministic vs. stochastic) driving microbial community structure have been provided across bioge- ographic space 21,22 , comparatively little is known about the fine-scale temporal changes in edaphic microbial community structure and function. Indeed, other than studies focused on Cyanobacteria 23,24 and a temperature manipulation experiment 25 , short temporal community dynamics have been neglected. is is surprising given the fact that significant differences in specific desert soil processes have been recorded over the diel (24 hrs) cycle (e.g., CO 2 flux refs 26–28). In addition, asymmetrical diel warming; i.e., the increase in daily minimum temper- ature (T min ), is widely observed and set to continue in terrestrial ecosystems 29,30 and is likely to impact negatively on microbial communities and their processes 31 . 1 Centre for Microbial Ecology and Genomics, Genomic Research Institute, Department of Genetics, University of Pretoria, South Africa. 2 Gobabeb Research and Training Centre, Walvis Bay, Namibia. 3 School of Animal, Plant and Environmental Sciences University of the Witwatersrand, South Africa. Correspondence and requests for materials should be addressed to E.G. (email: [email protected]) Received: 26 August 2016 Accepted: 01 December 2016 Published: 10 January 2017 OPEN
Transcript of Diel-scale temporal dynamics recorded for bacterial groups ...

1Scientific RepoRts | 7:40189 | DOI: 10.1038/srep40189
www.nature.com/scientificreports
Diel-scale temporal dynamics recorded for bacterial groups in Namib Desert soilEoin Gunnigle1, Aline Frossard1, Jean-Baptiste Ramond1, Leandro Guerrero1, Mary Seely2,3 & Don A. Cowan1
Microbes in hot desert soil partake in core ecosystem processes e.g., biogeochemical cycling of carbon. Nevertheless, there is still a fundamental lack of insights regarding short-term (i.e., over a 24-hour [diel] cycle) microbial responses to highly fluctuating microenvironmental parameters like temperature and humidity. To address this, we employed T-RFLP fingerprinting and 454 pyrosequencing of 16S rRNA-derived cDNA to characterize potentially active bacteria in Namib Desert soil over multiple diel cycles. Strikingly, we found that significant shifts in active bacterial groups could occur over a single 24-hour period. For instance, members of the predominant Actinobacteria phyla exhibited a significant reduction in relative activity from morning to night, whereas many Proteobacterial groups displayed an opposite trend. Contrary to our leading hypothesis, environmental parameters could only account for 10.5% of the recorded total variation. Potential biotic associations shown through co-occurrence networks indicated that non-random inter- and intra-phyla associations were ‘time-of-day-dependent’ which may constitute a key feature of this system. Notably, many cyanobacterial groups were positioned outside and/or between highly interconnected bacterial associations (modules); possibly acting as inter-module ‘hubs’ orchestrating interactions between important functional consortia. Overall, these results provide empirical evidence that bacterial communities in hot desert soils exhibit complex and diel-dependent inter-community associations.
Macro- and micro-environmental parameters are critical in governing community assembly and function1,2. This is especially true in hot desert ecosystems, where extreme environmental conditions have led to discrete adap-tations (i.e., collectively leading to niche specialization) for many plants and animal species3–5. Such extreme conditions are also considered to be key drivers of both the structure and function of edaphic microbial commu-nities6–8. Given that climate change models predict major shifts in future temperature and precipitation regimes for dry-land regions (e.g., 10–30% reduced precipitation in subtropical arid zones by the end of the 21st century9), changes in complex multi-trophic responses over short and long time scales are likely to impact significantly on core ecosystem processes (e.g., carbon storage in soils10). In consequence, ecologists have become increasingly interested in further understanding the influence of temporality in shaping community structures and functions in hot desert soils11–13, which in turn can aid in predicting future ecological impacts.
To date, research on microbial temporal dynamics in hot deserts has been largely focused on diversity patterns over seasonal and yearly scales14–17 and/or after a wetting event18–20. Although key insights into the causative factors (deterministic vs. stochastic) driving microbial community structure have been provided across bioge-ographic space21,22, comparatively little is known about the fine-scale temporal changes in edaphic microbial community structure and function. Indeed, other than studies focused on Cyanobacteria23,24 and a temperature manipulation experiment25, short temporal community dynamics have been neglected. This is surprising given the fact that significant differences in specific desert soil processes have been recorded over the diel (24 hrs) cycle (e.g., CO2 flux refs 26–28). In addition, asymmetrical diel warming; i.e., the increase in daily minimum temper-ature (Tmin), is widely observed and set to continue in terrestrial ecosystems29,30 and is likely to impact negatively on microbial communities and their processes31.
1Centre for Microbial Ecology and Genomics, Genomic Research Institute, Department of Genetics, University of Pretoria, South Africa. 2Gobabeb Research and Training Centre, Walvis Bay, Namibia. 3School of Animal, Plant and Environmental Sciences University of the Witwatersrand, South Africa. Correspondence and requests for materials should be addressed to E.G. (email: [email protected])
Received: 26 August 2016
Accepted: 01 December 2016
Published: 10 January 2017
OPEN
www.nature.com/scientificreports/
2Scientific RepoRts | 7:40189 | DOI: 10.1038/srep40189
Since Noy-Meir32 highlighted the influence of pulsed water events in arid systems over 40 years ago, it has been widely believed that hot desert edaphic microbial communities remain relatively static during extended periods of dryness. Stemming from this, the modern pulse-reserve ‘bioavailable water’ paradigm33 proposes a restric-tion of biological activity in arid soils to pre- and post episodic rainfall events, although this response can vary considerably depending on the duration and intensity of these events34–36. By definition however, rainfall events are extremely infrequent in hot desert regions. For instance, fewer than 10 rainfall events occur annually in the Namib Desert37 and parts of the Atacama Desert may receive a rainfall event only once per decade38. Recent evi-dence has demonstrated that diverse microbial populations can be found under ‘standard’ conditions in both cold desert39,40 and hot desert soil38,41,42. Although many of these cells are likely to have been dormant, many organisms can endure the effects of a water-limited environment by employing specific adaptation mechanisms that include (i) the accumulation of compatible solutes (e.g., trehalose, sucrose) and/or (ii) the production of exopolysaccha-rides. This has been demonstrated for key edaphic bacterial phyla, such as Proteobacteria43, Actinobacteria44 and Cyanobacteria23. In coastal deserts, such as the Namib and Atacama Deserts, moisture inputs such as fog and dew precipitation are fundamental in sustaining hot desert insect and plant populations45,46, as well as microbial com-munities47–51. Fog events can occur when the water vapor concentration in the atmosphere reaches saturation, i.e., 100% relative humidity (RH)52. As temperature and relative humidity have an interdependent relationship, inverse maximum values are an important feature of hot desert systems over the diel cycle (day [temperature maximum] vs. night [RH maximum) (e.g., Atacama Desert ref. 52). These insights provide much scope to the possibility that although microbial communities are highly reactive to water pulse events (i.e., rainfall), microbial activity within the soil matrix may not be entirely limited to these timelines; particularly in the fog-impacted Namib Desert37.
Given the reduced microbial species richness and diversity in desert soils when compared to mesic-type soils41, this environment presents a model system in which to examine the ecology of in situ edaphic micro-bial consortia. As well as this, the improved access to modern high throughput sequencing and bioinformatics tools have greatly enhanced our capacity to interrogate the complexity of microbial community dynamics in soil33,41,51,53. For instance, network analysis can be used to evaluate inter- and intra- taxa associations through statistically robust co-occurrence patterns and theorize on species interactions (e.g., competitive, cooperative or null)33,51,53. Therefore, there is much scope in utilizing this comparatively less complex soil environment to answer pertinent ecological questions relating to microbial function and community dynamics.
In our experimental approach, we investigated the diversity (community composition) of potentially active bacterial communities (total RNA-based) in Namib Desert soil over multiple diel cycles. More specifically, we aimed to test the hypothesis that day-night variations in microclimatic factors (i.e., temperature and humidity) would reflect changes in active hot desert soil bacterial communities. We also aimed to determine if the recorded environmental factors were solely responsible for any observed structural shifts or did other factors (e.g., biotic factors such as microbial interactions) also play a role. In order to accomplish this we employed molecular fin-gerprinting (T-RFLP) together with 454 pyrosequencing of 16S rRNA gene amplicons. Community data analyses incorporated an array of physicochemical parameters together with climatic measurements recorded throughout the 5-day sampling period, which comprised of three daily sampling time points (morning, midday and night).
Results and DiscussionThe light-dark (diel) cycle drives behavioral responses that are an essential component of life in hot desert sys-tems. In higher organisms, well-characterized circadian rhythms facilitate adaptive strategies within these habi-tats that include the reproductive behaviour of desert locusts54, heterothermy in desert mammals55 and in desert plant physiology56. It has also been reported that the globally distributed circadian gene locus, cpmA, is highly conserved in key microbial phylotypes such as Cyanobacteria57, which suggests a key role in the maintenance of intracellular homeostasis and adaptation58. For mixed communities, light-dependent changes in microbial gene expression are also a feature in hot desert biological soil crusts23. By focusing on RNA isolated from bacterial communities in situ, we provide evidence that changes in active bacterial groups can occur over fine time scales and that both environmental selection and biotic associations are crucial factors within this system.
Site characteristics. No rainfall or fog events were recorded on site during the experimental period. Historically, fog events have provided a key source of bioavailable moisture in Gobabeb37. Fog events have an interdependent relationship with atmospheric humidity, which tends to reach maximum levels in the morn-ing before dissipating quickly after sunrise37,52. During this study, in situ soil relative humidity (RH) levels were highly variable over each diel cycle (Fig. 1; time-points; P < 0.001). Soil RH values ranged from 25% (midday, day 4) to 59% (night, day 1). The diel RH profiles differed between days with the RH profile on day 1 was found to vary significantly from those of days 2, 3 and 4 (post hoc testing with Tukey-HSD comparisons; P < 0.001). An increase in peak soil temperature after day 1 (day 1, 47 °C, days 2 to 5, ≥ 50 °C) may have accounted for this shift in RH values. Physiocochemical parameters (pH, organic C, conductivity, mass concentrations of P, Ca, K, Mg, Na, S) were relatively homogenous over the entire sampling period (Table S1). Significant differences were found between days for nitrate (F4.45 = 3.54, P = 0.017) and magnesium (F4.45 = 3.01, P = 0.037) but this was likely to be a consequence of spatial heterogeneity, with a nutrient ‘hotspot’ recorded for a single biological replicate sampled on day 2 (Fig. S1).
Changes in active bacterial communities revealed by T-RFLP analysis. Community fingerprinting by T-RFLP rRNA gene (cDNA) analysis recorded a total of 27 unique terminal restriction fragments (TRFs), likely representing the most active bacterial taxa present in this soil system59. The number of TRFs per sample (α -diversity) ranged from 12 to 23 with only 4 (15%) and 2 (7%) TRFs not detected for each day or time-point, respectively. Despite the absence of discernable clustering patterns for both Morning and Night bacterial

www.nature.com/scientificreports/
3Scientific RepoRts | 7:40189 | DOI: 10.1038/srep40189
communities through nMDS ordination, the Midday communities did cluster relative to the other time-points (Fig. 2a). Significant shifts in potentially active bacterial communities was recorded between time-points was con-firmed by PERMANOVA (F4,45 = 5.51, P = 0.007). Interestingly, the T-RFLP community profiles were not found
Figure 1. Experimental design and environmental parameters (temperature & humidity) measured over the 5-day study at a local site adjacent to the Gobabeb Training and Research Centre, Namib Desert.
Figure 2. Non-metric multidimensional scaling (nMDS) ordination of Bray–Curtis distances between microbial communities (cDNA-based) inferred from (a) T-RFLP community fingerprinting and (b) 454-pyrosequencing. Each point represents a bacterial community at a specific time-point (n = 45).

www.nature.com/scientificreports/
4Scientific RepoRts | 7:40189 | DOI: 10.1038/srep40189
to be significantly different between days (F4,45 = 0.15, P = 0.961). This was also found in 454 pyrosequencing analysis using the same samples (Fig. 2b; time-points, F4,44 = 1.12, P = 0.04)
Considerable diversity in hot desert soil bacterial communities. In order to provide further insight into these findings we performed deep-sequencing analysis. 454 pyrosequencing of 16S rRNA gene amplicons (generated from the same cDNA pool as for T-RFLP analyses) resulted in a total of 4348 OTUs (96 316 sequence reads, n = 45) at the 97% cutoff (cutoff level for all OTUs if not stated otherwise), with 1414 singletons (32%) and 606 doubletons (14%). After sub-sampling this dataset for sequence consistency (1702 OTUs > 15,000 reads), the number of singletons and doubletons increased to 47% and 15%, respectively. The large number of ‘rare’ OTUs identified here is not uncommon for hot desert soil communities6,38 and can represent novel diversities within the rare biosphere60. Alpha-diversity was relatively consistent between samples regardless of the diversity metric used; i.e., with no significant differences between days or time-points (Table 1). For many of the communities sampled, rarefaction analysis exhibited approximate plateau plot behavior (Figure S2), suggesting that sampling depth was sufficient to properly assess the bacterial diversity within this system. A total of 20 bacterial phyla were identi-fied (Fig. 3, Figs S3 and S4 [with standard deviation]), with members of 8 phyla representing ~95% of the total bacterial community (in order of abundance; Actinobacteria, Proteobacteria, Cyanobacteria, Gemmatimonadetes, Chloroflexi, Bacteroidetes, Firmicutes, Armatimonadetes). The proportion of classifiable sequences decreased sub-stantially from phylum (98%) to genus (10%) levels, showing Namib Desert soils present numerous novel rep-resentatives of well-known edaphic phyla41,61. Nevertheless, the vast majority of sequences could be classified to class level (95% of sequences). The ubiquitous Actinobacteria (44.8% ± 5.6% 16S rRNA gene sequences; mean between time-points ± s.d.) and Proteobacteria (38.2% ± 3.6%) dominated all soil samples and also exhibited very high diversity (> 300 OTUs classified to family level). This is consistent with previous phylogenetic surveys of bacterial communities in hot desert soils and soil crusts, including sites in the Negev33, Atacama62 and Namib Deserts63. Cyanobacteria comprised fewer OTUs than many of other bacterial phyla but were present at relatively high abundance (6.44% ± 1.37%; Fig. S5). The reverse was found for the Gemmatimonadetes, Armatimonadetes, Chloroflexi and Bacteroidetes phyla.
Strikingly, it was found that only a small fraction of the OTUs were detected at each time-point (i.e., core com-munity - 19.4%; n = 328; Fig. 4), with the amount of OTUs recorded only at a single time-point being relatively high. For example, the night-specific OTUs represented > 25% of the total bacterial activity. This pattern was also found when each day was analyzed separately (Fig. S6). PERMANOVA confirmed that the bacterial commu-nity composition exhibited significant structural shifts over each diel cycle (F2,44 = 1.3370, P = 0.044), supporting observations from T-RFLP analyses. We also found that the majority of the temporally-specific OTUs were mem-bers of the rare bacterial fraction (> 60% of total OTUs). Indeed, the core community (< 20% of total OTUs) con-stituted the majority of total sequence reads with a mean relative abundance value of 78% for all samples. In order to ascertain whether this rare fraction were primarily responsible for the recorded shifts in community struc-ture, we applied the same approach with the rare fraction removed (i.e., with no singletons or doubletons), thus reducing the time-point specific OTUs from 1035 [61.4%] to 21 [4%]). A similar statistical result was recorded (Table S2), confirming that prevalent members within these hot desert soil bacterial communities also exhibited a significant shift in relative abundance patterns over a diel cycle.
Phylogeny and distribution of diversity. Relative abundance patterns of the bacterial communities were analysed by aggregating all taxa at the phylum, class and order levels. Overall, the phyla Actinobacteria and
Day Time-point
Richness Diversity Evenness
Observed Chao1 ACE Shannon Inv. Simpson Shannon even
1
Morning 287(41) 205(64) 253(110) 4.4(0.3) 64.5(30.4) 0.9(0.02)
Midday 435(37) 337(292) 556(292) 4.3(0.7) 63.2(15.6) 0.88(0.06)
Night 532(84) 382(55) 609(298) 4.7(0.3) 69.9(49.6) 0.89(0.06)
2
Morning 337(39) 189(101) 251(173) 4.1(0.7) 47.5(27.9) 0.87(0.06)
Midday 341(37) 194(85) 278(164) 4.2(0.4) 44.9(19.9) 0.88(0.03)
Night 385(40) 283(169) 299(189) 4.1(0.8) 47.1(37.6) 0.84(0.08)
3
Morning 490(14) 490(208) 923(299) 4.6(0.4) 80(47.8) 0.91(0.03)
Midday 399(20) 232(48) 234(48) 4.4(0.3) 51.5(9.6) 0.9(0.02)
Night 425(44) 300(52) 297(76) 4.2(0.6) 27.9(17.1) 0.88(0.08)
4
Morning 463(18) 336(223) 492(92) 4.5(0.6) 97.3(45.8) 0.9(0.05)
Midday 507(74) 414(162) 561(248) 4.6(0.3) 64.4(38.2) 0.93(0.02)
Night 242(40) 129(108) 180(109) 3.2(0.9) 24.4(12.4) 0.74(0.09)
5
Morning 300(88) 154(86) 167(81) 3.8(0.7) 30.7(28.4) 0.83(0.08)
Midday 419(41) 291(161) 422(189) 4.3(0.7) 48.5(33.6) 0.87(0.07)
Night 389(23) 224(27) 325(98) 4.4(0.1) 53.6(13.5) 0.9(0.02)
Table 1. Sampling data, distribution and diversity of OTUs (97% cutoff, subsampled). Data shown is derived from 3 individual biological replicates for each time-point except Day 1 Morning where as a consequence of sequencing error, only two biological replicates were used. Standard deviation in parenthesis.

www.nature.com/scientificreports/
5Scientific RepoRts | 7:40189 | DOI: 10.1038/srep40189
Figure 3. Color-coded bar plot showing the average bacterial phylum distribution in Namib Desert soil over five diel cycles. These patterns are overlayed with climatic data to give an adequate representation of temporal fluctuations within the bacterial groups present.
Figure 4. Venn diagram representing the percentage dispersal of bacterial OTUs. The data was resampled to lowest level (> 14,000 sequences, 1688 OTUs0.03) between time-points. The number of reads are in parenthesis.
www.nature.com/scientificreports/
6Scientific RepoRts | 7:40189 | DOI: 10.1038/srep40189
Proteobacteria exhibited differential responses over diel cycles (Fig. 3; Fig. S3), with a strong negative correla-tion between their respective relative abundances (Pearson; − 0.069, P < 0.01). The former exhibited a significant reduction in relative abundance from Morning to Night (ANOVA; (F2,44 = 5.229, P = 0.009) with a consistent pattern between days (P = 0.13). The diel patterns of sub-phylum phylogenetic groups generally reflected that at phylum level (Fig. S7). There were certain exceptions, however, with the Micrococcales order of the Actinobacteria class recording an increase from Morning to Night (Figure S7b). Within the phylum Proteobacteria, both β - and δ -Proteobacteria occurred consistently at relatively low abundance (< 4% each) while γ -Proteobacteria showed a consistent increase in relative abundance from Morning to Night samples (Figure S7a), which was primarily attributed to the order Pseudomonadales (Figure S7b). Furthermore, the increased abundance of Cyanobacteria in Night samples could be primarily attributed to the order Nostocales (Figure S7b), which displayed a > 6-fold increase from Morning to Night samples on day 3. The Nostocales group are crucial in maintaining soil N budgets through N2-fixation64, suggesting a capacity for active nitrogen cycling within this desert soil system that may be governed by temporal cues. No other phyla showed major or consistent abundance changes between time-points, although Armatimonadetes, Bacteroidetes and Planctomycetes were found to be statistically different between days (ANOVA, P < 0.05).
Influence of abiotic factors on desert soil bacterial community structure. In order to probe the drivers of fine-scale bacterial population dynamics, we tested the possible effects of environmental factors on the bacterial community composition for all samples.
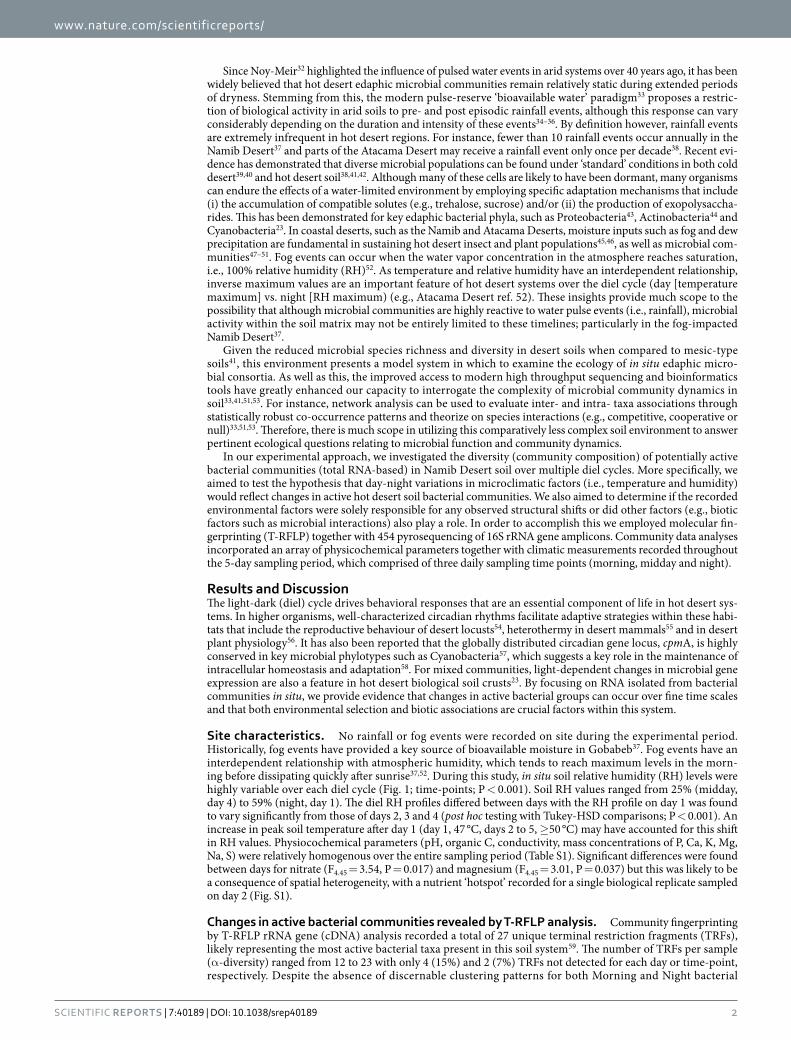
Multiple rank correlations (Spearman; global ‘BEST’ test) indicated that the abiotic parameters measured could not account satisfactorily for bacterial composition over time (P = 0.62, 99 permutations). Re-analysis of individual parameters using linear-constrained ordination redundancy analysis (RDA) with forward selection revealed that, for the physical and chemical parameters, climatic factors (temperature, F = 1.981, P = 0.02; RH, F = 1.338, P = 0.043) together with soil phosphorus content (F = 1.373, P = 0.039) had a significant influence on community composition (Fig. 5). However, these parameters only accounted for 10.5% of the total variation, sug-gesting that other factors were important in driving the community dynamics recorded in this study.
The extent of individual environmental variables on taxon distribution was also tested by Spearman correla-tions. Actinobacteria, Acidimicrobiales, Solibrobacterales and both β - and γ - Proteobacteria had strong correlations with soil temperature and %RH, while soil phosphorus content was positively correlated with the Rhizobiales, Rhodospirillales (α -Proteobacteria) and Chroococcales (Cyanobacteria) orders (P < 0.05). Interestingly, two orders of Cyanobacteria, the Nostocales and Oscillatoriales, were also positively correlated with nitrogen elements (NH4
+ and NO3
−) (P < 0.05). The finding that Nostocales group were positively correlated with nitrogen elements further enhances our view that this group may be key in driving N2-fixation within this desert soil system.
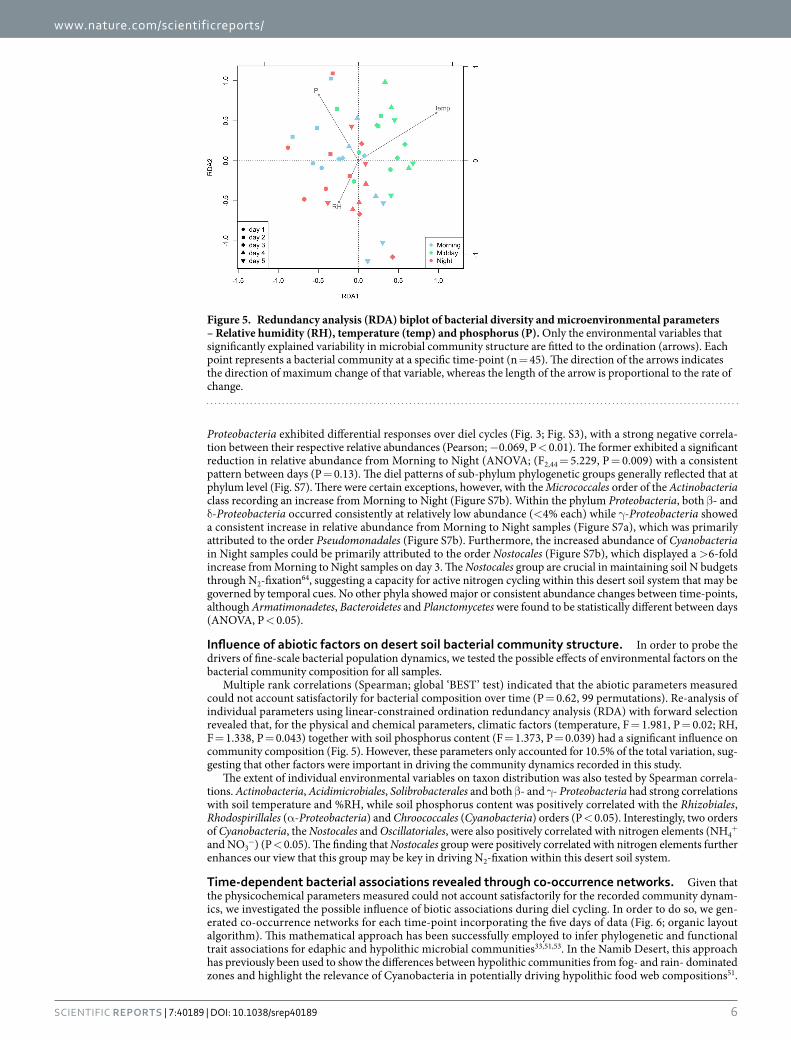
Time-dependent bacterial associations revealed through co-occurrence networks. Given that the physicochemical parameters measured could not account satisfactorily for the recorded community dynam-ics, we investigated the possible influence of biotic associations during diel cycling. In order to do so, we gen-erated co-occurrence networks for each time-point incorporating the five days of data (Fig. 6; organic layout algorithm). This mathematical approach has been successfully employed to infer phylogenetic and functional trait associations for edaphic and hypolithic microbial communities33,51,53. In the Namib Desert, this approach has previously been used to show the differences between hypolithic communities from fog- and rain- dominated zones and highlight the relevance of Cyanobacteria in potentially driving hypolithic food web compositions51.
Figure 5. Redundancy analysis (RDA) biplot of bacterial diversity and microenvironmental parameters – Relative humidity (RH), temperature (temp) and phosphorus (P). Only the environmental variables that significantly explained variability in microbial community structure are fitted to the ordination (arrows). Each point represents a bacterial community at a specific time-point (n = 45). The direction of the arrows indicates the direction of maximum change of that variable, whereas the length of the arrow is proportional to the rate of change.

www.nature.com/scientificreports/
7Scientific RepoRts | 7:40189 | DOI: 10.1038/srep40189
The networks presented in Fig. 6 comprised the most dominant fraction of the core community; i.e., the 100 most abundant and consistently detected OTUs (84% of total reads). Although present in all soil samples, this core group exhibited a reproducible non-random co-occurrence pattern against the null model at each time-point (Average C-score 63.51, P ≤ 0.001). Interestingly, the average path length (distance between all pairs of nodes), clustering and topological (tendency of nodes to share neighbors) coefficients were different for each network (Table 2), indicating that the system was interactive and dynamic (average of > 5 edges [associations] per node [OTU] for each network)53,65. A level of structural homology was also evident as a primary group of nodes (module) formed a highly clustered topology at each time point; i.e., with a ‘neighborhood connectivity’ (NC, which corresponds to the number of connections between neighboring OTUs) over 7. Globally, the Midday network recorded a considerably higher NC value (6.38) when compared to the Morning (5.1) and Night net-works (5.24) (Table 2). When attempting to understand the recorded patterns recorded here it is important to note that co-correlation is not necessarily indicative of biotic interactions. Indeed, the recorded patterns relating to midday community dynamics may be due to these bacterial groups responding to the variability in environ-mental cues (e.g., temperature) in a similar way, which would appear as co-correlation. However, modularity in community ecology can also reflect functional associations with physical contact and/or phylogenetic clustering of closely related species66, which has been reported to have a possible role in negating the effects of high temper-atures disturbance67. Given the extreme temperature conditions associated with the Midday soil habitat in this system (up to 52 °C on day 2; Fig. 1), there is a likelihood that metabolic and/or functional associations could occur between adjacent temperature-tolerant bacterial taxa such as the capacity to metabolise substrates not accessible to non-thermophilic microbial communities68. Interestingly, Actinobacteria inter-phyla co-occurrence patterns (represented by OTUs with at least 2 connections) peaked at Midday (57%), the majority of which were positive (Table S3). Many of the positive associations within the primary module were between closely related
Figure 6. Networks (organic layout algorithm) showing the interactions between the top 100 OTUs potentially active over the diel cycle. Each node (circle) in the network symbolizes a unique OTU at the 90% threshold (family level) and the size relates to the mean relative abundance within that network directly derived from the related read counts. Each edge (connection) relates to a strong (Spearman’s ρ > 0.6) and significant (P-value < 0.01) correlation. The OTUs are numbered in accordance with overall relative abundance.
Total number of correlations (+/−)
Neighbourhood connectivitya
Shortest path lengthb
Clustering coefficient (Cn)c
Topological coefficientd
Morning 375 (328/47) 5.1 3.41 0.28 0.31
Midday 488 (297/191) 6.38 3.23 0.26 0.3
Night 393 (313/80) 5.24 3.25 0.25 0.28
Table 2. Network parameters for morning, midday and night bacterial communities. aConnectivity rate between OTUs (edges). bLength of shortest path between all OTUs. cRatio of N/M, where N is number of connections between neighbors of each OTU, and M is the maximum number of connections possible between the neighbors of each OTU. dRelative measurement for level to which each OTU shared neighbors with other OTUs. a–dEach value is the mean of all OTUs0.1 (n = 100) analysed.
www.nature.com/scientificreports/
8Scientific RepoRts | 7:40189 | DOI: 10.1038/srep40189
radiotolerant phylotypes such as Patulibacter (OTU2) and Solirubrobacter (OTU5)42 (Fig. 6). This high degree of modularity incorporating similar phylotypes may partly explain the community divergence between Midday and the other time-points. Interestingly, Proteobacteria-affiliated OTUs exhibited the lowest level of intra-phyla co-occurrence (both positive and negative) at Midday (21%), being 2.3- and 2.2-fold lower than the Morning and Night networks, respectively, which suggest that proteobacterial taxa are more involved in multi-trophic associ-ations during daytime habitat conditions.
The majority of Cyanobacteria OTUs were located externally to the primary module for each network (Fig. 6). Considering the physiological distinction between the photoautotrophic Cyanobacteria and the heterotrophic Actinobacteria and Proteobacteria, differences in co- occurrence profiles at different times of the diel cycle may be an indication of very fine time-scale niche partitioning69. Alternatively, these Cyanobacteria driven tertiary con-nections may function as inter-module hubs51, such as in the Midday network, where Cyanobacteria nodes linked the core module with a submodule that comprised a highly abundant Proteobacteria OTU (Fig. 6). Furthermore, a highly abundant (4% of morning reads), highly associated (7 connections; 6 positive/1 negative) Cyanobacteria OTU assigned to the order Oscillatoriales was positioned as a module hub in the Morning network, with strong inter-phyla positive co-occurrence, which is indicative of mutualistic associations. Interestingly, this module was comprised of taxonomically unique groups (distinct at class level), which may provide evidence of naturaliza-tion70, a concept, which suggests that co-occurring species are likely to be metabolically dissimilar so as to reduce the risk of competitive exclusion. The influence of Cyanobacteria OTUs as modular hubs was not recorded for the Midday and Night networks. Even low abundance phyla exhibited a high level of co-occurrence. For example, Acidobacteria (class Holophagae) only had a single representative in the core community but had 25 significant correlations (mostly positive), the majority of these being with much higher abundance OTUs in the Morning dataset (Fig. 6; Table S3). Acidobacteria are ubiquitous as K-strategists in edaphic niches characterized by low plant-derived carbon sources and generally more oligotrophic niches71,72. Although the functional relevance of this phylum remains unclear, the high rate of inter-phyla co-occurrence would suggest a pivotal role in edaphic processes within this hot desert soil system, with low relative abundance recorded here possibly due to an under-estimation of taxa with low 16S rRNA copy numbers per genome such as Acidobacteria73.
Overall, our results clearly demonstrate that significant changes in the active fraction of Namib Desert soil bacterial communities can occur within a single day, with this study being the first to provide direct evidence of short temporal changes in undisturbed hot desert soil communities. Furthermore, we have shown that these changes are not primarily governed by abiotic factors (i.e., physicochemical variables and climatic regime) as proposed by our leading hypothesis, and that distinct microbial interactions may be important in the recorded community dynamics. The bacterial co-occurrence matrices presented here are intriguing and provide an initial glimpse of potential trait associations and mechanisms driving community organization within this system. For instance, phylogenetic clustering of desert soil bacteria can be influenced by the filtering of traits over fine-time scales, which may confer resistance to abiotic stress or competitive exclusion (e.g., high temperature resistant phylotypes; Midday function). With previous investigations focusing on refuge niche habitats as the ‘core hubs’ of microbial function and diversity in desert systems63,74–77, these findings are all the more striking and have implica-tions for future desert soil research. Incorporation of additional meta-omics approaches such as metaproteomics as well as measuring photosynthetically available radiation (PAR) would be beneficial in resolving the findings recorded in this study.
Experimental Procedures. Site description and sample collection. Sampling was performed between 22 and 26 April 2013 at a single undisturbed gravel-plain site (10 × 10 m quadrat; Fig. 1) adjacent to the Gobabeb Research and Training Centre, Namibia (23°33′ S, 15°02′ E). This region is classified as hyper-arid8,37 with low mean annual precipitation (< 30 mm) and receives much of its moisture via fog events37.
In order to limit sampling bias and to ensure sampling homogeneity, the site was divided into a series of quad-rats (x16; 2.5 × 2.5 m), which were further subdivided into four mini-quadrats (1 m2). Eight surface (0–5 cm) pseudo-replicate soil samples were recovered and pooled from three randomly selected (RAND()*N function in Microsoft excel) mini-quadrats at time-points reflecting the diel cycle – morning (6 am), midday (1 pm) and night (8 pm) over a 5-day period (n = 45). Each soil sample (~10 g) was supplemented with 5 ml of RNAlater (Sigma-Aldrich, Copenhagen, Denmark) and stored at − 80 °C for later molecular analysis. For physicochemical analyses, ~200 g of soil was taken from each sampling zone and stored in sterile Whirlpak® bags at 4 °C.
Climatic data and soil physicochemical analysis. Temperature (°C) and relative humidity (%RH) readings were recorded at 30 min intervals for the 5-day period using Hygrochron iButton temperature and humidity loggers (model DS1923; Embedded Data Systems, Lawrenceburg, KY, USA). These were placed at a depth of 2 cm at the center of each 2.5 m2 quadrat (16 in total). Physicochemical analyses were conducted at the Soil Science Laboratory of the University of Pretoria (South Africa) using standard quality control procedures78. Soil sam-ples were sieved (2 mm) prior to analysis. Total organic carbon (%) was determined by a dichromate oxida-tion procedure79. A correction factor of 1.32 was used to account for incomplete oxidation of organic C80. Ammonium (NH4
+) and nitrate (NO3−) ions were determined using steam distillation81. The P-bray method82,
with Inductively Coupled Plasma-Optical Emission Spectroscopy (ICP-OES) was used to determine total organic phosphorus. The cation exchange capacity (CEC) was determined by 0.2 M ammonium acetate treatment, with subsequent concentrations of Fe, Ca, K, Mg and Na determined by ICP-OES. Soil pH was measured using a slurry technique (1:2.5 w/w soil/deionised water ratio) with a calibrated pH meter (Crison basic 20, Barcelona, Spain). The soil texture was determined by a fluid suspension method using a specialized hydrometer, based on Stokes’ law of particle dispersal83.

www.nature.com/scientificreports/
9Scientific RepoRts | 7:40189 | DOI: 10.1038/srep40189
RNA isolation and bacterial community fingerprinting analysis. Total RNA was recovered from desert soil samples using an modified phenol-chloroform extraction technique84 with quantification using a Nanodrop 1000 spectrophotometer (NanoDrop Products, Wilmington, DE, USA). RNA preparations were treated with RQ1 RNase-Free (Promega) to remove contaminating DNA, with subsequent purification (RNeasy; Qiagen, GmbH, Hilden, Germany) and reverse transcription (Supersript® III first strand synthesis; Invitrogen). Bacterial T-RFLP analysis of the cDNA products was done using 16S rRNA gene PCR primers 341 F (5′-FAM-CCTACGGGAGGCAGCAG-3′ ) and 908 R (5′ -CCGTCAATTCCTTTRAGTTT-3′ )84. Thermal cycling conditions were 94 °C for 5 min; 30 cycles of 94 °C for 30S, 55 °C for 20 s and 72 °C for 105 s; 72 °C for 10 min. Each 50 μ l T-RFLP reaction comprised 1X DreamTaqTM reaction buffer (Fermentas, USA), 0.1 mM dNTPs, 20 mg.ml−1 bovine serum albumin, 0.5 μ M of each primer, 2 U of DreamTaqTM polymerase (Fermentas, USA) and 10 ng of template DNA or cDNA. The resulting PCR products were purified using the NucleoSpin® Kit (Macherey-Nagel, Gmbh & Co. KG, Düren, Germany), with 200 ng digested (normalized spectrophotometri-cally; Nanodrop 1000) using 1 U HaeIII in 2× restriction enzyme buffer (Fermentas, USA) at 37 °C overnight with an additional purification step using the NucleoSpin® Kit. Separation of restriction fragments was achieved by capillary electrophoresis using an ABI 3130XL Genetic Analyzer (Applied Biosystems, Foster City, CA, USA) with the LIZ® 600 Size Standard. The resulting fragment profiles were exported and analyzed using Peak Scanner 1.0 (Applied Biosystems) with the default 5RFU cutoff. In order to eliminate any inaccuracies in the data, true peaks and fragments of similar size were identified and binned using the software R and Perl85, Fragment lengths within 1 bp of each other were considered to be the same operational taxonomic unit (OTU) and peaks within 3 standard deviation of the noise baseline were removed. A matrix of the T-RFLP community fingerprint patterns (‘ClusBinMatrix’) for the relative abundance (area under the peak) of individual OTUs for each soil sample was generated for subsequent analysis.
454 Pyrosequencing of PCR amplicons. Bacterial community composition was estimated by bacterial tag-encoded FLX amplicon pyrosequencing (bTE-FAP) using the GS FLX titanium-sequencing platform accord-ing to MR DNA protocols (www.mrdnalab.com). Briefly, PCR amplicons spanning the hypervariable regions V1-V3 of the bacterial 16S rRNA gene were generated from each cDNA sample (n = 45) using the primer pair 27 F/519R86, with unique multiplex identification tags (error corrected MIDs or ‘barcodes’) added to the primers for each sample. A single-step 30 cycle PCR using HotStarTaq Plus Master Mix Kit (Qiagen, Valencia, CA) was used under the following conditions: 94 °C for 3 minutes, 28 cycles of 94 °C for 30 seconds; 53 °C for 40 seconds and 72 °C for 1 minute; followed by an final elongation step at 72 °C for 5 minutes. The PCR amplicons were then purified using Agencourt Ampure beads (Agencourt Bioscience Corporation, MA, USA) and sequenced utilizing a Roche 454 FLX Titanium NG sequencing platform (Molecular Research LP, Shallowater, Texas). The pyrosequencing flograms were derived from the original SFF files and analyzed using a pre-established pipeline in MOTHUR (version 1.33.3)87. A stringent approach to this analysis was used, with no primer and barcode sequence mismatches permitted. Errors in sequencing were reduced by the trim.flows and shhh.flows commands, the latter incorporating an implementation of PyroNoise88 that uses the expectation-maximization algorithm. Sequences with ambiguities and/or shorter than 200 bps were removed. After configuring the data to comprise unique sequences, further de-noising was done using the ‘pre.cluster’ command, which employs a pseudo-single linkage algorithm to remove sequences likely due to pyrosequencing errors89.
Finally, the sequences were checked for PCR chimeras using the chimera.slayer command90. Aligned sequences were used to construct distance matrices and to cluster the sequences into operational taxonomic units (OTUs) at the 97% (species level) and 90% (family level) cutoffs in MOTHUR. Bacterial sequences were classified using CREST91 with the Silvamod database and MEGAN with LCA parameters min bit score 250, top percent 2 (50 best blast hits). Rank abundance data were generated for all samples with rarefaction curves and other population diversity indices (for example, Chao1, Shannon evenness) calculated in MOTHUR after we rarefied the species richness to the same number of individuals to ensure sequence consistency between samples92. Venn diagrams for days and time-points were generated using the R statistical package (v.2.14.0)93.
The SFF file containing the sequence data is available at the NCBI Sequence Read Archive under the accession number PRJNA253979.
Data analysis. All statistical analyses were carried out using R, including functions from the vegan package (version 2.0-9). For T-RFLP and pyrosequencing analysis, the dependent variables, day (i.e., day 1, day 2, day 3, day 4 and day 5) and time-point (i.e., morning, midday and night) were treated as fixed factors. QQ-plots and frequency histograms indicated that residuals did not meet the assumptions required for parametric tests94. Therefore, independent variables (x) (i.e., all soil parameters and all community data) were transformed accord-ing to ln (x + 1).
Linear models were used to determine significance between both days and time-points for the different soil parameters (lm function). T-RFLP and pyrosequencing community profiles (employing Hellinger transforma-tion) were visualized using non-metric multidimensional scaling (nMDS) analyses (meta.mds function) using the Bray-Curtis dissimilarity metrics. In order to test for significant differences in bacterial composition between samples, permutational multivariate analysis of variance (PERMANOVA) was used with either day (day 1, day 2, day 3, day 4, day 5) or time-point (morning/midday/night) used as factors (Adonis function). We also tested for an interaction effect between days and time-points (model; day*time). In order to determine which experimental groups were distinguishable, post hoc Tukey tests were used for pairwise comparisons. In order to test the influ-ence of abiotic factors on variations within bacterial community structure, Biota Environment STepwise matching (global ‘BEST’ test) in the Primer6 statistical package (Primer-E Ltd, UK)95 was undertaken. The soil physic-ochemical data was standardized. Spearman rank correlations between the abiotic variables and the bacterial

www.nature.com/scientificreports/
1 0Scientific RepoRts | 7:40189 | DOI: 10.1038/srep40189
communities were then calculated over the sampling period (99 permutations). Redundancy analysis (RDA; rda function) with forward selection was used to evaluate the effects of the environment on community composition.
Co-occurrence networks were generated comprising consistently detected and highly abundant OTUs; i.e., the ‘core’ community. Non-random co-occurrence patterns were first tested with the checkerboard score (C-score) under the null hypothesis of random community assembly96, where 5,000 matrices were randomly generated from the 16SrRNA gene data (oecosimu function with nestedchecker in bipartite package). All possible Spearman rank correlations between OTUs were then calculated with stringent parameters set (interaction between OTUs valid if > 0.6 value for Spearman’s correlation coefficient [ρ ] and P-value < 0.01) as previously described53. A graphical representation of the filtered dataset was prepared using Cytoscape97. The nodes in the constructed net-work represented OTUs with the edges (connections) indicating significant inter-nodal correlations. Topological coefficients of the resulting networks were then calculated in order to derive comparisons, which included aver-age node connectivity, average path lengths, cumulative degree distribution and clustering coefficients.
References1. Thibault, K. M. & Brown, J. H. Impact of an extreme climatic event on community assembly. Proc. Natl. Acad. Sci. USA 109,
3410–3415 (2008).2. Lavergne, S., Mouquet, N., Thuiller, W. & Ronce, O. Biodiversity and climate change: Integrating evolutionary and ecological
responses of species and communities. Ecol. Evol. Sys. 4, 321–50 (2010).3. Nørgaard, T. & Dacke, M. Fog-basking behaviour and water collection efficiency in Namib Desert Darkling beetles. Front. Zool. 7,
23 (2010).4. Eppel, A., Shaked, R., Eshel, G., Barek, S. & Rachmilevitch, S. Low induction of non-photochemical quenching and high
photochemical efficiency in the annual desert plant Anastatica hierochuntica. Phys. Plantarum 151, 544–558 (2014).5. Ma, T. et al. Genomic insights into salt adaptation in a desert poplar. Nat Comm. 4, 2797 (2014).6. Andrew, D. R. et al. Abiotic factors shape microbial diversity in Sonoran Desert soils. Appl. Environ. Microbiol. 78, 7527–7537
(2012).7. Pointing, B. & Belnap, J. Microbial colonization and controls in dryland systems. Nat. Rev. 10, 551–562 (2012).8. Makhalanyane, T. P. et al. Microbial ecology of hot desert edaphic systems. FEMS Microbiol. Rev. 39, 203–221 (2015).9. IPCC, Climate Change 2013. The Physical Science Basis. Contribution of Working Group I to the Fifth Assessment Report of the
Intergovernmental Panel on Climate Change (Cambridge University Press, 2013).10. Bell, C. W. et al. Soil microbial and nutrient responses to 7 years of seasonally altered precipitation in a Chihuahuan Desert
grassland. Glob. Change. Biol. 20, 1657–1673 (2014).11. Cheng, X. et al. Summer rain pulse size and rainwater uptake by three dominant desert plants in a desertified grassland ecosystem
in northwestern China. Plant. Ecol. 184, 1–12 (2006).12. Nano, C. E. M. & Pavey, C. R. Refining the ‘pulse-reserve’ model for arid central Australia, Seasonal rainfall, soil moisture and plant
productivity in sand ridge and stony plain habitats of the Simpson Desert. Aust. Ecol. 38, 741–753 (2013).13. Dong, X., Grimm, N. B., Ogle, K. & Franklin, J. Temporal variability in hydrology modifies the influence of geomorphology on
wetland distribution along a desert stream. J. Ecol. 104, 31–32 (2015).14. Bowker, M. A., Reed, S. C., Belnap, S. L. & Phillips, S. L. Temporal variation in community composition, pigmentation, and Fv/Fm
of desert cyanobacterial soil crusts. Micro. Ecol. 43, 13–25 (2002).15. Clark, J. S., Campbell, J. H., Grizzle, H., Acosta-Martinez, V. & Zak, J. C. Soil microbial community response to drought and
precipitation variability in the Chihuahuan Desert. Micro. Ecol. 57, 248–260 (2009).16. Pasternak, Z. et al. Spatial and temporal biogeography of soil microbial communities in arid and semiarid regions. PloS One. 8,
e69705 (2013).17. Saul-Tcherkas, V., Unc, A. & Steinberger, Y. Soil microbial diversity in the vicinity of desert shrubs. Micro. Ecol. 65, 689–699 (2013).18. Manzoni, S., Schimel, J. P. & Porporato, A. Responses of soil microbial communities to water stress, results from a meta-analysis.
Ecology. 93, 930–938 (2012).19. Frossard, A., Gerull, L., Mutz, M. & Gessner, M. O. Disconnect of microbial structure and function, enzyme activities and bacterial
communities in nascent stream corridors. ISME J. 6, 680–691 (2012).20. Nielsen, U. N. & Ball, B. A. Impacts of altered precipitation regimes on soil communities and biogeochemistry in arid and semi arid
ecosystems. Glob. Change Biol. 21, 1407–1421 (2015).21. Fierer, N. & Jackson, R. B. The diversity and biogeography of soil bacterial communities. Proc. Natl. Acad. Sci. USA 103, 626–631
(2006).22. Wang, J. et al. Phylogenetic beta diversity in bacterial assemblages across ecosystems, deterministic versus stochastic processes.
ISME J. 7, 1310–1321 (2013).23. Rajeev, L. et al. Dynamic cyanobacterial response to hydration and dehydration in a desert biological soil crust. ISME J. 7, 2178–2191
(2013).24. Wang, W., Wang, Y., Shu, X. & Zhang, Q. Physiological responses of soil crust-forming Cyanobacteria to diurnal temperature
variation. J. Bas. Micro. 53, 72–80 (2013).25. Zhang, N., Xia, J., Yu, X., Ma, K. & Wan, S. Soil microbial community changes and their linkages with ecosystem carbon exchange
under asymmetrically diurnal warming. Soil. Biol. Biochem. 43, 2053–2059 (2011).26. Ma, J., Wang, Z.-Y., Stevenson, B. A., Zheng, X.-J. & Li, Y. An inorganic CO2 diffusion and dissolution process explains negative CO2
fluxes in saline/alkaline soils. Sci. Rep. 3, 2025 (2013).27. Feng, W. et al. Impact of environmental factors and biological soil crust types on soil respiration in a desert ecosystem. PloS One 9,
e102954 (2014).28. Wang, B. et al. Soil moisture modifies the response of soil respiration to temperature in a desert shrub ecosystem. Biogeosciences 11,
259–268 (2014).29. Beier, C. et al. Carbon and nitrogen cycles in European ecosystems respond differently to global warming. Sci. Tot. Environ. 407,
692–697 (2008).30. Xia, J. Y., Niu, S. L. & Wan, S. Q. Response of ecosystem carbon exchange to warming and nitrogen addition during two
climatologically contrasting growing seasons in a temperate steppe. Glob. Chan. Biol. 15, 1544–1556 (2009).31. Su, H., Feng, J., Axmacher, J. C. & Sang, W. Asymmetric warming significantly affects net primary production, but not ecosystem
carbon balances of forest and grassland ecosystems in northern China. Sci. Rep. 5, 9115 (2015).32. Noy-Meir, I. Desert ecosystems. I. Environment and producers. Ann. Rev. Ecol. Sys. 4, 25–52 (1973).33. Angel, R. & Conrad, R. Elucidating the microbial resuscitation cascade in biological soil crusts following a simulated rain event.
Environ. Microbiol. 15, 2799–2815 (2013).34. Belnap, J., Welter, J. R., Grimm, N. B., Barger, N. & Ludwigm, J. A. Linkages between microbial and hydrological processes in arid
and semiarid watersheds. Ecology 86, 298–307 (2005).35. Collins, S. L. et al. Pulse dynamics and microbial processes in arid land ecosystems. J. Ecol. 96, 413–420 (2008).
www.nature.com/scientificreports/
1 1Scientific RepoRts | 7:40189 | DOI: 10.1038/srep40189
36. Frossard, A., Ramond, J.-B., Seely, M. & Cowan, D. A. Water regime history drives responses of soil Namib Desert microbial communities to wetting events. Sci. Rep. 5, 12263 (2015).
37. Eckardt, F. D. et al. The nature of moisture at Gobabeb, in the central Namib Desert. J. Arid. Environ. 93, 7–19 (2013).38. Crits-Christoph, A. et al. Colonization patterns of soil microbial communities in the Atacama Desert. Microbiome 1, 28 (2013).39. Smith, J. J., Tow, L. A., Stafford, W., Cary, C. & Cowan, D. A. Bacterial diversity in three different Antarctic cold desert mineral soils.
Micro. Ecol. 51, 413–421 (2006).40. Lee, C. K., Barbier, B. A., Bottos, E. M., McDonald, I. R. & Cary, S. C. The Inter-Valley Soil Comparative Survey, the ecology of Dry
Valley edaphic microbial communities. ISME J. 6, 1046–1057 (2012).41. Fierer, N. et al. Cross-biome metagenomic analyses of soil microbial communities and their functional attributes. Proc. Natl. Acad.
Sci. USA 109, 21390–21395 (2012).42. Neilson, J. W. et al. Life at the hyperarid margin, novel bacterial diversity in arid soils of the Atacama Desert, Chile. Extremophiles
16, 553–566 (2012).43. Fernandez-Aunión, C. et al. Biosynthesis of compatible solutes in rhizobial strains isolated from Phaseolus vulgaris nodules in
Tunisian fields. BMC Microbiol. 10, 192 (2010).44. LeBlanc, J. C., Gonçalves, E. R. & Mohn, W. W. Global response to desiccation stress in the soil Actinomycete Rhodococcus jostii
RHA1. App. Environ. Microbiol. 74, 2627–2636 (2008).45. Seely, M. K. & Hamilton, W. J. Fog catchment sand trenches constructed by tenebrionid beetles, Lepidochora, from the Namib
Desert. Science 193, 484–486 (1976).46. Ebner, M. E. M., Miranda, T. & Roth-Nebelsick, A. Efficient fog harvesting by Stipagrostis sabulicola (Namib dune bushman grass).
J. Arid. Environ. 75, 524–531 (2011).47. Warren-Rhodes, K. A. et al. Hypolithic Cyanobacteria, Dry Limit of Photosynthesis, and Microbial Ecology in the Hyperarid
Atacama Desert. Micro. Ecol. 52, 389–398 (2006).48. Azúa-Bustos, A. et al. Hypolithic Cyanobacteria supported mainly by fog in the coastal range of the Atacama Desert. Microb. Ecol.
61, 568–581 (2011).49. Stomeo, F. et al. Hypolithic and soil microbial community assembly along an aridity gradient in the Namib Desert. Extremophiles 17,
329–337 (2013).50. Warren-Rhodes, K. A. et al. Physical ecology of hypolithic communities in the central Namib Desert, The role of fog, rain, rock
habitat, and light. J. Geophys. Res. 118, 1451–1460 (2013).51. Valverde, A., Makhalanyane, T. P., Seely, M. & Cowan, D. A. Cyanobacteria drive community composition and functionality in
rock–soil interface communities. Mol. Ecol. 24, 812–821 (2015).52. Cáceres, L. et al. Relative humidity patterns and fog water precipitation in the Atacama Desert and biological implications. J. Geophy.
Res. 112, G4 (2007).53. Barberán, A., Bates, S. T., Casamayor, E. O. & Fierer, N. Using network analysis to explore co-occurrence patterns in soil microbial
communities. ISME J. 6, 343–351 (2012).54. Tobback, J., Boerjan, B., Vandersmissen, H. P. & Huybrechts, R. The circadian clock genes affect reproductive capacity in the desert
locust Schistocerca gregaria. Insect Biochem. Mol. Biol. 41, 313–321 (2011).55. Walsberg, G. Small mammals in hot deserts, some generalizations revisited. Biosci. 50, 109–120 (2000).56. Nilsen, E. T., Sharifi, M. R., Rundel, P. W., Jarrell, W. M. & Virginia, R. A. Diurnal and seasonal water relations of the desert
phreatophyte Prosopis glanulosa (Honey Mesquite) in the Sonoran Desert of California. Ecology 64, 1381–1393 (1983).57. Dvornyk, V. & Jahan, A. S. Extreme conservation and non-neutral evolution of the cpmA circadian locus in a globally distributed
Chroococcidiopsis sp. from naturally stressful habitats. Mol. Biol. Evol. 29, 3899–3907 (2012).58. Johnson, C. H. Testing the adaptive value of circadian systems. Meth. Enzymol. 393, 818–837 (2005).59. Saikaly, P. E., Stroot, P. G. & Oether, D. B. Use of 16S rRNA gene terminal restriction fragment analysis to assess the impact of solids
retention time on the bacterial diversity of activated sludge. Appl. Environ. Micro. 71, 5814–5822 (2005).60. Lynch, M. D. J. & Neufeld, J. D. Ecology and exploration of the rare biosphere. Nat. Rev. Microbiol. 13, 217–229 (2015).61. Janssen, P. H. Identifying the Dominant Soil Bacterial Taxa in Libraries of 16S rRNA and 16S rRNA Genes. Appl. Environ. Microbiol.
72, 1719–1728 (2006).62. Connon, S. A., Lester, E. D., Shafaat, H. S., Obenhuber, D. C. & Ponce, A. Bacterial diversity in hyperarid Atacama Desert soils. J.
Geophy. Res. 112, G4 (2007).63. Makhalanyane, T. P. et al. Evidence of species recruitment and development of hot desert hypolithic communities. Environ.
Microbiol. Rep. 5, 219–224 (2013).64. Boison, G., Mergel, A., Jolkver, H. & Bothe, H. Bacterial life and dinitrogen fixation at a gypsum rock. Appl. Environ. Microbiol. 70,
7070–7077 (2004).65. Kara, E. L., Hanson, P. C., Hu, Y. H., Winslow, L. & McMahon, K. D. A decade of seasonal dynamics and co-occurrences within
freshwater bacterioplankton communities from eutrophic Lake Mendota, WI, USA. ISME J. 7, 680–684 (2013).66. Olesen, J. M., Bascompte, J., Dupont, Y. L. & Jordano, P. The modularity of pollination networks. Proc. Natl. Acad. Sci. USA 104,
19891–19896 (2007).67. Ding, J. et al. Integrated metagenomics and network analysis of soil microbial community of the forest timberline. Sci. Rep. 5, 7994
(2015).68. Cong, J. et al. Analyses of soil microbial community compositions and functional genes reveal potential consequences of natural
forest succession. Sci. Rep. 5, 10007 (2015).69. Caruso, T. et al. Stochastic and deterministic processes interact in the assembly of desert microbial communities on a global scale.
ISME J. 5, 1406–1413 (2011).70. Zelezniak, A. et al. Metabolic dependencies drive species co-occurrence in diverse microbial communities. Proc. Natl. Acad. Sci.
USA 112, 6449–6454 (2015).71. Fierer, N. et al. Metagenomic and small-subunit rRNA analyses reveal the genetic diversity of bacteria, archaea, fungi, and viruses in
soil. Proc. Natl. Acad. Sci. USA 73, 7059–7066 (2007).72. Naether, A. et al. Environmental factors affect Acidobacterial communities below the subgroup level in grassland and forest soils.
Appl. Environ. Microbiol. 78, 7398–7406 (2012).73. Vétrovský, T. & Baldrian, P. The variability of the 16S rRNA gene in bacterial genomes and it’s consequences for bacterial community
analyses. PloS One 8, e57923 (2013).74. Chan, Y., Van Nostrand, J. D., Zhou, J., Pointing, S. B. & Farrell, R. L. Functional ecology of an Antarctic Dry Valley. Proc. Natl. Acad.
Sci. USA 110, 8990–8995 (2013).75. Garcia-Pichel, F., Lopez-Cortez, A. & Nubel, U. Phylogenetic and morphological diversity of Cyanobacteria in soil desert crusts from
the Colorado Plateau. Appl. Environ. Microbiol. 67, 1902–1910 (2001).76. Nagy, M. L., Perez, A. & Garcia-Pichel, F. The prokaryotic diversity of biological soil crusts in the Sonoran Desert. FEMS Microbiol.
Ecol. 54, 233–245 (2005).77. Lacap, D. C., Warren-Rhodes, K. A., McKay, C. P. & Pointing, S. B. Cyanobacteria and chloroflexi-dominated hypolithic colonization
of quartz at the hyper-arid core of the Atacama Desert, Chile. Extremophiles 15, 1–38 (2011).78. SSSA. Methods of soil analysis, Part 3. Soil Sci. Soc. America (1996).

www.nature.com/scientificreports/
1 2Scientific RepoRts | 7:40189 | DOI: 10.1038/srep40189
79. Nelson, D. W. & Sommers, L. E. Total carbon, organic carbon and organic matter. In Methods of soil analysis. Part 2 570–571. Am. Soc. Agron. (1982).
80. Liu, Z., Shao, M. & Wang, Y. Effect of environmental factors on regional soil organic carbon stocks across the Loess Plateau region, China. Agri. Ecosys. Environ. 142, 184–194 (2011).
81. Keeney, D. R. & Nelson, D. W. Nitrogen in organic forms. Pages 643–698 In A. L. Page et al. Eds. Methods of soil analysis. Part 2. Agronomy No. 9, Amer. Soc. Agron. (1982).
82. Bray, R. H. & Kurtz, L. T. Determination of total, organic, and available forms of phosphorus in soils. Soil. Sci. 59, 39–45 (1945).83. Tromp-van Meerveld, H. J. et al. Influence of sediment settling velocity on mechanistic soil erosion modeling. Wat. Resour. Res. 44,
6 (2008).84. Gunnigle, E., Ramond, J.-B., Frossard, A., Seely, M. & Cowan, D. A. A sequential co-extraction method for DNA, RNA and protein
recovery from soil for future system-based approaches. J. Microbiol. Meth. 103, 118–123 (2014).85. Abdo, Z. et al. Statistical methods for characterizing diversity of microbial communities by analysis of terminal restriction fragment
length polymorphisms of 16S rRNA genes. Environ. Microbiol. 8, 929–938 (2006).86. Mao, D. P., Zhou, Q., Chen, C. Y. & Quan, Z. X. Coverage evaluation of universal bacterial primers using the metagenomic datasets.
BMC Microbiol. 12, 66 (2012).87. Schloss, P. D. et al. Introducing mothur, open-source, platform-independent, community-supported software for describing and
comparing microbial communities. Appl. Environ. Micro. 75, 7537–7537 (2009).88. Quince, C., Lanzen, A., Davenport, R. J. & Turnbaugh, P. J. Removing noise from pyrosequenced amplicons. BMC Bioinform. 12, 38
(2011).89. Huse, S. M., Welch, D. M., Morrison, H. G. & Sogin, M. L. Ironing out the wrinkles in the rare biosphere through improved OTU
clustering. Environ. Microbiol. 12, 1889–1898 (2010).90. Haas, B. J. et al. Chimeric 16S rRNA sequence formation and detection in Sanger and 454-pyrosequenced PCR amplicons. Gen. Res.
21, 494–504 (2011).91. Lanzén, A. et al. CREST–Classification resources for environmental sequence tags. PloS ONE 7, e4933 (2012).92. Bengtsson, M. M., Sjøtun, K., Lanzén, A. & Øvreås, L. Bacterial diversity in relation to secondary production and succession on
surfaces of the kelp Laminaria hyperborean. ISME J. 6, 2188–2198 (2012).93. R. Core Team. R, a language and environment for statistical computing. Vienna, Austria, R Foundation for Statistical Computing,
Available from: http://www.R-project.org/ (2012).94. Frossard, A., Gerull, L., Mutz, M. & Gessner, M. O. Disconnect of microbial structure and function: enzyme activities and bacterial
communities in nascent stream corridors. ISME J. 6, 680–691 (2012).95. Clarke, K. R. & Gorley, R. N. PRIMER v6: user manual. Plymouth Marine Laboratory (2006).96. Caruso, T. et al. Stochastic and deterministic processes interact in the assembly of desert microbial communities on a global scale.
ISME J. 5, 1406–1413 (2011).97. Shannon, P. et al. Cytoscape: A software environment for integrated models of biomolecular interaction networks. Gen. Res. 13,
2498–2504 (2003).
AcknowledgementsThe authors gratefully acknowledge the National Research Foundation (South Africa), and the University of Pretoria Genomic Research Institute for financial support.
Author ContributionsE.G., A.F. and J.B.-R. conducted the research. E.G. wrote the manuscript with help from A.F., J.-B.R. and D.A.C., A.F. and L.G. contributed extensively to the experimental analysis of the pyrosequencing data. D.A.C. and M.S. provided resources, expertise and guidance during this research.
Additional InformationSupplementary information accompanies this paper at http://www.nature.com/srepCompeting financial interests: The authors declare no competing financial interests.How to cite this article: Gunnigle, E. et al. Diel-scale temporal dynamics recorded for bacterial groups in Namib Desert soil. Sci. Rep. 7, 40189; doi: 10.1038/srep40189 (2017).Publisher's note: Springer Nature remains neutral with regard to jurisdictional claims in published maps and institutional affiliations.
This work is licensed under a Creative Commons Attribution 4.0 International License. The images or other third party material in this article are included in the article’s Creative Commons license,
unless indicated otherwise in the credit line; if the material is not included under the Creative Commons license, users will need to obtain permission from the license holder to reproduce the material. To view a copy of this license, visit http://creativecommons.org/licenses/by/4.0/ © The Author(s) 2017