Did NAFTA Help Mexico? An Assessment After 20 Yearscepr.net/documents/nafta-20-years-2014-02.pdf ·...
23
February 2014 Mark Weisbrot is co-Director of the Center for Economic and Policy Research. Stephan Lefebvre is a research assistant and Joseph Sammut is an intern at CEPR. Did NAFTA Help Mexico? An Assessment After 20 Years By Mark Weisbrot, Stephan Lefebvre, and Joseph Sammut* Center for Economic and Policy Research 1611 Connecticut Ave. NW Suite 400 Washington, DC 20009 tel: 202-293-5380 fax: 202-588-1356 www.cepr.net
Transcript of Did NAFTA Help Mexico? An Assessment After 20 Yearscepr.net/documents/nafta-20-years-2014-02.pdf ·...
February 2014
Mark Weisbrot is co-Director of the Center for Economic and Policy Research. Stephan Lefebvre is a research assistant and Joseph Sammut is
an intern at CEPR.
Did NAFTA Help Mexico? An Assessment After 20 Years
By Mark Weisbrot, Stephan Lefebvre, and Joseph Sammut*
Center for Economic and Policy Research 1611 Connecticut Ave. NW Suite 400 Washington, DC 20009
tel: 202-293-5380 fax: 202-588-1356 www.cepr.net
Acknowledgements
The authors thank Jake Johnston for research assistance and Eileen O’Grady for editorial assistance.
Contents
Executive Summary ........................................................................................................................................... 1
Income and Growth .......................................................................................................................................... 4
Agriculture and Employment ......................................................................................................................... 13
Economic Policy and Mexican Integration With the United States Economy ...................................... 15
Conclusion ........................................................................................................................................................ 18
References ......................................................................................................................................................... 19
Did NAFTA Help Mexico?: An Assessment After 20 Years 1
Executive Summary It is now 20 years since NAFTA went into effect, bringing Mexico into a new commercial agreement with the United States and Canada. At the time it was argued, and forecast, that the agreement would boost Mexico’s growth and development. This paper compares the performance of the Mexican economy with that of the rest of the region over the past 20 years, based on the available economic and social indicators, and with its own past economic performance. Among the results:
Mexico ranks 18th of 20 Latin American countries in growth of real GDP per person, the
most basic economic measure of living standards.
From 1960-1980, Mexican real GDP per person almost doubled, growing by 98.7 percent. By comparison, in the past 20 years it has grown by just 18.6 percent.
Mexico’s per capita GDP growth of just 18.6 percent over the past 20 years is about half of the rate of growth achieved by the rest of Latin America.
If NAFTA had been successful in restoring Mexico’s pre-1980 growth rate – when developmentalist economic policies were the norm – Mexico today would be a relatively high income country, with income per person significantly higher than that of Portugal or Greece. It is unlikely that immigration reform would be a major political issue in the United States, since relatively few Mexicans would seek to cross the border.
According to Mexican national statistics, Mexico’s poverty rate of 52.3 percent in 2012 is almost identical to the poverty rate of 1994. As a result, there were 14.3 million more Mexicans living below the poverty line as of 2012 (the latest data available) than in 1994.
We can use the poverty statistics of the UN Economic Commission on Latin America (ECLAC) to compare Mexico’s poverty rate with the rest of Latin America. These statistics are computed differently and show a decline in poverty in Mexico. However, according to these measures, the rest of Latin America saw a drop in poverty that was more than two and a half times as much as that of Mexico: 20 percentage points (from 46 to 26 percent) for the rest of Latin America, versus 8 percentage points (from 45.1 to 37.1 percent) for Mexico.
Real (inflation-adjusted) wages for Mexico were almost the same in 2012 as in 1994, up just 2.3 percent over 18 years, and barely above their level of 1980.
Unemployment in Mexico is 5.0 percent today, as compared to an average of 3.1 percent for 1990-1994 and a low of 2.2 percent in 2000; these numbers seriously understate the true lack of jobs, but they show a significant deterioration in the labor market during the NAFTA years.
NAFTA also had a severe impact on agricultural employment, as U.S. subsidized corn and other products wiped out family farmers in Mexico. From 1991-2007, there were 4.9 million
Did NAFTA Help Mexico?: An Assessment After 20 Years 2
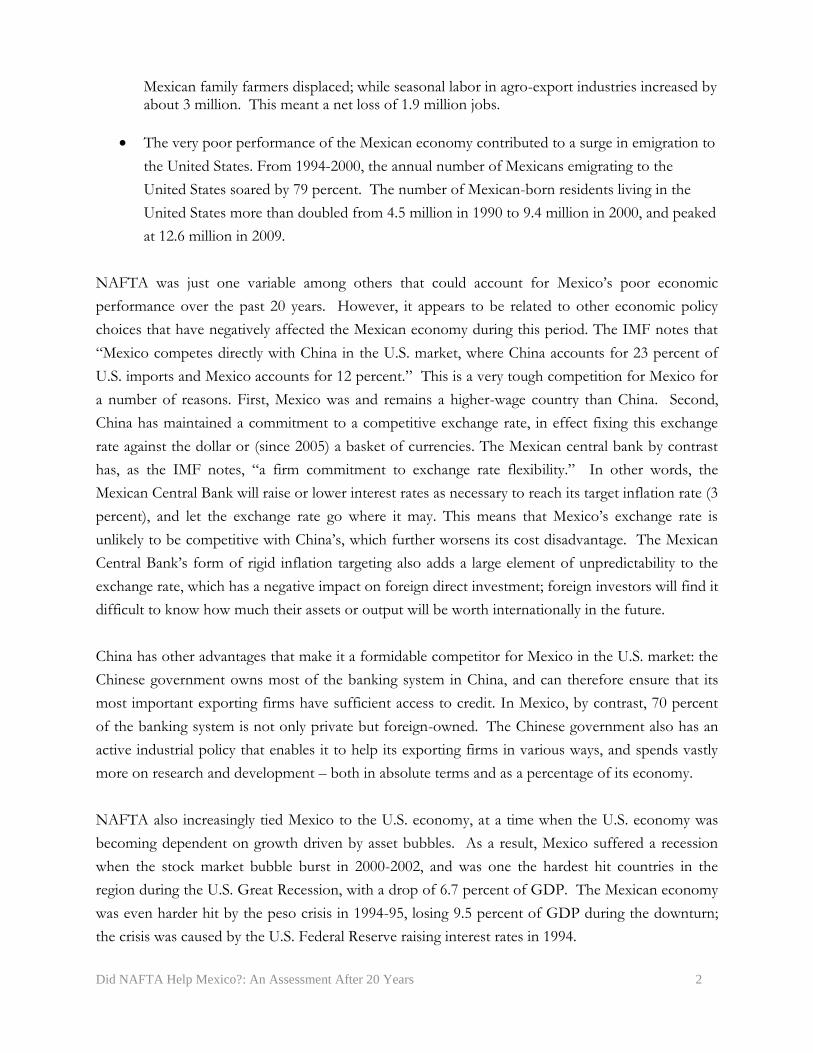
Mexican family farmers displaced; while seasonal labor in agro-export industries increased by about 3 million. This meant a net loss of 1.9 million jobs.
The very poor performance of the Mexican economy contributed to a surge in emigration to
the United States. From 1994-2000, the annual number of Mexicans emigrating to the
United States soared by 79 percent. The number of Mexican-born residents living in the
United States more than doubled from 4.5 million in 1990 to 9.4 million in 2000, and peaked
at 12.6 million in 2009.
NAFTA was just one variable among others that could account for Mexico’s poor economic
performance over the past 20 years. However, it appears to be related to other economic policy
choices that have negatively affected the Mexican economy during this period. The IMF notes that
“Mexico competes directly with China in the U.S. market, where China accounts for 23 percent of
U.S. imports and Mexico accounts for 12 percent.” This is a very tough competition for Mexico for
a number of reasons. First, Mexico was and remains a higher-wage country than China. Second,
China has maintained a commitment to a competitive exchange rate, in effect fixing this exchange
rate against the dollar or (since 2005) a basket of currencies. The Mexican central bank by contrast
has, as the IMF notes, “a firm commitment to exchange rate flexibility.” In other words, the
Mexican Central Bank will raise or lower interest rates as necessary to reach its target inflation rate (3
percent), and let the exchange rate go where it may. This means that Mexico’s exchange rate is
unlikely to be competitive with China’s, which further worsens its cost disadvantage. The Mexican
Central Bank’s form of rigid inflation targeting also adds a large element of unpredictability to the
exchange rate, which has a negative impact on foreign direct investment; foreign investors will find it
difficult to know how much their assets or output will be worth internationally in the future.
China has other advantages that make it a formidable competitor for Mexico in the U.S. market: the
Chinese government owns most of the banking system in China, and can therefore ensure that its
most important exporting firms have sufficient access to credit. In Mexico, by contrast, 70 percent
of the banking system is not only private but foreign-owned. The Chinese government also has an
active industrial policy that enables it to help its exporting firms in various ways, and spends vastly
more on research and development – both in absolute terms and as a percentage of its economy.
NAFTA also increasingly tied Mexico to the U.S. economy, at a time when the U.S. economy was
becoming dependent on growth driven by asset bubbles. As a result, Mexico suffered a recession
when the stock market bubble burst in 2000-2002, and was one the hardest hit countries in the
region during the U.S. Great Recession, with a drop of 6.7 percent of GDP. The Mexican economy
was even harder hit by the peso crisis in 1994-95, losing 9.5 percent of GDP during the downturn;
the crisis was caused by the U.S. Federal Reserve raising interest rates in 1994.

Did NAFTA Help Mexico?: An Assessment After 20 Years 3
The vulnerability to developments in U.S. financial markets continues: In May of 2013, after the U.S.
Federal Reserve announced a future “tapering” of its quantitative easing program (QE3), there were
fears of a repeat of the 1994 peso crisis, and gross foreign portfolio inflows came to a sudden stop.
The Mexican economy took a hit, with projected growth at 1.22 percent for the year. This was
mostly because, as the IMF noted, “Mexico’s deep and liquid foreign exchange and domestic equity
and sovereign bond markets can serve as an early port of call for global investors in episodes of
financial turbulence and hence are susceptible to risks of contagion.” This vulnerability is also a
result of the policies that NAFTA was designed to facilitate.
As was well known at the time of NAFTA’s passage, the main purpose of NAFTA was to lock in a
set of economic policies, some of which were already well under way in the decade prior, including
the liberalization of manufacturing, foreign investment and ownership, and other changes.1 The idea
was that the continuation and expansion of these policies would allow Mexico to achieve efficiencies
and economic progress that was not possible under the developmentalist, protectionist economic
model that had prevailed in the decades before 1980. While some of the policy changes were
undoubtedly necessary and/or positive, the end result has been decades of economic failure by
almost any economic or social indicator. This is true whether we compare Mexico to its
developmentalist past, or even if the comparison is to the rest of Latin America since NAFTA. After
20 years, these results should provoke more public discussion as to what went wrong.
1 See Tornell and Esquivel (1997).

Did NAFTA Help Mexico?: An Assessment After 20 Years 4
Income and Growth
The North American Free Trade Agreement (NAFTA) went into effect in January of 1994, bringing
Mexico into a new commercial agreement with the United States and Canada. At the time it was
argued, and forecast,2 that the agreement would boost Mexico’s growth and development. After 10
years of the agreement, the World Bank published a paper with an econometric analysis purporting
to show that NAFTA had increased Mexico’s growth rate, at least relative to that of the United
States.3 However, it turned out that this result was dependent on a data error.4
It is difficult to demonstrate unequivocally whether Mexico would have done worse in the absence
of NAFTA, because many elements of the counter-factual are unknowable. However, one can
compare the performance of the Mexican economy with that of the rest of the region over the past
20 years on the available economic and social indicators, and with its own past economic
performance. Such a comparison follows, along with some analysis of possible explanations for
Mexico’s poor performance.
Figure 1 shows the growth of income per capita in Mexico. This is the most basic measure of
economic progress. As can be seen, per capita GDP has grown by just 19.0 percent, cumulatively,
from 1994 through 2013. This is an average annual growth rate of just 0.9 percent, which is quite
low for a developing country.
FIGURE 1 Mexico: Real GDP Per Capita
Source: IMF (2013).
2 See Stanford (2003). 3 Lederman, Maloney, and Serven (2004). 4 See Weisbrot, Rosnick, and Baker (2004). The authors of the study, and the World Bank, never acknowledged the error, but did
not address it either in their correspondence on the subject. For a complete timeline with documents, including revisions to the WB paper and correspondence, see http://www.cepr.net/index.php/holding-the-world-bank-accountable-for-its-research-the-case-of-nafta/ .
88.1
104.9
101.5
112.9
105.6
113.2
-
20
40
60
80
100
120
1994 1996 1998 2000 2002 2004 2006 2008 2010 2012
Consta
nt
2008 P
esos, Thousands
Did NAFTA Help Mexico?: An Assessment After 20 Years 5
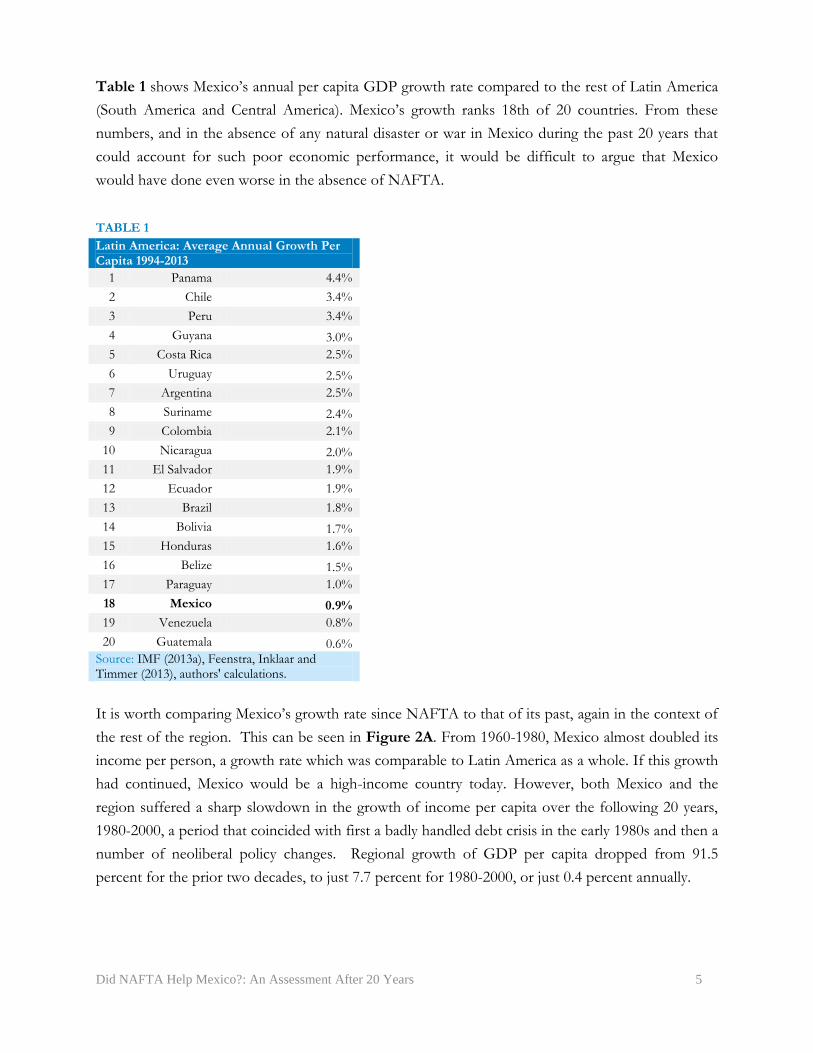
Table 1 shows Mexico’s annual per capita GDP growth rate compared to the rest of Latin America
(South America and Central America). Mexico’s growth ranks 18th of 20 countries. From these
numbers, and in the absence of any natural disaster or war in Mexico during the past 20 years that
could account for such poor economic performance, it would be difficult to argue that Mexico
would have done even worse in the absence of NAFTA.
TABLE 1
Latin America: Average Annual Growth Per Capita 1994-2013
1 Panama 4.4%
2 Chile 3.4%
3 Peru 3.4%
4 Guyana 3.0%
5 Costa Rica 2.5%
6 Uruguay 2.5%
7 Argentina 2.5%
8 Suriname 2.4%
9 Colombia 2.1%
10 Nicaragua 2.0%
11 El Salvador 1.9%
12 Ecuador 1.9%
13 Brazil 1.8%
14 Bolivia 1.7%
15 Honduras 1.6%
16 Belize 1.5%
17 Paraguay 1.0%
18 Mexico 0.9%
19 Venezuela 0.8%
20 Guatemala 0.6% Source: IMF (2013a), Feenstra, Inklaar and Timmer (2013), authors' calculations.
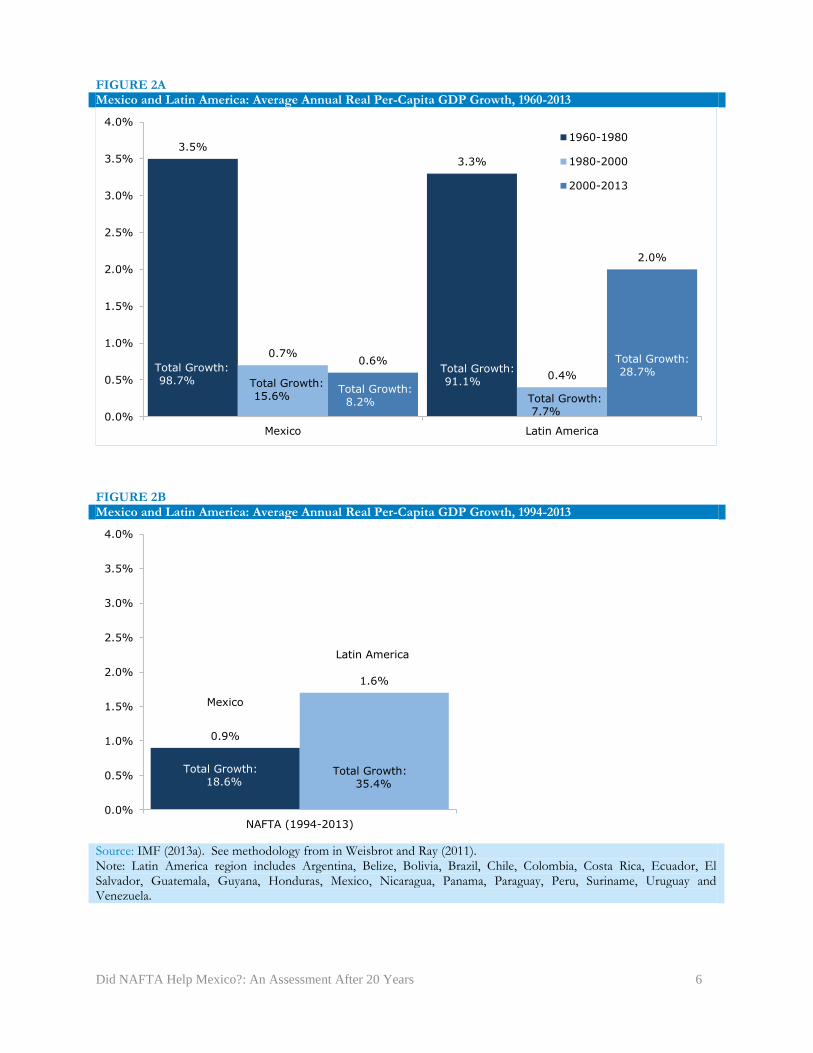
It is worth comparing Mexico’s growth rate since NAFTA to that of its past, again in the context of
the rest of the region. This can be seen in Figure 2A. From 1960-1980, Mexico almost doubled its
income per person, a growth rate which was comparable to Latin America as a whole. If this growth
had continued, Mexico would be a high-income country today. However, both Mexico and the
region suffered a sharp slowdown in the growth of income per capita over the following 20 years,
1980-2000, a period that coincided with first a badly handled debt crisis in the early 1980s and then a
number of neoliberal policy changes. Regional growth of GDP per capita dropped from 91.5
percent for the prior two decades, to just 7.7 percent for 1980-2000, or just 0.4 percent annually.
Did NAFTA Help Mexico?: An Assessment After 20 Years 6
FIGURE 2A Mexico and Latin America: Average Annual Real Per-Capita GDP Growth, 1960-2013
FIGURE 2B Mexico and Latin America: Average Annual Real Per-Capita GDP Growth, 1994-2013
Source: IMF (2013a). See methodology from in Weisbrot and Ray (2011). Note: Latin America region includes Argentina, Belize, Bolivia, Brazil, Chile, Colombia, Costa Rica, Ecuador, El Salvador, Guatemala, Guyana, Honduras, Mexico, Nicaragua, Panama, Paraguay, Peru, Suriname, Uruguay and Venezuela.
3.5%
3.3%
0.7%
0.4%
0.6%
2.0%
0.0%
0.5%
1.0%
1.5%
2.0%
2.5%
3.0%
3.5%
4.0%
Mexico Latin America
1960-1980
1980-2000
2000-2013
Total Growth: 98.7% Total Growth:
15.6% Total Growth:
8.2%
Total Growth: 91.1%
Total Growth: 7.7%
Total Growth: 28.7%
0.9%
1.6%
0.0%
0.5%
1.0%
1.5%
2.0%
2.5%
3.0%
3.5%
4.0%
NAFTA (1994-2013)
Total Growth: 18.6%
Total Growth: 35.4%
Mexico
Latin America
Did NAFTA Help Mexico?: An Assessment After 20 Years 7
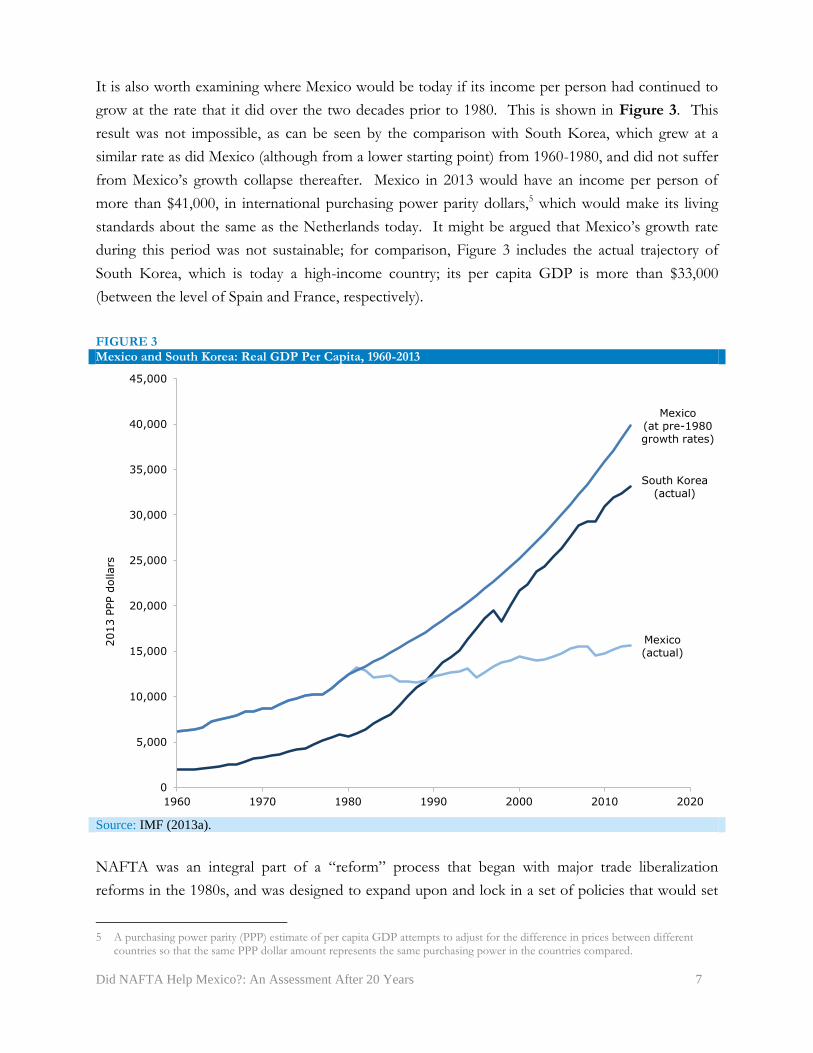
It is also worth examining where Mexico would be today if its income per person had continued to
grow at the rate that it did over the two decades prior to 1980. This is shown in Figure 3. This
result was not impossible, as can be seen by the comparison with South Korea, which grew at a
similar rate as did Mexico (although from a lower starting point) from 1960-1980, and did not suffer
from Mexico’s growth collapse thereafter. Mexico in 2013 would have an income per person of
more than $41,000, in international purchasing power parity dollars,5 which would make its living
standards about the same as the Netherlands today. It might be argued that Mexico’s growth rate
during this period was not sustainable; for comparison, Figure 3 includes the actual trajectory of
South Korea, which is today a high-income country; its per capita GDP is more than $33,000
(between the level of Spain and France, respectively).
FIGURE 3 Mexico and South Korea: Real GDP Per Capita, 1960-2013
Source: IMF (2013a).
NAFTA was an integral part of a “reform” process that began with major trade liberalization
reforms in the 1980s, and was designed to expand upon and lock in a set of policies that would set
5 A purchasing power parity (PPP) estimate of per capita GDP attempts to adjust for the difference in prices between different
countries so that the same PPP dollar amount represents the same purchasing power in the countries compared.
South Korea (actual)
Mexico (actual)
Mexico (at pre-1980 growth rates)
0
5,000
10,000
15,000
20,000
25,000
30,000
35,000
40,000
45,000
1960 1970 1980 1990 2000 2010 2020
2013 P
PP d
ollars
Did NAFTA Help Mexico?: An Assessment After 20 Years 8
the economy on an irreversible path that was very different from that defined by the
developmentalist state and protectionist policies of the pre-1980 period.6 However, even if we look
at just the 20 years since NAFTA, and ask what Mexico would look like today if NAFTA had
restored Mexico’s 1960-1980 growth rate – after more than a decade of failure --- it would still be a
reasonably high-income country. Per capita GDP would be about $26,000 today, significantly more
than that of Portugal or Greece.
Most of the rest of Latin America had a rebound in the 21st century, with average annual per capita
GDP growth of 2.0 percent for 2000-2013. But Mexico did not share in that rebound, growing only
0.6 percent annually per capita for those years. Figure 2B shows Mexico’s per capita GDP growth
for the 20 years since NAFTA: it was about half of that for the region as a whole.
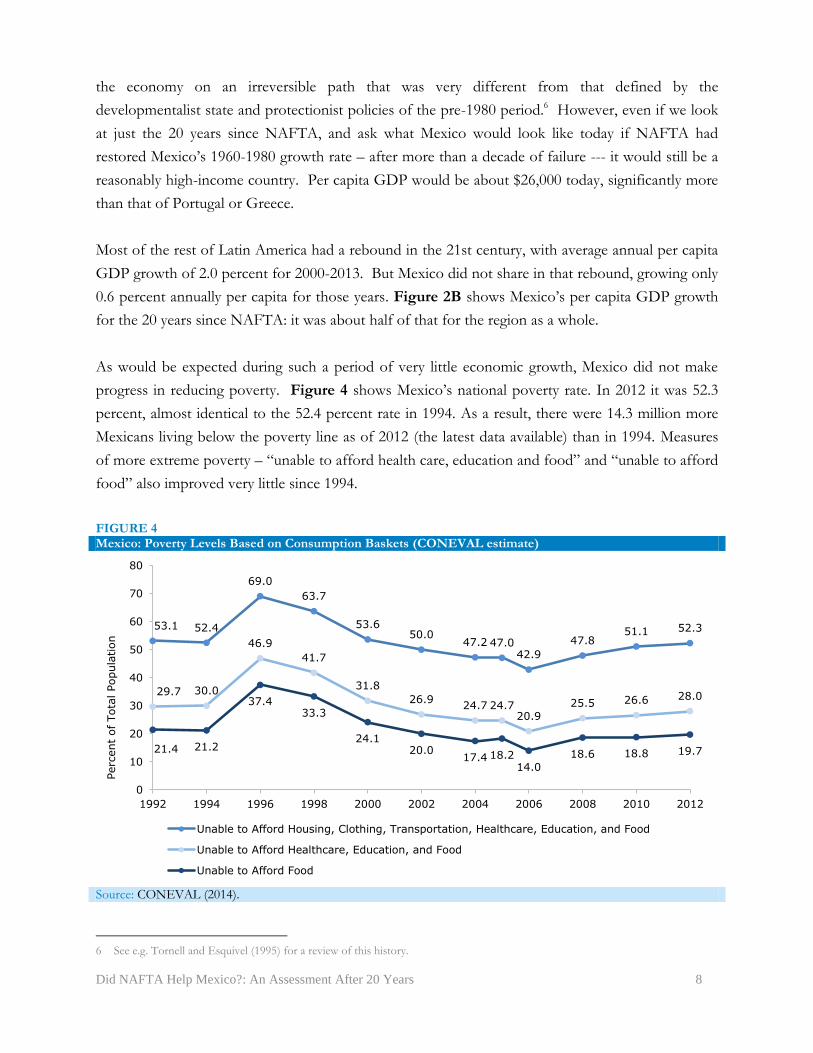
As would be expected during such a period of very little economic growth, Mexico did not make
progress in reducing poverty. Figure 4 shows Mexico’s national poverty rate. In 2012 it was 52.3
percent, almost identical to the 52.4 percent rate in 1994. As a result, there were 14.3 million more
Mexicans living below the poverty line as of 2012 (the latest data available) than in 1994. Measures
of more extreme poverty – “unable to afford health care, education and food” and “unable to afford
food” also improved very little since 1994.
FIGURE 4 Mexico: Poverty Levels Based on Consumption Baskets (CONEVAL estimate)
Source: CONEVAL (2014).
6 See e.g. Tornell and Esquivel (1995) for a review of this history.
53.1 52.4
69.0
63.7
53.6 50.0
47.2 47.0 42.9
47.8 51.1 52.3
29.7 30.0
46.9
41.7
31.8
26.9 24.7 24.7
20.9
25.5 26.6 28.0
21.4 21.2
37.4 33.3
24.1 20.0
17.4 18.2 14.0
18.6 18.8 19.7
0
10
20
30
40
50
60
70
80
1992 1994 1996 1998 2000 2002 2004 2006 2008 2010 2012
Perc
ent
of Tota
l Popula
tion
Unable to Afford Housing, Clothing, Transportation, Healthcare, Education, and Food
Unable to Afford Healthcare, Education, and Food
Unable to Afford Food
Did NAFTA Help Mexico?: An Assessment After 20 Years 9
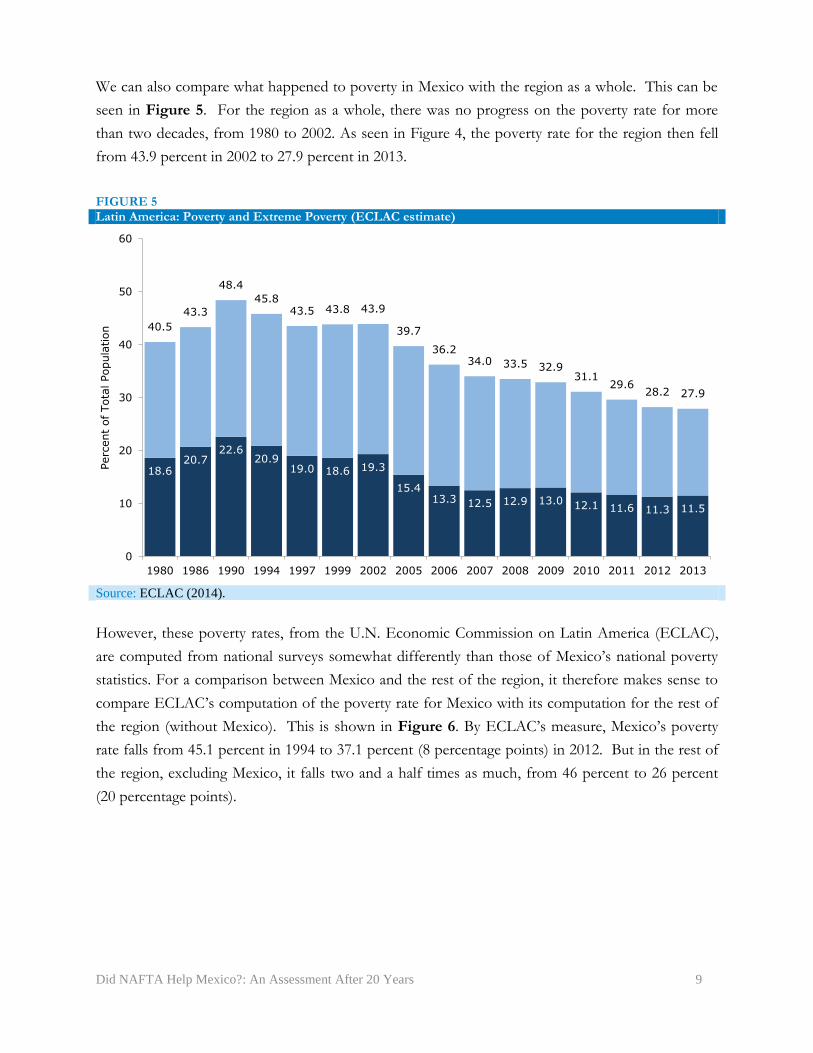
We can also compare what happened to poverty in Mexico with the region as a whole. This can be
seen in Figure 5. For the region as a whole, there was no progress on the poverty rate for more
than two decades, from 1980 to 2002. As seen in Figure 4, the poverty rate for the region then fell
from 43.9 percent in 2002 to 27.9 percent in 2013.
FIGURE 5 Latin America: Poverty and Extreme Poverty (ECLAC estimate)
Source: ECLAC (2014).
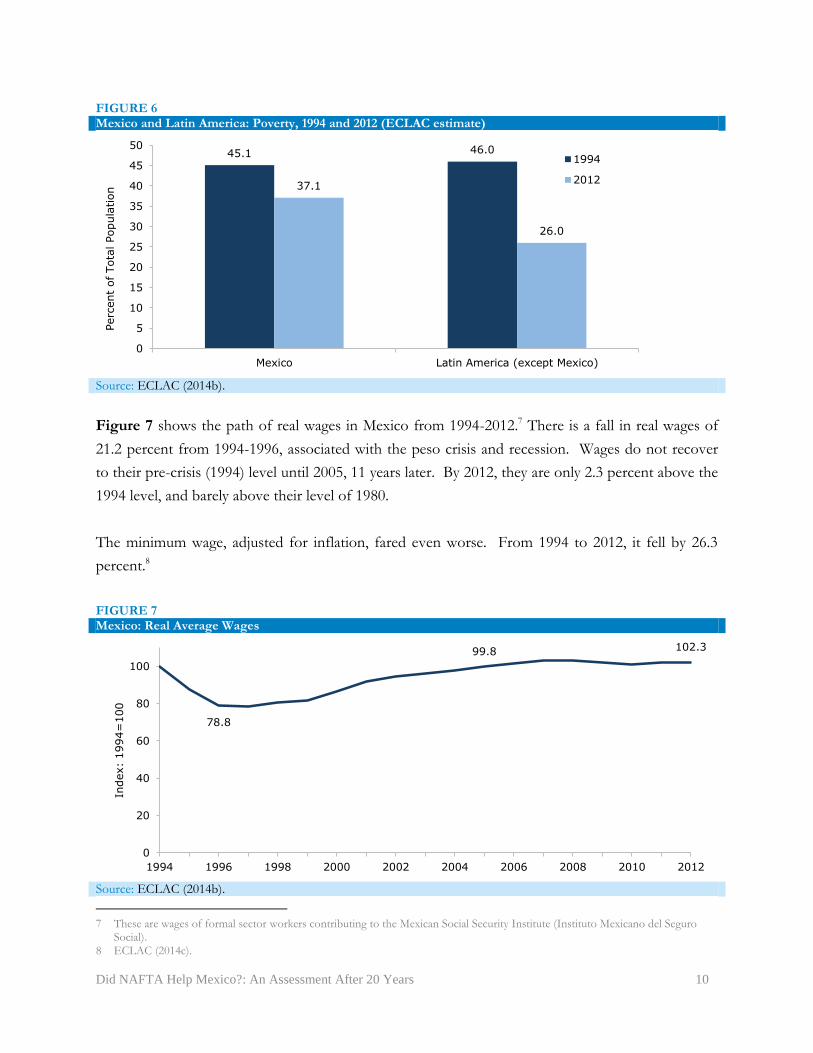
However, these poverty rates, from the U.N. Economic Commission on Latin America (ECLAC),
are computed from national surveys somewhat differently than those of Mexico’s national poverty
statistics. For a comparison between Mexico and the rest of the region, it therefore makes sense to
compare ECLAC’s computation of the poverty rate for Mexico with its computation for the rest of
the region (without Mexico). This is shown in Figure 6. By ECLAC’s measure, Mexico’s poverty
rate falls from 45.1 percent in 1994 to 37.1 percent (8 percentage points) in 2012. But in the rest of
the region, excluding Mexico, it falls two and a half times as much, from 46 percent to 26 percent
(20 percentage points).
18.6 20.7
22.6 20.9
19.0 18.6 19.3
15.4 13.3 12.5 12.9 13.0 12.1 11.6 11.3 11.5
40.5
43.3
48.4
45.8 43.5 43.8 43.9
39.7
36.2 34.0 33.5 32.9
31.1 29.6
28.2 27.9
0
10
20
30
40
50
60
1980 1986 1990 1994 1997 1999 2002 2005 2006 2007 2008 2009 2010 2011 2012 2013
Perc
ent
of Tota
l Popula
tion
Did NAFTA Help Mexico?: An Assessment After 20 Years 10
FIGURE 6 Mexico and Latin America: Poverty, 1994 and 2012 (ECLAC estimate)
Source: ECLAC (2014b).
Figure 7 shows the path of real wages in Mexico from 1994-2012.7 There is a fall in real wages of
21.2 percent from 1994-1996, associated with the peso crisis and recession. Wages do not recover
to their pre-crisis (1994) level until 2005, 11 years later. By 2012, they are only 2.3 percent above the
1994 level, and barely above their level of 1980.
The minimum wage, adjusted for inflation, fared even worse. From 1994 to 2012, it fell by 26.3
percent.8
FIGURE 7 Mexico: Real Average Wages
Source: ECLAC (2014b).
7 These are wages of formal sector workers contributing to the Mexican Social Security Institute (Instituto Mexicano del Seguro
Social). 8 ECLAC (2014c).
45.1 46.0
37.1
26.0
0
5
10
15
20
25
30
35
40
45
50
Mexico Latin America (except Mexico)
Perc
ent
of Tota
l Popula
tion
1994
2012
78.8
99.8 102.3
0
20
40
60
80
100
1994 1996 1998 2000 2002 2004 2006 2008 2010 2012
Index:
1994=
100
Did NAFTA Help Mexico?: An Assessment After 20 Years 11
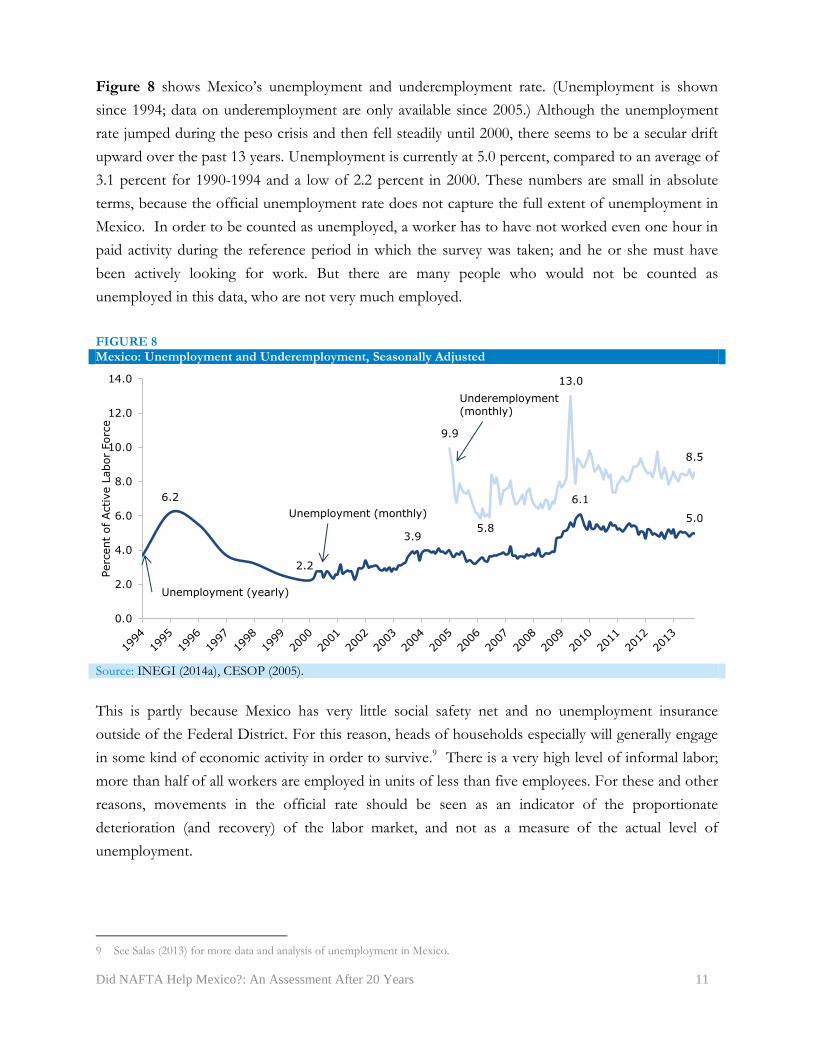
Figure 8 shows Mexico’s unemployment and underemployment rate. (Unemployment is shown
since 1994; data on underemployment are only available since 2005.) Although the unemployment
rate jumped during the peso crisis and then fell steadily until 2000, there seems to be a secular drift
upward over the past 13 years. Unemployment is currently at 5.0 percent, compared to an average of
3.1 percent for 1990-1994 and a low of 2.2 percent in 2000. These numbers are small in absolute
terms, because the official unemployment rate does not capture the full extent of unemployment in
Mexico. In order to be counted as unemployed, a worker has to have not worked even one hour in
paid activity during the reference period in which the survey was taken; and he or she must have
been actively looking for work. But there are many people who would not be counted as
unemployed in this data, who are not very much employed.
FIGURE 8 Mexico: Unemployment and Underemployment, Seasonally Adjusted
Source: INEGI (2014a), CESOP (2005).
This is partly because Mexico has very little social safety net and no unemployment insurance
outside of the Federal District. For this reason, heads of households especially will generally engage
in some kind of economic activity in order to survive.9 There is a very high level of informal labor;
more than half of all workers are employed in units of less than five employees. For these and other
reasons, movements in the official rate should be seen as an indicator of the proportionate
deterioration (and recovery) of the labor market, and not as a measure of the actual level of
unemployment.
9 See Salas (2013) for more data and analysis of unemployment in Mexico.
6.2
2.2
3.9
6.1
5.0
9.9
5.8
13.0
8.5
0.0
2.0
4.0
6.0
8.0
10.0
12.0
14.0
Perc
ent
of Active L
abor
Forc
e
Unemployment (monthly)
Underemployment (monthly)
Unemployment (yearly)
Did NAFTA Help Mexico?: An Assessment After 20 Years 12
A somewhat better measure of the state of the labor market is underemployment, also shown in
Figure 8, going back to 2005. This includes workers who have a demonstrated need and ability to
work more hours, but were not able to do so due to labor market conditions. This was 8.4 percent
for 2013, up from an annual average of 7.2 percent for the pre-crisis years 2005-2007.
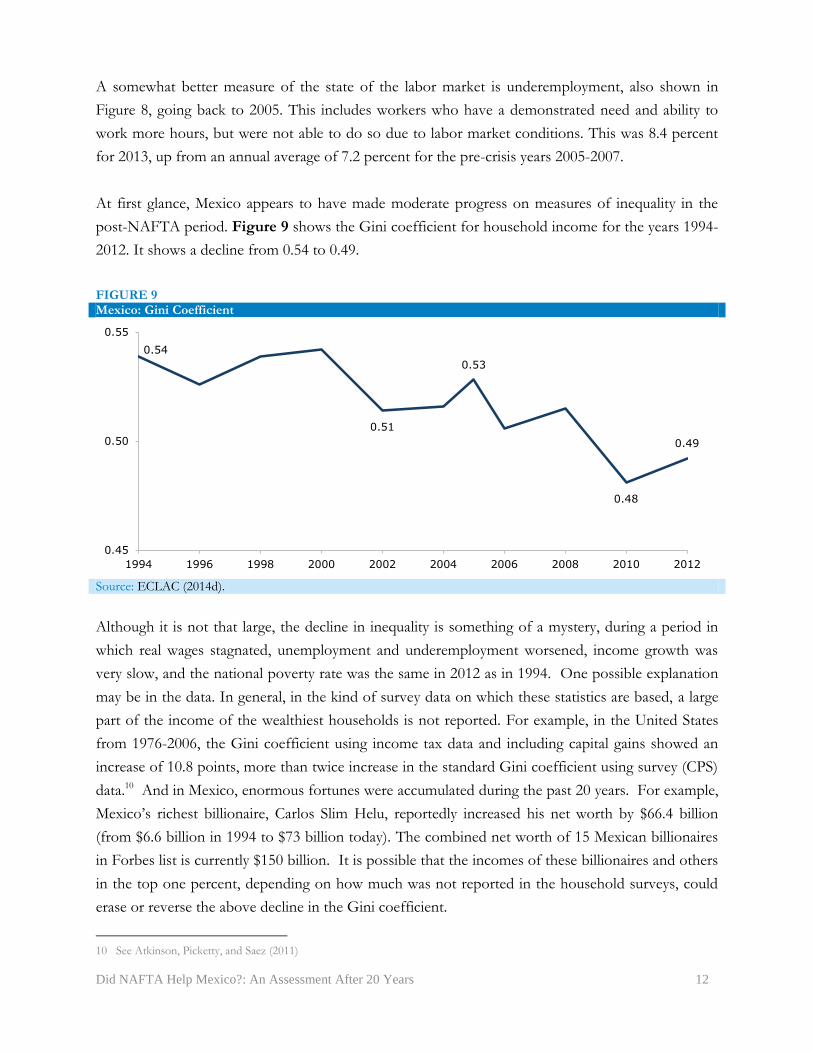
At first glance, Mexico appears to have made moderate progress on measures of inequality in the
post-NAFTA period. Figure 9 shows the Gini coefficient for household income for the years 1994-
2012. It shows a decline from 0.54 to 0.49.
FIGURE 9 Mexico: Gini Coefficient
Source: ECLAC (2014d).
Although it is not that large, the decline in inequality is something of a mystery, during a period in
which real wages stagnated, unemployment and underemployment worsened, income growth was
very slow, and the national poverty rate was the same in 2012 as in 1994. One possible explanation
may be in the data. In general, in the kind of survey data on which these statistics are based, a large
part of the income of the wealthiest households is not reported. For example, in the United States
from 1976-2006, the Gini coefficient using income tax data and including capital gains showed an
increase of 10.8 points, more than twice increase in the standard Gini coefficient using survey (CPS)
data.10 And in Mexico, enormous fortunes were accumulated during the past 20 years. For example,
Mexico’s richest billionaire, Carlos Slim Helu, reportedly increased his net worth by $66.4 billion
(from $6.6 billion in 1994 to $73 billion today). The combined net worth of 15 Mexican billionaires
in Forbes list is currently $150 billion. It is possible that the incomes of these billionaires and others
in the top one percent, depending on how much was not reported in the household surveys, could
erase or reverse the above decline in the Gini coefficient.
10 See Atkinson, Picketty, and Saez (2011)
0.54
0.51
0.53
0.48
0.49
0.45
0.50
0.55
1994 1996 1998 2000 2002 2004 2006 2008 2010 2012
Did NAFTA Help Mexico?: An Assessment After 20 Years 13
Efforts to decompose the sources of the decline in inequality shown in the Gini coefficient from
household survey data in Mexico from 1996 to 2006 have indicated that most of it can be attributed
to labor income per person.11 In other words there was a reduction in the inequality within labor
income. However, with overall real wages stagnant from 1994 to 2012, the living standards of the
vast majority of workers cannot have increased very much.
In any case, even if the redistribution had taken place as it appears in the Gini data, it was not
enough to reduce the national poverty rate; nor was the economic growth of the past 20 years
sufficient to reduce unemployment or underemployment.
Agriculture and Employment
NAFTA removed tariffs (but not subsidies) on agricultural goods, with a transition period in which
there was a steadily increasing import quota for certain commodities. The transition period was
longest for corn, the most important crop for Mexican producers, only ending in 2008. Not
surprisingly, U.S. production, which is not only subsidized but had higher average productivity levels
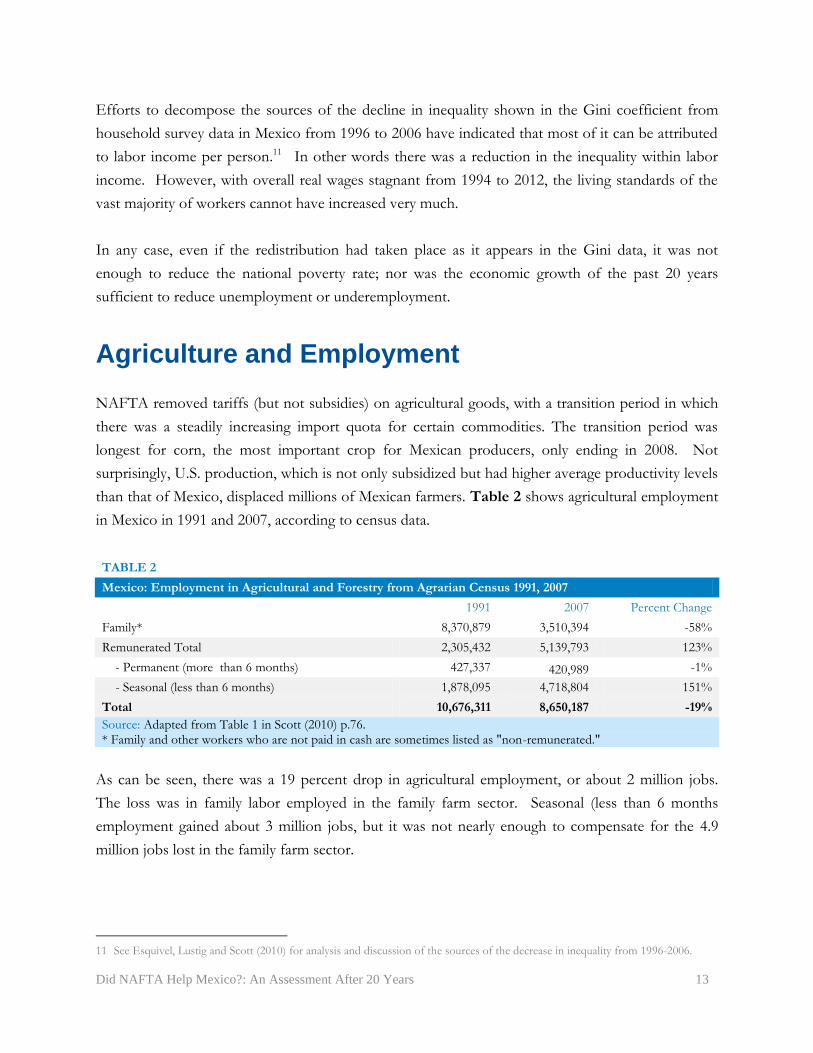
than that of Mexico, displaced millions of Mexican farmers. Table 2 shows agricultural employment
in Mexico in 1991 and 2007, according to census data.
TABLE 2
Mexico: Employment in Agricultural and Forestry from Agrarian Census 1991, 2007
1991 2007 Percent Change
Family* 8,370,879 3,510,394 -58%
Remunerated Total 2,305,432 5,139,793 123%
- Permanent (more than 6 months) 427,337 420,989 -1%
- Seasonal (less than 6 months) 1,878,095 4,718,804 151%
Total 10,676,311 8,650,187 -19%
Source: Adapted from Table 1 in Scott (2010) p.76. * Family and other workers who are not paid in cash are sometimes listed as "non-remunerated."
As can be seen, there was a 19 percent drop in agricultural employment, or about 2 million jobs.
The loss was in family labor employed in the family farm sector. Seasonal (less than 6 months
employment gained about 3 million jobs, but it was not nearly enough to compensate for the 4.9
million jobs lost in the family farm sector.
11 See Esquivel, Lustig and Scott (2010) for analysis and discussion of the sources of the decrease in inequality from 1996-2006.
Did NAFTA Help Mexico?: An Assessment After 20 Years 14
Proponents of NAFTA of course knew that family farms in Mexico would not be able to compete
with subsidized U.S. production but argued that displaced workers would shift to higher
productivity agriculture (mainly vegetables and fruits for export), as well as industrial jobs. Although
vegetable and fruit production did expand considerably (from 17.3 million tons in 1994 to 28.2
million in 2012), and presumably accounted for many of the 3 million seasonal jobs created, it was
clearly not enough in terms of employment.
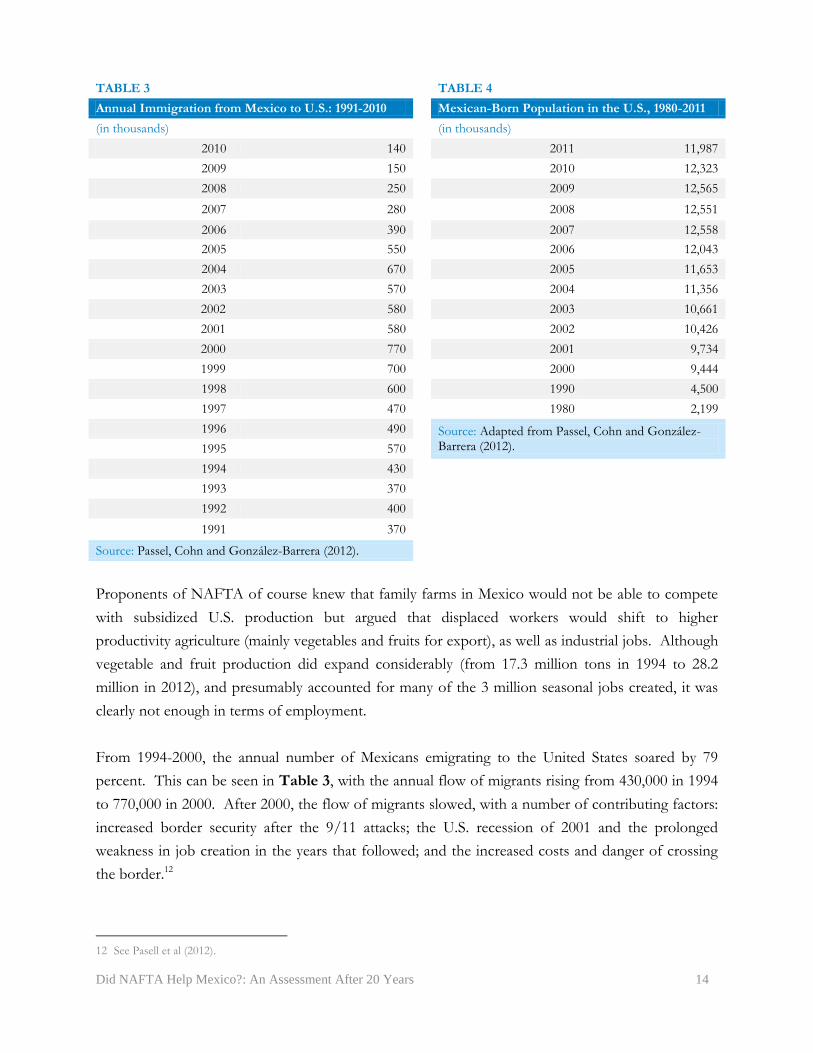
From 1994-2000, the annual number of Mexicans emigrating to the United States soared by 79
percent. This can be seen in Table 3, with the annual flow of migrants rising from 430,000 in 1994
to 770,000 in 2000. After 2000, the flow of migrants slowed, with a number of contributing factors:
increased border security after the 9/11 attacks; the U.S. recession of 2001 and the prolonged
weakness in job creation in the years that followed; and the increased costs and danger of crossing
the border.12
12 See Pasell et al (2012).
TABLE 3 TABLE 4
Annual Immigration from Mexico to U.S.: 1991-2010 Mexican-Born Population in the U.S., 1980-2011
(in thousands) (in thousands)
2010 140 2011 11,987
2009 150 2010 12,323
2008 250 2009 12,565
2007 280 2008 12,551
2006 390 2007 12,558
2005 550 2006 12,043
2004 670 2005 11,653
2003 570 2004 11,356
2002 580 2003 10,661
2001 580 2002 10,426
2000 770 2001 9,734
1999 700 2000 9,444
1998 600 1990 4,500
1997 470 1980 2,199
1996 490 Source: Adapted from Passel, Cohn and González-Barrera (2012). 1995 570
1994 430
1993 370
1992 400
1991 370
Source: Passel, Cohn and González-Barrera (2012).
Did NAFTA Help Mexico?: An Assessment After 20 Years 15
The increase in emigration can also be seen in Table 4, which shows the number of Mexican-born
residents living in the United States. This more than doubled from 4.5 million in 1990 to 9.4 million
in 2000, and peaked at 12.6 million in 2009.
It was noted previously that if the Mexican economy had continued growing at the rate of 1960-
1980, Mexico would be a high-income country today; and that it would also have become a
reasonably high-income country if its pre-1980 growth rate had been restored after NAFTA. There
would still be a significant income and wage differential between Mexico and the United States, but
the incentive to emigrate to the United States would have been drastically reduced along the way. It
is questionable whether immigration reform would have become a political issue in the United States
if not for the poor performance of the Mexican economy in the NAFTA years.
Economic Policy and Mexican Integration with
the United States Economy
As noted above, NAFTA was just one variable among others that could account for Mexico’s poor
economic performance over the past 20 years. However, it appears to be related to other economic
policy choices that have negatively affected the Mexican economy during this period.
The IMF notes that “Mexico competes directly with China in the U.S. market, where China accounts
for 23 percent of U.S. imports and Mexico accounts for 12 percent.”13 This is a very tough
competition for Mexico for a number of reasons. First, Mexico is a higher-wage country than China,
in addition to China’s exchange rate advantage. In 1996, labor compensation costs in Mexico, in U.S.
dollars, were $3.05 per hour, and rose to $5.59 by 2002. 14 For China in 2002, hourly compensation
costs in U.S. dollars were $0.73 per hour.15 Although these data are not exactly comparable because
of differences in their construction, they indicate a huge gap in dollar terms – which is what matters
for export or import-competing industries. By 2009, the gap was still very large: $1.74 for China
versus $6.36 for Mexico.16 So it is difficult to compete on the basis of wages. Second, China has
maintained a commitment to a competitive exchange rate, in effect fixing this exchange rate against
the dollar or (since 2005) a basket of currencies. The Mexican central bank by contrast has, as the
IMF notes, “a firm commitment to exchange rate flexibility.”17 In other words, the Mexican Central
Bank will raise or lower interest rates as necessary to reach its target inflation rate (3 percent), and let
13 IMF (2013). 14 BLS (2013). 15 Ibid. 16 Again, the numbers are not exactly comparable but still indicate a large gap in labor costs. See BLS (2013). 17 IMF (2013)
Did NAFTA Help Mexico?: An Assessment After 20 Years 16
the exchange rate go where it may. This means that Mexico’s exchange rate is unlikely to be
competitive with China’s, which further worsens its cost disadvantage. The Mexican Central Bank’s
form of rigid inflation targeting also adds a large element of unpredictability to the exchange rate,
which has a negative impact on foreign direct investment; foreign investors will find it difficult to
know how much their assets or output will be worth internationally in the future.
China has other advantages that make it a formidable competitor for Mexico in the U.S. market: the
Chinese government owns most of the banking system in China, and can therefore ensure that its
most important exporting firms have sufficient access to credit. In Mexico, by contrast, 70 percent
of the banking system is not only private but foreign-owned.18 The Chinese government also has an
active industrial policy that enables it to help its exporting firms in various ways.19 China also spends
1.84 percent of its (many times larger) GDP on research and development, as compared to Mexico’s
0.46 percent.20
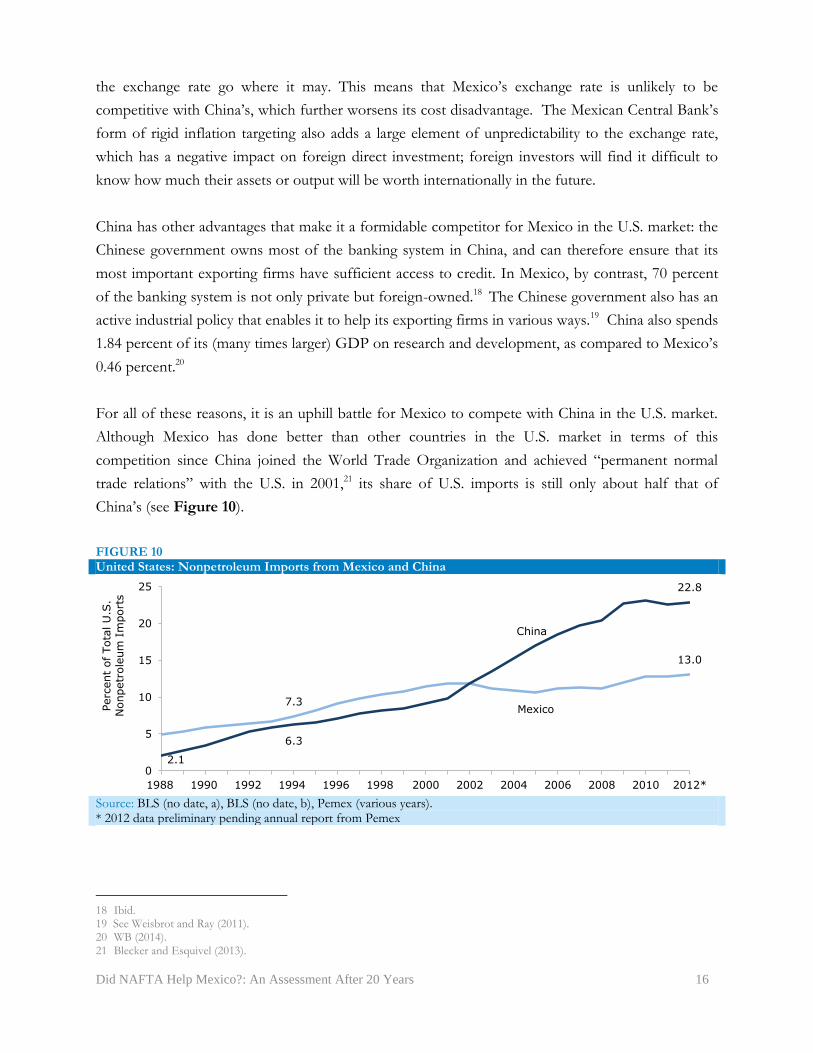
For all of these reasons, it is an uphill battle for Mexico to compete with China in the U.S. market.
Although Mexico has done better than other countries in the U.S. market in terms of this
competition since China joined the World Trade Organization and achieved “permanent normal
trade relations” with the U.S. in 2001,21 its share of U.S. imports is still only about half that of
China’s (see Figure 10).
FIGURE 10 United States: Nonpetroleum Imports from Mexico and China
Source: BLS (no date, a), BLS (no date, b), Pemex (various years). * 2012 data preliminary pending annual report from Pemex
18 Ibid. 19 See Weisbrot and Ray (2011). 20 WB (2014). 21 Blecker and Esquivel (2013).
7.3 Mexico
13.0
2.1
6.3
China
22.8
0
5
10
15
20
25
1988 1990 1992 1994 1996 1998 2000 2002 2004 2006 2008 2010 2012*
Perc
ent
of Tota
l U
.S.
Nonpetr
ole
um
Im
port
s
Did NAFTA Help Mexico?: An Assessment After 20 Years 17
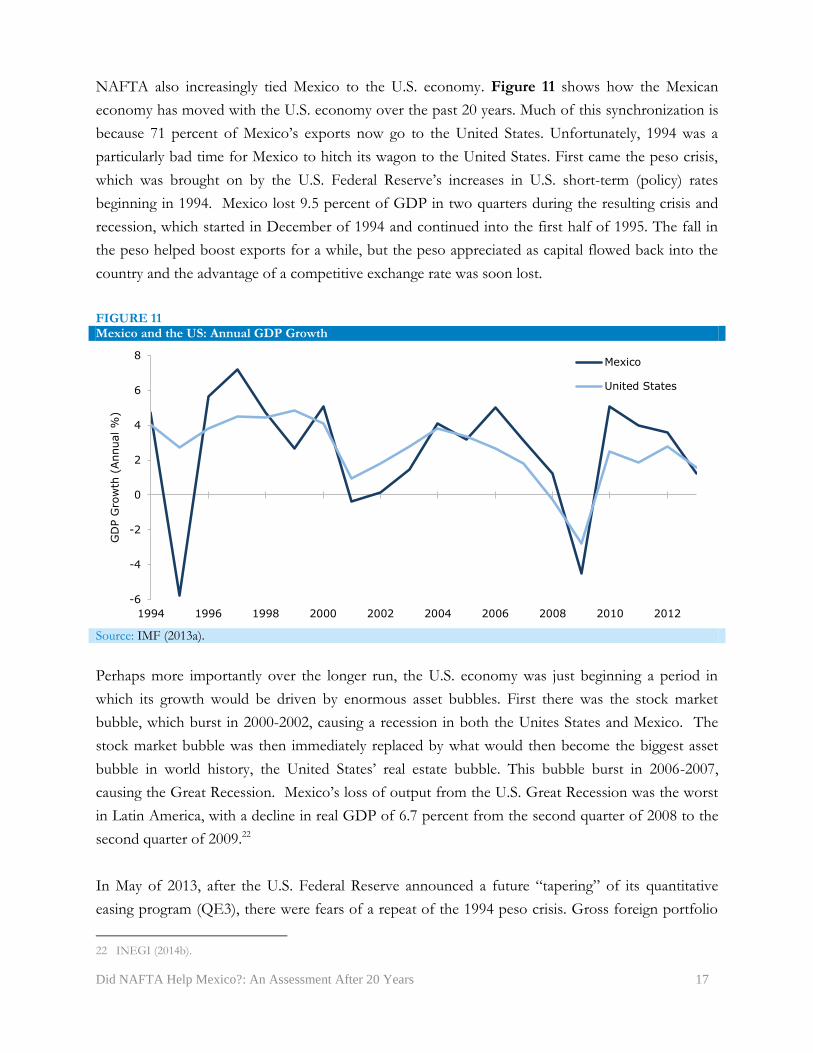
NAFTA also increasingly tied Mexico to the U.S. economy. Figure 11 shows how the Mexican
economy has moved with the U.S. economy over the past 20 years. Much of this synchronization is
because 71 percent of Mexico’s exports now go to the United States. Unfortunately, 1994 was a
particularly bad time for Mexico to hitch its wagon to the United States. First came the peso crisis,
which was brought on by the U.S. Federal Reserve’s increases in U.S. short-term (policy) rates
beginning in 1994. Mexico lost 9.5 percent of GDP in two quarters during the resulting crisis and
recession, which started in December of 1994 and continued into the first half of 1995. The fall in
the peso helped boost exports for a while, but the peso appreciated as capital flowed back into the
country and the advantage of a competitive exchange rate was soon lost.
FIGURE 11 Mexico and the US: Annual GDP Growth
Source: IMF (2013a).
Perhaps more importantly over the longer run, the U.S. economy was just beginning a period in
which its growth would be driven by enormous asset bubbles. First there was the stock market
bubble, which burst in 2000-2002, causing a recession in both the Unites States and Mexico. The
stock market bubble was then immediately replaced by what would then become the biggest asset
bubble in world history, the United States’ real estate bubble. This bubble burst in 2006-2007,
causing the Great Recession. Mexico’s loss of output from the U.S. Great Recession was the worst
in Latin America, with a decline in real GDP of 6.7 percent from the second quarter of 2008 to the
second quarter of 2009.22
In May of 2013, after the U.S. Federal Reserve announced a future “tapering” of its quantitative
easing program (QE3), there were fears of a repeat of the 1994 peso crisis. Gross foreign portfolio
22 INEGI (2014b).
-6
-4
-2
0
2
4
6
8
1994 1996 1998 2000 2002 2004 2006 2008 2010 2012
GD
P G
row
th (
Annual %
)
Mexico
United States
Did NAFTA Help Mexico?: An Assessment After 20 Years 18
inflows came to a sudden stop23, and the Mexican economy took a hit, with projected growth at 1.22
percent for the year.24 As the IMF noted in its recent Article IV consultation for Mexico:
Based on a recent survey, the BIS reported that the Mexican peso is the most actively traded emerging market currency in the world, with a daily global trading volume of US$135 billion. This means that Mexico’s deep and liquid foreign exchange and domestic equity and sovereign bond markets can serve as an early port of call for global investors in episodes of financial turbulence and hence are susceptible to risks of contagion.25
This is not a good situation for any developing country to be in: hedge funds and international
portfolio managers seeking to reduce their overall exposure to emerging market assets, or hedge
against currency depreciation in emerging markets because of trouble that may emerge from
anywhere in the world, look first to sell off Mexican assets or bet against the peso. As the IMF also
notes, “the Mexican peso is fully convertible and trades 24 hours daily.” While the policy decisions
that led to this situation were not all written into NAFTA, many were closely related in that they
were part of a strategy of guaranteeing foreign investors the kinds of capital mobility that they
wanted, in order to attract foreign investment (both portfolio investment and FDI).
Conclusion As was well known at the time of NAFTA’s passage, the main purpose of NAFTA was to lock in a
set of economic policies, some of which were already well under way in the decade prior, including
the liberalization of manufacturing, foreign investment and ownership, and other changes.26 The
idea was that the continuation and expansion of these policies would allow Mexico to achieve
efficiencies and economic progress that was not possible under the developmentalist, protectionist
economic model that had prevailed in the decades before 1980. While some of the policy changes
were undoubtedly necessary and/or positive, the end result has been decades of economic failure by
almost any economic or social indicator. This is true whether we compare Mexico to its
developmentalist past, or even if the comparison is to the rest of Latin America since NAFTA. After
20 years, these results should provoke more public discussion as to what went wrong.
23 IMF (2013b). Figure 5. 24 IMF (2013a). 25 IMF (2013). 26 See Tornell and Esquivel (1995).
Did NAFTA Help Mexico?: An Assessment After 20 Years 19
References Atkinson, Anthony B., Thomas Piketty and Emmanuel Saez. 2011. “Top Incomes in the Long Run
of History.” Journal of Economic Literature 49.1: 3-71. Print. BEA (Bureau of Economic Analysis). No date, a. “Table 2.a U.S. Trade in Goods (1999-present).”
International Transactions. Online database, consulted February 6, 2014. http://www.bea.gov/iTable/iTable.cfm?ReqID=6&step=1#reqid=6&step=1&isuri=1
_____. No date, b. “Additional historical data (Table 2b).” International Transactions. Online
database, consulted February 6, 2014. http://www.bea.gov/iTable/iTable.cfm?ReqID=6&step=1#reqid=6&step=1&isuri=1
Blecker, Robert A. and Gerardo Esquivel. 2013. “Trade and the Development Gap.” Mexico and the
United States: The Politics of Partnership. Eds. Peter H. Smith and Andrew Selee. Boulder, CO: Lynne Rienner. 83-110. Print.
BLS (Bureau of Labor Statistics). 2013. “International Comparisons of Hourly Compensation Costs
in Manufacturing, 2012.” Washington, DC. August. http://www.bls.gov/fls/
Centro de Estudios Sociales y de Opinión Pública. 2005. “Empleo y Desempleo en Mexico: 1994-
2004.” Mexico, DF. February. http://201.147.98.14/camara/content/download/22822/110347/file/DAHC0004%20Empleo%20y%20desempleo%201994-2004.pdf
CONEVAL (Consejo Nacional de Evaluación de la Política de Desarrollo Social). 2014. “Evolución
de pobreza por la dimensión de ingreso en Mexico 1992-2012.” Online database, consulted February 6, 2014. http://www.coneval.gob.mx/Informes/Pobreza/Estatal2012/Evolucion_dimensiones_pobreza_1990-2012/AE_Indicadores_Pobreza_1990-2012.zip
ECLAC (Economic Commission for Latin America and the Caribbean). 2013a. “Social Panorama of
Latin America.” Santiago, Chile. March. http://www.eclac.cl/cgi-bin/getProd.asp?xml=/publicaciones/xml/8/49398/P49398.xml&xsl=/publicaciones/ficha-i.xsl&base=/publicaciones/top_publicaciones-i.xsl#
_____. 2013b. “Panorama Social de América Latina.” Santiago, Chile. December.
http://www.eclac.org/cgi-bin/getProd.asp?xml=/publicaciones/xml/9/51769/P51769.xml&xsl=/tpl/p9f.xsl&base=/tpl-i/top-bottom.xslt
_____. 2014a. “Población en situación de indigencia y pobreza.” Online database, consulted
February 6, 2014. http://interwp.cepal.org/sisgen/ConsultaIntegrada.asp?idIndicador=182&idioma=e
Did NAFTA Help Mexico?: An Assessment After 20 Years 20
_____. 2014b. “Salario medio real anual.” Online database, consulted February 6, 2014. http://interwp.cepal.org/sisgen/ConsultaIntegrada.asp?idIndicador=341&idioma=e
_____. 2014c. “Salario mínimo real.” Online database, consulted February 6, 2014.
http://interwp.cepal.org/sisgen/ConsultaIntegrada.asp?idIndicador=340&idioma=e
_____. 2014d. “Índice de concentración de Gini.” Online database, consulted February 6, 2014. http://interwp.cepal.org/sisgen/ConsultaIntegrada.asp?idIndicador=250&idioma=e
Esquivel, Gerardo, Nora Lustig and John Scott. 2010. “Mexico: A Decard of Falling Inequality: Market Forces or State Action?” Declining Inequality in Latin America: A Decade of Progress? Eds. Luis F. López-Calva and Nora Lustig. Baltimore, Maryland: Brookings Institution Press. 175-217. Print.
Feenstra, Robert C., Robert Inklaar and Marcel P. Timmer (2013), “The Next Generation of the
Penn World Table.” Online database, consulted February 6, 2014. www.ggdc.net/pwt INEGI (Instituto Nacional de Estadística y Geografía). 2014a. “Tasa de desocupación serie
unificada.” Online database, consulted February 6, 2014. http://www.inegi.org.mx/sistemas/bie/
_____. 2014b. “Producto interno bruto trimestral, base 2008: Serie desestacionalizada.” Online
database, consulted February 6, 2014. http://www.inegi.org.mx/sistemas/bie/
IMF (International Monetary Fund). 2013a. "World Economic Outlook, October 2013." Online
database. http://www.imf.org/external/pubs/ft/weo/2013/02/weodata/index.aspx _____. 2013b. “Mexico: Staff Report for the 2013 Article IV Consultation.” IMF Country Report
No. 13/334. November. http://www.imf.org/external/pubs/cat/longres.aspx?sk=41070.0
Lederman, Daniel, William F. Maloney and Luis Serven. 2004. “Lessons from NAFTA for Latin
America and the Caribbean Countries: A Summary of Research Findings”, Washington, DC: World Bank and Stanford University Press. https://openknowledge.worldbank.org/handle/10986/14457
Passel, Jeffrey, D’Vera Cohn and Ana González-Barrera. 2012. “Net Migration from Mexico Falls to
Zero—and Perhaps Less.” Pew Hispanic Center, Washington , DC. April. http://www.pewhispanic.org/2012/04/23/net-migration-from-mexico-falls-to-zero-and-perhaps-less/
Pemex (Petróleos Mexicanos). Various years. “Anuario Estadístico.” Mexico, D.F.
Did NAFTA Help Mexico?: An Assessment After 20 Years 21
Salas, Carlos. 2013. “Labour, Income and Social Programmes in Contemporary Mexico.” Social Protection, Growth and Employment: Evidence from India, Kenya, Malawi, Mexico and Tajikistan. New York, NY: United Nations Development Programme. 201-234. Print.
Scott, John. 2009. “Incidence of Agricultural Subsidies in Mexico.” Centro de Investigación y
Docencia Económicas Working Paper 473. December. http://cide.edu/repec/economia/pdf/DTE473.pdf
SEDLAC (Socio-Economic Database for Latin America and the Caribbean). 2014. “Inequality:
Distribution of household per capita income.” Online database, consulted February 6, 2014. http://sedlac.econo.unlp.edu.ar/eng/statistics-detalle.php?idE=35
Stanford, Jim. 2003. “Economic Models and Economic Reality: North American Free Trade and the
Presdictions of Economists.” International Journal of Political Economy 33.3: 28-49. Tornell, Aaron and Gerardo Esquivel. 1997. “The Political Economy of Mexico’s Entry into
NAFTA.” Regionalism Versus Multilateral Trate Arrangements, NBER-EASE. Eds. Rakatoshi Ito and Anne O. Krueger. Chicago, IL: University of Chicago Press. 25-56. Print.
Weisbrot, Mark, David Rosnick and Dean Baker. 2004. “Getting Mexico to Grow with NAFTA:
The World Bank’s Analysis.” Center for Economic and Policy Research, Washington, DC. October. http://www.cepr.net/index.php/publications/reports/getting-mexico-to-grow-with-nafta-the-world-banks-analysis
Weisbrot, Mark and Rebecca Ray. 2011. “The Scorecard on Development, 1960-2010: Closing the
Gap?.” Center for Economic and Policy Research, Washington, DC. April. http://www.cepr.net/index.php/publications/reports/the-scorecard-on-development-1960-2010-closing-the-gap
WB (World Bank). 2014. “Research and development expenditure (% of GDP),” World
Development Indicators. Online database, consulted February 6, 2014.