
Did Domestic j~~~~~~IIS7a M4arginalize...Did domestic policies marginalize Africa in international...
44
j~~~~~~IIS Ib, m d Did Domestic 4Policies M4arginalize International Trade? lALwEXAND J YEATS i S l FRANCIS NG4'' Public Disclosure Authorized Public Disclosure Authorized Public Disclosure Authorized Public Disclosure Authorized
Transcript of Did Domestic j~~~~~~IIS7a M4arginalize...Did domestic policies marginalize Africa in international...
j~~~~~~IIS7a Ib, m dDid Domestic4Policies M4arginalize
International Trade?
lALwEXAND J YEATSi S l FRANCIS NG4''
Pub
lic D
iscl
osur
e A
utho
rized
Pub
lic D
iscl
osur
e A
utho
rized
Pub
lic D
iscl
osur
e A
utho
rized
Pub
lic D
iscl
osur
e A
utho
rized


DIRECTIONS IN DEVELOPMENT
Did Domestic Policies MarginalizeAfrica in Intemational Trade?
Alexander J. Yeatswith
Azita AmjadiUlrich Reincke
Francis Ng
The World BankWashington, D.C.
© 1997 The International Bank for Reconstructionand Development/ THE WORLD BANK
1818 H Street, N.W.Washington, D.C. 20433
All rights reservedManufactured in the United States of AmericaFirst printing January 1997
The findings, interpretations, and conclusions expressed in this study are entirelythose of the authors and should not be attributed in any manner to the WorldBank, to its affiliated organizations, or to members of its Board of ExecutiveDirectors or the countries they represent.
Alexander J. Yeats is principal economist, Ulrich Reincke is consultant, and FrancisNg is research analyst in the International Trade Division, International EconomicsDepartment, at the World Bank. Azita Amjadi is research analyst in the DevelopmentData Group, International Economics Department, at the World Bank.
Cover photo from The World Bank.
Library of Congress Cataloging-in-Publication Data
Yeats, Alexander J.Did domestic policies marginalize Africa in international trade? /
Alexander J. Yeats with Azita Amjadi, Ulrich Reincke, Francis Ng.p. cm.- (Directions in development)
Includes bibliographical references.ISBN 0-8213-3669-X1. Exports-Africa. 2. Africa-Commercial policy. 3. Agriculture and
state-Africa. 4. Africa-Commerce-OECD countries. 5. OECD coun-tries-Commerce-Africa.
I. TitleII. Series: Directions in development (Washington, D.C.)
HF3876.5.Y428 1997382'.096-dc2l 97-1459
CIP

Contents
Foreword v
Africa's Recent Export Performance 1
OECD Tariff Barriers Facing Africa 3OECD Regionalism and African Exports 5Tariffs: The Potential for Positive OECD Policy Action 8
OECD Nontariff Barriers Facing Africa 10Pre-Uruguay Round Nontariff Barriers 10Achievements of the Uruguay Round 12Appropriate OECD Policy Actions 15
Transport Costs for African Exports 17
Are Africa's Trade Policies the Problem? 21
Policy Implications 24
Appendix 25Table A.1. Pre- and Post-Uruguay Round OECD Nontariff
Barrier Coverage Ratios for Sub-Saharan African Countries 25Table A.2. Value, Share, and Changes in Sub-Saharan
Africa's Major Non-Oil Export Products in OECDMarkets, 1962-64 to 1991-93 26
Table A.3. Sub-Saharan African Countries' Paymentsfor Transport and Insurance, 1970, 1980, and 1990/91 28
Notes 30
References 33
iii

Foreword
In the mid-1950s Sub-Saharan Africa accounted for 3.1 percent of glob-al exports. By 1990 this share had fallen to 1.2 percent. Some analystsbelieve that external protection in OECD markets was a contributingfactor. If so, the solution to Africa's problems requires liberalization ofthese trade barriers. Another view is that Africa's marginalization wasdue primarily to inappropriate domestic policies that reduced theregion's ability to compete. If true, changes in Africa's own policies arerequired. The Development Economics Vice Presidency of the WorldBank is vitally concerned with this question since the accurate identi-fication of the factors contributing to Africa's diminished role in worldtrade is crucial to the formulation and implementation of correctivepolicy proposals.
One of the biggest challenges facing the international communitytoday is how to eradicate the extreme rural poverty that exists in mostSub-Saharan African countries. Since increased agricultural produc-tion for export could help improve the situation of the rural poor, it isof key importance that external and domestic barriers to this activitybe identified and removed. Furthermore, it is widely recognized thattrade can play the role of an "engine of growth" in the industrializa-tion process and that increased trade contacts could help Sub-SaharanAfrican countries more fully integrate with the global economy. Assuch, the question of what caused Africa's marginalization in worldtrade is of major importance.
This book analyzes and evaluates evidence concerning the influenceof external protectionism and Africa's domestic policies on the region'strade performance. By making this information available, we hope toboth focus and improve policies that are aimed at removing con-straints to the expansion of African exports.
Lyn SquireActing Vice President
Development Economiics and Chief Economist
v

Africa's Recent Export Performance
Sub-Saharan Africa's share of world trade has fallen dramatically overthe past thirty or forty years. 1 UNCTAD (1993a) reports that Sub-Saharan Africa's share of global exports went from 3.1 percent in 1955to 1.2 percent in 1990-a decline that implies annual trade losses ofroughly $65 billion (that is, exports would have been $105 billion in1990 instead of the actual $40 billion). Although the empirical evidenceof Africa's increasing marginalization in global trade is uncontested,there is less agreement about its causes. Some policymakers have sug-gested that OECD protectionism has played an important role. Manydevelopment economists, however, maintain that inappropriatedomestic policies greatly diminished Africa's ability to compete inter-nationally. Since these alternative explanations have very different cor-rective policy implications, it is important to determine which is basi-cally correct.
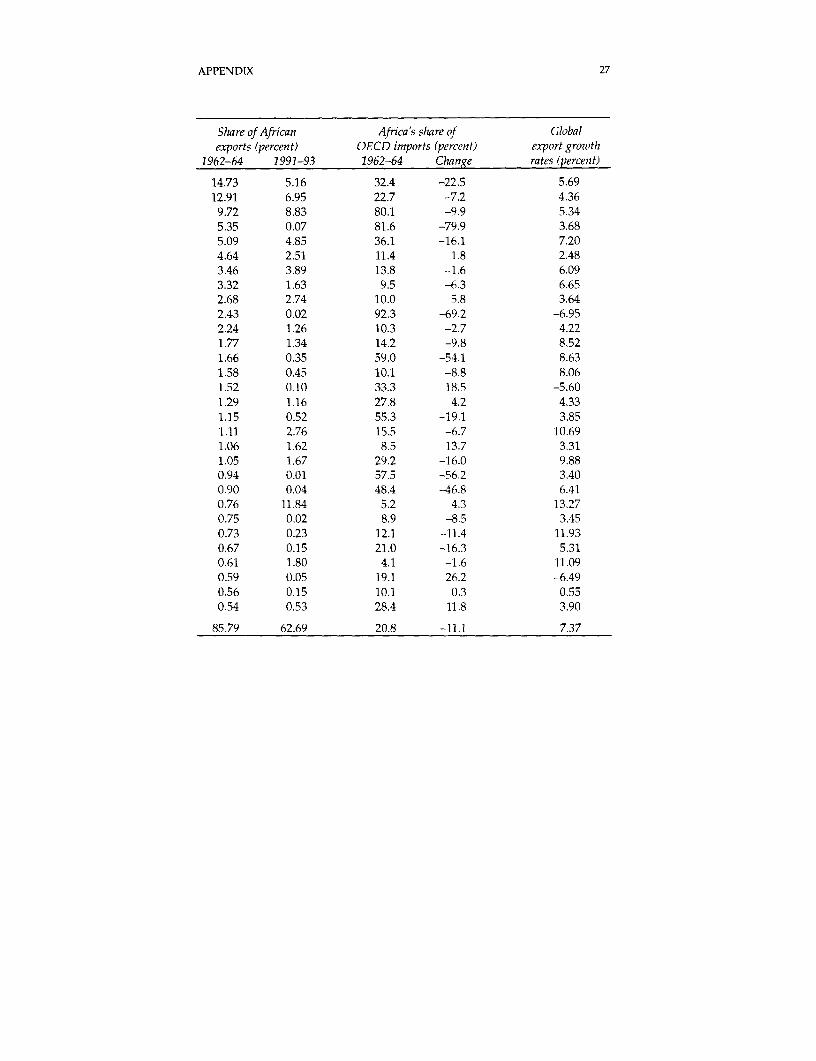
The most striking feature of Africa's performance in global tradesince the early 1960s is the major erosion in the region's ability to com-pete in international markets. For example, in 1962-64 copper alloyswere the region's single largest commodity export, with Sub-SaharanAfrica supplying 32 percent of all OECD imports. By 1991-93, howev-er, Africa's market share had dropped more than 22 percentage pointsto less than 10 percent. Similarly, Africa's market shares for other keycommodities (such as vegetable oils, palm oil, palm nuts and kernels,and groundnuts) dropped 47-80 percentage points below earlier lev-els. For the thirty most important non-oil exports combined, Africa'saverage share declined by more than 11 percentage points (from 20.8percent to 9.7 percent), which implies annual trade losses of about $11billion (appendix table A.2).2 That figure is almost equal to OECD offi-cial development assistance to Africa in 1991-$10.9 billion.
Another major adverse factor was the well below-average growth inglobal demand for these key commodities. From the early 1960s to the1990s world trade in nonfuel goods increased at a compound annualrate of 11.8 percent; for African products the rate was about 4.5 per-centage points lower (see appendix table A.2). Thus Africa suffered adouble blow-its inappropriate domestic policies led to declining mar-
1
2 DID DOMESTIC POLICIES MARGINALIZE AFRICA?
ket shares for its major export products that, in turn, were of decliningrelative importance in world trade. This finding highlights the needfor Africa to diversify out of traditional exports if the region'sincreased marginalization in global trade is to be reversed. There is,however, little evidence that this is happening. Indeed, exports arenow more concentrated in a few products than they were thirty yearsago (Ng and Yeats 1996).
OECD Tariff Barriers Facing Africa
Can Africa's poor export performance be attributed in any way toOECD trade barriers? Any assessment of the importance of tariffs iscomplicated by the widespread departure from the most-favored-nation (MFN) principle in trade regimes. In recent years these depar-tures have taken the form of regional trade preferences, such as theNorth American Free Trade Agreement (NAFTA). Developing coun-tries in Africa receive one of two general preferences: those theEuropean Union provides under the Lome Convention and thoseextended under the Generalized System of Preferences (GSP).3 ManyGSP schemes differentiate between developing countries and thosethat the United Nations designates as "least developed countries"(which are mostly African); even lower preferential tariffs are extend-ed to the least developed countries. 4
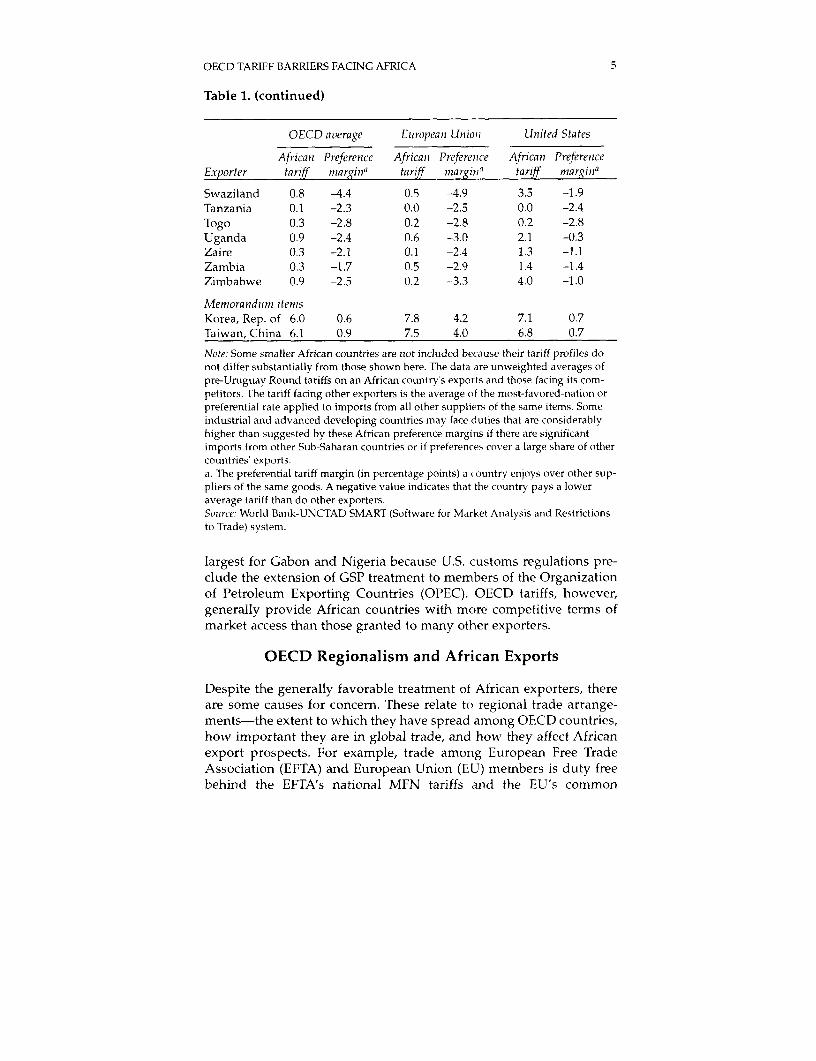
The OECD tariffs faced by African countries once preferences aretaken into account are shown in table 1; excluded are recently "tar-iffied" nontariff barriers. The table shows the average (unweighted)tariff on African exports along with the preference margin. For exam-ple, Angola faced European Union (EU) tariffs averaging 0.3 percent,3.2 percentage points less than those on all other exporters of the sameproducts. This margin should have enhanced Angola's ability tocompete with other exporters. Similar statistics for the Republic ofKorea and for Taiwan (China) are included to show the relative impor-tance of OECD tariff barriers facing African and Asian economies. Tohelp assess the importance of these duties as trade barriers, box 1 pro-vides information on the level of tariffs the Asian newly industrializedeconomies faced-and overcame-at the start of their successful andsustained export-oriented industrialization drive.
In Europe the average tariff facing Africa typically ranges from zeroto 0.3 percent, with Uganda recording a high of 0.6 percent-due main-ly to a duty of 18 percent on exports of fresh grapes. The average pref-erence margins African countries received are in the 2-4 percentagepoint range, reaching a high of 4.9 points for Swaziland. 5 Althoughmargins vary, all African countries faced average tariffs below those forother exporters. For some tariff-line level products these preferential
I

4 DID DOMESTIC POLICIES MARGINALIZE AFRICA?
margins were 20 percentage points or more below prevailing MFNduties. The newly industrialized economies of East Asia, by contrast,generally face unfavorable tariff margins.
Textiles and clothing played an important role in the early stages ofsome countries' industrialization, yet the United States failed to pro-vide African countries (even those classified as least developed) withany preferences for these goods. As a result African exports face tariffson some textile and clothing products that exceed 25 percent. Indeed,the average U.S. tariff is often higher than in Europe (for example, tar-iffs on Mauritius's exports to the United States average 6.4 percent),and the margins of preference are often lower. In some cases, as whenCanada and Israel had high volumes of exports to the United States,free trade arrangements with these countries resulted in a zero tariffbeing applied to competitors' products, resulting in a higher than aver-age duty for African exporters. Adverse African tariff differentials are
Table 1. OECD Tariffs on Africa's Non-oil Exports(percent)
OECD average European Union United States
African Preference African Preference African PreferenceExporter tariff nargina tariff margina tariff matrginaAngola 0.2 -1.5 0.3 -3.2 0.1 -0.4Botswana 0.3 -2.8 0.1 -2.9 3.5 -1.1Cameroon 0.4 -2.5 0.1 -2.8 2.1 -1.1Central African
Republic 0.2 -2.2 0.2 -2.3 9.0 -1.1Chad 0.4 -2.7 0.2 -2.9 1.6 0.0Congo 0.1 -1.4 0.0 -2.2 0.3 -0.6C6te d'lvoire 0.7 -3.1 0.3 -3.3 3.3 -2.0Ethiopia 0.7 -1.3 0.1 -1.9 2.0 0.4Gabon 0.6 -2.0 0.0 -2.7 2.9 0.7Ghana 1.0 -2.2 0.1 -3.1 2.6 -0.9Guinea 0.6 -3.3 0.0 -2.9 1.9 -1.0Kenya 0.5 -3.3 0.2 -3.5 3.1 -2.3Liberia 0.6 -1.7 0.3 -1.9 2.5 -1.1Madagascar 0.5 -2.0 0.4 -2.7 0.8 -1.0Malawi 1.1 -2.4 0.1 -3.5 5.4 -0.6Mali 0.4 -3.4 0.2 -3.5 3.1 -2.2Mauritania 1.7 -2.3 0.2 -3.9 1.2 -1.6Mauritius 1.3 -3.1 0.2 -3.4 6.4 -1.8Niger 0.1 -3.0 0.0 -3.0 3.3 -1.6Nigeria 2.7 -0.9 0.1 -2.6 5.2 0.7Senegal 0.5 -3.3 0.3 -3.5 4.9 -1.2Sierra Leone 0.5 -3.1 0.0 -4.0 2.3 -0.2Sudan 0.1 -1.5 0.1 -1.9 0.7 -1.0
OECD TARIFF BARRIERS FACING AFRICA 5
Table 1. (continued)
OECD average Eturopean Union United States
African Preference African Preferenice African PreferenceExporter tariff niargina tariff margin' tariff margin'
Swaziland 0.8 -4.4 0.5 -4.9 3.5 -1.9Tanzania 0.1 -2.3 0.0 -2.5 0.0 -2.4
Togo 0.3 -2.8 0.2 -2.8 0.2 -2.8Uganda 0.9 -2.4 0.6 -3.0 2.1 -0.3Zaire 0.3 -2.1 0.1 -2.4 1.3 -1.1Zambia 0.3 -1.7 0.5 -2.9 1.4 -1.4Zimbabwe 0.9 -2.5 0.2 -3.3 4.0 -1.0
Memorandutm itemsKorea, Rep. of 6.0 0.6 7.8 4.2 7.1 0.7
Taiwan, China 6.1 0.9 7.5 4.0 6.8 0.7
Note: Some smaller African countries are not included because their tariff profiles donot differ substantially from those shown here. The data are unweighted averages ofpre-Uruguay Round tariffs on an African country's exports and those facing its com-petitors. The tariff facing other exporters is the average of the most-favored-nation orpreferential rate applied to imports from all other suppliers of the same items. Someindustrial and advanced developing countries may face duties that are considerablyhigher than suggested by these African preference margins if there are significantimports from other Sub-Saharan countries or if preferences cover a large share of othercountries' exports.a. The preferential tariff margin (in percentage points) a country enjoys over other sup-pliers of the same goods. A negative value indicates that the country pays a loweraverage tariff than do other exporters.Source: World Bank-UNCTAD SMART (Software for Market Analysis and Restrictionsto Trade) system.
largest for Gabon and Nigeria because U.S. customs regulations pre-clude the extension of GSP treatment to members of the Organizationof Petroleum Exporting Countries (OPEC). OECD tariffs, however,generally provide African countries with more competitive terms ofmarket access than those granted to many other exporters.
OECD Regionalism and African Exports
Despite the generally favorable treatment of African exporters, thereare some causes for concern. These relate to regional trade arrange-ments-the extent to which they have spread among OECD countries,how important they are in global trade, and how they affect Africanexport prospects. For example, trade among European Free TradeAssociation (EFTA) and European Union (EU) members is duty freebehind the EFTA's national MFN tariffs and the EU's common
6 DID DOMESTIC POLICIES MARGINALIZE AFRICA?
Box 1. Tariffs Facing East Asian Exporters at the Start ofTheir Industrialization Drive Compared with Those FacingSub-Saharan Africa Today
The experience of the newly industrialized economies of East Asia showsthat they were able to overcome the external barriers they faced when theybegan their successful export-oriented industrialization drive. A compari-son of their experience with that of Africa today could shed light onwhether Africa's export problems are attributable largely to OECD coun-tries' protectionism or to African internal policies. Are the external condi-tions now facing Africa more or less favorable than those that faced the EastAsian economies in the mid-1960s?
In the late 1960s industrial countries' import duties on exports fromeconomies such as Hong Kong, the Republic of Korea, Singapore, andTaiwan (China) averaged about 17 percent, reaching a high of 19.5 percentin the United Kingdom (see box table). These tariffs also incorporated alarge degree of discrimination against developing countries, as reflected inthe higher than average tariffs on their exports. In addition, GSP schemeshad not yet been adopted, so the Asian economies had to compete withother suppliers on an equal MFN basis. Moreover, the degree of escalationin OECD tariffs was far greater than it is today (UNCTAD 1968; Yeats 1987).
By contrast, OECD tariffs on African exports now average less than 1percent and typically incorporate a preferential component that enhancestheir ability to compete with other countries. Thus Africa's poor export per-formance cannot be attributed to OECD tariffs.
Could it be that nontariff measures are more restrictive againstAfrican exports than they were against the East Asian economies?Evidence suggests the opposite. For example, the Short-Term TextileArrangement was initiated in 1961 and was followed by the Long-TermTextile Arrangement in 1962. Both placed important restrictions on East Asian
external tariff. Similarly, trade between EFTA and EU countries ismostly duty free under a special protocol. NAFTA provides Canada,Mexico, and the United States with duty-free access to one another'smarkets for most goods. Trade between Australia and New Zealand isalso duty free under a free trade arrangement. The combined size ofthese agreements is enormous. In Europe they cover more than a thirdof world trade in manufactures, while all such OECD arrangementscover almost half of world trade in these goods (Braga and Yeats1994).
The spread of OECD regional trade arrangements has markedlyaltered the relative conditions of market access extended to develop-ing countries. Specifically, a World Trade Organization (WTO) agree-ment on Differential and More Favorable Treatment, Reciprocity, andFuller Participation of Developing Countries makes developing coun-
OECD TARIFF BARRIERS FACING AFRICA 7
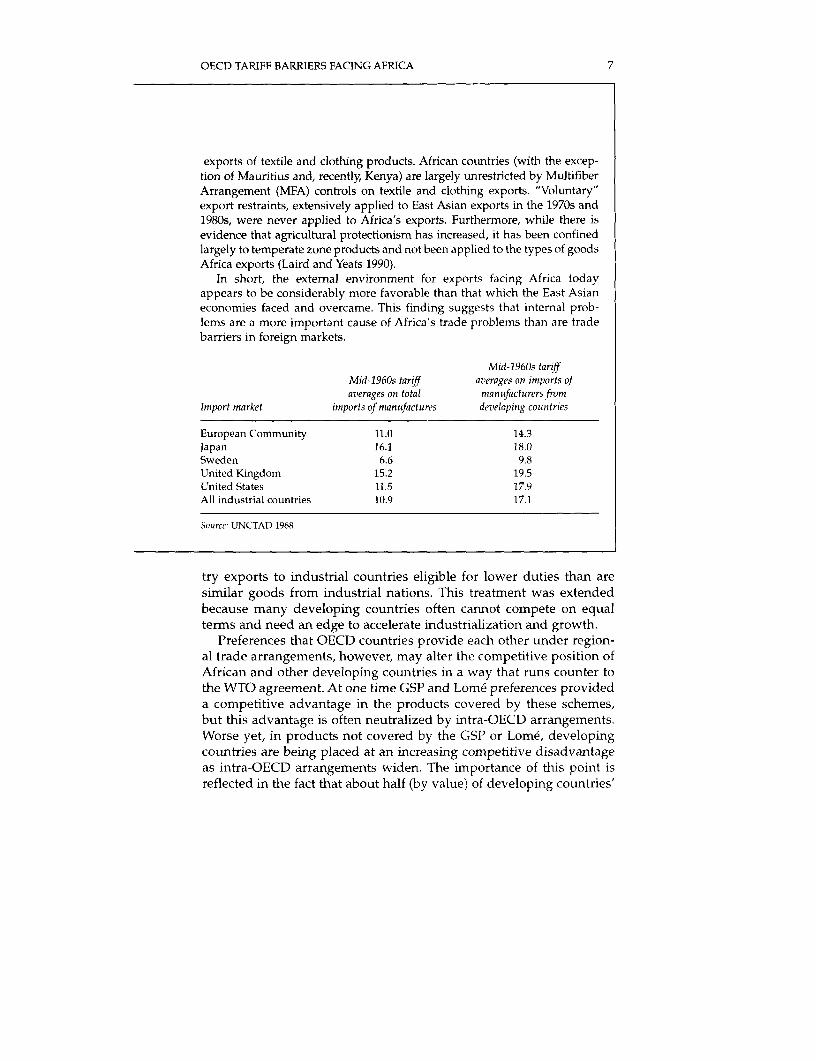
exports of textile and clothing products. African countries (with the excep-tion of Mauritius and, recently, Kenya) are largely unrestricted by MultifiberArrangement (MFA) controls on textile and clothing exports. "Voluntary"export restraints, extensively applied to East Asian exports in the 1970s and1980s, were never applied to Africa's exports. Furthermnore, while there isevidence that agricultural protectionism has increased, it has been confinedlargely to temperate zone products and not been applied to the types of goodsAfrica exports (Laird and Yeats 1990).
In short, the external environment for exports facing Africa todayappears to be considerably more favorable than that which the East Asianeconomies faced and overcame. This finding suggests that internal prob-lems are a more important cause of Africa's trade problems than are tradebarriers in foreign markets.
Mid-1960s tariffMid-1960s tariff azera7ges on imports ofaverages on total manufacturersfrom
Import market imports of manufactures developing countries
European Community 11.0 14.3Japan 16.1 18.0Sweden 6.6 9.8United Kingdom 15.2 19.5United States 11.5 17.9All industrial countries 10.9 17.1
Sotirce: UNCTAD 1968.
try exports to industrial countries eligible for lower duties than aresimilar goods from industrial nations. This treatment was extendedbecause many developing countries often cannot compete on equalterms and need an edge to accelerate industrialization and growth.
Preferences that OECD countries provide each other under region-al trade arrangements, however, may alter the competitive position ofAfrican and other developing countries in a way that runs counter tothe WTO agreement. At one time GSP and Lome preferences provideda competitive advantage in the products covered by these schemes,but this advantage is often neutralized by intra-OECD arrangements.Worse yet, in products not covered by the GSP or Lome, developingcountries are being placed at an increasing competitive disadvantageas intra-OECD arrangements widen. The importance of this point isreflected in the fact that about half (by value) of developing countries'

8 DID DOMESTIC POLIC[ES MARGINALIZE AFRICA?
exports of products in MFN dutiable product lines do not receive pref-erences. Among these are exports of agricultural products, foodstuffs,footwear, textiles, and clothing, which are placed at a competitivedisadvantage because of the high levels of MFN protection for thesegoods in some OECD markets.
Apart from direct trade losses, OECD arrangements have otheradverse implications for Africa. Exports from Africa are often highlyconcentrated in a few product lines, and an important objective is toexpand the export base. The problem is that the number of potentiallynew product lines for African countries has almost certainly beenreduced by the "special and differential" treatment OECD countriesprovide each other. Although few attempts have been made to quanti-fy the magnitude of these losses, the evidence suggests that they maybe large and growing (World Bank 1994b).
Tariffs: The Potential for Positive OECD Policy Action
Although Africa's disappointing trade performance cannot be attrib-uted to OECD tariffs, industrial countries could adopt initiatives thatshould have positive effects. These include proposals based on theCartegena Commitment adopted at the conclusion of UNCTAD VIII.Broadly, this agreement reaffirmed industrial countries' commitmentto provide "special and differential" treatment for developing coun-tries and to incorporate further improvements in established prefer-ences schemes. The following suggestions for OECD policy actions arein the spirit of this agreement:* Labor-intensive products such as textiles, clothing, and footwear
played a key role in the early stages of the transformation of thenewly industrialized economies and have a similar potential forAfrica. Where these products are excluded from preference schemes(as in the United States), they should be incorporated into estab-lished schemes.
* Since the exports of most African countries are concentrated inprimary commodities, natural resource-based industrializationstrategies could contribute to industrialization and growth. Wherefurther commodity processing appears suitable for developingcountries (that is, where labor-intensive production processes areinvolved), OECD preferences should be extended to processedproducts that now face MFN tariffs.6
* Ceilings and quotas should be eliminated from developing countrypreferences, or at least be made consistent with intra-OECD prefer-ences. Ceilings reduce the potential worth of the GSP to developingcountries since, aside from their direct trade effects, they introduceconsiderable uncertainty (that is, exporters may not know whether

OECD TARIFF BARRIERS FACING AFRICA 9
a shipment will qualify for GSP treatment until its arrival in theimport market).
* Until these objectives are fully realized, better statistical informationis needed on the constraints encountered in attempting to use pref-erence schemes. Details are needed on the extent to which quotasare exceeded (with the result that additional exports are taxed at theprevailing MFN rate) and the extent to which exports are disquali-fied because of existing rules of origin. Such information is crucialfor any proper assessment of the economic impact of preferences onthe receiving countries and for initiatives for improving theseprograms.

OECD Nontariff Barriers Facing Africa
Africa's poor export performance may not be due to OECD tariffs, butother forms of protectionism-such as quotas and restrictive licensingrequirements-may have an influence. To see whether this was so, it isnecessary to analyze the incidence of nontariff barriers facing Africaboth before and after the Uruguay Round, which made major changesin the ability of WTO members to use such restrictions.
Pre-Uruguay Round Nontariff Barriers
What do the available data tell us about the nature and extent of indus-trial country nontariff barriers? The shares of OECD imports fromother OECD countries, from developing countries, and from all Sub-Saharan African countries that encounter pre-Uruguay Round nontar-iff barriers are shown in table 2.7 These figures help determine whethernontariff restrictions had a discriminatory and unfavorable impact onAfrica.
OECD nontariff measures affect a notably higher share of importsfrom developing countries than of imports from other industrial coun-tries. About 17 percent of developing country exports (excluding petro-leum) encounter nontariff barriers; the corresponding share for tradebetween OECD countries is about 10 percent. An even greater differencein coverage ratios exists for several product groups. About 53 percent ofdeveloping country textile exports and about 63 percent of clothingexports face restrictions. In contrast, less than 5 percent of OECD intra-trade in textiles and clothing encounter nontariff restrictions. TheMultifiber Arrangement, special textile quotas, bilateral quotas, and vol-untary export restraints account for these major differences.8
For some product groups the pattern is reversed, and OECD non-tariff measures bear more heavily on members' exports. Some 25percent of OECD intra-trade in foods encounters nontariff barriers,compared with 17 percent for these goods from developing countries.This is because tropical food products like tea, coffee, and cocoa(which account for about 15 percent of developing country foodexports) face relatively few OECD nontariff barriers. Most nontariff
1(

OECD NONTARIFF BARRIERS FACING AFRICA 11
barriers are applied to temperate zone products (particularly grainsand dairy products), which are exported mainly by other OECD coun-tries and a few developing countries, like Argentina, outside the trop-ics. Sugar, which is produced in temperate zone countries (from beets)as well as in the tropics (from cane), is an exception.
The general impression from the data is that nontariff protectionagainst African exports is less restrictive than that facing other devel-oping countries and is about the same as that for intra-OECD trade.Only about 11 percent of African nonfuel exports face nontariff barri-ers, compared with 17 percent for all developing countries. Why thedifference? Largely because most African countries' textile and cloth-ing products are not affected by Multifiber Arrangement restrictions,and African exports of footwear are relatively small. One exception isMauritius, with 88 percent of its textile and clothing exports to theUnited States covered by textile quotas (Kenya also recently encoun-tered these measures). Only 19 percent of African textile exports facenontariff measures, compared with 53 percent for all developingcountries, and 45 percent of Africa's clothing exports, compared with63 percent for all developing countries.
Table 2. Coverage Ratios of Nontariff Barriers for OECD Importsfrom Industrial, Developing, and Sub-Saharan African Countries,1992
Product grouip Inmports ($million)(Standard International Industrial Developing Suib-SaharanTrade Classification) coutntries countries Africa
All nonfuel items (0 to 9-3) 1,900,481 540,783 25,137All food (0+1+22+4) 190,602 79,053 8,022
Food and live animals (0) 152,772 69,241 7,044Oil seeds and nuts (22) 5,849 2,509 72Animal and vegetable oils (4) 5,046 2,841 171
Agricultural materials (2-22-27-28) 53,386 20,303 2,719Ores and metals (27+28+67+68) 116,438 42,227 7,521
Ferrous metals (67) 55,326 11,294 1,097Nonferrous metals (68) 37,753 15,192 3,677
Mineral fuels (3) 86,298 164,851 19,654All manufactures (5 to 8-68) 1,499,800 383,871 6,524Chemicals (5) 216,755 22,039 769Other manufactures (6 to 8-67-68) 1,283,045 361,832 5,755
Leather (61) 5,004 3,749 237Textile yarn, fabric (65) 49,545 19,485 275Clothing (84) 43,250 79,659 1,019Footwear (85) 12,142 15,864 17
All items (0 to 9) 1,986,779 705,634 44,791
Table continues on next page.
12 DID DOMESTIC POLICIES MARGINALIZE AFRICA?
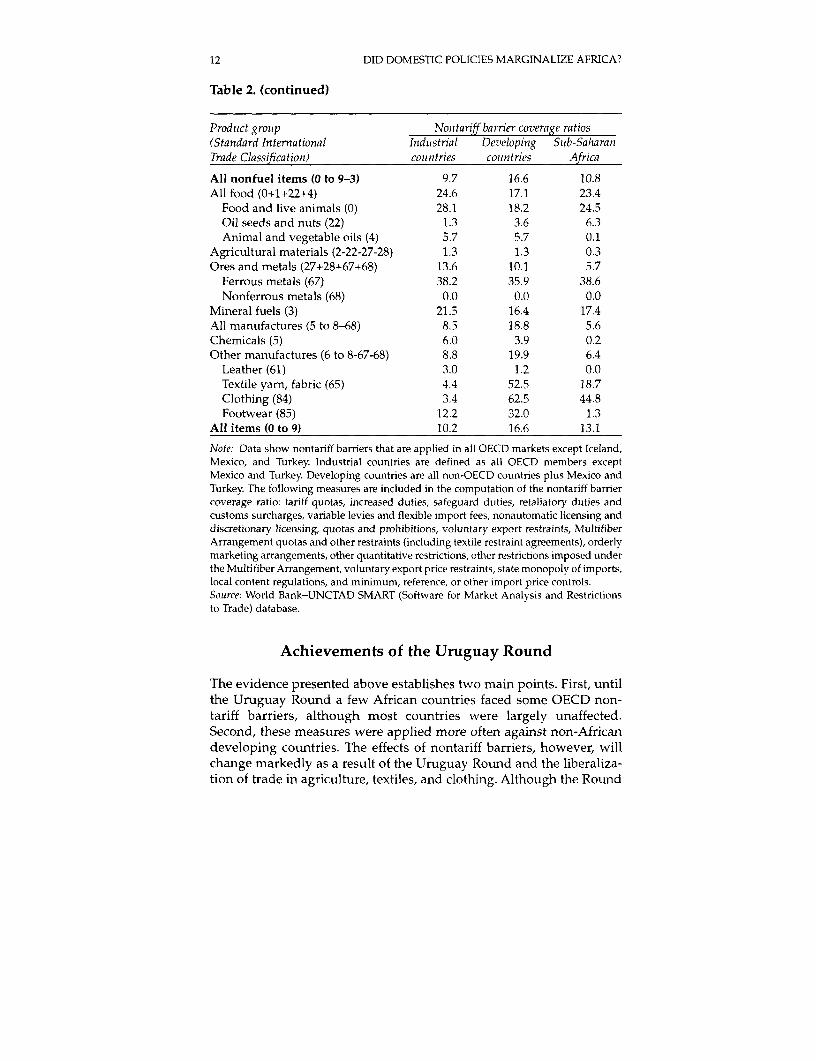
Table 2. (continued)
Prodtuct grotip Nontariff barrier coverage ratios(Standard International Indutstrial Developing Sutb-SaharanTrade Classification) couintries couintries Africa
All nonfuel items (0 to 9-3) 9.7 16.6 10.8All food (0+1+22+4) 24.6 17.1 23.4
Food and live animals (0) 28.1 18.2 24.5Oil seeds and nuts (22) 1.3 3.6 6.3Animal and vegetable oils (4) 5.7 5.7 0.1
Agricultural materials (2-22-27-28) 1.3 1.3 0.3Ores and metals (27+28+67+68) 13.6 10.1 5.7
Ferrous metals (67) 38.2 35.9 38.6Nonferrous metals (68) 0.0 0.0 0.0
Mineral fuels (3) 21.5 16.4 17.4All manufactures (5 to 8-68) 8.5 18.8 5.6Chemicals (5) 6.0 3.9 0.2Other manufactures (6 to 8-67-68) 8.8 19.9 6.4
Leather (61) 3.0 1.2 0.0Textile yam, fabric (65) 4.4 52.5 18.7Clothing (84) 3A4 62.5 44.8Footwear (85) 12.2 32.0 1.3
All items (0 to 9) 10.2 16.6 13.1
Note: Data show nontariff barriers that are applied in all OECD markets except Iceland,Mexico, and Turkey. Industrial countries are defined as all OECD members exceptMexico and Turkey. Developing countries are all non-OECD countries plus Mexico andTurkey The following measures are included in the computation of the nontariff barriercoverage ratio: tariff quotas, increased duties, safeguard duties, retaliatory duties andcustoms surcharges, variable levies and flexible import fees, nonautomatic licensing anddiscretionary licensing, quotas and prohibitions, voluntary export restraints, MultifiberArrangement quotas and other restraints (including textile restraint agreements), orderlymarketing arrangements, other quantitative restrictions, other restrictions imposed underthe Multifiber Arrangement, voluntary export price restraints, state monopoly of imports,local content regulations, and minimum, reference, or other import price controls.Source: World Bank-UNCTAD SMART (Software for Market Analysis and Restrictionsto Trade) database.
Achievements of the Uruguay Round
The evidence presented above establishes two main points. First, untilthe Uruguay Round a few African countries faced some OECD non-tariff barriers, although most countries were largely unaffected.Second, these measures were applied more often against non-Africandeveloping countries. The effects of nontariff barriers, however, willchange markedly as a result of the Uruguay Round and the liberaliza-tion of trade in agriculture, textiles, and clothing. Although the Round
OECD NONTARIFF BARRIERS FACING AFRICA 13
also reached agreement on the elimination of "voluntary" exportrestraints, these measures have not been applied to African exports.
Agriculture
After more than forty years during which agriculture was excludedfrom mainstream GATT rules, the Uruguay Round achieved a majorbreakthrough. Nontariff barriers to agricultural exports must be con-verted into ad valorem or specific tariffs as soon as the agreemententers into force. The resulting tariffs are to be legally bound by theWorld Trade Organization and reduced over six years.
The conversion of nontariff barriers under the "tariffication" exer-cise was based on the difference between internal and extemal pricesin 1986-88. The relevant calculations have been undertaken at thefour- or six-digit level of the Harmonized System. Tariff equivalentsfor most processed products were not calculated from direct pricecomparisons but were computed as an average of those for the com-ponent products weighted by their share in the final good. Because ofboth the base year chosen for the tariffication and the manner in whichthe calculations were undertaken, protection could increase in theshort term, but this protection should gradually decrease as a result oftariff reduction commitments (industrial countries will lower tariffs by36 percent over six years, while developing countries will stage reduc-tions of 24 percent over ten years). The Round also obtained commit-ments to reduce domestic agricultural support measures and exportsubsidies. These changes should increase export opportunities forAfrican countries and, given the destabilizing effects of many nontar-iff barriers (Amjadi and Yeats 1995), reduce the level of price changesin international markets for agricultural goods.
Textiles and Clothing
Discriminatory quantitative restrictions on imports of textiles andclothing have been widespread for more than thirty years, starting in1961 with the Short-Term Arrangement Regarding International Tradein Textiles. This was followed in 1962 by the Long-Term Arrangement,which lasted until 1974, when the first Multifiber Arrangement (MFA)was ratified. These arrangements have covered a growing number ofproducts over the years and have become increasingly restrictive(Laird and Yeats 1990).
The Agreement on Textiles and Clothing in the Uruguay Roundprovides for the elimination of MFA-type arrangements (that is, allnontariff barriers) over a ten-year period. This phaseout will involvethe progressive elimination of quantitative restraints by product

14 DID DOMESTIC POLICIES MARGINALIZE AFRICA?
category, combined with continuing quota expansion. Restrictionsmust be removed from products accounting for no less than 16 percent(in terms of 1990 volumes) of items covered by the MFA as soon as theagreement enters into force.9 There are then three more phases thattake effect at the beginning of the fourth and eighth years and end ofthe tenth year in which an additional 17 percent, 18 percent, and 49percent of the 1990 import volumes must be fully liberalized.
Implications for African Exports
How will the Round influence the level of nontariff protection facingSub-Saharan Africa, and what does it mean for the competitiveness ofAfrican exports? Amjadi and Yeats (1995) computed pre-UruguayRound nontariff barrier coverage ratios for each Sub-Saharan Africancountry and estimated what the ratio will be after the agreement isfully implemented. To more easily assess the impact of the Round,African countries were classified into one of four groups (highly, mod-erately, lightly, and largely unaffected by nontariff barriers) based ontheir pre-Uruguay Round coverage ratios (appendix table A.1).
For some highly affected countries the projected changes in non-tariff barrier coverage ratios are dramatic. Before the Uruguay Round83 percent of Reunion's exports (mostly sugar) faced OECD restric-tions. This ratio should fall to zero as a result of the agreement. Thecoverage ratio for Mauritius should decline by almost 60 percentagepoints (to just over 2 percent) after textile and clothing restrictions arelifted, while the tariffication of agricultural nontariff barriers willreduce Cape Verde's ratio from about 40 percent to zero. Overall, theshare of Africa's non-oil exports that face nontariff barriers should fallfrom roughly 11 percent to about 3 percent. In other words, nontariffbarriers had little adverse effects on African exports before the Round,and they will be even less important once the agreement is fullyimplemented.
For most African countries there will be only minor changes in mar-ket access conditions, due primarily to the low overall incidence ofpre-Uruguay Round nontariff barriers on their exports. Countries likethe Gambia, Ghana, and Mali were almost entirely unaffected by non-tariff barriers before the Round, so their direct export prospects cannotbe improved much-less than 0.5 percent of this "unaffected" group'sexports were subject to nontariff barriers. Indeed, such countries couldbe hurt by more aggressive competition from exporters who were for-merly restricted by the MFA or by voluntary export restraints. Evencountries like R6union and Mauritius, which previously had high non-tariff barrier ratios, may find themselves losing market share if theyare unable to adjust to the more competitive environment that will
OECD NONTARIFF BARRIERS FACING AFRICA 15
likely follow the removal of OECD nontariff barriers. The key point,however, is that OECD nontariff barriers (as well as OECD tariffs) arenot the cause of Africa's marginalization in world trade.
Appropriate OECD Policy Actions
OECD nontariff trade barriers constrain some African exports in a fewsectors but are not a general problem. With few exceptions, Africancountries do not face MFA restrictions and are not subject to any vol-untary export restraints. Similarly, in the 1980s only two OECDantidumping actions were taken against an African country (of 1,300such cases), and in only one case was a countervailing duty applied (of460 actions). Further evidence that nontariff protection is not responsi-ble for Africa's poor export performance is reflected in pre-UruguayRound nontariff barrier coverage ratios for the region's exports, whichwere about half those for the successful fast-growing developing coun-try exporters in East and South Asia.
The future influence of nontariff barriers on Africa is not clearbecause of the Uruguay Round and the extent to which OECD mem-bers may attempt to implement other measures (like antidumpingactions or safeguards) to circumvent the liberalization. There are, how-ever, policy options that could have positive implications for Africa:* The Uruguay Round converted agricultural trade barriers into tariffs
that may incorporate levels of protection of several hundred percent.Given Africa's problem of extreme rural poverty and the potentialcontribution that increased agricultural exports could make towardits reduction, policy initiatives are needed to reduce this protectionagainst African food exports. One option would be to extend (ceil-ing-free) preferences under established GSP programs.
e The Uruguay Round dramatically changed the nontariff barrierprotection facing developing countries. Statistics should be updatedto reflect the current (post-Uruguay Round) situation and to identi-fy remaining nontariff barriers that are of particular importance toAfrica (like those on fisheries and energy products). Moreover,monitoring mechanisms are needed to ensure that no legalized orother backsliding occurs in sectors were nontariff protection hasbeen relaxed.
* Developing country exports often have been undercut by subsidiesthat industrial countries employed to dispose of surpluses generat-ed behind high levels of external protection. Although the UruguayRound achieved some discipline in the use of such subsidies, it fellfar short of the initial objectives. Analyses should be undertaken todetermine where export incentives have had adverse effects onAfrica and what corrective policy actions could be implemented.
16 DID DOMESTIC POLICIES MARGINALIZE AFRICA?
* In many developing countries food security and spoilage are ofmajor importance. Since further processing (canning, drying,freezing, packaging) generally extends the usable life of a product,any external constraints to these activities should be removed. Inparticular, intra-OECD preferences under regional free trade agree-ments have increasingly disadvantaged African export-orientedfood processing industries. Measures are needed to at least placeSub-Saharan African countries on an equal competitive footing withOECD members.

Transport Costs for African Exports
Most analyses of developing country trade problems pay insufficientattention to transport costs. Although it is generally recognized thatdifferent barriers affect exports, most studies concentrate on such mea-sures as tariffs, quotas, and other government-imposed restrictions.Some economists, however, have suggested that even small variationsin international transport costs can have an important influence on thelocation of global production and export volumes.1 0 It is important,then, to determine whether adverse international freight costs andtransport problems have contributed to the relative decline of Sub-Saharan Africa in global trade.
Many African countries adopted anticompetitive cargo reservationpolicies to foster the development of national fleets and to conserveforeign exchange. Data on national flag registrations and African bal-ance of payments show that neither objective has been achieved. 11 Forexample, in 1990/91 Sub-Saharan Africa's net freight and insurancepayments were about $3.9 billion, or roughly 15 percent of the value ofthe region's exports, compared with 11 percent in 1970 (appendix tableA.1). Individual country statistics, however, show wide variations. Nettransport and insurance payments absorbed more than 25 percent ofthe value of exports for a third of African countries and exceeded 70percent for Somalia and Uganda. Net payments averaged 42 percentfor the landlocked African countries-almost 25 percentage pointshigher than the average for other African countries. The implication isthat a large share of Africa's foreign exchange earnings that might oth-erwise be used for productive capacity-building investments is beingused to pay for international transport services. Although self-suffi-ciency in transportation is not an appropriate policy objective formany African countries, there is clearly a need to focus on possible costsavings in transport.
Information on nominal freight rates (the ratio of transport andinsurance costs to the value of exports) can also indicate the influenceof these charges on Africa's commerce. Some countries, such as theUnited States, compile information on international transport andinsurance costs for all imports, by product and country of origin, with
17

18 DID DOMESTIC POLICIES MARGINALIZE AFRICA?
air and vessel shipments tabulated separately. 12 These data help pro-vide summary statistics on 1993 transport and insurance costs-whichhave trade effects similar to export taxes-for Sub-Saharan exports(table 3). Amjadi and Yeats (1995) provide further details concerningthese tabulations.
Africa generally is at an important transport cost disadvantage rel-ative to its competitors. For example, half the nominal vessel freightrates for middle-income West Africa are about 2 percentage pointshigher than those paid by other exporters of the same goods. To putthis in perspective, the Uruguay Round achieved an average 2.4 per-centage point reduction in industrial country tariffs. Moreover, inevery instance there is a larger adverse margin for air freight than forvessel shipments. African air transport, at first glance, appears to berelatively less cost efficient than vessel freight.13 Finally, the third-quartile values indicate that some African exports encounter very hightransport costs. About 25 percent of Africa's air exports have freightrates exceeding 26 percent, and a quarter of low-income West Africa'svessel shipments have nominal rates of more than 19 percent. UnlikeOECD tariffs or nontariff barriers, these comparisons clearly show thatinternational transport costs have a significant adverse impact onAfrican exports.
Table 3. Level, Range, and Distribution of African Nominal FreightRates for Exports to the United States, 1993
Transport Qutartile valutesRegion mode First Median Third
All Sub-Saharan Africa Air 5.3 14.1 26.5Vessel 4.6 7.5 13.8
Low-income East and Air 3.7 9.2 23.6Southern Africa Vessel 4.2 7.1 13.8
Low-income West Africa Air 3.7 20.5 35.6Vessel 3.5 9.3 19.4
Middle-income East Air 2.5 8.0 16.4and Southern Africa Vessel 3.8 6.2 8.9
Middle-income Air 7.3 13.3 24.2West Africa Vessel 4.9 10.0 12.8
Oil-exporting countries Air na na naVessel 9.2 11.3 17.2
Note: Trade flows of less than $50,000 have been excluded from these comparisons.Insufficient data exist to make meaningful air freight comparisons for the Africanoil-exporting countries. See World Bank 1995 for a listing of the African countriesincluded in each region.

TRANSPORT COSTS FOR AFRICAN EXPORTS 19
The structure of African transport costs also seems to have animportant adverse impact on the types of goods exported. Nominalfreight costs for many processed African commodities (such as cocoapowder or butter) are higher than those on the primary unprocessedcomponent (cocoa beans). Similarly, those on processed products suchas plywood and veneers are often higher than those on rough or sawnlogs. One reason for this structure of freight charges is the liner (ship-ping) conference practice of charging what the traffic will bear. Africancountries have legitimate reasons for wanting to shift to exports ofprocessed goods (greater price stability, job creation, higher exportearnings, and so on), but the structure of freight costs often worksagainst local processing of domestically produced commodities(Amjadi and Yeats 1995).
This raises two key questions. What factors account for the adverseAfrican transport costs, and what corrective policy measures are avail-able? Evidence suggests that the anticompetitive cargo reservationpolicies adopted by most African governments have had a majoradverse influence on freight costs.14 So, the answer is clearly deregu-lation. World Bank studies for other regions show that deregulatingand stimulating competition for shipping services may reduce freightrates in the liner trades by as much as 50 percent (Bennathan, Escobar,
African rmargin (percent)Range Mediana Range
0.5-87.4 3.5 -13.9-71.20.2-56.1 1.1 -5.8-39.9
0.7-56.9 4.4 -11.9-44.90.2-55.9 1.2 -5.8-22.8
0.4-92.6 7.4 -0.9-41.50.2-89.7 1.1 -6.1-84.5
0.9-29.7 0.9 -19.8-14.10.7-17.5 0.8 -4.3-7.0
0.4-43.1 3.0 -18.8-20.42.3-50.6 1.9 -4.0-17.3
na na na1.0-55.7 1.9 -7.2-29.6
a. Median transport costs are the difference between African freight rates and those oncompetitors' products. Positive values reflect adverse African transport costs.Source: U.S. Department of the Census data.
20 DID DOMESTIC POLICIES MARGINALIZE AFRICA?
and Panagakes 1989). This finding has far-reaching implications.African countries often have attributed their poor export performanceto foreign trade barriers despite the lack of corroborating evidence.Instead, as this analysis shows, attention should focus on the negativeimpact that Africa's own policies have on its export performance.
Many studies show that governments and traders have far morepolicy options for reducing transport costs than is generally recog-nized (UNCTAD 1975; Yeats 1985). These options include such mea-sures as cargo bulking (to achieve transport economies of scale),rationalizing shipping services and improving scheduling for liners,speeding up vessel turnaround, using lower-cost tramp services(where feasible), developing or improving coastal feeder services,adopting new transport technologies, promoting shippers associa-tions, and improving ports and storage facilities. The precise correctivemeasures, however, will require detailed analyses of African transportcosts and systems, both by country and by region.
In the interim, some OECD policy initiatives could help easeAfrica's international transport problems:* International shipping has undergone a major transformation in
which procedures for cargo unitization, port operations, and relat-ed logistics have evolved into highly complex operations requiringconsiderable technical expertise. Since most African countries havelimited access to such expertise, technical assistance programsshould be expanded and extended to related activities (such ascustoms clearance procedures) that impinge on the efficiency ofinternational transport operations.
* Because of insufficient attention and funds, many African countries'fleets, ports, and connecting inland transport infrastructure havedeteriorated or become technologically obsolete. OECD countriesshould sponsor a comprehensive survey of Sub-Saharan Africa'stransport problems along with policy proposals for their alleviation.
* The situation of landlocked African countries needs special atten-tion given the major problems these countries face in transiting theirneighbor's territories. A major effort should attempt to identify thespecial trade problems of the landlocked African countries and for-mulate policies to alleviate them.
Are Africa's Trade Policiesthe Problem?
Considerable evidence shows that trade policy reforms in developingcountries can contribute greatly to the acceleration of industrializationand growth (Thomas and Nash 1991; World Bank 1994a). Importrestrictions often create a bias against exports that prevents local entre-preneurs from capitalizing on export opportunities, and also preventsan economy from achieving otherwise attainable growth. 15 High tar-iffs and nontariff barriers can also significantly raise prices for pro-duction inputs in manufacturing and greatly diminish potentialexporters' ability to compete in foreign markets (Ng and Yeats 1996).Are Africa's trade policies a factor in its marginalization in worldtrade?1 6 World Bank data compiled by Ng and Yeats (1996) allow thisquestion to be addressed.
These data are used to compare average tariffs, nominal tariffs plusall other import charges, and nontariff barrier coverage for all importsinto Africa and other countries (table 4). One comparator groupconsists of developing countries that between 1962-64 and 1992-94achieved compound annual non-oil export growth rates at least onepercentage point greater than that for world trade. Trade of these fast-growing exporters expanded at annual rates ranging from 12.5 percent(Papua New Guinea) to almost 25 percent (Republic of Korea)-that is,from 2.3 to 4.6 times average African growth. Do the protectionist poli-cies of these superior export performance countries differ markedlyfrom those of Sub-Saharan Africa?
Clearly, African trade barriers are far more restrictive than those ofother countries. Tariffs average 26.8 percent-more than three timesthose of fast-growing exporters and more than four times the OECDaverage. Moreover, OECD members reduced tariffs by almost 40percent in the Uruguay Round (to about 3.9 percent), and many fast-growing exporters made important concessions. In contrast, Africa'strade barriers were virtually unchanged. As a result the spreadbetween Africa's tariffs (as well as tariffs plus other import charges)and those in the other countries has widened. This disparity will fur-ther worsen Africa's ability to compete in international markets.
21

22 DID DOMESTIC POLICIES MARGINALIZE AFRICA?
The use of nontariff protection has even more negative implications.More than one-third of all African imports encounter nontariffrestrictions (more than 40 percent for low-income African countries)-almost nine times the average (3.9 percent) for fast-growing exportersand thirteen times the average for high-income non-OECD countries.The detrimental impact of these nontariff barriers may be considerablygreater than that of tariffs. If foreign producers become increasinglyefficient relative to domestic African producers, they may be able to
Table 4. Trade Barriers in Africa and in Countries with the HighestNon-Oil Export Growth Rates
OECD imports OECD import growth rate,1992-94 1962-64 to 199 2-9 4b
Exporter" ($millions) (percent)
Sub-Saharan Africa 15,146 5.41Low-income Africa 11,433 5.21Middle-income Africa 3,713 6.08
Fast-growing exporters 271,157 16.77Korea, Rep. of 44,839 24.61Singapore 28,064 22.66Saudi Arabia 2,239 22.17Bahrain 471 20.62Taiwan, China 56,046 20.47Thailand 25,171 16.74Qatar 130 16.30Malaysia 26,336 16.26Indonesia 17,689 14.97Jordan 184 14.23Mexico 42,635 13.83Hong Kong 26,178 13.65Kuwait 179 12.93Papua New Guinea 996 12.50
High-income non-OECD 105,364 18.83
OECD countries 1,394,252 12.39
a. Several small island countries (St. Pierre, Malta, Comoros) achieved annual exportgrowth of more than 13 percent but were excluded from the table because their specialcharacteristics did not provide a useful basis for comparison with other countries.China achieved annual growth of more than 20 percent but was excluded because theU.S. export ban against China greatly depressed the 1962-.64 trade base, and under itsstate planning system tariffs and nontariff barriers are not of paramount importanceas import controls. This second point invalidates comparisons with the other countries.

ARE AFRICA'S TRADE POLICIES THE PROBLEM? 23
erode a tariff's protective effects over time. This would increaseAfricans' access to lower-cost foreign products, which would improveliving standards and the region's ability to compete in foreign markets.With nontariff barriers such as quotas, however, no such beneficialadjustment is possible because the volume of goods that can beimported is subject to fixed limits. Instead of potentially narrowingdifferentials (as with tariffs), the gap between Africa's living standardsand production efficiency will worsen relative to other countries.
Exporting coitntry's trade barriers(utnweighted averagesfor tariffs)
Tariff level All import charges Nontariff(percent) (percent) coverage ratio
26.8 33.4 34.128.6 34.3 40.620.9 30.1 12.5
8.7 11.1 3.711.1 12.3 2.60.4 0.4 0.3
12.1 12.1 3.97.1 7.1 1.59.7 9.7 11.28.5 8.5 5.54.2 4.2 1.3
12.8 17.6 2.117.0 20.1 2.713.8 28.0 12.913.4 16.9 3.90.0 0.0 0.54.2 4.2 3.57.0 14.2 2.6
3.4 3.4 4.0
6.1 6.1 3.8c
b. During 1962-64 to 1992-94 world trade in non-oil prodiucts, measured in currentprices, grew at a compound annual rate of 11.57 percent.c. As reported in Low and Yeats 1994; reflects the dismantling of OECD country non-
tariff barriers achieved in the Uruguay Round.
Source: UNCTAD 1987, 1994; GATT/WTO, Trade Policy Rceview Mecltanismn Reports, var-ious issues.

Policy Implications
What caused Africa's marginalization in world trade? There is littleevidence that it was government-imposed trade restrictions in OECDmarkets. The share of African exports subject to nontariff barriers is farlower than that of other developing countries that launched successfuland sustained export-oriented industrialization drives. Moreover, tar-iff preferences extended under the European Union's LomeConvention and under OECD members' Generalized System ofPreferences provide Africa with more favorable terms of market accessthan those granted to many other exporters of similar products. In con-trast, international freight costs and Africa's transport policies are hav-ing a major negative impact on the region's exports. In addition,African trade barriers are far more restrictive than those in countriesthat achieved high export growth, and incorporate a substantial anti-export bias. If Africa is to reverse its unfavorable export trends, it mustquickly adopt trade and structural adjustment policies that enhance itsinternational competitiveness and allow African exporters to capital-ize on opportunities in foreign markets. Undue delays in the adoptionof such measures will further add to adjustment costs and problems.In short, the future of African economies will be determined by Africa,not by outsiders.
24

APPENDIX 25
Appendix
Table A.1. Pre- and Post-Uruguay Round OECD Nontariff BarrierCoverage Ratios for Sub-Saharan African Countries
All goods All non-oil goods
Pre-Urngniay Projected Pre-Uruiguay ProjectedExporter Routnd change Routnd chan,ge
Highly affectedSeychelles 91.4 -6.7 91.4 -6.7Reunion 83.0 -83.0 83.0 -83.0Mauritius 61.6 -59.4 61.7 -59.4Cape Verde 39.5 -39.5 39.5 -39.5Congo 38.5 -0.5 3.8 -1.6Malawi 29.6 -25.9 29.6 -25.9Cameroon 20.8 -1.1 3.7 -2.1Zimbabwe 20.3 -13.4 20.5 -13.4
Moderately affectedSenegal 19.1 -19.1 19.1 -19.1Sao Tome & Principe 17.2 -14.5 17.5 -14.5Gabon 15.8 0.0 1.5 0.0Nigeria 14.4 0.0 1.0 -0.1C6te d'Ivoire 14.1 -12.6 14.4 -12.8South Africa 13.0 -9.3 11.5 -10.9Sudan 12.4 -8.3 12.4 -8.3Burkina Faso 12.3 -12.3 12.3 -12.3Mozambique 10.3 -9.7 10.3 -9.7Somalia 9.0 -9.0 9.0 -9.0Madagascar 7.6 -4.7 7.6 -4.7Djibouti 5.2 0.0 5.2 0.0Angola 4.7 0.0 1.2 -0.4Tanzania 3.8 -3.3 4.1 -3.3Kenya 3.5 -3.2 3.5 -3.2
Lightly affectedEthiopia 1.8 -0.6 1.8 -0.6Mauritania 1.3 -0.3 0.3 -0.3Guinea Bissau 1.3 -1.2 1.6 -1.2Benin 1.3 -1.0 1.5 -1.2Rwanda 1.1 -0.9 1.1 -0.9Zambia 0.7 -0.7 0.7 -0.7Comoros 0.6 0.0 0.6 0.0
Unaffecteda 0.0 0.0 0.0 0.0
a. Unaffected countries are Burundi, Central African Republic, Chad, the Gambia,Equatorial Guinea, Ghana, Guinea, Liberia, Mali, Niger, Sierra Leone, Togo, Uganda, andZaire. All have less than 0.5 percent of their total exports subject to nontariff barriers.Source: Amjadi and Yeats 1995.

26 DID DOMESTIC POLICIES MARGINALIZE AFRICA?
Table A.2. Value, Share, and Changes in Sub-Saharan Africa'sMajor Non-Oil Export Products in OECD Markets, 1962-64 to 1991-93
ValuieExport produict (Standard ($mnillion)International Trade Classification) 1962-64 1991-93
Unwrought copper alloys (682.1) 510.8 780.8Green or roasted coffee (071.1) 447.9 1,053.0Cocoa beans raw or roasted (072.1) 337.3 1,338.0Groundnuts green (221.1) 185.5 11.1Non-conifer saw logs (242.3) 176.6 734.2Raw cotton (263.1) 161.0 379.5Unmanufactured tobacco (121.0) 119.9 589.7Iron ore (281.3) 115.0 247.3Raw beet and cane sugar (061.1) 93.0 415.1Palm nuts and kernels (221.3) 84.2 2.6Natural rubber and gums (231.1) 77.8 191.1Fresh bananas (051.3) 61.3 202.8Palm oil (422.2) 57.5 53.0Vegetable oil residues (081.3) 54.7 68.7Agave fibers (265.4) 52.7 15.4Manganese ore (283.7) 44.8 176.2Groundnut oil (421.4) 39.9 78.2Shaped lumber (243.3) 38.6 418.1Tea (074.1) 36.7 246.0Base metals nes (689.5) 36.4 252.4Posts and poles (242.9) 32.5 1.4Fixed vegetable oils (422.9) 31.2 6.5Nonindustrial diamonds (667.2) 26.4 1,792.7Unwrought tin alloys (687.1) 26.0 2.9Inorganic bases (513.6) 25.2 35.3Industrial diamonds (275.1) 23.2 23.0Unwrought aluminum alloys (684.1) 21.3 272.0Tin ores (283.6) 20.4 6.9Crude asbestos (276.4) 19.3 23.3Natural gums and resins (292.2) 18.6 76.7
Total 2,975.7 9,495.6
Source: Ng and Yeats 1996.
APPENDIX 27
Share of African Africa's share of Globalexports (percent) OECD imports (percent) export growth
1962-64 1991-93 1962-64 Change rates (percent)
14.73 5.16 32.4 -22.5 5.6912.91 6.95 22.7 -7.2 4.36
9.72 8.83 80.1 -9.9 5.345.35 0.07 81.6 -79.9 3.685.09 4.85 36.1 -16.1 7.204.64 2.51 11.4 1.8 2.483.46 3.89 13.8 -1.6 6.093.32 1.63 9.5 -6.3 6.652.68 2.74 10.0 5.8 3.642.43 0.02 92.3 -69.2 -6.952.24 1.26 10.3 -2.7 4.221.77 1.34 14.2 -9.8 8.521.66 0.35 59.0 -54.1 8.631.58 0.45 10.1 -8.8 8.061.52 0.10 33.3 18.5 -5.601.29 1.16 27.8 4.2 4.331.15 0.52 55.3 -19.1 3.851.11 2.76 15.5 -6.7 10.691.06 1.62 8.5 13.7 3.311.05 1.67 29.2 -16.0 9.880.94 0.01 57.5 -56.2 3.400.90 0.04 48.4 -46.8 6.410.76 11.84 5.2 4.3 13.270.75 0.02 8.9 -8.5 3.450.73 0.23 12.1 -11.4 11.930.67 0.15 21.0 -16.3 5.310.61 1.80 4.1 -1.6 11.090.59 0.05 19.1 26.2 -6.490.56 0.15 10.1 0.3 0.550.54 0.53 28.4 11.8 3.90
85.79 62.69 20.8 -11.1 7.37

28 DID DOMESTIC POLICIES MARGINALIZE AFRICA?
Table A.3. Sub-Saharan African Countries' Payments for Transportand Insurance, 1970, 1980, and 1990/91
Exports of goods($million)
Country 1970 1980 1990/91
Totala 4,940.4 17,788.1 25,778.6Benin 58.0 164.0 291.4Burkina Faso 24.6 160.6 283.2Cameroon 218.7 1,657.5 1,841.2Central African Republic 43.4 147.2 150.5Chad 39.8 70.9 193.9Congo 122.2 910.5 1,135.7C6te d'Ivoire 497.1 3,012.7 2,803.9Ethiopia 122.3 419.1 301.7Gabon 173.7 2,084.4 2,272.9Gambia 17.8 2,084.4 2,272.9Ghana 427.0 48.3 110.6Kenya 285.5 1,103.6 890.6Liberia 394.4 1,261.4 1,053.7Madagascar 145.0 600.4 374.9Malawi 58.9 436.0 344.0Mali 32.9 280.7 297.0Mauritania 97.2 205.0 354.5Mauritius 69.8 196.3 447.9Mozambique na 433.7 1,194.5Niger 46.7 280.7 162.3Nigeria 1,248.0 576.1 283.9Senegal 158.7 25,934.3 12,254.0Sierra Leone 100.0 213.5 139.5Somalia 31.1 133.3 67.7Tanzania 245.9 582.7 407.8Togo 68.0 475.8 511.9Uganda 261.6 319.1 169.6Zaire 800.0 2,268.6 2,138.0Zambia 942.0 1,456.4 1,340.0Zimbabwe na 1,445.5 1,664.9
All developing countries 54,985 554,563 787,352Developing Asia 23,399 341,367 557,921Developing Americas 16,537 105,780 133,791
a. Excludes the oil-exporting countries (Angola, Congo, Gabon, and Nigeria). If 1990-91data are not available the latest annual statistics are shown.b. Mozambique had a surplus of $12.5 million on the freight and insurance account in1980.Source: UNCTAD 1993a.

APPENDIX 29
Netffreight and insurance Net ftreight payments as apayments ($mi1lion) share of exports (percent)
1970 1980 1990/91 1970 1980 1990/91
541.2 2,676.3 3,890.7 11.0 15.0 15.13.7 40.9 72.7 6.3 24.9 25.09.6 78.0 108.1 39.0 48.6 38.1
39.9 101.1 10.8 18.2 6.1 0.610.6 55.9 71.7 24.4 38.0 47.613.8 1.7 117.4 34.7 2.4 60.52.9 74.6 107.1 2.4 8.2 9.4
23.7 353.1 207.4 4.8 11.7 7.4
25.9 102.4 166.0 21.2 24.4 55.018.9 135.7 154.5 10.9 6.5 6.8
1.0 23.2 23.4 5.6 48.0 21.1
30.6 50.5 94.0 7.2 4.6 10.624.8 268.4 225.7 8.7 21.3 21.4
40.8 72.8 41.2 10.3 12.1 11.022.0 154.9 49.0 15.2 35.5 14.2
9.9 129.0 166.9 16.8 46.0 56.29.1 126.2 186.6 27.7 61.5 52.6
11.7 39.8 31.4 12.0 20.3 7.0
7.2 88.2 131.9 10.3 20.3 11.0na b 29.7 na b 18.3
13.1 106.8 58.7 28.1 18.5 20.784.0 722.3 1,024.0 6.7 2.8 8.3
19.5 110.0 151.0 12.3 26.1 18.8
10.5 39.9 21.9 10.5 18.7 15.65.7 57.1 51.7 3.2 42.8 75.5
27.2 162.8 165.5 11.1 27.9 40.6
7.5 87.8 68.8 11.0 18.5 13.4
26.6 54.7 120.6 10.2 17.1 71.1
90.0 283.7 292.0 11.3 12.5 13.7
84.0 201.7 161.0 8.9 13.8 12.0
na 61.0 102.6 na 4.2 6.2
4,307 34,311 46,016 7.8 6.2 5.81,952 20,746 92 8.3 6.1 -1,198 5,146 6,547 7.2 4.9 4.9

Notes
1. Sub-Saharan Africa is used to designate all countries in the African continentexcept Algeria, Morocco, Tunisia, Egypt, Libya, Sudan, and the Republic of South Africa.
2. OECD trade barriers probably played a positive role for the few products in whichAfrica increased its market share. The 5.8 percentage point increase in raw sugar shownin appendix table A.2 was the result of increasingly restrictive European Communityimport controls on other suppliers while African exporters (primarily Mauritius andReunion, which account for more than 90 percent of Sub-Saharan exports of raw sugar)had preferential market access and guaranteed market shares under the LomeConvention. In some cases, however, changes that appear to be positive actually havenegative implications. For example, most exporters of tin ores developed a capacity toexport processed tin products, leaving Africa as one of the few remaining suppliers ofthe unprocessed commodity. In other words Africa's market share increase was theresult of most other countries shifting to more profitable exports of processed tin and nota real increase in Africa's competitiveness.
3. Several points should be noted concerning GSP preferences. First, some agricul-tural and manufactured products are exempt from their coverage, and exports of thesegoods encounter MFN tariffs. The exemptions are significant-about 51.6 percent ofdeveloping countries' exports of products subiect to OECD MFN duties are affordedpreferences. But for various reasons (like preference ceilings or rules of origin) onlyabout half of GSP-eligible products receive this treatment. Thus preferential terms ofmarket access only apply to about one-quarter of developing countries' exports of goodssubject to MFN duties. Second, GSP treatment can be withdrawn from specific productsonce predetermined ceilings are reached. Third, several economies (Singapore, HongKong, and Taiwan, China) have been "graduated" from GSP schemes and no longerreceive preferences (it is unlikely this would happen to a country in Sub-Saharan Africain the foreseeable future). Other developing country suppliers may also have GSP pref-erences withdrawn if they fail "competitive need" tests, that is, they are judged able tocompete successfully with other suppliers without preferences.
4. Least developed countries in Africa are: Benin, Botswana, Burkina Faso, Burundi,Cape Verde, Central African Republic, Chad, Comoros, Djibouti, Equatorial Guinea,Ethiopia, Gambia, Guinea, Guinea-Bissau, Lesotho, Liberia, Madagascar, Malawi, Mali,Mauritania, Mozambique, Niger, Rwanda, Sao Tome and Principe, Sierra Leone,Somalia, Sudan, Togo, Uganda, Tanzania, Zaire, and Zambia.
5. Swaziland exports mandarin and other oranges to the European Union and paysa full MFN duty of 4 percent on shipments, as it does on exports of some fresh agricul-tural products (including asparagus, lemons, and other citrus). These products,however, are exceptions since deep preferences are given to most other exports.
6. According to Biggs and others (1996) the originating requirements under thefourth Lome Convention are so restrictive that some African exports covered by thisagreement are unable to take advantage of the preferences available. When an Africanexporter is unable to meet the originating requirements under Lome, the full tariff mustbe paid on the item (for example, a man's shirt) entering the European Union, while an
30
NOTES 31
exporter of the same item from (say) India or China only has to pay 85 percent of the tar-iff under the GSP. The GSP does not cover African exporters of these products becausethey are covered by Lome. Modifications to remove inconsistencies between the two EUpreference systems should benefit African countries.
7. Laird and Yeats (1990, chapter 4) describe how this inventory of nontariff measureswas constructed and discuss its limitations for research and policy studies. In particular,they note that trade coverage ratios are a rough approximation of the importance of non-tariff barriers in that they provide no indication of the restrictiveness of the measures.Low coverage ratios, for example, could be associated with highly restrictive nontariffbarriers, and vice versa. Laird and Yeats also provide extensive empirical information onthe results of nontariff barriers inventory studies for industrial countries. UNCTAD(1993b, p. 37) tabulates the annual share of developing countries' exports that encoun-tered nontariff measures over the last decade-it rose from 16.2 percent in 1981 to 18.3percent in 1991.
8. There is ample evidence showing that textile and footwear restrictions have majortrade-distorting effects on the exports of developing countries that face these measures. Forexample, the U.S. Intemational Trade Commission estimated tariff plus nontariff barrierprotection for fifty-four broad classes of textile and clothing products. The estimates rangeto more than 100 percent, with the nontariff barrier component of total protection general-ly being far higher than that of tariffs. European levels of nontariff protection against tex-tiles and clothing appear to be of a similar magnitude to those of the United States.
9. The agreement also establishes a transitional safeguard mechanism that allowsnontariff barriers to be used in certain circumstances. These safeguards can be applied ifincreased import volumes cause or threaten serious damage to the domestic industry,and they can be maintained for a maximum of three years. The safeguard is invoked ona country-by-country basis but can only be applied to products that have not yet beenintegrated into WTO rules (that is, products on which MFA-type quotas may still beapplied). A second restriction on the use of the special safeguard is that it cannot beinvoked on an eligible (nonintegrated) product if that item is already subject to an MFAquota in the market concerned.
10. In a Nobel symposium on the location of international economic activity, AssarLindbeck argued that "given other costs, firms chose between altemative internationallocations in order to minimize transport costs. These costs, therefore, may become lowprecisely because they have been highly important for location-high transport costlocations are avoided if other costs are equal." Similarly, Jagdish Bhagwati observed that"even if transport costs for any alternative location were a small proportion of totalproduct price, they could still affect location if they varied geographically more thanother costs of production" (Ohlin, Hesselborn, and Wijkman 1977, p. 276).
11. Differences in countries' payments ratios may reflect various factors, such as dif-ferences in the types of goods exported, geographic location, landlocked status, orwhether a country has a comparative advantage in shipping. However, World Bank stud-ies indicate that national policies that severely restrict competition for transport serviceshave a major adverse influence on freight rates (Bennathan, Escobar, and Panagakos1989). That African payment ratios differ significantly from other countries suggests moreattention should focus on the influence of the anticompetitive cargo reservation schemes.
12. These statistics do not incorporate the cost of inland transportation-which maybe high for some African countries-or port charges. The importance of port charges inAfrica should not be underestimated. For example, World Bank data compiled by TylerBiggs show port charges for clearing a twenty-foot container are $1,100 in Abidjan and$910 in Dakar. In contrast, the ocean freight cost for shipping the container to Hamburgand Le Havre ranges from $1,350-1,430.
13. There is a problem in the proper interpretation of these data since air freightshipments may go directly to interior U.S. markets and therefore avoid some inlandtransport costs in both the importing and exporting country Also, air freight may allow
32 DID DOMESTIC POLICIES MARGINALIZE AFRICA?
some African countries to avoid costly internal land transport if the servicing airfieldsare located close to the centers of production. In short, the air-vessel margin may signif-icantly overstate the true difference in transport costs for these alternative modes oftransport.
14. OECD (1992) provides an assessment of these anticompetitive practices and thecurrent situation regarding shipping in West and Central Africa: "In 1992, West andCentral African states showed no indication of liberalizing their protectionist shippingpolicies based largely on the unilateral interpretation of certain provisions of the UNLiner Code Convention. On the contrary there were various moves towards enactingexisting, but not yet implemented restrictive policies. These attempts met with oppositionby OECD member countries and their shipping lines which considered this as both pro-tectionist and discriminatory. However, the operation of some 50 shipping lines offeringregular services to West Africa from most ports of the world was not only hampered byprotectionism. Civil unrest, economic depression, a sharp increase in criminal activitiestowards vessels together with poor port management and severe and often discrimina-tory customs regulations were factors shipping lines had to struggle with" (p. 43).
15. For example, Sachs and Warner (1995) find that countries with open trade policyregimes in 1971-89 had average per capita GDP growth rates 2.5 percent a year higherthan countries with closed ones, and also had much greater success in shifting exportsfrom primary commodities to manufactures. Lee (1992) demonstrates a significantinverse relation between growth and tariff rates in developing countries. World Bank(1996, chapter 2) provides extensive empirical information showing that countries withliberal trade regimes experience superior export and economic growth rates.
16. Factors other than trade policy variables have contributed to Africa's marginal-ization in world trade. Collier (1995), for example, identifies political and policy uncer-tainty as a key factor along with a high-risk environment and a lack of serious govern-ment commitment to needed reform. Export taxes, smuggling, and false invoicing ofexports also have clear negative effects on trade performance.

References
Amjadi, Azita, and Alexander Yeats. 1995. "Nontariff Barriers Africa Faces: What Did theUruguay Round Accomplish and What Remains to be Done?" Policy Research Paper1439. World Bank, Washington, D.C.
Bennathan, Ezra , Luis Escobar, and George Panagakos. 1989. Deregulation of Shipping:What Is to be Learnedfrom Chile. World Bank Discussion Paper 67. Washington, D.C.
Biggs, Tyler, Gail R. Moody, Jan-Hendrik van Leeuwen, and E. Diane White. 1996. AfricaCan Cormpete! Export Opportunities and Challengesfor Garments and Home Products in theU.S. Market. World Bank Discussion Paper 242. Washington, D.C.
Braga, Carlos Primo, and Alexander Yeats. 1994. "Minilateral and Managed Trade in thePost-Uruguay Round World." Minnesota Journal of Global Trade 3 (2): 45-63.
Collier, Paul. 1995. "The Marginalization of Africa." International Labour Revyiew 134 (4-5):541-57.
Erzan, Refik, and Peter Svedberg. 1991. "Protection Facing Exports from Sub-SaharanAfrica." In Jonathan Frimpong-Ansah, ed., Trade and Development in Sub-SaharanAfrica. Manchester: Manchester University Press.
GATT (General Agreement on Tariffs and Trade). 1994 "Final Act Embodying theResults of the Uruguay Round of Multilateral Trade Negotiations." Marrakesh.
GATT/WTO (General Agreement on Tariffs and Trade/World Trade Organization).Various issues. Trade Policy Reviewo Mechanism Reports. Geneva.
Laird, Samuel, and Alexander Yeats. 1990. Quantitative Methodsfor Trade Barrier Analysis.London: Macmillan.
Lee, Jong-Wha. 1992. "International Trade Distortions and Long-Run EconomicGrowth." IMF Working Paper. International Monetary Fund, Washington, D.C.
Low, Patrick, and Alexander Yeats. 1994. "Nontariff Measures and DevelopingCountries." Policy Research Working Paper 1353. World Bank, Washington, D.C.
Ng, Francis, and Alexander Yeats. 1996. "What Caused Africa's Marginalization inWorld Trade? External Protection or Inappropriate Domestic Policies." World Bank,International Economics Department, International Trade Division, Washington,D.C.
OECD (Organization for Economic Cooperation and D)evelopment). 1992. MaritimeTransport 1992. Paris.
Ohlin, Bertil, Per-Ove Hesselborn, and Per Magus Wijkman, eds. 1977. The InternationalAllocation of Economic Activity: Proceedings of a Nobel Symposium Held in Stockholm.London: Macmillan.
Sachs, Jeffrey, and Andrew Warner. 1995. "Economic Reform and the Process of GlobalIntegration." Brookings Papers on Economic Activity. Washington, D.C.: BrookingsInstitution.
Thomas, Vinod, and John Nash. 1991. Best Practices in Trade Policy Reform. New York:Oxford University Press.
UNCTAD (United Nations Conference on Trade and Development). 1968. The KennedyRound: Estimated Effects on Tariff Barriers. New York: United Nations.
1975. Protection of Shippers Interests. TD/B/C.4/127. Geneva
33
34 DID DOMESTIC POLICIES MARGINALIZE AFRICA?
. 1987. Handbook of Trade Control Measures of Developing Countries: A StatisticalAnalysis. UNCTAD/DDM/Misc. 2. Geneva.
1993a. Handbook of International Trade and Development Statistics 1993. New York.. 1993b. Trade and Development Report 1993. Geneva.. 1994. Review of the Implementation, Maintenance, Improzvement and Utilization of the
Generalized System of Preferences. TD/B/SCP/6. Geneva.World Bank. 1994a. Adjustment in Africa: Reforms, Results, and the Road Ahead. A Policy
Research Report. New York: Oxford University Press.. 1994b. "Coping With Changes in the External Environment." Latin America and
the Caribbean Country Department III, Caribbean Division, Washington, D.C.. 1995. Global Economic Prospects and the Developing Countries 1995. Washington, D.C.. 1996. Global Economic Prospects and the Developing Countries 1996. Washington, D.C.
Yeats, Alexander. 1985. Shipping and Dezvelopment Policy: An Integrated Assessment. NewYork: Praeger Scientific Publishers.
. 1987. "Tariff Escalation." In J. M. Finger and Andrzej Olechowski, eds., TheUruguay Round: A Handbookfor the Multilateral Trade Negotiations. Washington, D.C.:World Bank.
. 1994. "What Are OECD Trade Preferences Worth to Sub-Saharan Africa?" PolicyResearch Working Paper 1254. World Bank, Washington, D.C.


R S t 8 8W ' It 1. 0 w K -
IS XS li £RS X N.W-
4iiot8 Dt .C. 2W'3, V,SA
g,*a "2) 477^123:0o @M'2
}*i {W0 24843 . t
dAA ADDY- _ , TW X |
{ 4 f /y,,wneS~~~~~~~~~~4
'rul/t IO s XI# ORV


![A arXiv:1807.08024v3 [cs.CV] 25 Feb 2019 · Ghahramani,2016). We marginalize out the masked region, conditioning the generative model on the ... [cs.CV] 25 Feb 2019. Published as](https://static.fdocuments.us/doc/165x107/5fd5857b559295709c48e34d/a-arxiv180708024v3-cscv-25-feb-2019-ghahramani2016-we-marginalize-out-the.jpg)