Dice Techsalarysurvey 2012
11
We’ve got your numbers. Dice Tech Salary Survey Results Released January 24, 2012 $97,800 $113,200 $86,600 $72,000 $68,900
-
Upload
bstanley346 -
Category
Documents
-
view
216 -
download
0
Transcript of Dice Techsalarysurvey 2012

8/2/2019 Dice Techsalarysurvey 2012
http://slidepdf.com/reader/full/dice-techsalarysurvey-2012 1/11
We’ve got
your numbers.Dice Tech Salary Survey ResultsReleased January 24, 2012
$97,800
$113,200
$86,600
$72,000
$68,900

8/2/2019 Dice Techsalarysurvey 2012
http://slidepdf.com/reader/full/dice-techsalarysurvey-2012 2/11
Dice Salary Survey MethodologyThe Dice Salary Survey was administered online with 18,325 employed technology professionals
responding between September 19 and November 21, 2011. Respondents were invited to
parcipate in the survey through a nocaon on the Dice home page, and registered technology
professionals were sent an email invitaon. A cookie methodology was used to ensure that there
was no duplicaon of responses between or within the various sample groups, and duplicate
responses from a single email address were removed.
Table of Contents
Five-year trend in tech salaries ................................... page 3
Bonus trend ................................................................. page 3
Salary by employment type ......................................... page 3
Markets with above average salary growth ................page 4
Salary sasfacon........................................................ page 4
Salary by experience.................................................... page 5
Salary by metro ........................................................... page 6
Salary by region ........................................................... page 6
Earning power by changing employers ....................... page 7
Salary by job tle......................................................... page 7
Salary for popular tech skills and experience .............. page 8
Salary by company size ................................................ page 10
Salary by educaon level............................................. page 10
Employee movators................................................... page 10
Biggest career concerns .............................................. page 11
Salary by industry ........................................................ page 11
$72,000Web
Developer

8/2/2019 Dice Techsalarysurvey 2012
http://slidepdf.com/reader/full/dice-techsalarysurvey-2012 3/11
Dice Tech Salary Survey ResultsReleased January 24, 2012
Tech professionals see pay jump.
Bonus popularity on the rise.
Technology professionals enjoyed their largest
annual salary growth since 2008, according to
the latest Dice Tech Salary Survey. Aer two
straight years of wages remaining nearly at, tech
professionals on average garnered salary increases
of more than 2%, boosng their average annualwage to $81,327 from $79,384 in 2010.
A more considerable jump was noted in both size of
average bonuses, up 8% to $8,769, and the number
of technology professionals receiving bonuses: 32%
in 2011, compared with 29% in 2010 and 24% in 2009.
The industries most likely to pay out bonuses: Telecom,
Hardware, Banking, Ulies/Energy and Soware.
“Finally! Compensaon has mustered some momentum,
as more and more top tech markets are notchingincreases in pay. Silicon Valley’s compensaon moved
rst and wrote the playbook for highly qualied tech
professionals to ask for more – whether that be in
Seale, Houston or Raleigh,” said Tom Silver, SVP, North
America at Dice. “The increasing popularity of bonuses
shows companies are rewarding their top performers. While everyone loves a bonus, anyone who
has been through a cycle knows that bonuses both reward and punish. In fast-changing markets, it’s
imperave for highly skilled tech professionals to capitalize on their career and compensaon opons.”
Page 3
$90,000
$80,000
$70,000
$60,0002007 2008 2009 2010 2011
$74,570
$78,035 $78,845 $79,384$81,327
Five-year trend in average U.S. tech salaries
Average salary by employment type
2010 2011 Yr/Yr Change
U.S. Average $79,384 $81,327 2.4%
Full-Time Workers $77,361 $78,308 1.2%
Consultant $98,266 $99,807 1.6%
Consultant (Base Rate Per Hour) $61.11 $62.55 2.4%
Tech professionals receiving bonuses
2010 2011
$8,120
$8,769
29%
32%
$109,000Data
Architect

8/2/2019 Dice Techsalarysurvey 2012
http://slidepdf.com/reader/full/dice-techsalarysurvey-2012 4/11
Six-gure Silicon ValleyIn Silicon Valley, annual tech salaries
topped six gures for the rst me
since the survey began about a
decade ago. The highest in the naon,
Silicon Valley’s annual salary of
$104,195, increased 5% year/year. In
addion, bonuses are both faer and
more frequent in Silicon Valley – with
38% of tech professionals receiving
bonuses at an average of $12,450.
While the Valley’s resurgence is well
documented, other tech markets didexceponally well too. In fact, 12 of
the top 20 cies for tech jobs had
above average wage growth. Ausn
had a 13% jump in pay to average
$89,419. Portland showed an annual
wage increase of 12% to $82,055;
Houston saw 7% growth ($89,307);
and Washington D.C./Balmore
experienced nearly 6% growth
($94,317).
Chicago and Seale each garnered
5% increases in average tech salaries,
Denver and Dallas/Ft. Worth managed
4% growth, while New York, Los
Angeles and Raleigh, North Carolina
each increased 3%.
“Convenonal wisdom says that
as Silicon Valley goes, so goes the
tech world. That’s true, and Silicon
Valley is going well, but it doesn’t
tell the enre story when it comes
to tech employment,” added Mr.
Silver. “Naonally, we’re seeing ser
compeon and higher salaries for
tech pros with the right skill sets and
the right experience level.”
Page 4
35%22%
14%
17%12%
Tech salary sasfacon
Top tech markets with above average salary growth
Neither SasedNor Dissased
Avg. Salary $79,677
Somewhat Dissased Avg. Salary $71,119
Somewhat Sased Avg. Salary $86,730
Very Sased Avg. Salary $99,622Very Dissased
Avg. Salary$59,354
Ausn
$89,419
Portland
$82,055
Houston
$89,307
Washington DC/Balmore
$94,317
Silicon Valley
$104,195
Chicago
$83,970
Seale
$90,362
Denver
Dallas/Ft Worth
$86,590
$84,589
New York
$90,042
Los Angeles
$87,183
Raleigh
$79,830
0 7% 14%
8/2/2019 Dice Techsalarysurvey 2012
http://slidepdf.com/reader/full/dice-techsalarysurvey-2012 5/11
Page 5
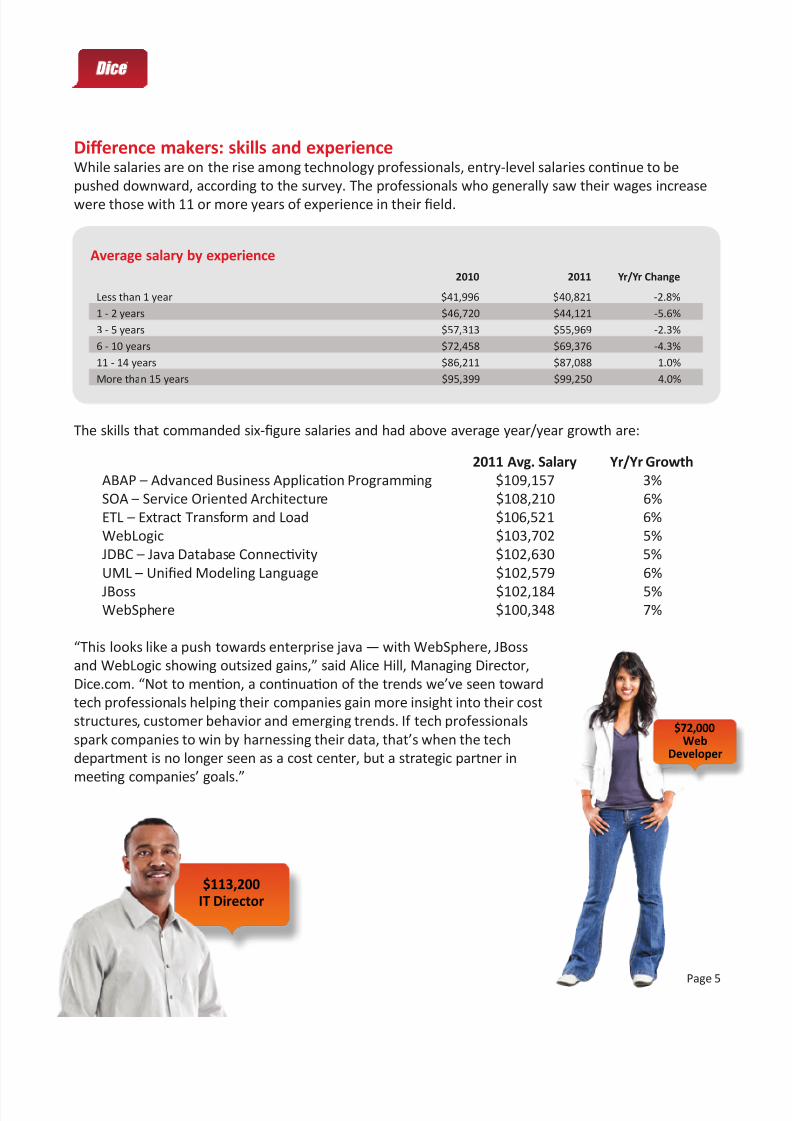
Dierence makers: skills and experienceWhile salaries are on the rise among technology professionals, entry-level salaries connue to be
pushed downward, according to the survey. The professionals who generally saw their wages increase
were those with 11 or more years of experience in their eld.
The skills that commanded six-gure salaries and had above average year/year growth are:
2011 Avg. Salary Yr/Yr Growth
ABAP – Advanced Business Applicaon Programming $109,157 3%
SOA – Service Oriented Architecture $108,210 6%
ETL – Extract Transform and Load $106,521 6%
WebLogic $103,702 5%
JDBC – Java Database Connecvity $102,630 5%
UML – Unied Modeling Language $102,579 6%
JBoss $102,184 5%WebSphere $100,348 7%
“This looks like a push towards enterprise java — with WebSphere, JBoss
and WebLogic showing outsized gains,” said Alice Hill, Managing Director,
Dice.com. “Not to menon, a connuaon of the trends we’ve seen toward
tech professionals helping their companies gain more insight into their cost
structures, customer behavior and emerging trends. If tech professionals
spark companies to win by harnessing their data, that’s when the tech
department is no longer seen as a cost center, but a strategic partner in
meeng companies’ goals.”
Average salary by experience
2010 2011 Yr/Yr Change
Less than 1 year $41,996 $40,821 -2.8%
1 - 2 years $46,720 $44,121 -5.6%
3 - 5 years $57,313 $55,969 -2.3%
6 - 10 years $72,458 $69,376 -4.3%
11 - 14 years $86,211 $87,088 1.0%
More than 15 years $95,399 $99,250 4.0%
$72,000Web
Developer
$113,200IT Director

8/2/2019 Dice Techsalarysurvey 2012
http://slidepdf.com/reader/full/dice-techsalarysurvey-2012 6/11
Page 6
Average salary by metro area
2010 2011 Yr/YrChange
Silicon Valley $99,028 $104,195 5.2%
Washington D.C./Balmore $89,149 $94,317 5.8%
Seale $86,168 $90,362 4.9%
New York $87,298 $90,042 3.1%
Ausn $79,375 $89,419 12.7%
Houston $83,625 $89,307 6.8%
Boston $86,782 $88,657 2.2%
Harord $81,172 $88,546 9.1%
Los Angeles $84,551 $87,183 3.1%
Sacramento $82,237 $87,114 5.9%
Denver $83,168 $86,590 4.1%
San Diego $85,617 $85,841 0.3%
Charloe $82,825 $84,795 2.4%
Dallas/Ft. Worth $81,579 $84,589 3.7%
Chicago $79,933 $83,970 5.0%
Atlanta $82,944 $82,235 -0.9%
Portland, OR $73,096 $82,055 12.3%
Philadelphia $81,986 $81,041 -1.2%
Minneapolis $81,683 $80,767 -1.1%
Raleigh $77,825 $79,830 2.6%
Miami $68,008 $77,960 14.6%
Columbus $74,615 $76,522 2.6%
Kansas City $66,878 $75,387 12.7%
Phoenix $77,141 $74,950 -2.8%
Tampa $69,711 $72,802 4.4%
St. Louis $71,539 $71,686 0.2%
Cincinna $69,610 $71,644 2.9%
Detroit $71,445 $71,455 0.0%
Cleveland $66,725 $68,519 2.7%
Pisburgh $65,449 $64,519 -1.4%
Average salary by region
2010 2011 Yr/Yr Change
Pacic (AK, CA, HI, OR, WA) $88,208 $91,102 3.3%
New England (CT, ME, MA, NH, RI, VT) $83,194 $86,324 3.8%
South Atlanc (DC, DE, FL, GA, MD, NC, SC, VA, WV) $79,150 $81,966 3.6%
Mid. Atlanc (NJ, NY, PA) $82,003 $81,938 -0.1%
Mountain (AZ, CO, ID, MT, NM, NV, UT, WY) $76,005 $78,272 3.0%
South Central (AL, AR, KY, LA, MS, OK, TN, TX) $73,951 $77,751 5.1%
North Central (IA, IL, IN, KS, MI, MN, MO, ND, NE, OH, SD, WI) $72,578 $73,762 1.6%

8/2/2019 Dice Techsalarysurvey 2012
http://slidepdf.com/reader/full/dice-techsalarysurvey-2012 7/11
Page 7
Average salary by job tle
2010 2011 Yr/Yr Change
IT Management (CEO, CIO, CTO, VP, Dir., Strategist, Architect) $112,386 $113,162 0.7%
Informaon Architecture $111,098 $112,670 1.4%
Systems Architect n/a $111,985 n/a
Data Architect $108,842 $108,961 0.1%
Project Manager $100,143 $104,398 4.2%
Security Engineer n/a $97,809 n/a
Developer: Systems $91,487 $95,664 4.6%
Network Design n/a $94,898 n/a
MIS Manager $89,142 $94,255 5.7%
Soware Engineer $89,419 $93,142 4.2%
Developer: Database $85,218 $92,662 8.7%
Database Administrator $88,443 $91,769 3.8%
Developer: Applicaons $85,075 $86,627 1.8%
Business Analyst $87,055 $85,979 -1.2%
Developer: Client/Server $84,909 $85,850 1.1%
Security Analyst $78,288 $78,396 0.1%
Programmer/Analyst $75,427 $76,965 2.0%
Technical Writer $72,512 $76,114 5.0%
Quality Assurance (QA) Tester $72,542 $75,498 4.1%
Network Engineer $70,681 $74,687 5.7%
Web Developer/Programmer $69,621 $71,962 3.4%
IT Technical Training $64,288 $69,123 7.5%
Systems Administrator $69,311 $68,900 -0.6%
Web Administrator n/a $65,192 n/a
Network Manager $60,134 $61,444 2.2%
Web Designer n/a $61,307 n/a
Technical Support $50,318 $50,913 1.2%
Desktop Support Specialist $48,247 $46,752 -3.1%
Help Desk $40,102 $40,245 0.4%
PC Technician $38,973 $37,236 -4.5%
26%
35%
38%
Within the next year, do you ancipate earning more money by changing
employers vs. staying where you are?
NoAvg. Salary $89,589N/A - Business owner
Avg. Salary $104,097 - 1%
YesAvg. Salary $75,140
Not sure - Don’t knowAvg. Salary $80,903

8/2/2019 Dice Techsalarysurvey 2012
http://slidepdf.com/reader/full/dice-techsalarysurvey-2012 8/11
Page 8
Average salary for popular tech skills and experience
2010 2011 Yr/Yr Change
ABAP - Advanced Business Applicaon Programming $105,887 $109,157 3.1%
SOA - Service Oriented Architecture $101,827 $108,210 6.3%CMMI - Capability Maturity Model Integraon n/a $107,558 n/a
ETL - Extract Transform and Load $100,983 $106,521 5.5%
Informaca $101,898 $104,223 2.3%
WebLogic $98,403 $103,702 5.4%
JDBC - Java Database Connecvity $98,100 $102,630 4.6%
UML - Unied Modeling Language $96,538 $102,579 6.3%
Azure n/a $102,510 n/a
JBoss $96,916 $102,184 5.4%
Fortran n/a $101,148 n/a
Scrum n/a $100,843 n/a
WebSphere $94,163 $100,348 6.6%
Glasssh n/a $100,226 n/a
SDLC - Systems Development Life Cycle $93,757 $99,802 6.4%
Business Intelligence $95,999 $99,763 3.9%
ERP - Enterprise Resource Planning $95,286 $99,668 4.6%
JSP - Java Server Pages $93,813 $99,656 6.2%
SOX - Sarbanes Oxley $95,439 $99,618 4.4%
Solaris $94,429 $99,493 5.4%
Agile n/a $99,299 n/a
FCoE - Fibre Channel over Ethernet $92,494 $98,894 6.9%
Teradata n/a $98,777 n/a
AIX $93,684 $98,608 5.3%
SOAP - Simple Object Access Protocol $97,929 $98,311 0.4%
ITIL - Informaon Technology Infrastructure Library $93,118 $98,159 5.4%
Korn Shell $96,886 $98,042 1.2%
Rexx n/a $97,611 n/a
Siebel $89,851 $97,528 8.5%
Change Management $91,263 $96,749 6.0%
HP-UX $92,662 $96,706 4.4%
SaaS - Soware as a Service $94,188 $95,998 1.9%
TOAD - Tool for Applicaon Developers $94,400 $95,813 1.5%
Tomcat $89,989 $95,677 6.3%
Sybase $92,855 $95,661 3.0%
Objecve C n/a $95,571 n/a
EMC $91,079 $95,563 4.9%
Data Warehouse $96,613 $95,287 -1.4%
Hitachi n/a $94,967 n/a
JD Edwards $91,786 $94,964 3.5%
Oracle DB $90,914 $94,897 4.4%
Amazon S-3 n/a $94,843 n/a
DB2 $89,159 $94,490 6.0%
Load Balancers n/a $94,367 n/a
Perl $94,210 $94,045 -0.2%
Cognos $87,383 $93,915 7.5%
MVS - Mulple Virtual Storage n/a $93,787 n/a
z/OS n/a $93,721 n/a

8/2/2019 Dice Techsalarysurvey 2012
http://slidepdf.com/reader/full/dice-techsalarysurvey-2012 9/11
Page 9
Average salary for popular tech skills and experience (connued)
2010 2011 Yr/Yr Change
Informix n/a $93,714 n/a
Six Sigma n/a $93,621 n/aC $90,346 $93,316 3.3%
Cloud Compung $88,995 $92,830 4.3%
PowerBuilder n/a $92,780 n/a
NetApp $87,920 $92,647 5.4%
Microso Project $88,816 $92,117 3.7%
Ruby on Rails $89,973 $92,020 2.3%
Salesforce.com n/a $91,846 n/a
Wan Opt n/a $91,830 n/a
Java/J2EE $91,060 $91,728 0.7%
Fibre Channel $87,161 $91,598 5.1%
Visual C++ $88,227 $91,311 3.5%
Postgres n/a $91,276 n/a
Red Hat $88,223 $90,915 3.1%
IMS - IP Mulmedia Subsystem n/a $90,898 n/a
PL/SQL $89,742 $90,834 1.2%
PCI - Peripheral Component Interconnect n/a $90,716 n/a
SAP $87,350 $90,357 3.4%
QA / Quality Assurance $86,456 $90,217 4.4%
CRM - Customer Relaonship Management $88,602 $90,205 1.8%
Unied Communicaons $89,862 $90,183 0.4%
C# $85,501 $89,996 5.3%
Tivoli n/a $89,965 n/a
C++ $86,648 $89,862 3.7%
Amazon Web Services n/a $89,833 n/a
Visio n/a $89,802 n/a
MPLS - Mul Protocol Label Switching $89,476 $89,731 0.3%
Python $90,208 $89,474 -0.8%
Compellent n/a $89,463 n/a
Ajax $85,016 $89,410 5.2%
Shell $88,918 $89,372 0.5%
TSO/ISPF $84,503 $89,190 5.5%
Unix n/a $89,065 n/a
Disaster Recovery $85,460 $89,053 4.2%
CICS - Customer Informaon Control System $85,581 $88,950 3.9%
vCloud n/a $88,854 n/a
Oracle Applicaon Server $88,063 $88,850 0.9%
SharePoint / Frontpage $84,747 $88,296 4.2%
SUSE $85,032 $88,292 3.8%
Metro Ethernet $84,100 $88,261 4.9%
Telepresence $89,217 $88,243 -1.1%
XML - eXtensible Markup Language $87,022 $88,093 1.2%
RPG n/a $87,990 n/a
COBOL $85,847 $87,882 2.4%
CL n/a $87,759 n/a
HIPAA n/a $87,727 n/a
Lawson n/a $87,681 n/a

8/2/2019 Dice Techsalarysurvey 2012
http://slidepdf.com/reader/full/dice-techsalarysurvey-2012 10/11
Page 10
Average salary by educaon level
2010 2011 Yr/Yr ChangeVocaonal/Tech School $60,116 $59,729 -0.6%
Some College $69,927 $72,197 3.2%
College Graduate (4-Year) $78,788 $81,536 3.5%
Master’s Degree $93,465 $98,911 5.8%
Doctoral Degree $100,120 $112,775 12.6%
Average salary by company size
2010 2011 Yr/Yr Change
Less than 50 employees $69,658 $69,424 -0.3%
50 - 99 employees $71,264 $73,249 2.8%
100 - 499 employees $74,906 $76,739 2.4%
500 - 999 employees $77,433 $77,602 0.2%
1,000 - 4,999 employees $81,203 $82,860 2.0%
5,000 or more employees $88,075 $90,533 2.8%
What was the primary movator your employer provided you in 2011?
38%
None - No motivator provided
Other
More interestingor challengingassignments
Increasedcompensation
Flexiblework hours
Promotion or new title
Training andcertification courses
High level recognition - 1%
N/A - Business owner - 1%
18%
16%
11%
5%
4%
6%
$68,900Systems
Administrator

8/2/2019 Dice Techsalarysurvey 2012
http://slidepdf.com/reader/full/dice-techsalarysurvey-2012 11/11
Page 11
About DiceDice, a Dice Holdings, Inc. service, is the leading career site for technology and engineering
professionals. With a 21-year track record of meeng the ever-changing needs of technology
professionals, companies and recruiters, our specialty focus and exposure to highly skilled
professional communies enable employers to reach hard-to-nd, experienced and qualied
technology and engineering candidates. www.Dice.com
12150 Meredith Drive | Urbandale IA | 50323 | 1 800 979 DICE(3423) | Dice com
©Dice. All rights reserved.
For 2012, what’s the biggest concern you have about your career?
Finding an appropriate new posion for my skill set 19%
Keeping skills up-to-date / being valuable to employer 15%Posion eliminaon 14%
Increased workload 13%
No concerns at this me 11%
Lower salary increases / lower billing rates 10%
Cancelled projects / fewer projects 8%
Increased outsourcing 5%
Posion relocaon 2%
Other 3%
$86,600ApplicatonDeveloper
Average salary by industry2010 2011 Yr/Yr Change
Bank / Financial / Insurance $88,553 $91,267 3.1%
Aerospace & Defense n/a $88,232 n/a
Computer Soware $83,724 $86,708 3.6%
Medical / Pharmaceucal / Biotechnology n/a $84,361 n/a
Telecommunicaons $82,420 $83,748 1.6%
Government n/a $79,605 n/a
Healthcare Providers n/a $79,200 n/a
Computer Hardware $75,426 $78,789 4.5%
Manufacturing $74,900 $78,053 4.2%
Internet Services $76,898 $75,495 -1.8%
Retail / Mail Order / E-Commerce $75,047 $75,495 0.6%