
Diameter growth performance of tree functional …mu2126/publications_files/Adame et al...Diameter...
12
Introduction For the last fifty years, humans have converted tropical forested landscapes to a wide variety of uses with unprecedented consequences for biodiversity, climate, and other ecosystem services (Lambin and Geist, 2006). Of the many land-cover changes tropical forests are experiencing, one of most significant to ecosystem service provisioning and human well being is the large increase in the extent of secondary forests. The area of degraded and secondary forests in the tropics was recently estimated at 850 million hectares, and this amount is likely to increase dramatically in the future (ITTO, 2002). These forests provide many of the services attributed to primary forests including regulation of water flow and quality, erosion control, carbon sequestration, and timber and non-timber forest products (Chazdon, 2003; Guariguata and Ostertag, 2001; ITTO, 2002). In spite of their increasing extent, dominance, and prevalence in tropical countries, the processes of tropical forest recovery and succession are not well characterized (Chazdon, 2003). Understanding the factors that control tree growth in successional stands is particularly important for quantifying the carbon sequestration potential and timber yield of secondary tropical forests (Baker et al., 2003). Tree growth integrates competitive interactions for resources between trees at the stand level (Uriarte et al. 2004), and suitability of local environmental conditions for a given tree species ( i.e. , niche partitioning) (Keddy, 1989; Whittaker, 1975). Teasing apart the importance of local and regional processes in explaining intra- and interspecific variation in tree growth is critical to the development of sustainable management of forest ecosystems, particularly in mixed-species and uneven-aged stands (Canham et al., 2006). Diameter growth performance of tree functional groups in Puerto Rican secondary tropical forests Patricia Adame 1, 2 *, Thomas J. Brandeis 3 and Maria Uriarte 1 1 Department of Ecology. Evolution and Environmental Biology. Columbia University. 1200 Amsterdam Ave. New York. NY 10027, USA 2 Departamento de Selvicultura y Gestión Forestal CIFOR-INIA. Ctra. A Coruña, km 7,5. 28040 Madrid. Spain 3 USDA Forest Service. Southern Research Station. Forest Inventory and Analysis. 4700 Old Kingston Pike. Knoxville, TN 37919, USA Abstract Aim of study: Understanding the factors that control tree growth in successional stands is particularly important for quantifying the carbon sequestration potential and timber yield of secondary tropical forests. Understanding the factors that control tree growth in successional stands is particularly important for quantifying the carbon sequestration potential and timber yield of secondary tropical forests. Yet, the high species diversity of mixed tropical forests, including many uncommon species, hinders the development of species-specific diameter growth models. Area of study: In these analyses, we grouped 82 species from secondary forests distributed across 93 permanent plots on the island of Puerto Rico. Material and Methods: Species were classified according to regeneration strategy and adult height into six functional groups. This classification allowed us to develop a robust diameter growth model using growth data collected from 1980-1990. We used mixed linear model regression to analyze tree diameter growth as a function of individual tree characteristics, stand structure, functional group and site factors. Main results: The proportion of variance in diameter growth explained by the model was 15.1%, ranging from 7.9 to 21.7%. Diameter at breast height, stem density and functional group were the most important predictors of tree growth in Puerto Rican secondary forest. Site factors such as soil and topography failed to predict diameter growth. Key words: Caribbean forests; growth model; tropical forest succession; Puerto Rico. * Corresponding author: [email protected] Recibido: 17-10-12. Aceptado: 05-09-13. Instituto Nacional de Investigación y Tecnología Agraria y Alimentaria (INIA) Forest Systems 2014 23(1): 52-63 Available online at www.inia.es/forestsystems ISSN: 2171-5068 doi: http://dx.doi.org/10.5424/fs/2014231-03644 eISSN: 2171-9845
Transcript of Diameter growth performance of tree functional …mu2126/publications_files/Adame et al...Diameter...

Introduction
For the last f ifty years, humans have convertedtropical forested landscapes to a wide variety of useswith unprecedented consequences for biodiversity,climate, and other ecosystem services (Lambin andGeist, 2006). Of the many land-cover changes tropicalforests are experiencing, one of most signif icant toecosystem service provisioning and human well beingis the large increase in the extent of secondary forests.The area of degraded and secondary forests in thetropics was recently estimated at 850 million hectares,and this amount is likely to increase dramatically inthe future (ITTO, 2002). These forests provide manyof the services attributed to primary forests includingregulation of water flow and quality, erosion control,carbon sequestration, and timber and non-timber forest
products (Chazdon, 2003; Guariguata and Ostertag,2001; ITTO, 2002). In spite of their increasing extent,dominance, and prevalence in tropical countries, theprocesses of tropical forest recovery and successionare not well characterized (Chazdon, 2003).
Understanding the factors that control tree growthin successional stands is particularly important forquantifying the carbon sequestration potential andtimber yield of secondary tropical forests (Baker et al.,2003). Tree growth integrates competitive interactionsfor resources between trees at the stand level (Uriarteet al. 2004), and suitability of local environmentalconditions for a given tree species (i.e., nichepartitioning) (Keddy, 1989; Whittaker, 1975). Teasingapart the importance of local and regional processesin explaining intra- and interspecific variation in treegrowth is critical to the development of sustainablemanagement of forest ecosystems, particularly inmixed-species and uneven-aged stands (Canham et al.,2006).
Diameter growth performance of tree functional groups in Puerto Rican secondary tropical forests
Patricia Adame1, 2*, Thomas J. Brandeis3 and Maria Uriarte1
1 Department of Ecology. Evolution and Environmental Biology. Columbia University. 1200 Amsterdam Ave. New York. NY 10027, USA 2 Departamento de Selvicultura y Gestión Forestal CIFOR-INIA.
Ctra. A Coruña, km 7,5. 28040 Madrid. Spain 3 USDA Forest Service. Southern Research Station. Forest Inventory and Analysis. 4700 Old Kingston Pike. Knoxville, TN 37919, USA
Abstract
Aim of study: Understanding the factors that control tree growth in successional stands is particularly important forquantifying the carbon sequestration potential and timber yield of secondary tropical forests. Understanding the factorsthat control tree growth in successional stands is particularly important for quantifying the carbon sequestrationpotential and timber yield of secondary tropical forests. Yet, the high species diversity of mixed tropical forests,including many uncommon species, hinders the development of species-specific diameter growth models.
Area of study: In these analyses, we grouped 82 species from secondary forests distributed across 93 permanentplots on the island of Puerto Rico.
Material and Methods: Species were classified according to regeneration strategy and adult height into six functionalgroups. This classification allowed us to develop a robust diameter growth model using growth data collected from1980-1990. We used mixed linear model regression to analyze tree diameter growth as a function of individual treecharacteristics, stand structure, functional group and site factors.
Main results: The proportion of variance in diameter growth explained by the model was 15.1%, ranging from 7.9to 21.7%. Diameter at breast height, stem density and functional group were the most important predictors of treegrowth in Puerto Rican secondary forest. Site factors such as soil and topography failed to predict diameter growth.
Key words: Caribbean forests; growth model; tropical forest succession; Puerto Rico.
* Corresponding author: [email protected]: 17-10-12. Aceptado: 05-09-13.
Instituto Nacional de Investigación y Tecnología Agraria y Alimentaria (INIA) Forest Systems 2014 23(1): 52-63Available online at www.inia.es/forestsystems ISSN: 2171-5068doi: http://dx.doi.org/10.5424/fs/2014231-03644 eISSN: 2171-9845
The island of Puerto Rico has experienced multiplecycles of deforestation and forest recovery in the pasttwo centuries (Lugo et al., 1981). Deforestation inPuerto Rico was rapid during the 19th century, withdeforested area peaking in the middle of the 20thcentury, as sugarcane became the dominant cash crop(Franco et al., 1997). Forest cover reached a low of 6%in the late 1940s and then rose to 32% of the island’sarea by 1990 (Birdsey and Weaver, 1982), with totalforest area increasing from 279,000 hectares in 1980to 287,000 hectares in 1990 (Franco et al., 1997) andreaching 510,157 ha in 2003 (Brandeis et al., 2007).As a result of these historical processes, the present dayPuerto Rican landscape is a fragmented, dynamicmosaic of shifting land uses (Grau et al., 2003). Assuch, it contains a range of secondary forest patches ofdifferent ages, and therefore stand structure andcomposition, distributed across a number of environ-mental gradients (Brandeis et al., 2007; Helmer et al.,2008). This landscape provides an unparalleledopportunity to examine the influence of environmentaland stand scale level drivers on forest biomass recovery.
The study of tree growth in tropical forests ischallenging (Parresol, 1995). These ecosystems cancontain a large number of tree species but the majorityof them occur at low densities (Terborgh, 1993).Characterization of growth dynamics for the highdiversity of species often requires repeated census datafrom multiple permanent forest plots, a challengingand time consuming task. Even with a large amount ofdata from multiple plots, the number of observationsfor uncommon species is often not suff icient forreliable parameter estimation. One solution is toclassify tree species into a smaller number offunctional groups, thus increasing the size of thesample used for parameter estimation (Gourlet-Fleuryet al., 2005). Historically, forest modelers have used avariety of grouping criteria including taxonomicaffinity, ecological guilds, similar growth dynamics,and several statistical approaches (see review inVanclay (1994)). Such groups provide practical andmeaningful classifications of tropical forest species,which are needed both by foresters, for modelinggrowth and yield, and by ecologists, to explain the lifehistory diversity in tropical forest trees. By recognizinggroups of species that share suites of covaryingcharacteristics we may be able to scale-up from thewell-studied responses of few species, to modelcommunity- or stand-level responses to perturbationssuch as climate change or tree harvesting (Vanclay,
1994). The main purpose of recognizing aggregationsof traits in life histories is thus to provide a semi-quantitative foundation for these practical objectives,while in practice most ecologists emphasize continuarather than discontinuities in the spectrum of lifehistories of coexisting species.
Permanent plot data from National Forest Inventories(NFI) typically cover large geographic areas andprovide some of the best coverage of the full range ofvariability with respect to management treatments, sitequality, forest structure, and tree species. Many treediameter growth models have been fitted using nationalforest inventory data (Andreassen and Tomter, 2003;Lessard et al., 2001; Monserud and Sterba, 1996;Wykoff, 1990). The sampling methodology of manyNFI datasets, however, was not specifically designedto develop growth and yield models and, in some cases,may lead to errors in diameter growth estimates (e.g.,Trasobares et al., 2004). By assuming that measurementerrors occur randomly in the data, however, the largesample should compensate for this def iciency(Monserud and Sterba, 1996).
In this paper, we use data collected by the US ForestService Forest Inventory and Analysis Program in 93permanent plots in Puerto Rico between 1980 and 1990to examine the diameter growth of functional groupsof tropical trees in relation to individual tree, stand andenvironmental characteristics. To this end, we f irstclassify 1,142 trees from 81 species into 6 functionalgroups based on regeneration strategy (shadeintolerant/shade tolerant dichotomy) and adult height.Second, we use linear mixed model regression toidentify individual, stand, functional group andenvironmental drivers of tree growth.
Materials
Study area
Puerto Rico is a mountainous Caribbean island(latitude range: 17°45’N to 18°30’N; longitude range:66°15’W to 67°15’W) that stretches 160 km east towest and 55 km north to south. The trade windsapproach the island from the northeast and as a resultof encountering the mountains create a distinctprecipitation gradient with areas in the southwestreceiving less than half the annual rainfall (~750 mm)than areas in the northeast (~1,500-2,000 mm). Meanannual temperatures range between 19.4 to 29.7°C with
Diameter growth performance in Puerto Rican secondary tropical forests 53

cooler temperatures occurring at higher elevations(Daly et al., 2003). The steep climate gradient, a largeelevation range, and a complex geology have generatedstriking environmental variation within the island.Puerto Rico contains six Holdridge life zones:Subtropical moist forests account for 62% of PuertoRican forests, subtropical wet forests and rain forestcombined covers 23%, subtropical dry forest 14%, andcombined subtropical lower montane wet and rainforest slightly over 1% (Ewel and Whitmore, 1973;Holdridge, 1967). Vegetation ranges from dry, semideciduous forests in patches and bands on the northand east coasts and in the southwest part of the island,to moist forests that cover the major proportion of theisland, and wet and rain forests, including cloudforests, at higher elevations (Daly et al., 2003).
Plot data
In 1980, the US Forest Service’s Forest Inventoryand Analysis (FIA) program and International Instituteof Tropical Forestry (IITF) conducted a forest inventoryof the Commonwealth of Puerto Rico. This inventoryhad the primary objective of assessing the timberproduction potential of the island’s forests (Birdsey andWeaver, 1982). The plots were systematically spacedacross the island on a 3 × 3 km grid design (900 ha persquare). Areas that were excluded from the inventoryincluded public forests, floodplains, urban develop-ment, mangrove forests, critical watersheds with highrainfall, dry subtropical life zones, and areas withpoorer soils, or steep slopes (i.e., >60%). Permanentplots were installed in 2 of 6 forested Holdridge zonesthat were considered to have potential for commercialproduction: subtropical moist and subtropical wetforests. The island’s forests were re-surveyed in 1990,re-measuring 93 plots from the 1980 set using the samemethodology (Franco et al., 1997).
For each of the 93 plots, we assessed a number ofbiophysical variables including climate, topography, andsoils. Climate variables values were assigned of thenearest weather station from 47 National WeatherService cooperative stations (Daly et al., 2003).Precipitation and elevation were used as drivers underthe assumption that cooler temperatures and relativelyhigh precipitation in the higher elevations may acceleratebiomass accumulation relative to warmer areas (Daly etal., 2003). However, high levels of precipitation and lowtemperature can also lead to soil saturation and low
physiological activity leading to lower tree growth ratesat higher elevation (Silver et al., 1999). Average annualprecipitation (mm), was calculated from data collectedfor the years 1963 to 1995.
Trees may grow faster on slopes facing moisturebearing wind, which in Puerto Rico tend to face north-northeast (Daly et al., 2003; Weaver, 1991). We used30 × 30 m SRTM elevation data from USGS tocalculate aspect. Tree growth may also proceed fasterin fertile relative to poor soils. To evaluate the effectof soil fertility on tree growth, we used soil agriculturalcapacity, a measure of agricultural suitability.Agricultural capacity data group soils into classesaccording to several criteria including erosion andmoisture retention potential, soil depth, and presenceof toxic salts, with one being the most fertile and tenbeing least fertile (USDA, 2007).
Tree data
Growth data used in this study are from 1,142 treesidentif ied and measured in the 93 plots. Each plotcontained a 3 point cluster with the points being 25 mapart. Each point consisted of two f ixed plot radiustallies where all saplings from 2.5 to 12.5 cm weremeasured and recorded, and a variable plot tally usinga 2.5 m Basal Area Factor (BAF) prism where all “in”trees 12.5 cm and larger were measured and recorded.In addition diameter and crown class (emergent,dominant, co-dominant, intermediate, or overtopped)of all trees were recorded, as well as taxonomic identityand height. For the analyses presented here we useddiameter growth increments between the 1980 and1990 censuses as the response variable. To assess thepotential effect of tree competition on tree growth weused the measure of tree basal area in each plotobtained using the BAF prism as well as crown classof the focal tree. Crown class categories werereclassified as upper-canopy (emergent, dominant andco-dominant) and subordinate (intermediate andovertopped) for the analyses.
Methods
Definition of functional groups
Plant functional types (PFTs) are non-phylogeneticgroupings of species that show close similarities in
54 Patricia Adame et al. / Forest Systems (2014) 23(1): 52-63

their resource use and response to environmental andbiotic controls (Wilson, 1999). To classify species intogroups or guilds imposes a degree of simplificationwhich reduces information content, but reveals generalpatterns and facilitates predictions about forestdynamics processes.
For our study, species were grouped on the basis oftwo criteria: regeneration strategy (shade intolerant/shade tolerant dichotomy) and adult height, defined asaverage maximum tree height (Baker et al., 2003;Kariuki et al., 2006; Swaine and Whitmore, 1988).Shade intolerants (I) are species whose seeds can onlygerminate in open canopy gaps while shade tolerantspecies (T) are those that can germinate and grow inthe shade. Species were further classified using adultheight as a criterion into small (S) (<10 m), medium(M) (10-25 m) and large (L) (>25 m) classes. Adultheight represents the vertical space occupied by theadult, an ecologically meaningful metric (Alder, 1995).Classif ication along these two axes resulted in6 groups (Tables 1 & 2). Data on regeneration strategyand adult height were obtained from the NaturalResources Conservation Service (USDA, 2010b),Forest Service (USDA, 2010a), and Little andWadsworth (1964). We then used ANOVA to identifywhether these groups exhibited different mean growth.
Diameter growth model
Our growth model assumes that each species has amaximum potential growth rate, which is adjusted toaccount for (1) the characteristics of the focalindividual tree; (2) the structure and composition ofthe stand, including potential metrics of standdevelopment and competition between trees;(3) functional group; and (4) habitat (site) variables.Using this rationale, we divided explanatory variablesinto five groups:
1. Single-tree variables: diameter at breast height(d, cm), height (h, m), and crown class of the focal tree(upper-canopy or subordinate).
2. Stand variables: mean diameter (Dm, cm),density (N, trees/ha), and basal area (BA, m2/ha).
3. Single tree competition: basal area of all treeslarger than the focal tree within the plot (BAL, m2/ha),and the relation of diameter at breast height and meansquared diameter (d / Dm
2, cm–1).4. Functional group: large shade tolerants (LT),
large shade intolerants (LI), medium shade tolerants
(MT), medium shade intolerants (MI), small shadetolerants (ST), and small shade intolerants (SI).
5. Site variables: elevation (m), aspect (%), meanannual rainfall (mm), and soil fertility class.
Different forms of diameter growth were consideredfor the dependent variable: diameter increment(D 2 – D 1) , 10-year diameter g rowth rate(Drate = [(D2 – D1) / D1)] and square diameter incre-ment (D2
2 – D12). We log transformed diameter growth
with three objectives: i) to make the error variancesmore nearly homogeneous; ii) to improve additivity;iii) to produce a more nearly normal error distribution(Finney, 1989). Since the dependent variable is trans-formed prior to estimation, there is an inherent negativebias in the method. To account for this bias, we applied
the empirical bias corrector suggested by
Snowdon (1991), where id10 is the mean of measureddiameter increments for ten year period (d2 – d1) andid�
10 is the mean of estimated diameter increments. Toobtain normally distributed residuals with constantvariance and to address the existence of negative orzero growth, we added 1 to each growth observationbefore applying the logarithm transformation (Hökkäet al., 1997).
We f itted a mixed linear regression model to thediameter growth data using the covariates describeabove (Laird and Ware, 1982). Plot was included in theanalysis as a random effect added to the interceptparameter. Models parameters were estimated usingREML to derive unbiased estimates of the variance andcovariance parameters associated with random effects.Independent variables to be included in the functionwere selected through visual analysis of data plotsversus explanatory variables and a backward selectionprocedure. The most appropriate model wasdetermined from residual analyses, Akaike informationcriterion (AIC), and coefficient of determination (R2)values. All analyses were conducted using R statisticalsoftware (R Development Core Team, 2009).
Results
We classified 81 species into six functional groupsusing regeneration strategy and adult height (Table 2).As expected, average diameter growth for shadetolerant groups (LT, MT, and ST) was lower than for
id
id10
10exp ln
�⎡⎣
⎤⎦
Diameter growth performance in Puerto Rican secondary tropical forests 55

56 Patricia Adame et al. / Forest Systems (2014) 23(1): 52-63
Table 1. Functional groups defined on the basis of regeneration strategy and adult height of thespecies. Family is provided in parenthesis
Large shade tolerant species (LT)
Dacryodes excelsa (Bursereaceae) Manilkara bidentata (Sapotaceae)Hymenaea courbaril (Fabaceae) Micropholis guyanensis (Sapotaceae)
Large shade intolerant species (LI)
Andira inermis (Fabaceae) Nectandra turbacensis (Lauraceae)Cinnamomum elongatum (Lauraceae) Sloanea berteriana (Elaeocaopaceae)Guarea guidonia (Meliaeceae) Spathodea campanulata (Bignoniaceae)Homalium racemosum (Flacourtiaceae) Zanthoxylum martinicense (Rutaceae)
Medium shade tolerant species (MT)
Bucida buceras (Combretaceae) Ormosia krugii (Fabaceae)Casearia guianensis (Flacourtiaceae) Persea americana (Lauraceae)Clusia rosea (Clusiaceae) Prestoea acuminata var. Montana (Arecaceae)Inga laurina (Fabaceae) Roystonea borinqueña (Arecaceae)Magnolia portoricensis (Magnoliaceae) Terminalia catappa (Combretaceae)Neolaugeria resinosa (Rubiaceae) Thespesia grandiflora (Malvaceae)Ocotea leucoxylon (Lauraceae)
Medium shade intolerant species (MI)
Alchornea latifolia (Euphorbiaceae) Guazuma ulmifolia (Sterculiaceae)Artocarpus altilis (Moraceae) Inga vera (Fabaceae)Buchenavia tetraphylla (Combretaceae) Lonchocarpus heptaphyllus (Fabaceae)Bursera simaruba (Burseraceae) Mammea americana (Clusiaceae)Byrsonima spicata (Malpighiaceae) Mangifera indica (Anacardiaceae)Calophyllum antillanum (Clusiaceae) Palicourea croceoides (Rubiaceae)Cecropia schreberiana (Cecropiaceae) Petitia domingensis (Verbenaceae)Cedrela odorata (Meliaceae) Schefflera morototonii (Araliaceae)Cordia alliodora (Boraginaceae) Spondias dulcis (Anacardiaceae)Cupania americana (Sapindaceae) Spondias mombin (Anacardiaceae)Dendropanax arboreus (Araliaceae) Tabebuia heterophylla (Bignoniaceae)Erythrina poeppigiana (Fabaceae) Trichilia pallida (Meliaceae)Exothea paniculata (Sapindaceae) Vitex divaricata (Verbenaceae)Ficus citrifolia (Moraceae)
Small shade tolerant species (ST)
Casearia sylvestris (Flacourtiaceae) Myrcia deflexa (Myrtaceae)Citrus × paradisi (Rutaceae) Myrsine cubana (Myrsinaceae)Citrus × sinensis (Rutaceae) Pouteria multiflora (Sapotaceae)Coccoloba diversifolia (Polygonaceae) Psidium amplexicaule (Myrtaceae)Coffea liberica (Rubiaceae) Psidium guajava (Myrataceae)Eugenia montícola (Myrtaceae) Sagraea umbrosa (Melatomataceae)Guarea glabra (Meliaceae) Syzygium jambos (Myrtaceae)
Small shade intolerant species (SI)
Annona squamosa (Annonaceae) Gymnanthes lucida (Euphorbiaceae)Casearia arborea (Flacourtiaceae) Meliosma herbertii (Sabiaceae)Casearia decandra (Flacourtiaceae) Miconia impetiolaris (Melastomataceae)Castilla elastica (Moraceae) Miconia prasina (Melastomataceae)Cordia sulcata (Boraginaceae) Myrcia splendens (Myrtaceae)Cyathea arborea (Cyatheaceae) Sideroxylon salicifolium (Sapotaceae)Guettarda scabra (Rubiaceae) Tetrazygia elaeagnoides (Melastomataceae)Gyminda latifolia (Celastraceae) Turpinia occidentalis (Staphyleaceae)
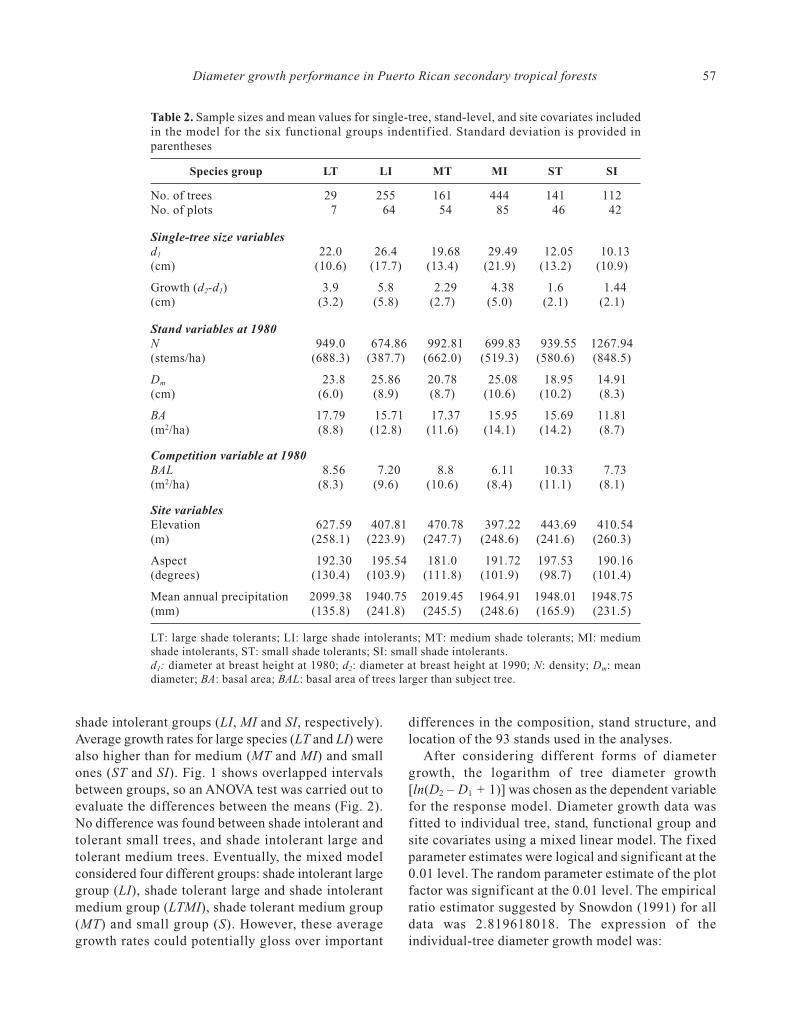
shade intolerant groups (LI, MI and SI, respectively).Average growth rates for large species (LT and LI) werealso higher than for medium (MT and MI) and smallones (ST and SI). Fig. 1 shows overlapped intervalsbetween groups, so an ANOVA test was carried out toevaluate the differences between the means (Fig. 2).No difference was found between shade intolerant andtolerant small trees, and shade intolerant large andtolerant medium trees. Eventually, the mixed modelconsidered four different groups: shade intolerant largegroup (LI), shade tolerant large and shade intolerantmedium group (LTMI), shade tolerant medium group(MT) and small group (S). However, these averagegrowth rates could potentially gloss over important
differences in the composition, stand structure, andlocation of the 93 stands used in the analyses.
After considering different forms of diametergrowth, the logarithm of tree diameter growth[ln(D2 – D1 + 1)] was chosen as the dependent variablefor the response model. Diameter growth data wasfitted to individual tree, stand, functional group andsite covariates using a mixed linear model. The fixedparameter estimates were logical and significant at the0.01 level. The random parameter estimate of the plotfactor was significant at the 0.01 level. The empiricalratio estimator suggested by Snowdon (1991) for alldata was 2.819618018. The expression of theindividual-tree diameter growth model was:
Diameter growth performance in Puerto Rican secondary tropical forests 57
Table 2. Sample sizes and mean values for single-tree, stand-level, and site covariates includedin the model for the six functional groups indentif ied. Standard deviation is provided inparentheses
Species group LT LI MT MI ST SI
No. of trees 29 255 161 444 141 112No. of plots 7 64 54 85 46 42
Single-tree size variablesd1 22.0 26.4 19.68 29.49 12.05 10.13(cm) (10.6) (17.7) (13.4) (21.9) (13.2) (10.9)
Growth (d2-d1) 3.9 5.8 2.29 4.38 1.6 1.44(cm) (3.2) (5.8) (2.7) (5.0) (2.1) (2.1)
Stand variables at 1980N 949.0 674.86 992.81 699.83 939.55 1267.94(stems/ha) (688.3) (387.7) (662.0) (519.3) (580.6) (848.5)
Dm 23.8 25.86 20.78 25.08 18.95 14.91(cm) (6.0) (8.9) (8.7) (10.6) (10.2) (8.3)
BA 17.79 15.71 17.37 15.95 15.69 11.81(m2/ha) (8.8) (12.8) (11.6) (14.1) (14.2) (8.7)
Competition variable at 1980BAL 8.56 7.20 8.8 6.11 10.33 7.73(m2/ha) (8.3) (9.6) (10.6) (8.4) (11.1) (8.1)
Site variablesElevation 627.59 407.81 470.78 397.22 443.69 410.54(m) (258.1) (223.9) (247.7) (248.6) (241.6) (260.3)
Aspect 192.30 195.54 181.0 191.72 197.53 190.16(degrees) (130.4) (103.9) (111.8) (101.9) (98.7) (101.4)
Mean annual precipitation 2099.38 1940.75 2019.45 1964.91 1948.01 1948.75(mm) (135.8) (241.8) (245.5) (248.6) (165.9) (231.5)
LT: large shade tolerants; LI: large shade intolerants; MT: medium shade tolerants; MI: mediumshade intolerants, ST: small shade tolerants; SI: small shade intolerants.d1: diameter at breast height at 1980; d2: diameter at breast height at 1990; N: density; Dm: meandiameter; BA: basal area; BAL: basal area of trees larger than subject tree.

where: dij2 = breast height diameter (cm) over thefollowing ten years, 1990 on our data set, belong to theobservation i taken in the j plot,; dij1 = present, 1980in our data set, breast height diameter (cm) belong tothe observation i taken in the j plot (cm); Nj = presentdensity in the j plot (trees/ha); LTMI = Factor whosevalue is 1 if the observation belongs to the shadetolerant large or shade intolerant medium group and 0if not; MT = Factor whose value is 1 if the observationbelongs to the tolerant medium group and 0 if not;S = Factor whose value is 1 if the observation belongsto the small size group and 0 if not; uj is a random plotparameter specific to the observations taken in the jplot: and εij are residual error terms. In brackets thestandard error of the parameter is shown.
Overall, observed values reached more extremevalues than predicted values, but average predictionsmatched observed data (Fig. 3). Examination of
residuals identif ied no discernible trends, so theassumption of normal and independent distributionwas validated. The proportion of variance explained
ln .
.
d dij ij2 1
1 0 0485
0 086
−( ) +⎡⎣
⎤⎦= ( )
+
0.4828
0.01119 ln(d 0.000098 0.00003ij1( ) ⋅ − ( ) ⋅
−
)
.
Nj
0 0859 00.0269( ) ⋅ − ( ) ⋅−
LTMI MT0 2179 0 0356
0 2464 0 03
. .
. . 337( ) ⋅ + +
( )S u
j ijε
ε
u ~ N 0, 0.0957
~ N 0, 0.
j
ij33239( )
58 Patricia Adame et al. / Forest Systems (2014) 23(1): 52-63
Figure 2. An ANOVA tree for the species groups.
Figure 1. Means, f irst and third quartile in diameter growthover 10-years for the six functional groups included in the study(LT, Large shade tolerant species; LI, Large shade intolerant;MT, medium shade tolerant; MI, medium shade intolerant, ST,small shade tolerant; SI, small shade intolerant).
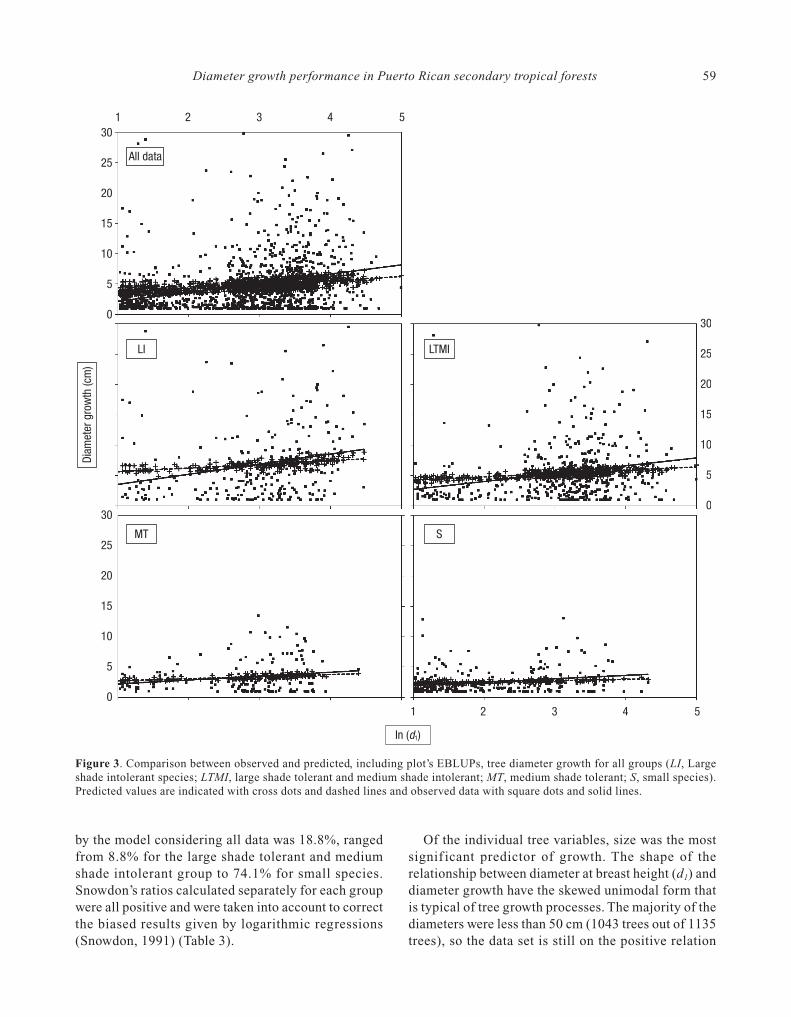
by the model considering all data was 18.8%, rangedfrom 8.8% for the large shade tolerant and mediumshade intolerant group to 74.1% for small species.Snowdon’s ratios calculated separately for each groupwere all positive and were taken into account to correctthe biased results given by logarithmic regressions(Snowdon, 1991) (Table 3).
Of the individual tree variables, size was the mostsignif icant predictor of growth. The shape of therelationship between diameter at breast height (d1) anddiameter growth have the skewed unimodal form thatis typical of tree growth processes. The majority of thediameters were less than 50 cm (1043 trees out of 1135trees), so the data set is still on the positive relation
Diameter growth performance in Puerto Rican secondary tropical forests 59
Figure 3. Comparison between observed and predicted, including plot’s EBLUPs, tree diameter growth for all groups (LI, Largeshade intolerant species; LTMI, large shade tolerant and medium shade intolerant; MT, medium shade tolerant; S, small species).Predicted values are indicated with cross dots and dashed lines and observed data with square dots and solid lines.

area of the skewed unimodal form (Fig. 4). This isshown in the model where diameter growth increasedwith size. Surprisingly, height was not a significantpredictor of diameter growth, possibly because of thehigh correlations between diameter and height(Brandeis et al., 2009).
Density (N) had a negative effect on diametergrowth. This result confirms that an increase in compe-tition leads to a reduction in the diameter growth.
The functional groups indicate higher growth forlarge species relative to medium and small species.Except small size species, intolerant species show ahigher growth versus tolerant species as well.
We included a number of site quality variables inour analyses. In contrast to the important effects ofindividual tree, stand level variables and functionalgroup, none of the site variables were signif icantpredictors of growth.
Discussion
We classif ied 81 species from 1,142 individualsdistributed across 93 permanent plots intofourfunctional groups based on regeneration strategyand adult height. Our goal was to use this classificationto explain variation in diameter growth acrosssuccessional stands. Average annual diameter incrementfor these species was 0.37 cm, ranging from about 0.01cm for Persea americana to 0.92 cm in Spathodeacampanulata. These growth rates are comparable tothose found in other studies (Brandeis, 2009; Weaver,1979). Further sampling is needed to provide data fora wider range of species with potentially differinggrowth forms and to provide further insight of tropicalforest dynamics in Puerto Rico.
Tree growth rates in our study decreased from shadeintolerant and canopy emergent species through shadetolerant and middle and low story late successional
species, as others results in literature (Francis andLowe, 2000; Kariuki et al., 2006), supporting thenotion that interspecif ic variation in maximumpotential growth rate is one of the most importantfactors in the definition of functional groups (Bakeret al., 2003). Variability in diameter incrementsbetween functional groups was considerable, with themean value of the median 10-year diameter incrementalmost 4 times greater in fastest growing group (Largeshade intolerant) relative to the slowest (Small shadeintolerant).
We use mixed model regression to identifyindividual, stand, functional group and environmentaldrivers that could account for variation in tree growth.The explained variance obtained (R2 = 18.8%, rangedfrom 8.8% to 74.1%) is comparable to others tropicalgrowth models. Parresol (1995) fitted three equationsto growth data for 15 species in a moist tropical forestin Puerto Rico, accounting for 12% to 69% of varianceof growth. In a lowland evergreen rain forest in FrenchGuiana, Gourlet-Fleury and Houllier (2000) built 15groups from 87 species to develop a diameter incre-ment model, and extended it to 173 species, obtaininga pseudo-R2 between 0.07 and 0.43. Similar resultswere obtained by Vanclay (1991) in Queensland(R2 = 0.45) and Chai and LeMay (1993) in Sarawak(R2 = 0.07-0.45). Across all studies a large percentageof growth increment remains unexplained. Possiblesources for this variation include physical measure-ment error (Prodan, 1965); (Monserud and Sterba,
60 Patricia Adame et al. / Forest Systems (2014) 23(1): 52-63
Figure 4. Relationship between initial class diameter anddiameter growth over 10-years for all data.
Table 3. Snowdon ratio and R2 explained by the growthmodel for the four functional groups identif ied in PuertoRico. Groups include shade intolerant large group (LI), shadetolerant large and shade intolerant medium group (LTMI),shade tolerant medium group (MT) and small group (S)
FunctionalLI LTMI MT S All
group
Snowdon ratio 3.460 2.990 2.220 1.860 2.820R2 explained 0.133 0.088 0.508 0.741 0.188

1996), pure error (Draper and Smith, 1998) and failureto include variables that influence tree growth in themodel, as genetic or climatic factors. The last class isof greatest importance for models of tropical forestdynamics (Uriarte et al., 2004). Another possiblesource of variation is the inherent relation amongrandom plot effects and functional groups, since notall the functional groups are present in all the plots.
Many variables used in plantation growth modelshave little relevance in tropic rainforests (e.g., age, topheight, mean diameter), since growth must be predictedfrom accessible variables such as diameter and standbasal area (Vanclay et al., 1995). If trees were all ofthe same age and size (diameter and height), diametergrowth is an adequate measure of tree growth andresults can be compared across the board. This is donein plantation forestry. Our study is an improvementbecause by classifying species by functional groups,we reduce the variation in tree size and thus differencesin diameter growth appear.
The positive logarithmic relationship betweendiameter at breast height (d) and diameter growthsuggests that data represent young stands and wheretrees have not reached the maximum growth rate yet.Once large trees reach maximum size growth rapidlyapproaches zero.
To account for the effects of stand structure ondiameter growth we considered a number of indicatorsof competition, including dominance class, meandiameter of the stand, stem density and basal area. Thenegative effect of stem density on diameter growthconfirms that in general, stand-level competition leadsto a reduction in diameter growth (Gourlet-Fleury andHoullier, 2000).
Large species group shows higher growth thanmedium and small species. Irradiance declinesexponentially with decreasing height in tropical forests(Yoda, 1978) and increased canopy illumination has aclear, positive effect on tree growth, not a surprisingresult since irradiance plays a prominent role indetermining the carbon acquisition potential of forestplants (Lüttge, 2008). Lower growth for the tolerantspecies groups implies that the diameter growth rateof intolerant species groups is higher. In a study of 15species in tropical forest in Puerto Rico, Parresol(1995) demonstrated that maximum growth rates werefive times higher in upper-canopy trees than in treesin the subordinate crown class categories.
We also considered a number of site covariates inour analyses including precipitation, elevation, aspect,
and soil fertility class. Habitat characteristics influencesoil water availability, solar radiation, and probablysoil nutrient availability, factors that have been shownto influence stand-level growth responses (Kariukiet al., 2006). Surprisingly, the relationship betweenrelative diameter growth and site characteristics wasnot statistically signif icant. Similar attempts toincorporate site information in diameter growthmodels of tropical forest have encountered mixedsuccess. For instance, Gourlet-Fleury and Houllier(2000) found negligible effects of topographical andsoil factors for modeling diameter increment in alowland evergreen rain forest in French Guiana. Clarket al. (1998), working in forest in an aseasonal climatein Costa Rica with adults of nine canopy or emergenttree species, found no difference in growth ratebetween two well-drained soil-types that differed inavailable P concentration by a factor of two. Inaddition, Ashton and Hall (1992) found no correlationbetween the proportional diameter growth (1965-1985)of large trees (dbh >30 cm), and soil nutrient statusacross 13 plots in high-rainfall forests in Borneo. Incontrast, Weaver (1979) linked moisture stress,saturated soils and reduced solar radiation to changesof the growth in Puerto Rican forest trees. The absenceof site effects may in part be the result of the way inwhich site characteristics are measured. For instance,climate data are typically collected at the nearestweather station to the plot, and may fail to captureimportant microsite characteristics. Another potentialreason is that site characteristics are confounded withthe range of observed tree sizes and stand characte-ristics, hindering our ability to detect site effects.
This study demonstrates that using tree functionalgroup classifications based on regeneration strategyand adult height can improved relatively eff icientmodels. Tree diameter and adult height were the mostimportant predictors of tree growth in Puerto Ricansecondary forest, followed by density and regenerationstrategy. The effects of stand-level covariates were lessconsistent while soil and topography failed to predictdiameter growth for the majority of tree species. Treediameter growth can vary widely between measure-ments periods over the short term (Clark and Clark,1994), and is partly due to variation in growthconditions, which are captured to a certain extent inthis study. Moreover, using these diameter growthmodels to estimate changes in tree volume must bedone with caution because some of the f it statisticsmay be strongly biased (Hasenauer and Monserud,
Diameter growth performance in Puerto Rican secondary tropical forests 61
1997). In sum, the results presented here must beconsidered as preliminary because they represent asingle measurement period (1980-1990), providingonly a snapshot of forest dynamics. This work shouldbe seen as part of an ongoing process, and theequations presented here will be refined as additionaldata becomes available.
Acknowledgements
We are indebted to the International Institute ofTropical Forestry (IITF) in Puerto Rico and the USForest Service Southern Research Station whocollected the data and compiled the database.
References
Alder D, 1995. Growth modelling for mixed tropical forests.Oxford Forestry Institute, Oxford, UK.
Andreassen K, Tomter SM, 2003. Basal area growth modelsfor individual trees of Norway spruce, Scots pine, birchand other broadleaves in Norway. For. Ecol. Manage. 180:11-24.
Ashton PS, Hall P, 1992. Comparisons of structure amongmixed dipterocarp forests of north-western Borneo.Journal of Ecology 80: 459-481.
Baker TR, Swaine MD, Burslem DFRP, 2003. Variation intropical forest growth rates: combined effects offunctional group composition and resource availability.Perspectives in Plant Ecology, Evolution and Systematics6: 21-36.
Birdsey RA, Weaver PL, 1982. The forests resources ofPuerto Rico. Resour. Bull. U.S. Department ofAgriculture, Forest Service, Southern Forest ExperimentStation, New Orleans, LA, p. 59.
Brandeis TJ, 2009. Diameter Growth of Subtropical Treesin Puerto Rico. United States Department of AgricultureForest Service, Southern Research Station, Asheville, NC,p. 44.
Brandeis TJ, Helmer EH, Oswalt SN, 2007. The Status ofPuerto Rico’s Forests, 2003. USDA Forest ServiceSouthern Research Station, Asheville, NC, USA, p. 75.
Brandeis TJ, Randolph KC, Strub MR, 2009. ModelingCaribbean tree stem diameters from tree height and crownwidth measurements. Mathematical and ComputationalForestry & Natural-Resource Sciences 1: 78-95.
Canham C, Papaik MJ, Uriarte M, McWilliams WH, JenkinsJC, Twery MJ, 2006. Neighborhood analyses of canopytree competition along environmental gradients in NewEngland forests. Ecological applications 16: 540-554.
Chai FYC, LeMay VM, 1993. Development and testing ofdiameter increment models for mixed swamp forests ofSarawak. For. Ecol. Manage. 58: 51-64.
Chazdon RL, 2003. Tropical forest recovery: legacies ofhuman intervention and natural disturbances. Perspectivesin Plant Ecology, Evolution and Systematics 6: 51-71.
Clark DA, Clark DB, 1994. Climate-induced annualvariation in canopy tree growth in a Costa Rican tropicalrain forest. Journal of Ecology 82: 865-872.
Clark DB, Clark DA, Read JM, 1998. Edaphic variation andthe mesoscale distribution of tree species in a neotropicalrain forest. Journal of Ecology 86: 101-112.
Daly C, Helmer EH, Quiñones AM, 2003. Mapping theclimate of Puerto Rico, Vieques and Culebra.International Journal of Climatology 23: 1359-1381.
Draper NR, Smith H, 1998. Applied Regression Analysis.Wiley-Interscience, New York.
Ewel JJ, Whitmore JL, 1973. The ecological life zones ofPuerto Rico and the U.S. Virgin Islands. Institute ofTropical Forestry, Río Piedras, Puerto Rico, p. 72.
Finney DJ, 1989. Was this in your statistical text book? V.Transformation of data. Experimental Agriculture 25:165-175.
Francis JK, Lowe CA, 2000. Bioecología de arboles nativosy exoticos de Puerto Rico y las Indias Occidentales.United States Department of Agriculture, Forest Service.International Institute of Tropical Forestry, Ríos Piedras,Puerto Rico.
Franco PA, Weaver PL, Eggen-McIntosh S, 1997. Forestresources of Puerto Rico, 1990. Southern ResourceBulletin. USDA Forest Service Southern ResearchStation, Asheville, North Carolina, USA.
Gourlet-Fleury S, Blanc L, Picard N, Sist P, Dick J, Nasi R,Swaine MD, Forni E, 2005. Grouping species forpredicting mixed tropical forest dynamics: looking for astrategy. Ann. For. Sci. 62: 785-796.
Gourlet-Fleury S, Houllier F, 2000. Modelling diameterincrement in a lowland evergreen rain forest in FrenchGuiana. For. Ecol. Manage. 131: 269-289.
Grau HR, Aide TM, Zimmerman JK, Thomlinson JR, HelmerE, Zou X, 2003. The ecological consequences ofsocioeconomic and land-use changes in postagriculturalPuerto Rico. Bioscience 53: 1159-1168.
Guariguata MR, Ostertag R, 2001. Neotropical secondarysuccession: changes in structural and functionalcharacteristics. For. Ecol. Manage. 148: 185-206.
Hasenauer H, Monserud RA, 1997. Biased prediction fortree height increment models developed from smoothed“data”. Ecol. model. 98: 13-22.
Helmer EH, Brandeis TJ, Lugo AE, Kennaway T, 2008.Factors influencing spatial pattern in tropical forestclearance and stand age: implications for carbon storageand species diversity. J Geophys Res 113: 165-183.
Hökkä H, Alenius V, Penttilä T, 1997. Individual-tree basalarea growth models for scots pine, pubescens birch andnorway spruce on drained peatlands in Finland. SilvaFenn. 31: 161-178.
Holdridge LR, 1967. Life zone ecology. Revised. TropicalScience Center, San José, Costa Rica.
ITTO, 2002. ITTO guidelines for the restoration,management and rehabilitation of degraded and secondary
62 Patricia Adame et al. / Forest Systems (2014) 23(1): 52-63

Diameter growth performance in Puerto Rican secondary tropical forests 63
tropical forests. ITTO in collaboration with CIFOR, FAO,IUCN and WWF, Yokohama, Japan.
Kariuki M, Rolfe M, Smith RGB, Vanclay J, Kooyman RM,2006. Diameter growth performance varies with speciesfunctional-group and habitat characteristics in subtropicalrainforests. For. Ecol. Manage. 225: 1-14.
Keddy PA, 1989. Competition. Chapman and Hall, London, UK.Laird NM, Ware JH, 1982. Random-effects models for
longitudinal data. Biometrics 38: 963-974.Lambin EF, Geist H, 2006. Land-use and land-cover change:
local processes and global impacts, Berlin, Heidelberg, GE.Lessard VC, McRoberts RE, Holdaway MR, 2001. Diameter
growth models using Minnesota Forest Inventory andanalysis data. For. Sci. 47: 301-310.
Little EL, Wadsworth FH, 1964. Common trees of PuertoRico and the Virgin Islands. U.S. Department of Agri-culture Forest Service, Washington, D.C., USA.
Lüttge U, 2008. Physiological ecology of tropical plants.Second edition. Springer-Verlag, Berlin, Heidelberg,Germany.
Lugo AE, Schmidt R, Brown S, 1981. Tropical forests in theCaribbean. Ambio 10: 318-324.
Monserud RA, Sterba H, 1996. A basal area increment modelfor individual trees growing in even- and uneven-agedforests stands in Austria. For. Ecol. Manage. 80: 57-80.
Parresol BR, 1995. Basal area growth for 15 tropical treesspecies in Puerto Rico. For. Ecol. Manage. 73: 211-219.
Prodan M, 1965. Holzmesslehre. J.D.Sauerlander, Frankfurt,Germany.
R Development Core Team, 2009. R: A language andenvironment for statistical computing. R Foundation forStatistical Computing, Viena, Austria.
Silver WL, Lugo AE, Keller M, 1999. Soil oxygenavailability and biogeochemistry along rainfall andtopographic gradients in upland wet tropical forest soils.Biogeochemistry, 301-328.
Snowdon P, 1991. A ratio estimator for bias correction inlogarithmic regressions. Can. J. For. Res. 21: 720-724.
Swaine MD, Whitmore TC, 1988. On the definition of ecologicalspecies groups in tropical rain forests. Vegetatio 75: 81-86.
Terborgh J, 1993. Lebensraum Regenwald-Zentrumbiologischer Vielfalt. Spektrum Akademischer Verlag,Heidelberg, Germany.
Trasobares A, Pukkala T, Miina J, 2004. Growth and yieldmodel for uneven-aged mixtures of Pinus sylvestris L.and Pinus nigra Arn. in Catalonia, north-east Spain. Ann.For. Sci. 61: 9-24.
Uriarte M, Canham C, Thompson J, Zimmerman JK, 2004.A neighborhood analysis of tree growth and survival in ahurricane-driven tropical forest. Ecological Monographs74: 591-614.
USDA, Forest Service, 2010a. www.Treesearch.fs.fed.us.U.S. Forest Service. P.O. Box 96090, Washington, D.C.20090-6090.
USDA, NRCS, 2007. In, National Soil Survey Handbook,title 430-VI Part 622.
USDA, NRCS, 2010b. The PLANTS Database(http://plants.usda.gov, 7 April 2010). National Plant DataCenter, Baton Rouge, LA 70874-4490 USA.
Vanclay JK, 1991. Aggregating tree species to developdiameter increment equations for tropical rainforest. For.Ecol. Manage. 42: 143-168.
Vanclay JK, 1994. Modelling Forest Growth and Yield -Application to Mixed Tropical Forests. CAB Internat.,UK.
Vanclay JK, Skovsgaard JP, Pilegaard Hansen C, 1995.Assesing the quality of permanent sample plot databasesfor growth modelling in forest plantations. For. Ecol.Manage. 71: 177-186.
Weaver PL, 1979. Tree growth in several tropical forests inPuerto Rico. U.S. Department of Agriculture ForestService, Sourthern Forest Experiment Station, Nashville,NC, USA, p. 20.
Weaver PL, 1991. Environmental gradients affect forestcomposition in the Luquillo Mountains of Puerto Rico.Interciencia 16: 142-151.
Whittaker RH, 1975. Communities and Ecosystems. 2nd ed.,New York, USA.
Wilson JB, 1999. Guilds, functional types and ecologicalgroups. Oikos 86: 507-522.
Wykoff WR, 1990. A basal area increment model forindividual conifers in the Northern Rocky Mountains. For.Sci. 36: 1077-1104.
Yoda K, 1978. Three-dimensional distribution of lightintensity in a tropical rain forest of West Malaysia.Malaysian Nature Journal 30: 161-177.


![UAV-based photogrammetric tree height measurement for ... · estimate individual tree characteristics, such as stem diameter and volume [22,23]. Such technological advances in forestry-related](https://static.fdocuments.us/doc/165x107/605f7120d86b4168370b6d22/uav-based-photogrammetric-tree-height-measurement-for-estimate-individual-tree.jpg)

