Diameter distribution in a Brazilian tropical dry forest … · The descriptive analysis of...
15
An Acad Bras Cienc (2017) 89 (2) Anais da Academia Brasileira de Ciências (2017) 89(2): 1189-1203 (Annals of the Brazilian Academy of Sciences) Printed version ISSN 0001-3765 / Online version ISSN 1678-2690 http://dx.doi.org/10.1590/0001-3765201720160331 www.scielo.br/aabc Diameter distribution in a Brazilian tropical dry forest domain: predictions for the stand and species ROBSON B. DE LIMA 1 , LINA BUFALINO 1 , FRANCISCO T. ALVES JÚNIOR 1 , JOSÉ A.A. DA SILVA 2 and RINALDO L.C. FERREIRA 2 1 Laboratório de Manejo Florestal, Universidade do Estado do Amapá, Rua Presidente Vargas, 450, Centro, 68901-262 Macapá, AP, Brazil 2 Departamento de Ciência Florestal, Universidade Federal Rural de Pernambuco, Rua Dom Manuel de Medeiros, s/n, Dois Irmãos, 52171-900 Recife, PE, Brazil Manuscript received on May 31, 2016; accepted for publication on November 4, 2016 ABSTRACT Currently, there is a lack of studies on the correct utilization of continuous distributions for dry tropical forests. Therefore, this work aims to investigate the diameter structure of a brazilian tropical dry forest and to select suitable continuous distributions by means of statistic tools for the stand and the main species. Two subsets were randomly selected from 40 plots. Diameter at base height was obtained. The following functions were tested: log–normal; gamma; Weibull 2P and Burr. The best fits were selected by Akaike’s information validation criterion. Overall, the diameter distribution of the dry tropical forest was better described by negative exponential curves and positive skewness. The forest studied showed diameter distributions with decreasing probability for larger trees. This behavior was observed for both the main species and the stand. The generalization of the function fitted for the main species show that the development of individual models is needed. The Burr function showed good flexibility to describe the diameter structure of the stand and the behavior of Mimosa ophthalmocentra and Bauhinia cheilantha species. For Poincianella bracteosa, Aspidosperma pyrifolium and Myracrodum urundeuva better fitting was obtained with the log–normal function. Key words: Caatinga domain, continuous distribution, diameter structure, forest management, maximum likelihood. Correspondence to: Robson Borges de Lima E-mail: rbl_fl[email protected] INTRODUCTION Diameter distributions are crucial decision– making tools for forest management. They directly affect the choices concerning silvicultural and harvesting stages activities. For instance, timing and intensity of thinning and harvesting, as well as harvesting equipment are dependent on the diameter distributions (Robinson and Hamann 2011). Furthermore, they are applied as inputs of growth models and sometimes are the subject of growth modeling themselves. Information on current diameter distribution of a forest stand allows prediction of its future structure which provides even better support for sustainable forest
Transcript of Diameter distribution in a Brazilian tropical dry forest … · The descriptive analysis of...

An Acad Bras Cienc (2017) 89 (2)
Anais da Academia Brasileira de Ciências (2017) 89(2): 1189-1203(Annals of the Brazilian Academy of Sciences)Printed version ISSN 0001-3765 / Online version ISSN 1678-2690http://dx.doi.org/10.1590/0001-3765201720160331www.scielo.br/aabc
Diameter distribution in a Brazilian tropical dry forest domain: predictions for the stand and species
RoBson B. De Lima1, Lina BufaLino1, fRancisco T. aLves JúnioR1, José a.a. Da siLva2 and RinaLDo L.c. feRReiRa2
1Laboratório de Manejo Florestal, Universidade do Estado do Amapá, Rua Presidente Vargas, 450, Centro, 68901-262 Macapá, AP, Brazil
2Departamento de Ciência Florestal, Universidade Federal Rural de Pernambuco, Rua Dom Manuel de Medeiros, s/n, Dois Irmãos, 52171-900 Recife, PE, Brazil
Manuscript received on May 31, 2016; accepted for publication on November 4, 2016
aBsTRacTCurrently, there is a lack of studies on the correct utilization of continuous distributions for dry tropical forests. Therefore, this work aims to investigate the diameter structure of a brazilian tropical dry forest and to select suitable continuous distributions by means of statistic tools for the stand and the main species. Two subsets were randomly selected from 40 plots. Diameter at base height was obtained. The following functions were tested: log–normal; gamma; Weibull 2P and Burr. The best fits were selected by Akaike’s information validation criterion. Overall, the diameter distribution of the dry tropical forest was better described by negative exponential curves and positive skewness. The forest studied showed diameter distributions with decreasing probability for larger trees. This behavior was observed for both the main species and the stand. The generalization of the function fitted for the main species show that the development of individual models is needed. The Burr function showed good flexibility to describe the diameter structure of the stand and the behavior of Mimosa ophthalmocentra and Bauhinia cheilantha species. For Poincianella bracteosa, Aspidosperma pyrifolium and Myracrodum urundeuva better fitting was obtained with the log–normal function.Key words: Caatinga domain, continuous distribution, diameter structure, forest management, maximum likelihood.
Correspondence to: Robson Borges de Lima E-mail: [email protected]
inTRoDucTion
Diameter distributions are crucial decision–making tools for forest management. They directly affect the choices concerning silvicultural and harvesting stages activities. For instance, timing and intensity of thinning and harvesting, as well
as harvesting equipment are dependent on the diameter distributions (Robinson and Hamann 2011). Furthermore, they are applied as inputs of growth models and sometimes are the subject of growth modeling themselves. Information on current diameter distribution of a forest stand allows prediction of its future structure which provides even better support for sustainable forest

An Acad Bras Cienc (2017) 89 (2)
1190 ROBSON B. DE LIMA et al.
management (Clutter et al. 1983, Borders et al. 1987, Vanclay 1994, Podlaski 2006).
Many distinc forest domainshave diameter distributions that vary in width and shape, which provide valuable information on the growing forest stock (Assmann 1970, Ferreira et al. 1998, Rubin et al. 2006). The descriptive analysis of diameter distribution through biomathematic models is an implicit prediction technique of the current yield since it provides the number of trees per hectare based on the height of each diameter class (Cao and Burkhart 1984, Cao 2004). Therefore, it allows to obtain very detailed information on the stand structure (Gorgoso–Varela and Rojo-Alboreca 2014, Martínez-Antúnez et al. 2015).
Dry tropical forests comprise about half of the world tropical forests (Murphy and Lugo 1986, Sabogal 1992, Powers et al. 2009). Information about heterogeneity, structure and diversity of Brazilian dry forests is provided by Huntley and Walker (1982, p. 25-47). Nevertheless, they are among the most threatened and the less studied forest domains; hence they may be in higher risks than rainforests (Ghazoul 2002, McLaren et al. 2005, Miles et al. 2006, Portillo-Quintero and Sanchez-Azofeifa 2010, Aide et al. 2012, Gillespie et al. 2012). In Brazil, several other studies had been and are being developed with this theme, showing satisfactory results hypotheses about changes in diversity and structure of forest stands and species of dry forests (Bucher 1982, Kirmse et al. 1987, Oliveira et al. 2007, Leal et al. 2010, Gunkel et al. 2013, Apgaua et al. 2015).
Until now, investigations of the correct management of dry forest were mainly carried out in Africa (Blackie et al. 2014) and Asia (Sagar and Singh 2005, Nath et al. 2006, McShea et al. 2011). Overall, there is a lack of studies on the diameter structure and modeling of dry forest stands and species (Fallahchai and Shokri 2014, Hussain et al. 2014, Sampaio et al. 2010). Investigations of this nature will provide better estimation of
production per diameter class and allow ordination and regulation of the productiveness for the stands and species (Zheng and Zhou 2010).
Weibull, log–normal, and gamma are classic models frequently applied for diameter distribution analysis in tropical forests (Bailey and Dell 1973, Rennolls et al. 1985, Batista 1989, Nanang 1998, Palahí et al. 2007, Burkhart and Tomé 2012). Other investigations highlight the potential of alternative models for predictions that support forest conservation and management (Wang and Rennolls 2005, Podlaski 2008, Gorgoso-Varela and Rojo-Alboreca 2014, Lima et al. 2014, Podlaski and Roesch, 2014).
Therefore, this work aims to investigate the diameter structure of a Brazilian tropical dry forest and to select suitable continuous distributions by means of fitting and validation of probabilistic density functions. The following questions are arise: What is the behavior of the diameter distributions of the stand and the species? Which probabilistic density functions better describe the diameter distribution of the stand and the species? Which functions do not provide suitable data fitting for the dry forest area under study?
maTeRiaLs anD meTHoDs
STUDY SITE
The investigation was carried out at a farm that is mainly explored for legal forest management located at Floresta county, in the Pernambuco State (8°30´37”S and 37°59´07”W) at northeast region of Brazil. The domain is dry forest of the xerophylous type (Caatinga), being characterized by bush–tree vegetation with cactus plants and herbaceous strata (IBGE 2012). The farm area is about 6000 ha (Fig. 1).
FOREST INVENTORY
The forest inventory started in 2008 in a 50 ha–area and was proceeded according to recommendations

An Acad Bras Cienc (2017) 89 (2)
DIAMETER MODELING OF BRAZILIAN TROPICAL DRY FOREST 1191
of the protocol for measurements of permanent plots (Comitê Técnico Científico da Rede de Manejo Florestal da Caatinga 2005). Data was obtained based on acceptable error of 20% and probability of 90%. Forty forest plots of the 20 x 20 m (400 m²) were placed in the study site for measurement of all bush–tree individuals with circumference at the base (0.30 m from the ground level –Cb) above 6 cm. Values were transformed into diameter at the base (0.30 m from the soil height –Db) previously to fitting. Equivalent diameter was calculated according to Burkhart and Tomé (2012) for plants with more than one stem.
The results from the inventory were reported in a previous work (Alves Junior et al. 2013) and are depicted in Table I. The following five main species were detected: catingueira (Poincianella bracteosa (Tul.) L. P. Queiroz); jurema–de–embira
(Mimosa ophthalmocentra Mart. Ex Benth.); pereiro (Aspidosperma pyrifolium Mart.); aroeira (Myracrodum urundeuva (Engl.) Fr. All.); and mororó (Bauhinia cheilantha (Bong). Steud.). These species were selected according to the following phytosociological measures: density; relative density; dominance; relative dominance; frequency; relative frequency; and relative importance value.
DIAMETER DISTRIBUTION MODELING
Histograms of the frequencies of individual number per hectare per diameter class were generated in order to check the distribution pattern of the tree species and stand.
The distribution curves were subjected to the fitting and validation through diameter distribution models. Plot data was randomly and equally
figure 1 – Study site: inside details and location from the wider to specific level.

An Acad Bras Cienc (2017) 89 (2)
1192 ROBSON B. DE LIMA et al.
TaBLe iPhytosociological parameters of the five tree species of highest importance value (HIV).
Species DE RDE DO RDO FQ RFQ RIV%
P. bracteosa1* 770.00 47.92 3.74 46.21 100.00 11.02 35.05
M. ophthalmocentra2 246.88 15.36 0.92 11.40 100.00 11.02 12.60
A. pyrifolium3 75.63 4.71 0.47 5.78 57.50 6.34 5.61
M. urundeuva4 51.88 3.23 0.42 5.21 65.00 7.16 5.20
B. cheilantha5 96.88 6.03 0.12 1.44 62.50 6.89 4.79
Other species (21) 365.61 22.75 2.42 29.91 522.50 57.57 36.75
Total . ha–1 1606.88 100 8.09 100 907.50 100 100
Source: Alves Junior et al. (2013).*Overwritten numbers correspond to importance value. DE is the density; RDE is the relative density; DO is the dominance; RDO is the relative dominance; FQ is the frequency; RFQ is the relative frequency; and RIV is the relative importance value.
TaBLe iiempirical statistical expression for the diameter distribution of the stand and species.
PDF Tested density functions
Log–Normal1 ( )
πσσ
µ
σµ2
2ln21exp
,;x
x
xf
−−
=
Gamma2 ( )( )ααβ
βαβα
Γ
−−=
/1,;
xexxf
Weibull 2P3
( )
−
=
γ
β
γ
ββγβγ xxxf -exp
1.,;
Burr 4( ) 1
1
1.
,,,; +
−+
−
−
= kx
xkkxf
α
βγβ
α
βγα
γβα
*function; x is the center of the diameter class (x > 0) (cm); π is the constant “pi” (3.1416); μ is the arithmetic average of the Neperian logarithm of the diameter (cm) in function 1; σ is the standard deviation of the Neperian logarithm of the diameter (cm) in function 1; exp is the exponential; ln x is the Neperian logarithm of the diameter (cm) in function 1; Г is the gamma function:
( ) 1
0
tt e dtαα∞
− −Γ = ∫ ; k, α, β and γ are function parameters –α an k: shape parameter in function 2, and location parameter in function 4
(α > 0); β is the scale parameter in functions 2, 3, and 4 (β > 0); γ is the shape parameter (γ > 0); α can be replaced by the minimum diameter of the stand (α = xmin) in function 4.

An Acad Bras Cienc (2017) 89 (2)
DIAMETER MODELING OF BRAZILIAN TROPICAL DRY FOREST 1193
divided into a base applied for fitting and another base applied for validation. New class numbers and intervals were determined by this procedure.
Exploratory data analysis (EDA) was performed previously to model with the aim of investigating data characteristics. This procedure avoid substantial errors and partial analysis with unsuitable data. The analysis reveals normality and outliers through box–plot graphic technique (Ruppert 2011).
The following descriptive statistics were determined: mean, standard deviation, variation coefficient, skewness and kurtosis (Machado et al. 2009).
For modeling of the diameter structure, probability density functions (PDF) showed in Table II were fitted (Carretero and Torres–Alvarez 2013, Ige et al. 2013, Aigbe 2014).
The parameters of the PDFs were obtained by maximum likelihood through the MASS (Venables and Ripley 2002) and fitdistrplus (Delignette–Muller and Dutang 2015) packages of R software (R Core Team 2015), version 3.2.3.
GOODNESS OF FIT TEST
The goodness of fit in different class intervals was carried out using the Kolmogorov–Smirnov test according to the following expression (Schneider et al. 2009):
( ) ( )X x xn
SUP Fo FeD
n
−=
Where: Fo(x) is the accumulate observed frequency; Fe(x) is the accumulate expected frequency; n is the Number of observations; Dn is the calculated D value.
Dn was compared with the value of the Kolmogorov–Smirnov table at a probability level of 99% (Aigbe 2014, Diamantopoulou et al. 2015). This test was used to check the following
hypotheses of the bilateral test: H0 = the observed diameters follow the proposed distributions; and H1 = the observed diameters do not follow the proposed distributions.
Furthermore, the quality of the fitting was also assessed by the Akaike Information Criterion (AIC). The following expression (Lima et al. 2014) allows to compare models:
( )2ln 2AIC L k= − ±
Where: L is likelihood and k is number of parametersThe best functions were chosen by means of
the statistic scores with the aim to summarize the results and make the selection process easier.
The weighted value was determined assigning values or weights to the calculated statistics. Those were ranked according to their efficiency by attributing weight 1 for the most effective function and crescent weights for the remaining equations. The weighted value was obtained as follows:
1
n
ii
WV Nr W=
= ×∑
Where: WV is the weighted value of the function in ranking; Wi is the weighted of the i position; Nri is the number of registers that were obtained in the i position.
SKEWNESS AND KURTOSIS
The skewness and kurtosis coefficients were calculated according to the methodology recommended by Ruppert (2011), which establishes the following criteria: positive or right skew if mode < median < arithmetic average; and left or negative skew if mode > median > arithmetic average. If the skewness coefficient in module lies between 0.15 and 1, the skew is considered moderate. If it is higher than 1, the skew is strong.

An Acad Bras Cienc (2017) 89 (2)
1194 ROBSON B. DE LIMA et al.
Kurtosis is the degree of relative flattening or elevation of a distribution, usually determined in relation to the Normal distribution. A distribution is called leptokurtic if the curve has a relative high peak, with negative excess, i.e. a kurtosis coefficient < 0.263; it is platykurtic if the curve has the top more flattened, with positive excess, i.e. a kurtosis coefficient > 0.263; The intermediate curve is called mesokurtic, with kurtosis coefficient = 0.263.
FUNCTION VALIDATION
The functions that showed the best goodness of fit according to the Kolmogorov–Smirnov test were submitted to validation with another database. The validation analysis consisted of predicting the frequencies per diameter class based on the function parameters obtained in fitting. According to Palahí et al. (2002), the following statistics must be considered:
( )
^
1^
1
/% .100
/
n
i ii
n
ii
Y Y nBias
Y n
=
=
− =
∑
∑
( )( )
2^
1
2
1
% 1 .100
n
i ii
n
ii
Y YE
Y Y
=
=
− = − −
∑
∑
Where: E is the relative efficiency (%); Yi is the observed density (number of trees/ha); Ῡi is the average density (number of trees/ha); Ŷi is the estimate value of density per diameter class (number of trees/ha); n is the number of observations. Bias (%) is also named “relative tendency”.
These scores provide the error and quality measurements of the validated functions; hence lower values of Bias and higher values of Relative Efficiency are desirable.
ResuLTs
Descriptive statistics of Db are shown in Table III. The highest and lowest Db values found were 40.7 cm and 1.9 cm, respectively. Around 47.91% of the individuals are characterized as P. bracteosa; hence the average Db of this species was very close to the value determined for the stand.
Among the species of highest importance value, M. urundeuva has less skewness with larger interquartile ranges. The highest skewness and kurtosis were found for B. cheilantha (Fig. 2).
Although the box plot provides general information on location and dispersion, the most relevant parameter is the tail of distribution. Outliers may adversely affect decisions on data. Skewness, mode, median and average coefficients shown positive asymmetric distributions, since the highest Db concentration is located on the left side. This pattern means that the tails of distribution extend to the right side where the average value is higher than mode and average. Kurtosis coefficients imply that most distributions are platykurtic and correspond to the curves that are flatter than the normal curve with positive excess.
B. cheilantha had the highest individual density (96%) significantly concentrated in the lowest class. This result assures similarity between median and mode. Data from M. ophthalmocentra and A. pyrifolium showed unimodal distribution with positive skewness meaning that the central tendency measurements do not concentrate within the first class, but within the following classes.
Kolmogorov–Smirnov test accepts the hypothesis that describes statistic similarity between expected and observed frequencies. However, the fittings that showed significant difference are inadequate to describe database. Overall, log–normal function showed the lowest AIC values for the stand and for P. bracteosa, A. pyrifolium, M. urundeuva and B. cheilantha species. For the stand,

An Acad Bras Cienc (2017) 89 (2)
DIAMETER MODELING OF BRAZILIAN TROPICAL DRY FOREST 1195
TaBLe iiiDescriptive statistics of the data sets of diameter at base height (Db).
Descriptivemeasurements
Stand
Species
P. bracteosa
M. ophthalmocentra
A. pyrifolium
M. urundeuva
B. cheilantha
n* 2571 1232 395 121 83 155
Average (cm) 6.7 6.8 6.3 7.8 8.4 3.3
Median (cm) 5.4 5.7 5.7 6.6 5.7 2.9
Mode (cm) 3.2 3.8 5.1 6.4 3.2 2.5
Minimum (cm) 1.9 1.9 2.2 2.2 2.2 1.9
Maximum (cm) 40.7 28.6 25.1 24.8 22.6 24.2
Ampleness (cm) 38.8 26.7 22.9 22.6 20.4 22.3
Variance(cm) 19.8 15.4 7.7 18.7 33.2 4.4
Sd (cm) 4.5 3.9 2.8 4.3 5.8 2.1
CV (%) 66.8 57.7 43.8 55.7 68.5 63.4
Skewness 2.6 2.2 2.1 1.6 0.7 7.6
Kurtosis 12.8 9.9 11.3 5.7 2.3 70.8
*number of observations sampled in 40 plots.
figure 2 – Box plot of the diameter and potential outliers for fit and validation database of the highest importance (HIV) and other species. Where: 1 = P. bracteosa; 2 = M. ophthalmocentra; 3 = A. pyrifolium; 4 = M. urundeuva; 5 = B. cheilanta. The black spots indicate the average values of the diameters for each species in their database.

An Acad Bras Cienc (2017) 89 (2)
1196 ROBSON B. DE LIMA et al.
TaBLe ivClassification ranking for the diameter distribution models fitted for the stand and HIV species.
Statistics StandSpecies
P. bracteosa M. phthalmocentra A. pyrifolium M. urundeuva B. cheilantha
Log–Normal Function
AIC 7029,4 2990.5 922.8 389.6 296.2 272.8
Dn test 0.05* 0.04ns 0.04ns 0.09 ns 0.16 ns 0.15*
Dcrit. 0.04 0.06 0.10 0.14 0.18 0.12
Ranking 2nd 1st 2nd 1st 1st 2nd
Weibull 2P Function
AIC 7496.9 3158.9 995.1 407.9 299.1 386.3
Dntest 0.13* 0.11* 0.11* 0.15* 0.15ns 0.32*
Dcrit. 0.04 0.06 0.10 0.14 0.18 0.12
Ranking 4th 4th 4th 4th 4th 4th
Gamma Function
AIC 7267.7 3061.5 941.4 396.3 297.9 319.9
Dn test 0.09* 0.07* 0.06 ns 0.12 ns 0.16ns 0.19*
Dcrit. 0.04 0.06 0.10 0.14 0.18 0.12
Ranking 3rd 3rd 3rd 3rd 3rd 3rd
Burr Function
AIC 6978.7 2994.0 920.2 390.7 297.4 215.1
Dn test 0.05* 0.04ns 0.03 ns 0.07ns 0.16ns 0.10 ns
Dcrit. 0.04 0.06 0.10 0.14 0.18 0.12
Ranking 1st 2nd 1st 2nd 2nd 1st
(*): hypothesis rejection value; (ns): not significant; Obs. means observed; Est. means estimated; Dcrit. is the tabulated value of the Kolmogorov–Smirnov test; AIC is the Akaike information criterion.
TaBLe vvalidation of the functions selected through the AIC value for the stand and for HIV species.
Statistics StandSpecies
P. bracteosa
M. ophthalmocentra
A. pyrifolium
M. urundeuva
B. cheilantha
Log–Normal FunctionBias (%) – 0.48 – –0.13 15.00 –
Efficiency (%) – 98.06 – 90.06 51.72 –Burr Function
Bias (%) 3.92 – 7.73 – – –2.68Efficiency (%) 99.46 – 42.05 – – 96.04

An Acad Bras Cienc (2017) 89 (2)
DIAMETER MODELING OF BRAZILIAN TROPICAL DRY FOREST 1197
M. ophthalmocentra and B. cheilantha fitting was better by the Burr function (Table IV).
In addition to ranking, fitting quality may be attested by the frequency histograms and the total frequency estimations (Fig. 3). These results allow to previously trial the histograms. The worst database fittings were reported for gamma and Weibull 2P functions, for both the stand and the species. Gamma function underestimated the frequency for initial classes and overestimated the frequency for intermediate classes. These results are attributed to low flexibility of the functions due to generation of decreasing curves.
The weighted values of the statistical scores classifies the main functions that are valid to predict diameter structure through model validation.
The structural patterns of diameter sizes were better described by the log–normal and Burr functions. The bias values (%) indicate a slight underestimation of frequencies in some diameter classes, but they were not characterized by the low
bias values. The efficiency of the validated and accepted functions was suitable. Therefore, they provided effective results for function selection, since the validation statistics qualify as reliable predictions those that show the total variation explained by the functions above 90% (Table V).
The description of the diameter distributions at the level of stand and separate species in different database from sampling confirm the understanding of skewness of the distribution. The cumulative distribution curves are described in Figure 4. We selected these distribution by fully describing the probability distribution of a random variable of real value X. The validation of the functions in the new database suggests the correct use to select candidate models.
The functions correctly describe the tails of the distributions, except for the species M. urundeuva. It is noted a slight tendency for the log–normal function concerning the left tail of the observed distribution, which does not set statistical
figure 3 – Diameter distributions and fitted curves of the models for the stand and HIV species.
figure 4 – Cumulative diameter distribution and validation of the fitted functions for the stand and HIV species.

An Acad Bras Cienc (2017) 89 (2)
1198 ROBSON B. DE LIMA et al.
differences. This behavior was expected due to the low asymmetry value found for this species.
Discussion
The diameter distribution is a key method to describe the uniformity and growth of a stand. It provides crucial information for forest inventories on different levels of structure and dynamics of the area regarding variability of density within size classes (Assmann 1970). If the diameter distribution depicts a single peak with distortion of the density concentration to the left, this pattern must be kept despite silvicultural interventions (Rubin et al. 2006, Podlaski and Zasada 2008, Zheng and Zhou 2010).
Some species stood out by the higher number of individuals within the initial classes, which defines the distribution as “inverted–J” type. Other species showed the mode close, but not within, the first class. Those type of distribution are classified as unimodal with positive skewness (Meyer 1952, McLaren et al. 2005, Podlaski and Roesch 2014).
The individual distribution of a single species by histograms is an attempt to evaluate its development stages since the tool provides the proportions of individuals by class (Meyer 1952, Assmann 1970, Silva and Soares 2002). François De Liocourt (1898) reported that the ratio between the number of trees of successive diameter follows a decreasing geometric series, often with the “inverted–J” shape in natural forests. Each species have specific development and adaption abilities; hence the diameter amplitude of the stand does not necessarily represent those of the species.
In this study, small amplitudes between classes were considered (maximum of 3 cm). The distribution behavior provides information on the area successional stages; hence it is possible to describe the structure of the whole forest or of one species due to the great amount of individuals sampled within the first diameter (Podlaski 2006).
This type of decreasing distribution in dry forests indicates that the regeneration is continuously happening as a consequence of the species’ ability to adapt to extremely dry environments (Segura et al. 2003, Powers et al. 2009, Gunkel et al. 2013, Ferreira et al. 2015).
The analyses of the stand detected the highest individual concentration in the first diameter classes. This is mainly attributed to the high density and dispersion of P. bracteosa species, which is often the dominant species in different successional stages of dry forests located at Brazilian northeast region (Figueiredo et al. 2012, Ferreira et al. 2015). This data support the hypothesis that P. bracteosa species has a relatively slow initial growth, but a strong resistance to drought and great capacity to light competition. Moreover, it has the ability of regrowth by strains and roots (Sampaio et al. 1998).
The wide diameter variability justifies the irregularity of the distribution; hence it may be necessary to fit models that express the forest structure by transformation of variables or that have parameters with estimation methods with more refined searches, such as the likelihood method (Gove 2003, Taubert et al. 2013) or neural networks (Diamantopoulou et al. 2015). For P. bracteosa, A. pyrifolium and M. urundeuva the best fitting was provided by log–normal function probably due to diameter variable transformation. This procedure results in variance stabilization; hence it is an alternative method to correct the heterogeneity and reduce the amplitude by reduction of the deviations in relation to the average (Bliss and Reinker 1964, Nanang 1998, Schneider et al. 2009).
A difficulty is related to the traditional statistical methods used, which are not suitable. Overall, it is inferred that observed abundances fit to the predicted values by different models if the adherence tests do not show significant deviation. This is a mistaken approach of the significance test logic because it considers that the distribution model is tested as the null hypothesis. As a consequence, the acceptance
An Acad Bras Cienc (2017) 89 (2)
DIAMETER MODELING OF BRAZILIAN TROPICAL DRY FOREST 1199
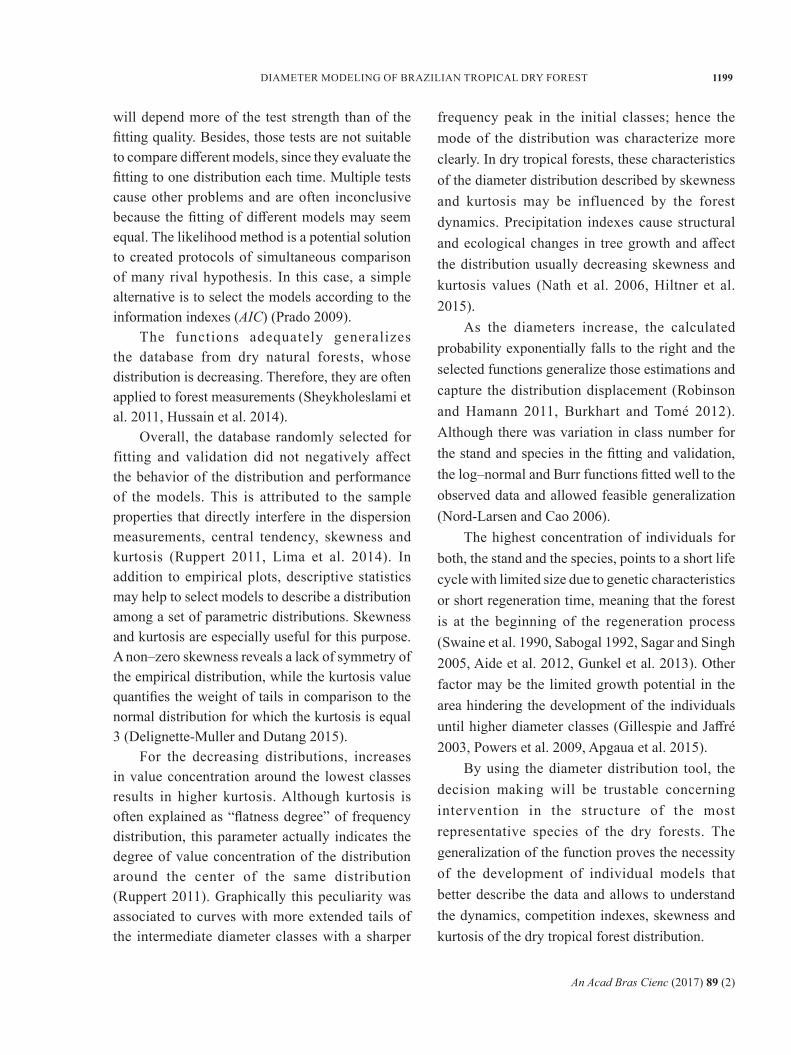
will depend more of the test strength than of the fitting quality. Besides, those tests are not suitable to compare different models, since they evaluate the fitting to one distribution each time. Multiple tests cause other problems and are often inconclusive because the fitting of different models may seem equal. The likelihood method is a potential solution to created protocols of simultaneous comparison of many rival hypothesis. In this case, a simple alternative is to select the models according to the information indexes (AIC) (Prado 2009).
The functions adequately generalizes the database from dry natural forests, whose distribution is decreasing. Therefore, they are often applied to forest measurements (Sheykholeslami et al. 2011, Hussain et al. 2014).
Overall, the database randomly selected for fitting and validation did not negatively affect the behavior of the distribution and performance of the models. This is attributed to the sample properties that directly interfere in the dispersion measurements, central tendency, skewness and kurtosis (Ruppert 2011, Lima et al. 2014). In addition to empirical plots, descriptive statistics may help to select models to describe a distribution among a set of parametric distributions. Skewness and kurtosis are especially useful for this purpose. A non–zero skewness reveals a lack of symmetry of the empirical distribution, while the kurtosis value quantifies the weight of tails in comparison to the normal distribution for which the kurtosis is equal 3 (Delignette-Muller and Dutang 2015).
For the decreasing distributions, increases in value concentration around the lowest classes results in higher kurtosis. Although kurtosis is often explained as “flatness degree” of frequency distribution, this parameter actually indicates the degree of value concentration of the distribution around the center of the same distribution (Ruppert 2011). Graphically this peculiarity was associated to curves with more extended tails of the intermediate diameter classes with a sharper
frequency peak in the initial classes; hence the mode of the distribution was characterize more clearly. In dry tropical forests, these characteristics of the diameter distribution described by skewness and kurtosis may be influenced by the forest dynamics. Precipitation indexes cause structural and ecological changes in tree growth and affect the distribution usually decreasing skewness and kurtosis values (Nath et al. 2006, Hiltner et al. 2015).
As the diameters increase, the calculated probability exponentially falls to the right and the selected functions generalize those estimations and capture the distribution displacement (Robinson and Hamann 2011, Burkhart and Tomé 2012). Although there was variation in class number for the stand and species in the fitting and validation, the log–normal and Burr functions fitted well to the observed data and allowed feasible generalization (Nord-Larsen and Cao 2006).
The highest concentration of individuals for both, the stand and the species, points to a short life cycle with limited size due to genetic characteristics or short regeneration time, meaning that the forest is at the beginning of the regeneration process (Swaine et al. 1990, Sabogal 1992, Sagar and Singh 2005, Aide et al. 2012, Gunkel et al. 2013). Other factor may be the limited growth potential in the area hindering the development of the individuals until higher diameter classes (Gillespie and Jaffré 2003, Powers et al. 2009, Apgaua et al. 2015).
By using the diameter distribution tool, the decision making will be trustable concerning intervention in the structure of the most representative species of the dry forests. The generalization of the function proves the necessity of the development of individual models that better describe the data and allows to understand the dynamics, competition indexes, skewness and kurtosis of the dry tropical forest distribution.

An Acad Bras Cienc (2017) 89 (2)
1200 ROBSON B. DE LIMA et al.
concLusions
The area of tropical dry forest located at Brazilian northeast showed diameter distributions with decreasing exponential curves and positive skewness. This behavior was observed for both the species and the stand. The generalization of the function for the most important species assure the necessity of the development of individual models.
The Burr function showed good flexibility to describe the diameter structure of the stand and it is recommended to individually describe the species M. ophthalmocentra and B. cheilantha. For P. bracteosa, A. pyrifolium and M. urundeuva the log–normal function is more appropriate. The Gamma and Weibull 2P functions did not depicted adequate development for frequency estimation of diameter class.
acKnoWLeDGmenTs
The authors are grateful for the help of the researchers José Serafim Feitosa Ferraz (in memoriam), Cinthia Pereira de Oliveira and Cybelle Souto–Maior, who contributed to the conclusion of this work. We also appreciate the forester German Hugo Gutiérrez Cespedez, who is responsible for Itampemirim farm management and conceded the area to the development of this work. The authors are thankful for the financial support provided by Conselho Nacional de Desenvolvimento Científico e Tecnológico (CNPq) and for the Fundação de Amparo à Ciência e Tecnologia de Pernambuco (FACEPE).
RefeRences
AIDE TM, CLARK ML, GRAU HR, LÓPEZ–CARR D, LEVY MA, REDO D, BONILLA-MOHENO M, RINER G, ANDRADE-NÚÑEZ MJ AND MUÑIZ M. 2012. Deforestation and reforestation of Latin America and the Caribbean (2001–2010). Biotropica 45: 262-271.
AIGBE HI. 2014. Modeling Diameter Distribution of the Tropical Rainforest in Oban Forest Reserve. J Environ Ecol 5: 130-143.
ALVES JUNIOR FT, FERREIRA RLC, SILVA JAA, MARANGON LC AND CESPEDES GHG. 2013. Structure evaluation of the Caatinga vegetation for sustainable forest management in the municipality of Floresta, Pernambuco, Brazil. In: Gunkel G, Silva JAA and Sobral MC (Eds), Sustainable Management of Water and Land in Semiarid Areas, Recife: Editora Universitária UFPE. Pernambuco, Brazil, p. 186-202.
APGAUA DMG, PEREIRA DGS, SANTOS RM, MENINO GCO, PIRES GG, FONTES MAL AND TNG DYP. 2015. Floristic variation within Seasonally dry tropical forests of the Caatinga biogeographic domain, Brazil, and its conservation implications. Int Forest Rev 17: 33-43.
ASSMANN E. 1970. The principles of forest yield study. Pergamon Press, Oxford, 504 p.
BAILEY RL AND DELL TR. 1973. Quantifying diameter distributions with the Weibull function. Forest Sci 19: 97-104.
BATISTA JLF. 1989. A função Weibull como modelo para distribuição de diâmetros de espécies arbóreas tropicais. Tese de Doutorado, Esalq, Univ. de São Paulo, Piracicaba, SP, Brasil, 116 p.
BLACKIE R ET AL. 2014. Tropical dry forests: The state of global knowledge and recommendations for future research. Discussion Paper. Bogor, Indonesia: CIFOR, 39 p.
BLISS CI AND REINKER KA. 1964. A lognormal approach to diameter distributions in even-aged stands. Forest Sci 10: 350-360.
BORDERS B, SOUTER R, BAILEY RL AND WARE KD. 1987. Percentile–based distributions characterize forest stand tables. Forest Sci 33: 570-576.
BUCHER EH. 1982. Chaco and Caatinga – South American Arid Savannas, Woodlands and Thickets. In: Huntley BJ and Walker BH (Eds), Ecology of Tropical Savannas, Springer, Verlag, Berlin, Heidelberg, New York, p. 48-79.
BURKHART HE AND TOMÉ M. 2012. Modeling Forest Trees and Stands. Springer, Dordrecht Heidelberg, New York, London, United Kingdom, 461 p.
CAO QV. 2004. Predicting parameters of a weibull function for modeling diameter distribution. Forest Sci 30: 682-685.
CAO QV AND BURKHART HE. 1984. A segmented distribution approach for modeling diameter frequency data. Forest Sci 30: 129-137.
CARRETERO AC AND TORRES-ALVAREZ E. 2013. Modelling diameter distributions of Quercus suber L. stands in “Los Alcornocales” Natural Park (Cádiz–Málaga, Spain) by using the two parameter Weibull functions. Forest Syst 22: 15-24.
CLUTTER JL, FORTSON JC, PIENAAR LV, BRISTER GH AND BAILEY RL. 1983. Timber Management: A Quantitative Approach. Krieger Publishing Company, Malabar, FL, 333 p.

An Acad Bras Cienc (2017) 89 (2)
DIAMETER MODELING OF BRAZILIAN TROPICAL DRY FOREST 1201
COMITÊ TÉCNICO CIENTÍFICO DA REDE DE MANEJO FLORESTAL DA CAATINGA. 2005. Protocolo de medições de parcelas permanentes. Recife: Associação Plantas do Nordeste, 30 p.
DE LIOCOURT F. 1898. De l’amenagement des sapinières. Bulletin trimestriel, Société forestière de Franche–Comté et Belfort, Franche, p. 396-409.
DELIGNETTE-MULLER ML AND DUTANG C. 2015. Fitdistrplus: An R Package for Fitting Distributions. J Stat Softw 64(4): 1-34. URL http://www.jstatsoft.org/v64/i04/.
DIAMANTOPOULOU MJ, ÖZÇELIK R, CRECENTE-CAMPO F AND ELER Ü. 2015. Estimation of Weibull function parameters for modelling tree diameter distribution using least squares and artificial neural networks methods. Biosyst Eng 133: 33-45.
FALLAHCHAI MM AND SHOKRI S. 2014. The Evaluation of different statistical distributions in order to fit Alnus subcordata C.A.M. species diameter in mountainous forests north of Iran. Biological Forum – An International Journal 6: 109-115.
FERREIRA RLC, SOUZA AL AND JESUS RM. 1998. Structure dynamics of a transition secondary forest. II – diameter distribution. Rev Árvore 22: 331-344.
FERREIRA WN, LACERDA CF, COSTA RC AND MEDEIROS FILHO S. 2015. Effect of water stress on seedling growth in two species with different abundances: the importance of Stress Resistance Syndrome in seasonally dry tropical forest. Acta Bot Bras 29: 375-382.
FIGUEIREDO JM, ARAÚJO JM, PEREIRA ON, BAKKE IA AND BAKKE OA. 2012. Revegetation of degraded caatinga sites. J Trop For Sci 24: 332-343.
GHAZOUL J. 2002. Impact of logging on the richness and diversity of forest butterflies in a tropical dry forest in Thailand. Biodivers Conserv 11: 521-541.
GILLESPIE TW AND JAFFRÉ T. 2003. Tropical dry forests in New Caledonia. Biodivers Conserv 12: 1687-1697.
GILLESPIE TW, LIPKIN B, SULLIVAN L, BENOWITZ DR, PAU S AND KEPPEL G. 2012. The rarest and least protected forests in biodiversity hotspots. Biodivers Conserv 21: 3597-3611.
GORGOSO-VARELA JJ AND ROJO-ALBORECA A. 2014. Use of Gumbel and Weibull functions to model extreme values of diameter distributions in forest stands. Ann Forest Sci 71: 741-750.
GOVE JH. 2003. Moment and maximum likelihood estimators for Weibull distributions under length – and area – biased sampling. Environ Ecol Stat 10: 455-467.
GUNKEL G, SILVA JAA AND SOBRAL MC. 2013. Sustainable management of water and land in semiarid areas. 1ed. Recife: Editora Universitária UFPE, 280 p.
HILTNER U, BRAUNING A, GEBREKIRSTOS A, HUTH A AND FISCHER R. 2015. Impacts of precipitation
variability on the dynamics of a dry tropical montane forest. Ecol Model 320: 92-101.
HUNTLEY BJ AND WALKER BH. 1982. Ecology of Tropical Savannas. Springer, Verlag, Berlin, Heidelberg, New York, 661 p.
HUSSAIN A, SHAUKAT SS, AHMED M, AKBAR M, ALI W AND MAGSIH Z. 2014. Modeling the diameter distribution of gymnosperm species from central Karakoram National Park, Gilgit Baltistan, and Pakistan using Weibull function. J Bio Env Sci 5: 330-335.
IGE PO, AKINYEMI GO AND ABI EA. 2013. Diameter Distribution Models for Tropical Natural Forest trees in Onigambari Forest Reserve. JNSR 3: 14-23.
IBGE - INSTITUTO BRASILEIRO DE GEOGRAFIA E ESTATÍSTICA. 2012. Manual técnico da vegetação brasileira. 2ª ed., Rio de Janeiro, RJ, Brasil, 271 p.
KIRMSE RD, PROVENZA FD AND MALECHEK JC. 1987. Clearcutting Brazilian caatinga: assessment of a traditional forest grazing management practice. Agroforest Syst 5: 429-441.
LEAL IR, BIEBER AGD, TABARELLI M AND ANDERSEN AN. 2010. Biodiversity surrogacy: indicator taxa as predictors of total species richness in Brazilian Atlantic forest and Caatinga. Biodivers Conserv 19: 3347-3360.
LIMA RAF, BATISTA JLF AND PRADO PI. 2014. Modeling Tree Diameter Distributions in Natural Forests: An Evaluation of 10 Statistical Models. Forest Sci 61: 320-327.
MACHADO SA, AUGUSTYNCZIK ALD, NASCIMENTO RGM, TÉO SJ, MIGUEL EP, FIGURA MA AND SILVA LCR. 2009. Diametric distribution functions in a fragment of mixed ombrophyllous Forest. Cienc Rural 39: 2428-2434.
MARTÍNEZ-ANTÚNEZ P, WEHENKEL C, HERNÁNDEZ-DÍAZ JC AND CORRAL-RIVAS JJ. 2015. Use of the Weibull function to model maximum probability of abundance of tree species in northwest Mexico. Ann For Sci 72: 243-251.
MCLAREN KP, MCDONALD MA, HALL JB AND HEALEY JR. 2005. Predicting Species Response to disturbance from size class distributions of adults and Saplings in a Jamaican tropical dry forest. Plant Ecol 181: 69-84.
MCSHEA WJ, DAVIES SJ AND BHUMPAKPHAN N. 2011. The ecology and conservation of seasonally dry forests in Asia. Rowman & Littlefield Publishers, INC. Smithsonian Institution Scholarly Press, Washington, DC, 413 p.
MEYER HA. 1952. Structure, growth, and drain in balanced uneven–aged forests. J Forest 50: 85-92.
MILES L, NEWTON AC, DEFRIES RS, RAVILIOUS C, MAY I, BLYTH S, KAPOS V AND GORDON JE. 2006. A global overview of the conservation status of tropical dry forests. J Biogeogr 33: 491-505.

An Acad Bras Cienc (2017) 89 (2)
1202 ROBSON B. DE LIMA et al.
MURPHY P AND LUGO A. 1986. Ecology of tropical dry forest. Annu Rev Ecol Syst 17: 67-88.
NANANG DM. 1998. Suitability of the normal, log–normal and Weibull distributions for fitting diameter distributions of Neem plantations in Northern Ghana. Forest Ecol Manag 103: 1-7.
NATH CD, DATTARAJA HS, SURESH HS, JOSHI NV AND SUKUMAR R. 2006. Patterns of tree growth in relation to environmental variability in the tropical dry deciduous forest at Mudumalai, southern India. J Biosciences 31: 651-669.
NORD-LARSEN T AND CAO QV. 2006. A diameter distribution model for even–aged beech in Denmark. Forest Ecol Manag 231: 218-225.
OLIVEIRA RLC, LINS NETO EMF, ARAÚJO EL AND ALBUQUERQUE UP. 2007. Conservation priorities and populations Structure of woody medicinal plants in an area of Caatinga vegetation (Pernambuco State, NE Brazil). Environ Monit Assess 132: 189-206.
PALAHÍ M, MIINA J, TOMÉ M AND MONTERO G. 2002. Stand–level yield model for Scots pine (Pinus sylvestris L.) in north–east Spain. Forest Syst 11: 409-424.
PALAHÍ M, PUKKALA T, BLASCO E AND TRASOBARES A. 2007. Comparison of beta, Johnson’s SB, Weibull and truncated Weibull functions for modeling the diameter distribution of forest stands in Catalonia (north–east of Spain). Eur J Forest Res 126: 563-571.
PODLASKI R. 2006. Suitability of the selected statistical distributions for fitting diameter data in distinguished development stages and phases of near–natural mixed forests in the Swietokrzyski National Park (Poland). Forest Ecol Manag 236: 393-402.
PODLASKI R. 2008. Characterization of diameter distribution data in near–natural forests using the Birnbaum–Saunders distribution. Can J Forest Res 38: 518-527.
PODLASKI R AND ROESCH FA. 2014. Modelling diameter distributions of two–cohort forest stands with various proportions of dominant species: A two–component mixture model approach. Math Biosci 249: 60-74.
PODLASKI R AND ZASADA M. 2008. Comparison of selected statistical distributions for modelling the diameter distributions in near–natural Abies–Fagus forests in the Świętokrzyski National Park (Poland). Eur J Forest Res 127: 455-463.
PORTILLO-QUINTERO C AND SÁNCHEZ-AZOFEIFA G. 2010. Extent and conservation of tropical dry forests in the Americas. Biol Conserv 143: 144-155.
POWERS JS, BECKNELL JM, IRVING J AND PÈREZ-AVILES D. 2009. Diversity and structure of regenerating tropical dry forests in Costa Rica: Geographic patterns and environmental drivers. Forest Ecol Manag 258: 959-970.
PRADO PIKL. 2009. Um Protocolo para Ajuste e Seleção de Modelos de Abundância de Espécies. Depto. de Ecologia, Instituto de Biociências, Universidade de São Paulo.
R CORE TEAM. 2015. R: A language and environment for statistical computing. R Foundation for Statistical Computing, Vienna, Austria. URL https://www.R-project.org/.
RENNOLLS K, GEARY DN AND ROLLINSON TJD. 1985. Characterizing diameter distributions by the use of the Weibull distribution. Forestry 58: 58-66.
ROBINSON AP AND HAMANN JD. 2011. Forest Analytics with R: An Introduction. Springer, New York Dordrecht Heidelberg, London, United Kingdom, 339 p.
RUBIN BD, MANION PD AND FABER-LANGENDOEN D. 2006. Diameter distributions and structural sustainability forests. Forest Ecol Manag 222: 427-438.
RUPPERT D. 2011. Statistics and data analysis for financial engineering. Springer, New York, Dordrecht, Heidelberg London, 623 p.
SABOGAL C. 1992. Regeneration of tropical dry forests in Central America, with examples from Nicaragua. J Veg Sci 3: 407-416.
SAGAR R AND SINGH JS. 2005. Structure, diversity, and regeneration of tropical dry deciduous forest of northern India. Biodivers Conserv 14: 935-959.
SAMPAIO EVSB, ARAÚJO EL, SALCEDO IH AND TIESSEN H. 1998. Regrowth of caatinga vegetation apter slashing and burnino at Serra Talhada, PE, Brazil. Pesq Agropec Bras 33: 621-632.
SAMPAIO EVSB, GASSON P, BARACAT A, CUTLER D, PAREYN F AND LIMA KC. 2010. Tree biomass estimation in regenerating areas of tropical dry vegetation in northeast Brazil. Forest Ecol Manag 259: 1135-1140.
SCHNEIDER PR, SCHNEIDER PSP AND SOUZA CAM. 2009. Análise de Regressão aplicada à Engenharia Florestal. 2ª ed., Santa Maria: FACOS, 294 p.
SEGURA G, BALVANERA P, DURÁN E AND PÉREZ A. 2003. Tree community structure and stem mortality along a water availability gradient in a Mexican tropical dry forest. Plant Ecol 169: 259-271.
SHEYKHOLESLAMI A, PASHA KHK AND LASHAKI AK. 2011. Study of tree distribution in diameter classes in natural forests of Iran (Case Study: Liresara Forest). Ann Biol Res 2: 283-290.
SILVA LA AND SOARES JJ. 2002. Successional classification of a forest fragment and its populations. Rev Árvore 26: 229-236.
SWAINE MD, LIEBERMAN D AND HALL JB. 1990. Structure and dynamics of a tropical dry forest in Ghana. Vegetatio 88: 31-51.
TAUBERT F, HARTIG F, DOBNER HJ AND HUTH A. 2013. On the challenge of fitting tree size distributions in ecology. PLoS ONE 8: e58036.

An Acad Bras Cienc (2017) 89 (2)
DIAMETER MODELING OF BRAZILIAN TROPICAL DRY FOREST 1203
VANCLAY JK. 1994. Modelling forest growth and yield: applications to mixed tropical forests. CAB International, Wallingford, UK, 330 p.
VENABLES WN AND RIPLEY BD. 2002. Modern Applied Statistics with S. Fourth Edition. Springer, New York. ISBN 0–387–95457–0.
WANG M AND RENNOLLS K. 2005. Tree diameter distribution modelling: Introducing the logit–logistic distribution. Can J Forest Res 35: 1305-1313.
ZHENG L AND ZHOU X. 2010. Diameter distribution of trees in natural stands managed on polycyclic cutting system. For Stud China 12: 21-25.