Diagram Representation: The Cognitive Basis for ... · Web viewPreliminary cognitive dimensions of...
400
Diagram Representation: The Cognitive Basis for Understanding Animation in Education Sara Janet Price Thesis submitted for the degree of Doctor of Philosophy November 2001 Published as Cognitive Science Research Paper 553 2002 School of Cognitive and Computing Sciences University of Sussex Brighton BN1 9HQ [email protected]
Transcript of Diagram Representation: The Cognitive Basis for ... · Web viewPreliminary cognitive dimensions of...

Diagram Representation: The Cognitive Basis for Understanding
Animation in Education
Sara Janet Price
Thesis submitted for the degree of Doctor of Philosophy
November 2001
Published as Cognitive Science Research Paper 553
2002
School of Cognitive and Computing SciencesUniversity of Sussex
BrightonBN1 9HQ

Dedication
I would like to dedicate this thesis in memory of my supervisor
Dr. Mike Scaife
who has, since the submission of this thesis, tragically died.
I feel extremely privileged to have known Mike and to have experienced the benefit of his
inspiration, astute sensitivity and wonderful powers of insight.
Mike, for whom I had the deepest respect, will be greatly missed.

Acknowledgments
First, I would like to thank my supervisor, Mike Scaife, who has inspired my interests and
provided perceptive guidance of my research, both facilitating the development and evolution
of my thesis, as well as keeping me appropriately focused. During my time at Sussex, Mike
has always been continually understanding; supportive and encouraging, but never
pressurising. For all of these things I am truly appreciative.
I am especially grateful to my husband, David Weir, for his devoted support and
encouragement, and his sustained faith in me, both as an individual and in my capacity as a
researcher. And also to my father, High Price, who has provided me with the motivation in all
of my studies.
I would also like to thank Clara Strauss for her friendship and for many useful discussions
which helped to clarify my thoughts. I would also like to thank members of the Interact Lab
who have given me help and advice at various times during my research: Yvonne Rogers,
John Halloran, Harry Brignull, and Pat George.
There are several other people within COGS who I would like to thank: Andy Field for
statistics advice, Tony Stubbens, Claire Brewer, Soo Lyth and Linda Thompson for technical
and administrative support.
I would like to thank all of the teachers and pupils who participated in this research from
Oathall Community College, Crowborough Community College, Warden Park School,
Patcham High School, and Worthing High School. I appreciate the effort they have made in
helping to organise student participation, and for tolerating the disruption to their classes.
I am grateful to the following for financial support. This research was initially funded by my
father, Hugh Price and The Rayne Foundation, London. Subsequently, the research was
supported by the Economic and Social Research Council, UK (Research Studentship no.
R00429834490), and the School of Cognitive and Computing Sciences.

Diagram Representation: The Cognitive Basis for Understanding Animation in Education
Summary
Recent developments in computer technology provide exciting, innovative ways of
representing and interacting with information, bringing new perspectives on learning with
multimedia. Animated diagrams are one form of (graphical) representation being increasingly
used in multimedia contexts, with underlying assumptions about their educational benefits.
Previous research suggests that diagrams can facilitate understanding, as information is more
visually explicit, requires less inference recognition than sentential representations, and
constrains inferences, which can guide cognitive processing. Thus, the visual explicitness of
motion inherent in an animated diagram should also reduce cognitive processing and aid
understanding of dynamics. However, facilitation of cognition results from particular
properties integral to the static representation, and although some of these properties may
apply to animated diagrams, research suggests that underlying differences in the fundamental
form of an animated representation, may generate different cognitive outcomes, making these
benefits less apparent.
This research focuses on cognitive interaction with animated graphics by investigating the
effects of fundamental properties of animation on cognition. A comparative study using
animated and static graphics of a dynamic system, is used as a basis for collecting
information about potential learning models and properties specific to animated
representations. Three groups of properties are identified, and a model of learning with an
animated diagram in relation to these graphical properties is proposed. With these
perspectives as a basis, a series of studies investigates the cognitive interaction needed with
an animated diagram by pupils studying dynamic processes.
The results from these studies suggest that initial assumptions about the cognitive benefits of
animation are unclear, but they do show evidence of patterns in cognitive processing of
dynamic information. This provides the basis for generating an preliminary cognitive model

for processing graphical change from animated diagrams. This model serves as a starting
point for further research and for informing particular aspects of diagram design.

Contents
List of Figures and Tables
List of Figures…………………………………………………………………………………… xiii
List of Tables…………………………………………………………………………………… xiv
Chapter 1: Aims and Structure of Thesis
1.1. Introduction……………………………………………………………………………… 1
1.2. Chapter 1: Aims of thesis………………………………………………………………… 1
1.3. Chapter 2: Literature review……………………………………………………………… 2
1.4. Chapter 3: Theoretical Rationale and Methodology……………………………………… 3
1.5. Chapter 4: Diagram Representation: A comparison of animated and static formats……… 3
1.6. Chapter 5: Research Modifications………………………………………………………… 4
1.7. Chapter 6: Dynamic Parsing: The effect of dynamics on salience and interpretation of
graphical change; A case study………………………………………………… 4
1.8. Chapter 7: Dynamic parsing: The effect of dynamics on salience and interpretation of
graphical change; An experimental study……………………………………… 5
1.9. Chapter 8: Processing animation: How information is integrated from a dynamic
representation…………………………………………………………………… 5
1.10. Chapter 9: General Discussion…………………………………………………………… 6
Chapter 2: Literature Review
2.1. Introduction………………………………………………………………………………….. 7
2.2. External representations and diagrams……………………………………………………… 7
2.2.1. External representations………………………………………………… 7
2.2.2. Diagrams……………………………………………………………… 8
2.2.3. Summary……………………………………………………………… 11
2.3. Animation research………………………………………………………………………… 11
2.3.1. Assumptions about animation………………………………………… 11
2.3.2. Previous animation research……………………………………………. 12
2.3.3. Reasons for inconclusiveness of animation research………..………… 15
2.3.4. Further issues relating to previous research…………………………… 17
2.3.5. Summary of research…..……………………………………………… 20
2.3.6. Problems with assumptions about animation………………………… 20
2.3.7. Implications for this research………………………………………… 21
2.4. Theoretical background……………………………………………………………………… 23
2.4.1. External cognition framework………………………………………… 23
2.4.2. Cognitive dimensions framework……………………………………… 24
2.4.3. relevant research fro exploring cognitive interaction…………………… 25
2.5. Cognitive models of processing…………………………………………………………… 28
2.5.1. Top-down and bottom-up processing………………………………… 28
2.5.2. Structure versus function processing…………………………………… 30
2.5.3. Incremental reasoning and cognitive models………………………… 30
2.6. Summary and conclusion……………………………………………………………………. 32
Chapter 3: Theoretical Rationale and Methodology
3.1. Introduction………………………………………………………………………………….. 33
3.2. Defining the problem space…………………………………………………………………. 33
3.2.1. Defining a process model……………………………………………… 34
3.3. Identification of specific dimensions of animated representations………………………….. 35
3.3.1. Properties of representations…………………………………………… 35
3.3.2. Cognitive dimensions………………………………………………… 36
3.3.3. Properties of animated diagrams……………………………………… 36
3.3.4. The form of animation………………………………………………… 37
3.3.5. Preliminary cognitive dimensions of representation for animation…… 37
3.4. Identification of learning aspects……………………………………………………………. 40
3.4.1. Identification of appropriate learning process………………………….. 41
3.4.2. Summary of proposed learning process……………………………… 45
3.5. Proposed Cognitive Model………………………………………………………………….. 47
3.6. Researching the process model: methodological considerations……………………………. 48
3.6.1. Chosen class of diagrams.…………………………………………… 48
3.6.2. Choice of participants…………………………………………………. 48
3.6.3. Designing the materials……………………………………………… 49
3.6.4. Methods……………………………………………………………… 50
3.6.5. Assessing learning outcomes………………………………………… 51
3.7. Summary……………………………………………………………………………………. 53
Chapter 4: Diagram Representation: A comparison of animated and static formats
4.1. Overview……………………………………………………………………………………… 55
4.2. Introduction…………………………………………………………………………………… 55
4.2.1. Summary of relevant research……………………………………………. 56
4.2.2. Rationale and aims of studies……………………………………………. 58
4.3. Study 1: Comparison of animated and static formats of diagrammatic representation………. 59
4.3.1. Method…………………………………………………………………… 59
4.3.2. Results……………………………………………………………………. 63
4.3.3. Discussion………………………………………………………………… 65
4.4. Study 2: Investigation of knowledge construction from animated diagrams………………… 68
4..4.1. Method…………………………………………………………………… 69
4.4.2. Results and discussion……………………………………………………. 70
4.5. General Discussion…………………………………………………………………………… 71
4.5.1. Complexity of the representation………………………………………… 72
4.5.2. Parsability of the representation…………………………………………. 74
4.5.3. Peripheral dependencies of the representation……………………………. 75
4.5.4. Summary………………………………………………………………….. 75
4.6. Limitations of studies…………………………………………………………………………. 76
4.7. Conclusion……………………………………………………………………………………. 77
Chapter 5: Research Modifications
5.1. Introduction…………………………………………………………………………………… 78
5.2. Limitations of studies one and two…………………………………………………………… 78
5.2.1. Changes in materials……………………………………………………… 79
5.2.2. Methodology………………………………………………………………. 82
5.3. Introduction to subsequent studies……………………………………………………………. 83
5.3.1. Graphical properties of animation……………….………………………… 84
5.3.2. Cognitive dimensions of representation (CDR)……………….………….. 84
5.3.3. The learning process………………………….……………….…………... 85
5.3.4. Summary………….………………………….……………….………….… 86
Chapter 6: Dynamic parsing: The effect of dynamics on salience and interpretation of
graphical change; A case study.
6.1. Summary………………………………………………………………………………………. 91

6.2. Rationale and aims……………………………………………………………………………… 91
6.3. Method………………………………………………………………………………………… 92
6.3.1. Participants………………………………………………………………… 92
6.3.2. Materials…………………………………………………………………… 92
6.3.3. Design……………………………………………………………………… 95
6.3.4. Procedure………………………………………………………………….. 95
6.3.5. Pilot study…………………………………………………………………. 96
6.4. Results…………………………………………………………………………………………. 96
6.4.1. Quantitative analysis……………………………………………………….. 97
6.4.2. Qualitative analysis……………………………………………………….. 101
6.5. Discussion……………………………………………………………………………………… 102
6.5.1. Main effects of complexity of animation and learning mode………………. 102
6.5.2. Differences in knowledge acquisition according to graphical change……… 103
6.5.3. Further errors in learning…………………………………………………… 107
6.5.4. Summary of discussion…………………………………………………….. 108
6.6. Contribution to cognitive model of processing………………………………………………... 108
6.6.1. Visibility demands…………………………………………………………. 108
6.2. Interpretative demands………………………………………………………. 109
6.7. Limitations of study…………………………………………………………………………… 109
6.8. Conclusion…………………………………………………………………………………….. 110
Chapter 7: Dynamic parsing: The effect of dynamics on salience and interpretation of
graphical change; An experimental study.
7.1. Summary……………………………………………………………………………………….. 111
7.2. Introduction…………………………………………………………………………………….. 111
7.3. Experimental study…………………………………………………………………………….. 113
7.3.1. Method……………………………………………………………………… 113
7.3.2. Materials……………………………………………………………………. 113
7.3.3. Design………………………………………………………………………. 114
7.3.4. Procedure…………………………………………………………………… 115
7.3.5. Pilot study………………………………………………………………… 115
7.4. Results………………………………………………………………………………………….. 115
7.4.1. Results of each separate exposure condition……………………………….. 116
7.4.2. Results of comparisons across all exposure conditions…………………….122
7.4.3. Errors analysis on individual questions…………………………………….123
7.5. Discussion……………………………………………………………………………………… 126

7.5.1. Minimum exposure…………………………………………………………. 126
7.5.2. Intermediate exposure………………………………………………………. 128
7.5.3. Maximum exposure…………………………………………………………130
7.5.4. Minimum, intermediate and maximum exposure………………………… 131
7.5.5. Analysis of individual questions……………………………………………133
7.5.6. Summary discussion……………………………………………………… 134
7.5.7. Limitations of conclusions…………………………………………………. 135
7.6. Limitations of experimental design……………………………………………………………. 135
7.6.1. Complexity investigation………………………………………………… 136
7.6.2. Animation design…………………………………………………………… 136
7.6.3. Test design…………………………………………………………………. 137
7.7. Conclusion…………………………………………………………………………………….. 137
Chapter 8: Processing animation: How information is integrated from a dynamic
representation.
8.1. Summary……………………………………………………………………………………….. 138
8.2. Introduction…………………………………………………………………………………….. 139
8.3. Study 5…………………………………………………………………………………………. 144
8.3.1. Method……………………………………………………………………… 144
8.3.2. Results……………………………………………………………………… 149
8.3.3. Discussion………………………………………………………………… 151
8.4. Study 6…………………………………………………………………………………………. 153
8.4.1. Method……………………………………………………………………... 153
8.4.2. Results……………………………………………………………………… 155
8.4.3. Discussion………………………………………………………………… 161
8.5. Conclusion……………………………………………………………………………………… 166
Chapter 9: General Discussion
9.1. Introduction…………………………………………………………………………………….. 168
9.1.1. Summary of problem space………………………………………………… 168
9.1.2. Summary of aims of studies……………………………………………… 168
9.1.3. Overview of studies………………………………………………………… 169
9.1.4. Structure of general discussion…………………………………………… 170
9.2. Understanding graphical change………………………………………………………………... 170
9.2.1. Salience of graphical change……………………………………………… 171

9.2.2. Interpreting graphical change………………………………………………. 172
9.2.3. Summary of graphical change………………………………………………. 174
9.2.4. Implications for design…………………………………………………… 174
9.3. Integrating information from animation ……………………………………………………….. 174
9.3.1. Relevant review of current studies………………………………………….. 174
9.3.2. Research findings…………………………………………………………… 175
9.3.3. Summary……………………………………………………………………. 176
9.3.4. Implications for design…………………………………………………… 176
9.4. The effect of multidimensionality……………………………………………………………… 177
9.4.1. Multidimensionality in this thesis…………………………………………. 177
9.4.2. Research findings…………………………………………………………… 177
9.4.3. Potential counterbalancing effects ………………………………………. 178
9.4.4. Summary……………………………………………………………………. 178
9.4.5. Implications………………………………………………………………… 179
9.5. The effect of transience…………………………………………………………………………. 179
9.5.1. Research findings…………………………………………………………… 179
9.5.2. Summary……………………………………………………………………. 180
9.5.3. Implications………………………………………………………………… 180
9.6. Potential effects of prior knowledge……………………………………………………………. 180
9.7. Other research findings…………………………………………………………………………. 182
9.7.1. Training/ expertise…………………………………………………………. 182
9.7.2. Self explanation effects…………………………………………………… 182
9.7.3. Multiple representations……………………………………………………. 183
9.8. The issue of defining complexity………………………………………………………………. 184
9.8.1. Summary……………………………………………………………………. 184
9.9. Cognitive dimensions of representation ……………………………………………………… 185
9.10. Cognitive model of processing animation……………………………………………………. 186
9.10.1. Visibility demands………………………………………………………… 186
9.10.2. Interpretative demands…………………………………………………… 188
9.10.3. Assimilation demands…………………………………………………… 188
9.11. Generalisation of research……………………………………………………………………...189
9.11.1. Implications for cognitive processing model …………………………… 189
9.11.2. Implications for designers and teachers…………………………………… 189
9.12. Future research………………………………………………………………………………… 190
9.12.1. Limitations of methods…………………………………………………… 190
9.12.2. Future directions………………………………………………………… 191
9.13. Conclusion……………………………………………………………………………………. 194

References……………………………………………………………………………………………
196
Appendices
Appendix 1: Example page of animated information Study 1……………………………………… 208
Appendix 2: Static paper information Study 1……………………………………………………… 209
Appendix 3: Tasks Study 1…………………………………………………………………………. 211
Appendix 4: Test study 1…………………………………………………………………………… 214
Appendix 5: Example frame animation Study 2……………………………………………………. 215
Appendix 6: Static paper diagram Study 2…………………………………………………………. 216
Appendix 7: Tests Study 2…………………………………………………………………………. 217
Appendix 8: Example frame from animations Studies 3 and 4…………………………………….. 220
Appendix 9a: Written tests Study 3………………………………………………………………… 222
Appendix 9b: Categorisation of test questions Study 3……………………………………………. 224
Appendix 10: Tests study 4………………………………………………………………………… 227
Appendix 10b: Categorisation of test questions Study 4…………………………………………… 232
Appendix 11: Diagrams to accompany test questions Studies 3 and 4…………………………… 233
Appendix 12a: Pre tests Studies 5 and 6……………………………………………………………. 235
Appendix 12b: Post tests Studies 5 and 6………………………………………………………… 237
Appendix 13: Diagram test (screen dump) Study 6………………………………………………… 240
List of FiguresFigure 4.1. Interaction line plot showing effects of media presentation and task types…………….. 64
Figure 5.1. One frame from the heart animation…………………………………………………….. 80
Figure 5.2. One frame from the respiration animation………………………………………………. 81
Figure 6.1. Graph showing main effects of complexity of animation and learning mode…………… 98
Figure 6.2. Overall means of performance on question categories…………………………………. 100
Figure 7.1. Graph showing the effect of animation complexity on performance after minimum
exposure to animation…………………………………………………………………. 117
Figure 7.2. Graph to show the effect of minimum animation exposure on processing of different
types of information…………………………………………………………………… 118
Figure 7.3. Graph to show the effect of intermediate animation exposure on processing of different
types of information……………………………………………………………………. 119
Figure 7.4. Graph showing the effect of complexity on performance after intermediate exposure
to animation…………………………………………………………………………… 120
Figure 7.5. Graph showing the effect of complexity on performance after maximum exposure to
animation……………………………………………………………………………… 121
Figure 7.6. Graph to show the effect of maximum animation exposure on processing of different
types of information…………………………………………………………………… 121
Figure 7.7. Showing scores for salience according to complexity and exposure to animation…… 124
Figure 7.8. Showing scores for interpretation according to complexity and exposure to animation 124
Figure 7.9. Graph showing overall test scores according to question category and exposure to
animation………………………………………………………………………………. 125
Figure 8.1. Example frame from additive parsed animation, showing three revealed sections of
the parsed animation…………………………………………………………………… 146
Figure 8.2. Example frame from substitute parsed animation……………………………………… 147
Figure 8.3. Example frame from control animation……………………………………………….. 153
Figure 8.4. Graph showing differences in total post test scores according to animation
permutation…………………………………………………………………………… 157
Figure 8.5. Graph showing scores for written and diagram tests according to animation
permutation…………………………………………………………………………… 158
Figure 8.6. Graph showing pre and post test score according to animation……………………… 159
Figure 8.7. Graph showing differences in function and process understanding…………………….. 159
Figure 8.8. Graph showing pre post and delayed post test scores across animation conditions…… 161
Figure 9.1. Example cognitive model of processing……………………………………………….. 187

List of TablesTable 4.1. Mean test scores for media presentation and task type…………………………………… 63
Table 4.2. ANOVA table Study 1………………………………………………………….. ……… 63
Table 5.1. Identification of levels of complexity………………………………………… ……… 87
Table 5.2. Identification of salience and interpretation……………………………………………… 90
Table 6.1. Mean test scores for complexity of animation and learning mode……………………….. 98
Table 6.2. Means of scores in different question categories according to complexity level and
learning mode…………………………………………………………………………… 99
Table 6.3. Overall mean scores obtained for each question category………………………………. 100
Table 7.1. Showing the mean scores for complexity and question categories in the minimum
exposure condition……………………………………………………………………… 116
Table 7.2. Showing mean scores for complexity and question category in the intermediate
exposure condition……………………………………………………………………… 118
Table 7.3. Mean scores for complexity and question category in maximum exposure condition…. 120
Table 7.4. Showing mean scores for each question category according to complexity and exposure
to animation…………………………………………………………………………… 123
Table 8.1. Showing the number of links made between sections of information according to
animation permutation………………………………………………………………….. 150
Table 8.2. Showing means and standard deviations for diagram test……………………………… 157
Table 8.3. Showing means, standard deviations and number of participants in each group……… 160

Chapter 1
Aims and Structure of Thesis
1.1. Introduction
Investigation into the literature on diagrams has revealed limited current knowledge of the
cognitive value of graphical representation, and many assumptions that multimedia and more
advanced technology result in improved learning (Scaife and Rogers 1996). Advances in
graphical technology have enabled more varied and dynamic illustration of concepts, for
example, the use of animated videos and computer animation to show motion and dynamics
more explicitly. This, together with increased computer facilities within schools, highlights
the importance of investigating whether educational software, in this form, can be
instructionally advantageous, and how diagram design can generate optimum learning.
Research into the use of animation for learning is inconclusive and claims for its value for
depicting dynamics requires further investigation, particularly in terms of the cognitive effect
of using animation to depict dynamics, by investigating the cognitive processes underlying
the use of animation.
1.2. Aims of thesis
This thesis set out to explore the cognitive effects of using animated diagrams to depict
dynamic processes, the main focus of the research being to begin to identify components of a
cognitive processing model of animation. Thus, the research investigates the effectiveness of
animation in facilitating the learning and understanding of domains concerned with dynamic
processes or systems. How do learners read information from animated diagrams? What
pieces of information do they pick out from the animation? What kind of meanings do they
infer from the animation? How do they integrate these pieces of information with previous
knowledge and with the material they are currently using?

To achieve this goal certain aspects were developed during the research in order to assemble
information that would explicate a cognitive model of processing animated diagrams.
Devising an analytical framework for examining underlying cognition when using
animated diagrams for learning about dynamic processes. The framework devised focuses
on particular representational properties of animation together with proposed appropriate
learning stages to examine the way that these properties may influence learning.
Realising a suitable methodology for extracting aspects of cognitive processing when
working with animation in order to construct a model of learning with animation.
Designing and creating suitable animations for the purposes of this research.
Determining outcome measures appropriate for informing about specific cognitive
aspects of a processing model as well as providing learning outcomes.
Several studies were then undertaken to explore the cognitive effectiveness of animation. A
brief overview of each chapter is presented here.
1.3. Chapter 2: Literature Review
The literature review in this thesis focuses on literature particularly relevant to the research in
this thesis. This comprises three main sections:
Section one covers previous research on the cognitive benefits of diagrammatic
representation, and the implications of these findings in terms of assumptions of potential
benefits of animation for learning. Previous research investigating the learning effects of
using animation is discussed in relation to its contribution to the proposed research in this
thesis.
Section two presents work that contributes to the theoretical and analytical framework
used in the thesis, which comprises the Cognitive Interactivity framework (Scaife and
Rogers 1996) and the Cognitive Dimensions framework (Green 1989, 1991). This section
also includes relevant research on animation that contributes to the theoretical and
analytical basis of the research undertaken here.
Section three discusses particular aspects of research relating to cognitive models,
considered appropriate for identifying ways and levels of constructing a processing model
of animation.

1.4. Chapter 3: Theoretical Rationale and Methodology
This chapter is also divided into three main sections;
Section 1 defines the problem space of the thesis, and presents the theoretical rationale
for the studies undertaken. The particular properties and features of animated
representations are identified as a basis for the investigations in this thesis, namely,
multidimensionality, transience, and graphical change.
Section 2 describes a proposed learning model using animation in order that relevant
cognitive activities when interacting with animation can be investigated.
Section 3 addresses methodological issues for this particular research, giving reasons for
the design of materials and methods used in the studies presented here.
1.5. Chapter 4: Diagram Representation: A comparison of animated and static
formats
This chapter presents the first study of the thesis, and compared learning of a dynamic system
from either an animated or a static representation, and explored the effects of structuring
versus not structuring information while learning with diagrams. This study served several
functions;
It provided base line information about the benefits and disadvantages of learning with
animation, as well as clarifying some properties particular to animated representations that
may affect cognitive processing with this kind of representation. These findings were
implemented in subsequent studies.
The results showed that structured information facilitated learning regardless of the
representation. This provided both a basis for and the rationale behind the design of later
studies investigating integration of information from animated diagrams.
It raised important issues about the particular design of materials in terms of their
appropriateness for this research. This first study used an animation from ‘What’s the
Secret’ CD ROM. This meant that, although suitable for comparing animated and static
representations by taking screen dumps, it would not be suitable for further investigation
which required manipulation of the design, presentation or interactivity opportunities with
the animation. Therefore, the materials for subsequent studies were adapted accordingly.

1.6. Chapter 5: Research Modifications
This chapter summarises the problems associated with materials used in the previous study in
relation to the aims of the thesis, and explains the design and creation of alternative
animations using Macromedia Director. Animations of the heart and circulatory system, and
of gas exchange during respiration were specifically developed for the purpose of further
investigations into the cognitive effectiveness of animation. Clarification is provided of the
issues to be explored in the next series of studies, in terms of the representational features of
animation (defined in detail) and proposed stages of learning, as the following studies
focused more specifically on cognitive interaction with the dynamic properties peculiar to
animated diagrams, such as identifying and interpreting graphical change, and integrating
different pieces of information from the animation. The methodologies adopted for the
following studies generated both qualitative and quantitative data, enabling detailed
descriptions and experimental evidence of learner understanding. Thus, in some studies a
small number of pupils gave concurrent verbal protocols while working with the animations,
and in other studies a larger group of pupils completed written and/or diagram post tests after
working alone with the animations.
1.7. Chapter 6: Dynamic parsing: The effect of dynamics on salience and
interpretation of graphical change; A case study.
Chapter six explores ways in which graphical change (an inherent property of animation) is
identified and interpreted according to levels of complexity of the animation defined in terms
of memory load due to transience and multidimensionality of the representation. The primary
focus of the study was to investigate the visibility of each graphical change taking place on
the diagram, in terms of its salience and interpreted meaning. This study took the form of a
case study with pupils working in pairs and with the researcher. Data collected was primarily
verbal protocols and interview data, but pupils also completed a written post test. For analysis
graphical change was classified according to type of change (extrinsic or intrinsic). Evidence
from the case study suggested that certain types of graphical change were more salient than
others, and that interpretation was affected by the perception of the type of graphical change
that occurs. The pattern of processing was also potentially affected by an issue which arose
unexpectedly from these studies relating to learner expertise in terms of level of prior
knowledge. The findings here confirm previous research showing that levels of prior
knowledge influence the way that information may be processed from the animation.

1.8. Chapter 7: Dynamic parsing: The effect of dynamics on salience and
interpretation of graphical change; An experimental study.
Chapter seven describes an experimental study investigating more rigorously the cognitive
processing involved in reading graphical change from an animation. The experimental design
consisted of three different levels of viewing each animation according to the number of runs
seen (minimum number (1), intermediate number (2 or 3 depending on animation) and
maximum number (4 or 5 depending on animation)). The findings of the studies in chapters
six and seven suggest evidence for the following: (i) a new dimension of graphical change
was identified, termed feature presence, (ii) the importance of interpretability as well as
visibility of graphical change in understanding the animated diagram, (iii) the interaction of
identification and interpretation of graphical change significantly affects understanding from
the animation, (iv) the different types of graphical change are processed differently and may
be affected by certain features of the representation, and (v) some prior knowledge facilitates
initial identification and interpretation of graphical change.
1.9. Chapter 8: Processing animation: How information is integrated from a
dynamic representation.
Although perception and interpretation of graphical change are important in retrieving
appropriate information from an animation, understanding is also dependent on integrating
those pieces of information into a coherent whole. Therefore, the primary focus of the studies
in chapter eight was to investigate the kinds of links that pupils made between different
pieces of information from the diagram. However, research into ‘reading’ be it text, speech or
diagrams, shows that information is generally parsed in order to make sense of it, and Green
(1989) highlights the importance of parsability as a cognitive dimension of notation. The
form of animation results in high dynamic information load and transience, both of which
affect focus of attention, demanding the need for parsing the representation. To investigate
how learners make links and the effects of parsing, this study used an animation that was
parsed into smaller sections and presented in two different ways. The study showed that the
presentational format of the animation significantly affected learning, and that explicit links
between pieces of information are important in facilitating understanding. This reveals that
not only is parsability important in integrating information, but also the linkability of pieces
of information in the representation.

1.10. Chapter 9: General Discussion
The aim of this thesis was to explore ways of investigating the cognitive effectiveness of
animation, with the ultimate aim of beginning to describe a cognitive model of processing
animation at some level. Therefore, this chapter begins by summarising the results of each of
the studies in this thesis in terms of evidence for cognitive processing accounts. The findings
are then discussed in relation to the effect on cognition of features, identified in this thesis, of
the representation and the learner (i.e. multidimensionality, transience, prior knowledge). The
chapter goes on to identify and define features as Cognitive Dimensions of animation, and to
propose a cognitive model of understanding animation. The research in this thesis hopefully
provides the beginnings of a workable analytical framework (focusing on the interaction
between representational properties and learning demands) and some evidence to contribute
towards the start of a description of a processing model of animation. However, there is much
further valuable work to be pursued in this research area, some of which is mapped out in this
final chapter.

Chapter 2
Literature Review
2.1. Introduction
Chapter one briefly outlined the problem space and aims of this thesis to explore learning of
dynamic processes using animated diagrams with the ultimate aim of identifying cognitive
components of a processing model of animation. The literature review, therefore,
concentrates on three main areas of research relevant to the research undertaken in this thesis.
Section one begins by placing animation within the realms of other research on external
representations, and then introduces a large body of research work to date on the benefits or
not of using computer animation as well as explaining the implications of those studies in
terms of this current research. The main drawbacks of the majority of previous research on
animation are explicated in relation to the aims of this thesis, although some research more
directly related to the aims of this thesis will be reviewed in more detail within sections two
and three. Section two presents research on external representations that provides a basis for
developing an appropriate analytical framework for establishing the effectiveness of
animation in terms of the particular properties of the representation. Section three identifies
principal theories of cognitive modelling and research for defining an appropriate level of
description for this research in striving to begin to develop a cognitive model description of
processing animation.
2.2. External representations and diagrams
2.2.1.External representations
Definition
Research into human cognition has shown the value of external representations for memory
aids and processing information. External representations refer to representations that are
external to the mind, and are a way of re-presenting some kind of information. External

representations are primarily visual representations of information expressed through the use
of physical symbols. Making notches in sticks would be an historical example of an external
memory aid for remembering or calculating. External representational forms have evolved
over time and are, therefore, historically and socially situated tools for cognition (Seeger
1999). One important form of external representation is graphical representations comprising
for example, maps, diagrams, graphs, tables. These representations are tools that can be used,
for example, to aid problem solving, learning, teaching, and therefore serve a functional role
in cognitive processing.
Benefits of external representations
Generally external representation can serve as an aid to cognition in that information needs
not be held internally while using, or thinking with, that particular information. One of the
benefits of this is that it reduces memory load. A shopping list or a diary might be good
examples of the effectiveness of external representations in doing just this. Earlier research
on external representations focused on linguistic representations and led to the development
of, for example, cognitive models of reading (e.g. Rumelhart's (1994) Interactive Model of
Reading). However, research into graphical external representations has more recently
become prominent, investigating ways in which information from this kind of representation
is processed. This has demonstrated that external graphical representations can be beneficial
for learning, or problem solving (e.g. Larkin and Simon 1987, Bauer and Johnson-Laird
1993, Zhang and Norman 1994).
Relevance of understanding external representations work to this research
However, more than just finding out the benefits of external representations, we need to
know how external representations work in terms of both their cognitive benefits and
disadvantages in order to construct a cognitive processing model. Achieving this would
provide information towards a more detailed theory of cognition. This research involves
investigation of the use of animated diagrams (one form of external representation) for aiding
cognition, understanding, and /or learning in an educational context, with the purpose of
beginning to define a cognitive model of processing such representations.
2.2.2. Diagrams
Diagrams are one form of external representation and are graphical forms of conveying
information, used extensively in educational contexts across the curriculum. Diagrams come

in many different forms and kinds making classification of this group of external
representations problematic. Although attempts have been made to classify diagrams into
relevant groupings, the problem of classification in relation to research into the effectiveness
of diagrammatic representation has been highlighted, because it decreases the generalisability
of results across diagrams in general (Cheng, Lowe and Scaife 1999). Although several
researchers have attempted to create a taxonomy of diagrams at differing levels of description
(e.g. Hegarty et. al 1991, Lohse et al 1991, 1994, Cox 1996, Blackwell and Engelhardt 1998),
at a general level Winn (1987) defined a functional difference between graphic forms, such as
charts and graphs, and diagrams; the function of graphs and charts is to show simple
relationships between variables, whereas “the function of diagrams is to describe whole
processes and structures often at levels of great complexity” (Winn 1987, p. 153). Despite
this classification problem, previous research into diagrams suggests various ways in which
they may be cognitively beneficial.
Cognitive benefits of diagrams
Much research into the use of diagrams has provided evidence for the benefits of such
external representations. A diagram can support cognitive processing generally, by acting as
an ‘external aid to thought’ (Addis 1997), but has also been found to ease processing or
reasoning and problem solving. The diagrammatic form itself provides the facility to describe
whole processes and structures, often at levels of great complexity (Winn 1987) in one
representation. This representational capacity of diagrams has been shown to be cognitively
beneficial in several ways;
(i) Simultaneous presentation of information
Larkin and Simon (1987) argue that diagrams offer several pieces of information
simultaneously, unlike text which is sequential in processing. This precludes the need to unite
separate facts to comprehend a whole concept, therefore reducing cognitive processing.
(ii) Perceptual availability of information
The perceptual availability of information from a diagram may also reduce cognitive
processing due to explicit representation of the topological and geometric aspects of a
problem (Larkin and Simon 1987). Larkin and Simon express a fundamental difference
between sentential and diagrammatic representations as the “diagrammatic representation
preserves explicitly the information about the topological and geometric relations among

components of the problem, while the sentential representation does not” (1987, p.66). This
means that many important aspects for comprehension are visually explicit in the diagram,
precluding the need to ‘work out’ some aspects, such as relational components (Larkin and
Simon 1987). Visual explicitness also facilitates search ease and can result in less need for
making inferences. “Formally producing perceptual elements does most of the work of
solving the geometry problem. But we have a mechanism – the eye and the diagram – that
produces exactly these ‘perceptual’ results with little effort” (p.92). “It is exactly because a
diagram ‘produces’ all the elements ‘for free’ that it is so useful.” (Larkin and Simon 1987,
p.92).
(iii) Reduction in memory load
Facilitating deductive reasoning was also evident from using diagrams in research by Bauer
and Johnson Laird (1993). This study showed that certain diagrams mean that all the
computation does not need to take place in participants minds, but they can solve problems
and make inferences by using an external representation as a cognitive support. Hegarty and
Kozhevenikov (1999) have also found that learners used external diagrammatic symbols to
‘offload’ information, as a strategy to reduce memory load.
(iv) Inference constraining
Further research into the use of diagrams has shown more specifically that, although
diagrams have visually explicit properties that can facilitate problem solving, the use of a
diagram per se is not always necessarily beneficial, as the particular way in which the
information is represented diagrammatically also influences the degree to which cognitive
processing is reduced. For example, Zhang and Norman (1994) showed that different
representations of the same problem structure resulted in different amounts of computational
offloading (the degree to which diagrams provide cognitive benefit by reducing cognitive
processing) according to the number of implicit and explicit rules within the diagram
composition. The level of cognitive benefit increased with the increase in the number of
implicit rules, an implicit rule being one that constrains the way in which a problem can be
solved, due to the representation. Diagrams can, therefore, facilitate understanding, as
information is more visually explicit, requires less inference recognition than sentential
representations, and because components of the diagram which constrain inferences can
guide and “even determine the pattern of cognitive behaviour” (Zhang 1997, p184). Euler’s

circles are also an example of this, where the representational properties constrain inferences
that can be made about the elements in each circle (Stenning and Oberlander 1995) .
2.2.3. Summary
Diagrams, then, can make important aspects of information salient and facilitate
“perceptual parsing and inferencing through directing attention to key components that are
essential for different stages of.....learning” (Scaife and Rogers 1996, p. 207), and
constructively constrain inferences. Diagrams should, therefore, facilitate understanding,
as information is more explicit and requires less inference recognition. One of the
overriding factors in benefits of diagrams to cognition is the visual explicitness of the
representation. This factor is particularly relevant because it suggests that visual
explicitness, one representational space etc.. all aid cognitive processing and ease problem
solving or reasoning. It may therefore be reasonable to make the assumption that as
animated diagrams show dynamics more visually explicitly, diagrammatic animation of
dynamic processes will aid cognition and facilitate understanding of dynamic processes.
2.3. Animation research
2.3.1. Assumptions about animation
Diagram research demonstrates the benefits of external representations due to visual
explicitness and perceptual availability, resulting in computational offloading. These findings
may contribute to assumptions about the benefits of animation, particularly animated
diagrams and result in misplaced inferences about cognition and learning with animated
representations. On the basis of findings from research about diagrams, it could be argued
that if visual explicitness and the perceptual availability of information from a diagram
reduce cognitive processing, then the visual explicitness of change (e.g. motion) inherent in
an animated diagram should also reduce cognitive processing and facilitate understanding of
dynamics. However, assumptions that animations are as beneficial for cognitive processing as
diagrams generally, may be misplaced. Even though dynamic information is more explicitly
displayed, what is true of a static diagram may not necessarily be true of an animated
diagram. For example, the cognitive benefits of diagrams as cited by Larkin and Simon
(1987) are based on the defined difference in data structure between sentential and
diagrammatic representation. Sentential data structure has elements which “appear in a single

sequence”, whereas diagrammatic data structure has “information which is indexed by two
dimensional location” (1987). However, a diagram that is animated has both of these data
structures, in that not only is information linked by two dimensional location (the
components of the diagram), but also the process being depicted is similar to a sentential data
structure in that the information (dynamic) appears in a sequence. So the claim that a major
benefit of diagrams is that they can group together all information that is used avoiding large
amounts of search for elements (cited Koedinger 1992) may not hold true for animated
diagrams, where multiple diagrams (an inherent property of animation) increase the amount
of search and integration of information across the whole sequence of images.
2.3.2. Previous animation research
Over the last two decades several studies have investigated the effects of diagrammatic
animation on learning. However, the research into the use of animation in education has
generally resulted in inconsistent findings, not only in terms of whether or not animation is
beneficial to learning, but also in terms of the specific factors that may influence those
cognitive benefits or disadvantages. Some research has shown animation to be beneficial in
some learning situations, others have not. The effectiveness of this research in relation to this
thesis is discussed below.
Benefits of animation
Despite the inconsistency of the research several studies have shown animation to be
generally beneficial to learning and some have drawn specific relevant conclusions regarding
aspects of the design and use of computer animation. In Szabo’s (1997) review of 22
experimental studies, 11 were cited to show full or partial significant effects in favour of
animation (i.e. Alesandrini 1982, Alesandrini & Rigney 1981, Baek & Lane 1988, Carpenter
and Just 1992, Collins Adams & Pew 1978, Kaiser Profitt Whelan & Hecht 1992, Mayton
1991, Rieber & Boyce 1990, Rigney and Lutz 1976, Szabo & Poohkay 1996). However,
further studies have also shown conditions under which animation was found to beneficial
(i.e. Rieber 1989, Thompson & Riding 1990, Rieber 1991, Mayer 1991, Mayer & Anderson
1992, Kieras 1992, Large et al 1995, Hays 1996, Lowe 1996, Nicholls, Merkel, Cordts 1996).
However, several studies investigating the benefits of animation for learning showed no
significant effects for animation. (e.g. King 1975, Peters & Daiker 1982, McClosky & Kohl
1983, Reed 1985, Caraballo 1985, Doll 1986, Rieber & Hannafin 1988, Park 1998, Rieber
1990, Szabo & Schlender 1996, Dahlquist 1997, 2000). Although studies do not necessarily

show a positive learning effect for animation, studies generally did not indicate detrimental
effects (e.g. Park and Hopkins 1993, Guttormsen Schar and Krueger 2001). Although taken
collectively, particular benefits or disadvantages of animation were not uniformly found
across the studies, making specific conclusions difficult to draw, some groupings of findings
can be identified.
(i) Partial benefits
Sometimes benefits found were only partial, for example, Rieber and Boyce (1990)
investigated the effectiveness of animated as oppose to static graphics or no graphics on
understanding of Newton’s laws of motion and found no difference between groups in the
amount learned, but did find that those using animation retrieved learned information quicker
than those using a static or no diagram.
(ii) Benefits for particular kinds of learning
Some studies showed benefits for particular kinds of learning only, for example, Rieber
(1991) found animation improved performance (over static or no graphics) for incidental
learning, and Large (1995) showed animation to benefit procedural learning. These kinds of
benefits may be a product of congruency of the relationship between the learning task and the
animation. For example, in Rieber’s (1991) study comparing animated and static graphics of
Newton’s laws of motion incidental learning was possible from the content implied by
animation only.
(iii) Subject groups
Benefits of using animation were shown to be evident for particular subject groups, for
example Hays (1996) found animation improved performance for lower spatial ability
individuals, but this was only apparent in contexts where understanding of a process involved
dynamic or spatial processes. Rieber (1989) found animation improved performance for
children learning about Newton’s laws of motion, but not for adults (1990).
(v) Design aspects
The potential benefits of animation have also been shown to be enhanced when used in
combination with other media. Mayer’s (1991, 1992) work on the use of verbal narration or
text in conjunction with animation, showed that understanding concepts using animation was
significantly improved if verbal explanation ran concurrently with the animation. “Students

learn best when words and pictures of an explanation are presented contiguously in time and
space” (Mayer and Anderson 1992, p.450). However, Large (1994, 1995, 1996) also
investigated the effect of animation on textual information, with several studies showing that
“any relationship between animation and learning is subtle and dependent upon the presence
of other factors. The animation must be well integrated with the external content and must be
presented in a suitable way for target audience. A complex text cannot be rendered more
accessible by supplementing it with a complex animation.” (1996, p.527). This is important
in informing the design of animation in terms of the accompanying information, for example,
what and how it is delivered. However, it does not inform us if, and how, the animation itself
may be beneficial in imparting dynamic information, as oppose to static representations or
verbal narration or text. The representational design of the animation has also been shown to
affect whether animation is beneficial or not to understanding. Kaiser et al. (1992) completed
a series of studies investigating the use of animation on people’s perception and
understanding of mechanics. They found that animation was beneficial when the
representation showed unidimensional dynamics (only one dynamic event) as oppose to
multidimensional dynamics (Kaiser et. al. 1992).
(vi) Representational features
Animation has also been cited to be beneficial in terms of its representational features, for
example, Park (1998) found that animation was a more effective visual tool than static
graphics when the entity depicted is itself an animated event or object. Park (1998) also
maintains that animation provides several important instructional roles, such as attracting and
directing attention, to represent domain knowledge involving movement and in explaining
complex knowledge phenomena, e.g. structural and functional relationships among system
components. Jones and Scaife (2000) also found benefits which related to the explicit
depiction of motional aspects, i.e. information about dynamic changes, temporal relational
aspects (e.g. learners could construct clearer models about how the valves worked and how
the heart 'pumped'). This motional characteristic of animation is generally perceived to
potentially enrich learning (Large 1994).
Summary of previous research
In summary, then previous research into animation consists of a multitude of studies
investigating whether or not animation is beneficial to learning in a general sense within each
of the particular domains, conditions, subject groups etc.. of the study undertaken. This

makes integration of the research findings into any coherent understanding of the use of
animation in education unrealistic and therefore, findings from animation research is
inconclusive.
2.3.3. Reasons for inconclusiveness of animation research
The inconclusiveness of previous research has been commented on by several other
reviewers (e.g. Large 1996, Park 1998, Betrancourt & Tversky 2000) who suggest that these
problems arise from the diversity of potential research factors and variables within the field
of animation in education resulting in vast differentiation between studies (Betrancourt &
Tversky 2000), and from methodological and theoretical problems of this research area (Park
1998). Although many of these methodological problems may apply to other research areas
within education and learning, they are presented here in relation to research on animation,
followed by a discussion on the further drawbacks of primarily focusing on comparative
studies (comparing general learning between different representational formats) for
uncovering particular benefits or disadvantages of using animation.
(i) Domain space
A large array of different domains have been used for experimental investigation makes
generalisations to other domains difficult. For example, physics (e.g. Rieber 1990, Dahlqvist
1997), biology (e.g. Mayer and Sims 1994, Hays 1996), economics (e.g. Grimes and Whiley
1996), weather understanding (e.g. Lowe 1994, 1996). Some of these studies showed learning
benefits while others did not, and those that did generally cited variables other than those
specific to animation affecting the outcome, for example, spatial ability (Hays 1996), with the
exception of Lowe (1996). This study showed a focus on the specific effects of animation in
interpreting the diagram, finding that animation increased the ability to detect gross pattern
changes on the display.
(ii) Participants
Different subject groups were used in different experiments, again reducing the opportunity
to generalise results. However, studies do indicate that children respond differently from
adults to animation (Rieber 1989, 1991), and may therefore process this kind of information
differently. However, it is unclear whether this difference is a developmental difference or
difference in expertise. Other studies indicate potential differences in spatial ability, which
may have some bearing on the effectiveness of animation, but requires further research.

(iii) Individual differences
Participants in different studies varied in terms of their expertise with using such diagrams,
their motivation, their level of prior knowledge, their spatial ability, all of which will affect
the ways in which they interact with different kinds of representational formats. For example,
expertise at ‘reading’ animation may facilitate the ability to retrieve certain kinds of
information from the display, which is unavailable to novice animation ‘readers’. Expertise
within the domain of the animated representation may also facilitate information retrieval and
it has in fact been well researched that differences exist in the way information is perceived
and understood according to the level of expertise of the learner/user, due to the effect of
their internal representations on the way they interact with the diagram (e.g. De Groot 1965,
Hinsley et. al 1977, Egan and Schwartz 1979, Ehrlich and Soloway 1984, Lowe 1994).
Spatial ability also has been found to affect understanding of dynamic systems. Hegarty et al
(1999) investigated understanding of motion through the use of mental animation, i.e. the
ability to infer motion from static diagrams, in terms of mental model construction of
movement. Understanding was shown to be related to individual spatial ability and the type
of system or diagram used in terms of its complexity (one moving component or several
components moving simultaneously). In these studies learners were required to mentally
simulate movement of a system, thus requiring them to ‘work out’ the dynamics. By contrast,
providing explicit visual representation of motion (through animated diagrams) precludes the
need to ‘work out’ dynamical aspects. The effect of this ‘provision’ of such images on
learning (animation), therefore, requires further investigation.
(iv) Task differences and outcome measures
Studies have also differed in the learning tasks and subsequent learning outcome measures
used, therefore targeting different kinds and aspects of learning. For example, Mayer and
Anderson (1992) focused on problem solving ability, Williamson and Abraham (1995) on
conceptual understanding interacting with student reason ability, whereas Large et. al’s
(1995) study involved procedural learning, and Rieber’s (1991) study comprised incidental
learning. Although these studies provide information about the use of animation in certain
learning situations with certain kinds of tasks, they provide little information about how or
what feature of the animation assists or not the learning that takes place.

(v) Different measures
Research has also been criticised for the differences in outcome variables used, (from recall
to problem transfer tests, using verbal or written tests, descriptive or multiple choice
questions), as well as differences in time lag between testing and viewing (e.g. Large 1994).
Several researchers focused on immediate post testing, whereas delayed testing may provide
more information on the implications of the research. For example, Mayton (1991) found
animation to be beneficial in adults, the effects of which persisted one week later. However,
there seems to be no uniform agreement on appropriate time delays for testing.
(vi) Representation design
The particular design of the representations used may also affect learning outcomes. Some of
the research findings cited above could be related to particular design of the representational
formats used, for example, Park’s (1998) study showed no significant differences between
animated and static diagrams when the static diagram contained appropriate motion cues. Not
only may the design of the static or textual information affect results, but also the particular
design of the animation itself.
2.3.4. Further issues relating to previous research
Although, these methodological problems may be generally applicable to research in this
kind of area, there are further problems for research into animation due to the primary focus
of the majority of studies. They predominantly concentrate on (i) general learning outcomes,
which detracts from examining particular features of the representational formats in terms of
their specific cognitive advantages and disadvantages, and (ii) on comparisons between
different representational formats (e.g. static diagrams versus animated, text versus
animation), which open the studies up to several additional drawbacks.
Information equivalence
To make a beneficial comparison between different representational formats it is desirable
that they are informationally equivalent, as far as is possible. Several experiments
investigating the effectiveness of different diagrammatic representation do not guarantee
information equivalence between the different representational formats used. Thus, any
benefits from the representations cannot necessarily be attributed to cognitive or
computational properties, but may be due to one representation containing more information
than another (Cheng, Lowe & Scaife 2001), making it impossible to draw conclusions from

multiple studies on animations (Morrison and Tversky 2000). The concept of informational
equivalence can occur on different levels: the ‘equivalence’ of the media of the representation
(paper or computer) (Pane, Corbett and John 1996) or the ‘equivalence’ of the information
contained in each of the diagrams. Simon and Larkin (1987) define information as equivalent
when all information provided by one representation is inferable from the other and vice
versa. However, they also make a distinction between this and computational equivalence,
which is present when representations are informationally equivalent and any inference that
can be drawn quickly and easily from one can be drawn as quickly and easily from the other.
However, it is debatable whether information in one representation can ever be truly
equivalent to that of another representation in a different format. The very fact that it is
presented in a different way may alter the information that is imparted, and will certainly
alter the way in which it is imparted. This in turn will also influence the specific aspect(s) of
the information that is imparted. In this way then information cannot, strictly speaking, be
said to be equivalent from one representation to another. For example, when looking at
animated diagrams and static diagrams, the depiction of a diagram could be identical in terms
of the graphics used, the colour, the dimensions, the outline, the components, the text
accompanying the diagram, but as soon as one representation is animated the information
imparted is no longer equivalent to the information imparted from the static diagram. This,
then poses a problem when comparing animated and static diagrams if information
equivalence is to be realised.
Comparisons of different kinds of representations or different teaching situations?
The majority of the previous studies investigating the value of animation come from differing
viewpoints, for example, comparisons between static and animated versions of the same or
similar information or comparisons between text and animation. Large’s (1996) review of
animation states that much research has “centred on whether the addition of animation
enhances educational value of text” (p.9). In investigating this other variables likely to affect
learning outcomes automatically come into play, such as the type of text (narrative,
descriptive) the complexity of the text (based on different reading levels) and the length or
layout of the text. This then becomes research into the value of animation interacting with
text resulting in studies potentially specifying benefits with one type of text but not another,
and detracting from the effectiveness of animation per se.

Other reviewers have generalised results across studies that compare animated and static with
studies that compared CAL (Computer Assisted Learning) with regular teaching (Betrancourt
and Tversky 2000). But again the additional variables affecting learning are potentially huge,
and isolating the effects of animation particularly must be virtually impossible. For example,
CAL offers more different media and other teaching input than using one particular
representational format. Therefore, although CAL might contain animation, the benefits of
one learning situation over another cannot be attributed to the animation per se. Overall
comparative studies have the effect of assessing learning in particular situations about
particular topics, but do not address the issues related to how and in what ways animation
affects cognition, be it beneficial or detrimental.
Animation has also been noted for its qualities of ‘attraction’ (e.g. Park 1998). Therefore,
when making comparisons across representational formats or even different teaching
situations, the animation may detract attention from text or other media, resulting in a
potential imbalance in attention to the material presented. Again this reduces the conclusions
that can feasibly be drawn about the specific effectiveness or not of animation.
Underlying cognition
Studies investigating comparative differences in learning show mixed results; sometimes
static representations are beneficial over animated, sometimes animated are beneficial over
static, or there are no significant differences between the two. However, much of the previous
research comparing the effects of animated with static or textual representations focuses on
fairly general learning outcomes, rather than on the underlying cognitive processing leading
to that learning. Straight comparisons of learning outcomes in terms of amount of knowledge
acquired gives little information about the particular usefulness of animation. Although, some
research has begun to point to some issues relevant for further research into the cognitive
effectiveness of animation, such as, attracting and directing attention, explaining complex
phenomena and dynamic systems (Park 1998), proposed benefits for low prior knowledge
and high spatial ability pupils (Mayer 1997), and aiding construction of mental models (Park
and Gittelman 1995), the specific mechanisms remain undefined. It is unclear as to what kind
of information attention is attracted and directed to. Is it the overall moving image, or
individual components or the dynamic events themselves? It is also unclear whether effective
‘explaining’ of phenomena is effective for eliciting adequate comprehension. Animation may
be beneficial for different individuals in terms of spatial ability or prior knowledge, and in

constructing mental models, but there is as yet no clear understanding in what ways
animation facilitates processing in these circumstances. There is little specific evidence
indicating when animation is valuable, what aspects of animation are valuable, or indeed
when and under what circumstances animation may be detrimental to learning. It is
uncovering the more detail of this underlying processing that is important in informing how
animation may or may not be beneficial to learning.
2.3.5. Summary of research
Varied use of different methodologies and variables make generalisations about the findings
of the effectiveness of animation difficult. Results across studies are therefore inconsistent or
domain/ task / user specific. It seems that, not surprisingly, animation is sometimes beneficial
and sometimes not to understanding or learning. Overall learning comparisons offer an
indication that one representation might be better than another in a given circumstance, but
offer no indication as to how or why. Comparison of different formats may however be
useful if differences in the kinds of learning that take place are unfolded, rather than an
overall learning comparison. If particular differences in learning can be identified this would
then provide bases for locating where animation may be most beneficial and/or most
hindering to learning (Jones and Scaife 1999). Furthermore, this information can then be used
as a basis from which to examine particular aspects or properties of animated diagrams that
are different from static diagrams and that may be beneficial to learning.
Thus, previous research has served to emphasise the underlying complexity of researching
the cognitive effectiveness of animation and the need for further more systematic
investigation, and a more general analytical framework within which learning with animation
can be investigated. This research tries to address this by taking and examining the effects of
the underlying representational properties of animation on cognition (see 2.4. below) to
discover what it is about animation that makes it easier or more difficult to understand, what
are the properties of animation that render it one thing or another.
2.3.6. Problems with assumptions about animation
From research into the learning effects of animation it is apparent that assumptions that may
have been made about the cognitive benefits of animation (as a result of conclusions of
diagrams research generally), may not necessarily hold true. Although, animation may depict
dynamic events or aspects more visually explicitly the form of animation itself may detract

from the potential benefits of this explicitness. Certain properties of representations have
been cited to potentially generate cognitive complexities for the user. Stenning (1998), for
example, proposes that animation results in complexity for the learner and may be a
consequence of the following characteristics of animation; i) evanescence, the problem of
memory load is enhanced by the 'transient form' of animation. Animation consists of a
sequence of fleeting images, which pass by, are not persistent, which means that all
sequences of movement need to be held in memory to integrate with new pieces of
information to understand the process; ii) control, the evanescent form means that learners
are unable to reaccess pieces of information from the animation as they are no longer
perceptually available. Learners therefore have no control over what information is viewed,
or for how long, as the information is continuously passing by. Kaiser et al. (1992)
investigating understanding of mechanics found that where only one dimension of the
dynamic information was present then animation facilitated accurate observation. This
suggests that 'parsing' of dynamic events is important in facilitating correct dynamical
judgement. One factor that may influence this is the focus of attention of the learner on the
dynamic event, or even the amount of effort invested on the half of the learner in processing
the information. The provision of a visual depiction of dynamics may prevent learners from
investing cognitive effort, reducing the level of learning taking place (Hannafin and Phillips
1987).
Thus, there are indications from other research that the properties of animation that go hand
in hand with visual explicit depiction of dynamics, may not automatically be cognitively
beneficial through perceptual availability and computational offloading. The interaction of
these kinds of cognitive effects with the particular representational format may have different
outcomes from those discovered for static diagrams.
2.3.7. Implications for this research
Generally speaking previous research into animation offers small snippets of useful
information in relation to the benefits or not of animation, and provides one or two clear
proposals for the design of these graphics in learning situations. For example, the benefits of
providing verbal explanation contiguously with the animation, and providing appropriate
motion cues on static information presentations of dynamic systems or processes. However,
the research generally does not reveal any significant information about the specific cognitive
processing involved in reading animated diagrams nor does it provide sufficient theoretical

grounding for further research into the use of animation for learning. Very little research has
explored how animation may be beneficial for learning. Studies have mostly looked at the
general effects on learning with animated representations, more often than not in comparison
with static presentations of the same information. Studies have also focused to large degree
on variables such as task, domain, individual differences, training, particular learning
outcomes, rather than focusing on the cognitive processing that occurs when interacting with
an animated diagram. Although these studies may give some indication of the comparative
value of animation for particular domains and for particular subject groups, they do not
provide information on how the animation is cognitively beneficial or detrimental to learning.
The question of the ways in which animation may or may not facilitate learning has not been
comprehensively addressed. As a result no systematic way has been developed for
investigating the effectiveness of animation for learning. What is needed is a more detailed
account of how processing occurs when using animation, not just instances of improved
general learning outcomes. The focus of research needs to be more directed at what it is that
makes an animation an animation and the cognition involved in reading this kind of
representation.
One way to obtain information about the cognitive effectiveness of diagrams would be to
investigate them on a more specific level in terms of the representational properties or
characteristics of the diagram. Thus, the form and features particular to animation need to be
identified and the effects of these examined at a more specific level. For example, by
exploring the effect of explicit depiction of graphical change on understanding. This would
enable clearer conclusions to be drawn about the effectiveness or not of representing
dynamics through animation. Furthermore, if information is procured that shows the
cognitive effect of specific properties of animation then this information may be
generalisable to other domains and situations where the same representational properties are
present. This thesis attempts to define a way of evaluating animation that enables more
generalisation across studies, by focusing on inherent properties of the representation and
examining the effect of these on learning about a dynamic process.
By focusing on the cognitive interaction with properties of the representation the thesis is
also able to explore ways in which information is processed. This should provide clearer
information about the cognitive effectiveness of animation as “the processes that evaluate and
interpret the representations are as important as the representations themselves” Rumelhart

and Norman (1987, p. 20). Thus, the research in this thesis is also an attempt to begin the
development of a cognitive model of processing animated diagrams.
2.4. Theoretical background
To achieve the aims of this thesis it is important that the focus of the research is on
investigating the cognitive value of animation. Some previous research has investigated the
cognitive value of graphical representations by identifying particular cognitive benefits of
particular representational formats (e.g. Larkin and Simon 1987, Zhang and Norman 1994).
When working with diagrams, learners need to focus on and collect various pieces of
information, which need to be integrated both with previous (internal) knowledge and with
the current (external) information they are using. The focus on a general level, in
understanding the effects of different diagrammatic representations on comprehension, then,
is the relationship between internal and external representations and the mapping of meaning
across the two.
2.4.1. External cognition framework
As a theoretical basis for investigating the cognitive value of representations, the ‘Cognitive
Interactivity’ framework developed by Scaife and Rogers (1996) emphasises this interplay
between internal and external representations on cognition through; (i) exploring how new
information is integrated with existing knowledge and re-represented and (ii) the
identification of the cognitive benefits and costs of particular forms of representations, by
identifying the properties of external representations in terms of their computational
offloading. On a general level, computational offloading refers to the ways in which different
structures constrain the amount of cognitive effort required to solve informationally
equivalent problems. For example; graphical constraining occurs when different graphical
forms of representations of the same information will limit the kind of inferences that are
likely to be made, thus guiding thinking towards the concept to be acquired; Re-
representation occurs when different external representations, that have the same abstract
structure, make problem-solving easier or more difficult; Temporal/spatial constraining
occurs when representations can make relevant aspects of processes and events more salient
when distributed over time. In this framework, diagrams need to be investigated by
examining particular aspects of learning such as, the kinds of inferences made, what
information is lost, misinterpreted or correctly construed, how understanding is integrated

with previous knowledge, and the effect of using different representations of the same
structure.
On a more specific level, computational offloading may be a result of design issues or issues
that relate specifically to the properties or features of the diagrams. In the field of computer
systems and visual programming languages Green (e.g. 1989, 1991) introduced, and others
have also developed (e.g. Green and Blackwell 1998), an analytical framework for evaluating
the effectiveness of particular programming languages, enabling definitions of when
particular visual programming languages or aspects of those programming languages, are
beneficial or not for particular tasks.
2.4.2. Cognitive Dimensions framework
This framework focuses on analysing the semantic properties of diagrams in order to reveal
particular cognitive benefits of particular diagrammatic representations for particular
contexts. These properties are termed ‘cognitive dimensions of notation’. According to Green
(1989) “…. a ‘cognitive dimension’ of a notation is a characteristic of the way that
information is structured and represented, one that is shared by many notations of different
types and, by its interaction with the human cognitive architecture, has a strong influence on
how people use the notation” (p.448). Here there is an emphasis on the interaction between
the representation and human cognition, and the resultant effect on processing. The use of
term ‘dimension’ within Green’s (1989, 1991) framework means that certain features of a
system or programme in relation to the user can be identified. These features exist on some
kind of continuum that is likely to have trade offs in terms of benefits or disadvantages, for
example, more of the identified dimension may give benefits to the system but not provide
cognitive benefits, or vice versa. A system will also contain several dimensions, so that any
changes on one dimension may also affect another dimension. This may have implications
for design, such that if difficulties that arise from one dimension are resolved, the action
taken to fix the problem may have adverse effects on another dimension (Blackwell et. al
2001).
Although Green (1989) cites several cognitive dimensions of notation and of information
artefacts (and further research is expanding this list, e.g. Green and Petre 1996), and the
context of their description has been applied to systems and program language evaluation as
well as a wide range of artefacts (such as, central heating timers, telephones) some of these

dimensions also emerge as potential starting points for investigating the cognitive value of
using animation. For example, the concept of role expressiveness is defined as “the purpose
of a component (or an action or a symbol) is readily inferred” (Green and Blackwell 1998, p.
41). This particular dimension refers to the visibility and parsability of a meaningful
structure, defining the ease with which the structure can be, for example, broken into smaller
parts, relationships identified. In terms of animation this may be translated into the visibility
of particular aspects of an animated representation and to the parsability of the animated
information. Thus, this might refer to which aspects of the animated diagram are most visible,
and how easy or difficult it is for the learner to break down, or parse, all the pieces of
information imparted into salient groupings and into a salient order, and make appropriate
relationships or links between the information.
2.4.3. Relevant research for exploring cognitive interaction
As previously discussed research investigating the use of static and animated representations
shows no conclusive understanding about the cognitive effectiveness of animation. However
some research has begun to determine certain cognitive complexities of processing dynamic
illustration (e.g. Kaiser et. al. 1992, Large et. al. 1994, Stenning 1998). Overall this research
suggests that although animation may have potential benefits in the explicit depiction of
dynamics, the increased processing demands of animation may be problematic for
comprehension for several reasons: (i) the use of animation on diagrams results in an
unmanageable possible increase of perceptually available information, especially where
multidimensional dynamics are involved (e.g. Kaiser et al 1992, Lowe 1999); (ii) due to the
transient form of information animation can result in increased memory load, the learner
having to remember and integrate information across several representations (e.g. Kaiser et.
al. 1992, Stenning 1998, Lowe 1999); (iii) the need to focus on several different changes
occurring at the same time on the diagram, (iv) multimedia generally can create problems in
learners having to integrate multiple representations not always simultaneously available on
the screen (Rogers and Scaife 1997, Hoogeveen 1997). This section of the chapter will
discuss research that has begun to identify features of animated representations that are
important for cognition. For the purposes of this research three main bodies of work have
been identified; complexities of animation from its fundamental form (Stenning 1998); the
feature of graphical change (Lowe 1999); and the issues of multiple representations (Rogers
and Scaife 1997, Cox and Brna 1995).

(i) Animation complexity
Certain aspects of animation have been cited to be potentially cognitively complex.
Stenning (1998) suggests that such complexity may be a result of the particular
characteristics of the medium. Firstly animation is evanescent, i.e. the information is transient
and passes by as the animation plays. It is not persistent like that of a static diagram where
the information displayed is continuously available to the learner. The evanescent form has
certain cognitive consequences for the learner; (i) it increases memory load, as all sequences
of movement displayed need to be held in memory in order to integrate new pieces of
information with information that has already passed by, and (ii) the level of learner control
is reduced, as the evanescent form means that learners are unable to reaccess pieces of
information that are no longer perceptually available. Learners also have no control over
what information is viewed, or for how long, as the information is continuously passing by.
Although it is possible for some level of control to be given to the learner, allowing some re-
access to information, for example, animations could run at slower speeds, they could be
stopped and started by the learner, the underlying form of dynamic depiction remains a series
of fleeting images resulting in transient information. Stenning (1998) also discusses the
implications of the expressiveness of animation. He believes that animation demands that all
fields displayed are fully determined at all times. This means that all aspects of a process or
system occurring at a particular time must be shown simultaneously. If only one part of a
dynamic process or system is depicted the learner could make false inferences about the way
that the system or process works. However, the trade off is that this may make focusing
attention on particular aspects of the representation problematic, which consequently affects
the expressiveness of the representation.
(ii) Graphical change
The transient form of animation results from the display of a sequence of still images the
purpose of which is to depict change of some kind. This change is depicted through graphical
differences from one frame to the next. Lowe (1999) has defined dynamics by specifying
distinctive aspects of graphical change. Thus, graphical change can be described according to
form or position, defined as extrinsic characteristics (movement from one location to another)
or intrinsic characteristics (change in size, shape, orientation etc..) (Lowe 1999). By
analysing these changes Lowe (1999) was able to show that there were differences in the

level of attention or processing that occurred according to the type of graphical change. For
example, information was extracted according to the ‘perceptual conspicuity’ of the graphical
change taking place, i.e. if an item was moving from one place to another, this trajectory was
attended to more than changes in the form, or the intrinsic characteristics of graphical
changes taking place. This means that the kind of information that is extracted from an
animation is likely to be fragmented and consequently incoherent. However, the primary
attribute that animation offers is this explicit depiction of changes over time. Further research
into the cognitive effects of these different forms of graphical change, not only in terms of
their perceptual prominence, but also in terms of their interpretations, would be beneficial in
informing about the way that information is processed from animation.
(iii) multiple representations
A further issue that emerges from analysis of the representational form of animation is the
resultant number of different frames required to depict changes over time. Each frame that
depicts the process or system is in some respects different from the previous frame, although
there will also be continuous underlying similarities. Taken together this results in a series of
multiple representations, requiring integration from one representation to another on the half
of the learner. Not only is the learner having to integrate information from different
representations, but also from representations no longer available on the screen. Integration
across representations not simultaneously available has already been cited to make
understanding more problematic (Hoogeveen 1997, Rogers and Scaife 1997). The majority of
research exploring the effects of multiple representations investigates integration or
understanding from more than one different representational format rather than from several
instances of one representational format, as is the case with animation. For example, one aim
of research is to examine how different combinations of representations influence learning
(Ainsworth 1999), under the premise that learning benefits can be obtained from the
particular properties of each representational format to facilitate more comprehensive
understanding (Van Labeke 2001). In some respects animation may be assumed to offer the
same kind of benefits in that it provides ‘more’ information to the learner, in the case of
animation it offers more dynamic information. However, a major difference is that learners
using animation are required to integrate constantly changing information at the same time as
they are viewing new information.

Other research has investigated the use of multiple diagrams in diagrammatic reasoning, and
has cited additional cognitive burdens for learners who are required to, (i) remember where
to look next in the total set of diagrams, (i) extract information across the multiple diagrams,
and (iii) integrate the extracted information to build up a coherent representation (Kim and
Hahn 1997). However, here the set of diagrams together make up a ‘whole’ diagram, and
therefore again differ from animation where the multiple diagrams portray a whole process
rather than smaller parts of one diagram, they display smaller parts of a process. Kim and
Hahn (1997) suggest that facilitation of integration occurs through provision of visual cues
that indicate relationships between items in one diagram and items in the other diagrams, and
link the information inferred from different diagrams.
Despite these differences in characterization of multiple representations or multiple diagrams
and a composite series of diagrams produced by animation, there are parallels between the
kinds of activities learners are having to undertake, namely making links between events or
items on diagrams, and integrating the information across the different representations.
2.5. Cognitive models of processing
Much research in understanding different aspects of cognition has explored ways in which
information is processed in order to describe a cognitive model of processing for a given area
of cognition, for example, models of memory (e.g. Tulving 1972, Craik and Lockhart 1972),
models of reading (e.g. de Beaugrande 1985), models of problem solving (e.g. Simon 1985),
models of representation or mental models (Johnson-Laird 1985). The literature on cognitive
modelling is wide, therefore for the purposes of this thesis the concept of cognitive process
models will be discussed in ways specifically related to providing a foundation for this thesis
to explore ways in which information is processed from animated diagrams. Although, there
are many different ways that a process model can be conceived some particular
classifications can be identified relating to the representation, the learner and an interaction
between the two.
2.5.1. Top-down and bottom-up processing
One conception is that a cognitive model consists of two highly interrelated processes where
the characteristics of the representation interact with the characteristics of the learner. This

model consists of the perceptual process and the conceptual process, or in other words,
bottom-up and top-down processing. Perceptual or bottom-up processing emphasizes the
external representation, where understanding begins with processing small units from the
representation and proceeds from part to whole understanding. In learning from diagrams this
would entail cognitively accessing the visual components of the diagram, and in animation
this would also include the dynamic events that occur. Conceptual or top-down processing
emphasizes what the learner brings to the representation, such as prior knowledge and
experience that enables the generating and refining of hypotheses. Thus, understanding
proceeds from whole to part with prior knowledge guiding the learner to more specific
information. In learning with animated diagrams the extent of prior knowledge and expertise
at reading diagrams would cognitively guide the learner in their processing of the
information. Previous research has confirmed that significant differences exist in the way that
representations and external tools to cognition are used according to these differences:
(i) Level of prior knowledge
The fundamental differences between novice and expert are the size of their domain
knowledge (larger) and the way that knowledge is organised (better) (Satchwell 1996).
Research has shown that there are differences in the way information is perceived and
understood according to the level of expertise of the learner/user, due to the effect of their
internal representations on the way they interact with the diagram. This phenomena has been
demonstrated in several different domains and contexts. An early study carried out by De
Groot (1965) showed that expert chess players used information from a chess display
significantly differently from novice chess players. Experts not only recognised more
meaningful chess configurations, but organised the information into chunks that related to
specific functions or strategies. Chunking meaningful information also facilitated their
memory of what they saw. Similar results have been found in mathematics (Hinsley et. al
1977), electronics (Egan and Schwartz 1979), computer programming (Ehrlich and Soloway
1984) (cited National Research Council 2000).
Cognitive processing of dynamics has also been shown to differ according to the level of
domain knowledge (Lowe 1994, 1999). Lowe’s (1994) study investigating differences
between novice and experts of meteorology using animated representations of weather maps,
showed that those with low domain knowledge tended to rely on the visuo-spatial
characteristics of the diagram to drive their interaction, rather than on domain relevant
descriptions and relational aspects of meteorology, which significantly affected the kinds of
predictions made. Experts, therefore, perceive a diagrammatic representation in a more
meaningful way (relating to the task, goals or aims of the information, and the wider context
of the domain), are able to reduce processing/memory load by chunking information
appropriately, structure the information they perceive in a more relevant way, and use the
information to make more appropriate deductions, inferences or predictions.
(ii) expertise with the representation
Type of processing can also be different according to expertise at using the particular
representation. According to cognitive load theory automated schemas of representations
facilitates processing, for example, an expert in algebra will treat the equations as a single
automated schema or ‘chunk’ requiring less working memory, whereas a novice needs to
treat each symbol individually increasing working memory (Tuovinen 1997). Those with
more expertise at reading diagrams (or particular types of diagrams) will more likely process
information from the diagram more efficiently, and therefore differently, than novices to
diagram reading.
2.5.2. Structure versus function processing
A model of processing that focuses more on the representational characteristics can be
divided into two aspects: understanding the structure of the concept and understanding the
function of the concept. In the context of diagrams this would entail understanding the
structure through identifying and understanding the components of the diagram as well as
understanding the function of those structures within the diagram. These aspects can be
further conceived on a general level and a specific level in terms of processing. At a general
level of processing the animation understanding the structure entails integrating the static
components of the diagram with the dynamic components, and understanding the functional
relationships between the two. On a more specific level a model could be described for
particularly processing the dynamics i.e. for processing graphical change. Here understanding
can again be divided into structure and function, the structure comprises the graphical
changes themselves and the function comprises the function or meaning of those changes.
The research in this thesis concerns both the structural as well as the functional understanding
of animation.

2.5.3. Incremental reasoning and cognitive models
A model of processing that focuses on the learner aspects of processing includes models of
incremental reasoning. Incremental reasoning, when learners gradually build up their
knowledge by taking in small amounts of information at a time, gradually combining their
knowledge with previously acquired pieces of information, has been found to take place
during reasoning about dynamic information from static diagrams (e.g. Hegarty 1992,
Narayanan, Suwa, & Motoda, 1994) and learning from animated diagrams (Jones and Scaife
1999). From their research into models of mental animation through multimodel learning
(learning with multimodal representations i.e. multimedia systems) Narayanan and Hegarty
(2000) propose a cognitive model for understanding multimedia presentations in the domains
of mechanics and algorithms. These domains consist of the use of dynamic or changing
information. In order to learn within these domains Narayanan and Hegarty (2000) propose
the following cognitive stages: decomposing graphical representations into smaller
components: making connections in memory between components, both between each other
and to prior knowledge: making referential connections between different media type
displays that refer to the same domain: identifying causality within the system: constructing
a dynamic mental model by mental animation. Although, mental simulation was the
underlying basis of this research, some aspects of this kind of cognitive model may be
necessary for comprehension using animated diagrams, for example, decomposing graphical
representations into smaller components (for working with animation this comprises
decomposition on two levels, perceptual aspects i.e. graphical change and conceptual aspects
i.e. domain sections): making connections in memory between components, both with prior
knowledge and with each other in both graphical change and domain sections: as well as
identifying causal links. The concept of decomposing information into smaller components
has been proposed to underlie many processes of perception, learning and cognition (e.g. De
Groot and Miller, cited Gobet et. al. 2001). In their research Gobet et. al. (2001) distinguish
two forms of chunking; the first is deliberate, goal-oriented chunking, the second is automatic
chunking which is linked to perceptual processes. This theory of chunking corresponds to top
down and bottom up processing and to the notion of the ways in which an animated diagram
may be decomposed or parsed into smaller components for processing.
This section introduced some aspects of cognitive models for the research in this thesis,
showing the importance of the representational features, the learner features and the
interaction between the two in the processing of information. Propositions from these kinds

of models form the basis for research in this thesis investigating cognitive processing of
animated diagrams, the particulars of which are explained in more detail in chapter three.
2.6. Summary and conclusion
This chapter has placed the current research within the field of external representations and
cognition, and has reviewed research that has focused on animation as an external tool in the
light of the proposed research in this thesis. The review also described relevant theoretical
and analytical frameworks as a basis for the subsequent research in this thesis, as well as
introducing the concept of processing models in the context of defining a cognitive model of
animation. There are several other factors and variables which may also affect the cognitive
effectiveness of animation, but are not explored in this thesis. The problem at present is that
the different factors and variables are so numerous that the characteristics of animation are
difficult to expose. What is needed first is a standard model of processing that can be applied
in future research to uncover the specific effects of particular other variables. However, some
important variables that warrant further investigation are presented in the final chapter of this
thesis (chapter nine) in the light of both relevant previous research and the findings from this
current research.

Chapter 3
Theoretical Rationale and Methodology
3.1. Introduction
Chapter two presented a review of relevant background literature to this research. This
chapter explicates more specifically the problem space addressed in this thesis and the ways
in which the problem will be tackled. The focus of this thesis is to investigate ways in which
learners cognitively interact with animated diagrams to learn about dynamic processes, with a
view to describing components that may contribute to a cognitive model of processing
animation. To do this the research focuses on investigating the effects of some of the
properties particular to animated representations on understanding and learning. This chapter
will, therefore, describe the rationale and method for the subsequent studies in this thesis in
the following sections (i) defining the problem space, (ii) identifying particular properties of
animated representations, (iii) identifying learning steps potentially required with this kind of
representation, (iv) proposing a cognitive model of processing, and (v) developing
appropriate methods for researching this problem space.
3.2. Defining the problem space
As can be seen from chapter two research into the use of diagrammatic animation shows
mixed results in terms of the learning or understanding that has taken place. However,
research has not as yet uncovered the way in which learners read and integrate information
from a dynamic representation. The present research aims to investigate more specifically the
cognitive processing that occurs when cognitively interacting with an animated diagram, with
the ultimate aim of describing a cognitive model of processing. This kind of investigation
should show more precisely how particular aspects of the representation influence the way
learners perceive information and construct knowledge. Constructing a process model should
potentially mean that conclusions drawn about cognitive processing with animation are more
generalisable across different kinds of animated diagrams, as the basis used here for the
research defines animation in terms of its specific characteristics, rather than the

characteristics of the subject domain itself. This may not only provide information for
creating guidelines on designing effective representations, but also potentially enables the
development of guidelines on how best to direct learning when using animated
representations.
3.2.1. Defining a process model
From chapter two it is evident that cognitive process models are used in various domains in
an attempt to describe cognition, and can be defined in different ways and at varying levels of
description. Using animated diagrams involves ‘reading’ a particular kind of representation.
The theoretical rationale in this thesis emphasises the contribution of both the learning
requirements and the representation in facilitating cognition. This is therefore in accord with
an interactive process of ‘reading’. For the purpose of this research a process model will be
investigated at a level of description that focuses on the salience (visibility and identification)
of animated features and the interpretation of that animated information, together with the
integration of the information acquired, and the potential effect of these on resulting
conceptual understanding.
To do this certain principal issues need to be addressed and defined in relation to the
research. (i) Identification of the specific properties of animated representations. This
distinguishes the relevant features of the representation to be investigated, such as, graphical
change, which should provide information specific to a cognitive model of animation. (ii)
Identification of the learning steps required to understand information from animation, for
example, identifying important components of the diagram for acquiring relevant
information, identifying graphical change and understanding graphical change. Defining
these issues in detail will then facilitate the appropriate design of empirical work. A process
model of animated diagrams proposed by this research should, therefore, explicate the
cognitive processes involved in using this representational format in terms of its particular
representational properties and in terms of the learning steps required. This should provide
information about how specific properties of animation may affect cognition, the kinds of
understanding that may take place, and aspects of the representation that are pertinent in
facilitating or hindering comprehension.

3.3. Identification of specific dimensions of animated representations
3.3.1. Properties of representations
Research from static diagrams as well as sentential representations, suggests that each
representation has certain properties that are inherent in the structure of the representation
that may be beneficial (or not) to cognitive processing in domains such as problem solving or
reasoning. Properties of static diagrams already identified will inevitably also be present in
animated diagrams. However, it is not only the properties, but also the cognitive effects of the
properties that are important for this research. In order to investigate the underlying cognition
of using animation, the importance of identifying aspects of a representation that affect
cognitive processing of information has been cited by Green (1989, 1991) and Scaife and
Rogers (1996). As described in chapter two, the 'Cognitive Interactivity' framework (Scaife
and Rogers 1996) highlights the importance of investigating external representations in terms
of the cognitive interaction between internal and external representations by exploring ways
in which new information is integrated with existing knowledge and identifying particular
cognitive benefits and costs of representations by describing properties of the external
representation in terms of their computational offloading. On a general level, computational
offloading refers to the ways in which different forms of the representation can confine the
amount of cognitive effort needed to solve problems or understand concepts from the
representation. On a more specific level, computational offloading may be a result of issues
that relate specifically to the graphical properties of the diagrams, for example, graphical
constraining, temporal and spatial constraining, and other properties of the external
representation that are related to design issues, such as, explicitness, visibility - the degree to
which learners attention is directed to important aspects at different stages of the learning task
(see 2.3.1. for more detail). Green (1989, 1991) has proposed the importance of analysing the
semantic properties of diagrams, in order to discover the cognitive benefits of particular
diagrammatic semantics for particular contexts (see 2.3.2. for more detail), which he termed
cognitive dimensions. Similarly, animated diagrams may have specific properties that
facilitate or hinder the cognition process. Therefore, an effective paradigm for investigating
animation, is to define the form of animation and identify cognitive and/or semantic
properties or dimensions that are specific to animation, and explore ways in which they are
beneficial or detrimental to processing information.
3.3.2. Cognitive Dimensions

As presented in chapter two the term ‘cognitive dimensions’ (Green 1989, 1991) was
developed in the context of analysing systems and programming and a wide range of
information artefacts. Certain features of a system, identified in relation to the user are
characterized as cognitive dimensions because they have some relevance to the system or
programme being cognitively beneficial or hindering. In understanding cognition in relation
to animation identifying some kind of dimensions of the diagrams that have a cognitive effect
(be it beneficial or detrimental to learning) may help us to understand how the representation
guides or influences reasoning or learning with that particular representation. In this way the
concept of cognitive dimensions may be a useful way of investigating the effects of
animation on cognition. If features or properties particular to the representation can be
identified, then these aspects can be investigated in terms of their effect on cognition. These
features or properties of the representations may then be able to be modified by designers or
learners, therefore providing more or less of the feature that is beneficial or not to cognitive
processing. These features too are likely to offer trade offs in terms of cognition, e.g. by
providing one aspect that is beneficial to cognition may affect another dimension that is then
detrimental to cognition. In the context of this thesis these features will collectively be termed
‘cognitive dimensions of animated representations’ or CDAR (akin to Green’s cognitive
dimensions of notation).
3.3.3. Properties of animated diagrams
Animated diagrams are a special class of diagrams, therefore representational properties
affecting cognition that are inherent in diagrams generally will inevitably be present in
animated diagrams too. For example, the form of diagrams is generally abstract resulting in a
limited amount of information being displayed. This ‘selectivity’ has been suggested to be
cognitively beneficial for several reasons, such as, highlighting the main important aspects,
enabling clarity through omission of unnecessary detail, comprising markings which indicate
relational aspects, and a more specific focus of information results from removal of the topic
from its broader context (Lowe 1994). Diagrams also provide explicit visual information
about such aspects as spatial relations, and enable simultaneous presentation of large
amounts of information, facilitating information search in one representation. However,
although the static graphical illustration may be similar in both a static and animated diagram,
the explicit depiction of movement through animation creates a fundamental difference
between the two representations. This explicit depiction of dynamics also generates specific
representational properties. These properties in turn may affect the way that the information

is processed, and as such, can also be seen as Cognitive Dimensions of Animated
Representations (CDAR). Certain dimensions relating to explicit depiction of dynamics are
selected and used for investigation in this thesis.
3.3.4. The form of animation
Cognitive properties specific to animation result from the basic graphical form of animation
itself. The Computer Animation Dictionary (Roncarrelli 1989) defines animation as
"producing the illusion of movement in a film/video by photographing, or otherwise
recording, a series of single frames, each showing incremental changes in the position of the
subject images which when shown in sequence, at high speed, give the illusion of
movement”. Animation is, therefore, a sequence of fleeting images occurring in the same
place but distributed across time. Generally this means that an event denoted by an earlier set
of images occurs before an event denoted by a later set of images (Stenning 1998).
Animation deals not only with movement from one location to another, but also with any
change in an object be it change in position, colour, brightness, size, and metamorphosis, i.e.
change from one object into another (Sundberg 1998).
3.3.5. Preliminary Cognitive Dimensions of Animated Representations
Previous research has already identified some specific properties of animation that affect
cognition (e.g. Lowe 1996, Stenning 1998). The overriding quality that animation appears to
have is that of visual explicit depiction of dynamics (visual dynamic explicitness). Although
this might be cognitively beneficial due to the provision of clearer dynamic aspects of a
process or system, and due to the degree of computational offloading this might offer,
previous research has suggested that this visual explicitness of dynamics may also bring with
it other cognitive effects. The CDAR identified for this research are as follows:
(i) Multidimensionality (amount of simultaneous information)
Diagrams are often used to display large amounts of information simultaneously in one
representation. As a result of the explicit depiction of dynamics, animated diagrams have an
additional amount of perceptually available information. This could influence cognition in
two different ways: (i) reducing computational offloading through visual explicit depiction of
dynamics making motional aspects of the information more salient and ‘easy’ to understand,
and /or (ii) increasing the effort required on the part of the learner to focus their attention as a
consequence of the large amount of different information occurring in the diagram at one

time. The quantity of information may not only be due to increased perceptual availability of
dynamics, but also to the desire or need to ensure that the animation does not generate false
inferences due to abstracting information. Stenning (1998) argues that “animation demands
that the whole field is fully determined at all times”, i.e. that the animation illustrates all
aspects of the depicted context at all times. Thus, if certain dynamics isolated from their
context are depicted the learner may falsely infer that those dynamic events not concurrently
shown are no longer taking place or do not occur simultaneously. ‘Fully determined
animation’ could arguably increase the difficulty for the user to focus their attention on any
one particular aspect, or even to know which are the salient aspects to attend to. This may
create additional complexity to the information being displayed in terms of the level of
dynamic information load. Focusing attention on the important features of a visual
representation, including animation, has already been stipulated as important for learners (e.g.
Rieber 1991, Milheim 1993).
(ii) Transient media
As cited above the form of animation differs most from static in that the illusion of
movement is brought about by depicting a series of consecutive frames. This intrinsic
property of animation representing change over time means that the media fundamentally
differs from that of static presentations in that it becomes evanescent, as opposed to persistent
(Stenning 1998). Thus, information is transient, it passes by and is no longer available for
perusal by the user. Its evanescent quality, therefore, (i) contributes to memory load, as the
learner has to remember what has previously happened in order to link it with what is now
happening, and (ii) affects the ease at which a learner can re-access the information. Learner/
user control is further reduced by the fact that the changes that constitute evanescence are
traditionally with the creator of the animation, and not with the learner or the learners needs.
However, it is true that only some of the information (i.e. dynamic information) on the
diagram is transient, while some underlying depictions of a system remain persistent. It is
also true that animated diagrams may not be uniform in the degree to which they are
animated, for example, only a proportion of the aspects of the diagram that could illustrate
motion may be animated. This in itself may have implications for cognition as the learner is
required to integrate information that is animated with information that is static.
(iii) Graphical change

Another inherent property of the animation is that the sequence of still images depicts change
of some kind, enabling visually explicit depiction of dynamics. Lowe (1999) identified
aspects of dynamism in relation to change according to form or position, defined as extrinsic
characteristics or translation to refer to movement from one location to another, and intrinsic
characteristics or transformation to refer to change in size, shape, orientation etc... These
changes are physical, morphological changes in the sense that they refer to the surface details
of graphical components and can be perceived directly through vision. These can be seen as
‘morphological properties’ of graphical change. However, these changes also “represent”
something in the sense that they denote some kind of event or meaning within the domain
being animated. If the graphical change is to make any sense in terms of what it is
representing, then the learner needs to distinguish particular meaning of each graphical
change. The meaning of the graphical change can be seen as ‘semantic properties’ of the
animation. Therefore, animation properties relevant to the learner are morphological
properties in terms of their salience, and semantic properties in terms of their interpretability.
Lowe (1999) also suggested that learner attention is selectively distributed according to
perceptual salience rather than thematic relevance. This results in “selective inattention”
which occurs according to the relative magnitude of changes and their extrinsic or intrinsic
nature. Therefore salience of graphical change may be dependent not only on the graphical
component itself, but also on the frequency, speed, and magnitude of dynamic change.
(iv) Explicit temporal depiction
As animation form inherently depicts a series of changes through sequences of still images, it
inevitably depicts an order of events within the representation. However, not only does it
display temporal sequence, but it can also show tempo. Thus, explicit depiction of any
differences in relational rate of change or motion are displayed. Although this feature is
important in the use of animation it is not specifically addressed in this research, as several
aspects of temporal depiction, such as, relational timing of events, the effect of different
speeds or tempo, require investigation. Instead these issues will be discussed in more detail in
recommendations for future research.
Thus, animation has dimensions specific to its representational format that may influence
cognition. This thesis concentrates on the following properties of animation together with
their associated cognitive demands; (i) multidimensionality, which here refers to the quantity
of simultaneous information, which may affect the level of computational offloading and

appropriate attention focus, according to the level of dynamic information load (ii) the
evanescent quality of the presentation, which contributes to memory load, and (iii) the
graphical change used to depict dynamics, which the learner must identify and interpret, and
therefore has at least two cognitive demands; visibility demands and interpretive demands.
Thus, out of these representational properties it can be seen that they have implications for
cognition in terms of the visibility of the information (this is akin to Green’s 1989 cognitive
dimension of role-expressiveness, see 2.3.2.), attention focus, and memory load.
3.4. Identification of learning aspects
Identifying the learning process can be approached in different ways, for example by doing
longitudinal studies with novices learning to be experts in a particular domain and
discovering the stages or strategies used in moving from novice to expert (Anzai 1991). Other
research emphasises the importance of identifying particular characteristics that are thought
to promote learning, such as student prior knowledge, skills, learning preferences (Brna, Cox
and Good 1997). According to Green (1989) the use of cognitive dimensions should be tied
to a clear model of user activity, and given this particular model of behaviour analysis using
cognitive dimensions can inform about the requirements of the system. In this research the
model of user activity is learning dynamic systems using animated representations, where the
style of interaction with the animation is primarily cognitive. Although the focus of this
research is primarily on cognitive interaction with animated diagrams it is understood that a
user activity model where the user has different levels of physical interactivity with the
representations (e.g. by varying types and degrees of manipulation) may bring to light
different cognitive dimensions of the representation. Green (1991) also expresses the need to
understand the users’ ‘model’ or knowledge structure in order to understand the visibility and
parsability of a meaningful structure. This may be interpreted as the visibility of particular
aspects of the representation and as the parsability of the components within the information.
In terms of an animated diagram this might refer to which aspects are most visible, and how
easy or difficult it is for the learner to parse all the pieces of information imparted into salient
groupings and into a salient order. This suggests the importance of understanding a learners
‘mental model’ of a system in order to facilitate parsing of information or in order to make
visible salient aspects of information. Therefore understanding the learning process and
learner task are important in identifying cognitive processes for describing a process model.

There are many aspects of the diagram that ultimately contribute to making sense of the
information, several of which are true of diagrams generally. For example; context related
issues, such as, being aware of the subject domain of the diagram, being aware of the frame
of reference, knowing specific aspects within that subject domain that need to be learned;
graphical component issues, such as, mapping of components, relationships between
components, and dependencies between components. There are other aspects such as
particular design issues that may influence the readability of the diagram. For example, there
are several different ways of graphically depicting the concepts displayed, as well as different
ways of graphically illustrating motion. For instance, flow may be depicted using arrows
showing direction, dots as fluid, solid use of colour filling the track of the flow etc..
However, this thesis will not address the effects of design at this level (e.g. the effect of
colour or size of a particular graphical object), but will attempt to look at design issues on a
more global level such as the degree of dynamic information, the visibility of dynamics and
the kind of interpretation of dynamics. There are also further aspects of the diagram that
contribute to understanding; (i) the moving aspects of the diagram; movements of parts
remaining in one location; movement of parts from one location to another, which parts
move, how the parts move, why the parts move, what function they serve, the dependencies
of one movement on another, what moves from where to where, the functions that the
movements serve, the changes that take place (ii) the mapping of animated components to the
real world, to one another and relationships between dynamic and non-dynamic information
(iii) temporal relations: what moves where when, any order of changes or events, the speed of
the different movements and/or components, time delays between movements of parts or
movements from one place to another.
3.4.1. Identification of appropriate learning process
The research here uses a model of learning that focuses on aspects within the representation
that are important for contributing to the learners understanding of the depicted process. In
order to make sense of an animated diagram, there are several tasks required by the learner.
Once the overall domain and frame of reference of the diagram have been established, the
learner needs to identify components of the diagram. By selecting pieces of information the
learner is automatically segregating information in the representation. Therefore, the next
stage of processing involves reintegrating segregated pieces of information into a coherent
whole. However, at some stage in these proceedings the learner has to attribute meaning to
each of these aspects in order to understand both the segregated pieces of information and the

integrated pieces of information. The meaning placed on separate pieces of information will
inevitably influence final understanding of the representation as a whole. Therefore, not only
are the integration of perceptual and conceptual processes important in diagram
understanding, but also the process of interpretation. The emphasis in this thesis is on the
learning process occurring in relation to the CDAR (Cognitive Dimensions of Animated
Representation) described above.
Much emphasis is put on parsing as an important element in using external representations to
facilitate knowledge construction (e.g. Witrock 1977, Laurillard 1995). The concept of
parsing although traditionally used in the domain of language understanding can be applied to
other information distributors and may be a useful concept to use in determining valuable
features for reading animated diagrams, providing a basis on which to analyse how animated
information is perceived, attended to, interpreted and understood. Parsing in reference to
language means to break down a sentence into component parts of speech (into words or
phrases) and identify each component for analysis (e.g. adjective, verb, noun). Parsing in
linguistics can also be divided into lexical analysis which focuses on the form, function and
syntactical relationship within a sentence, and semantic parsing where the meaning of the
string of words is determined (http://www.webopedia.com). In language semantic parsing can
be based on several aspects, for example, interpretation can be based on intonation, meaning
within the context, punctuation, and /or listeners input/interpretation. Here information is
broken down into meaningful parts, possibly in different ways and for different reasons in
order to understand the meaning intended. Diagrams also distribute information, research
having shown that they too are parsed in order to understand the information being imparted.
Diagrams also can be parsed syntactically (where the focus is on the graphical structure and
relationships in the diagram, e.g. Futrelle 1998), akin to lexical analysis, or semantically
(where the focus is on the meaning being imparted in the diagram) akin to semantic parsing.
Rieber (1990) cites the importance in chunking information into relevant components in
focusing attention and directing awareness to relevant motion taking place.
The research in this thesis is interested in the semantic parsing of animated diagrams and
refers to the cognitive parsing of visual information. As a particular feature of animation is to
explicitly depict movement, parsing of the dynamics themselves may be an important part of
comprehending the animation. However, in order to comprehensively understand a concept it
may also be important to make links between pieces of information and integrate that
information into a coherent whole. Parsing by isolating smaller sections of the diagram or
information as a whole (not just dynamics) may also been seen as being instrumental in
learning with animation. Thus, there seem to be two plausible levels in parsing an animation
to extract meaning from the diagram. In this thesis parsing will be defined on two levels (i)
parsing in terms of dynamics (graphical change), and (ii) parsing of the information of the
domain itself.
(i) Dynamic parsing
This comprises parsing dynamic information from the diagram i.e. change of some kind from
one frame of the animation to the next. These changes may be in terms of dynamic form
and /or graphical change and the interpretation of these. Dynamic form includes the
following aspects; type of movement, rate of movement, frequency of movement, location of
movement, and size of the moving object/aspect. Graphical change consists of change of
position (translation) and change of state (transformation) (Lowe 1996). These changes need
to be identified, separated, grouped with other information, interpreted and incorporated with
each other in order to build up knowledge of the depicted concept as a whole. Each of these
aspects will be identified and discussed below.
(ii) Domain parsing
This comprises parsing of relevant sections within the domain before integrating these pieces
of information together. As well as parsing dynamic aspects specifically, the diagram can
also be parsed on the level of small discrete subsections of information. This facilitates focus
of attention onto important domain aspects of the diagram and may enable guidance in
building up a ‘holistic’ picture.
The parsing process as described here focuses on the procedure as one of decomposition of
the representation consisting of the following stages (i) selection of information and (ii)
segregation of information, but does not include what seems to be a vital part of
understanding - that of interpretation of the components of information, be they dynamic or
domain aspects. Placing meaning or interpretation on particular pieces of information may be
critical to the overall understanding obtained from the diagram. Therefore, when using
animated diagrams parsing can occur on a graphical change level and a general domain level,
both of which comprise a perceptual stage, an interpretation stage, and an integration

(conceptual) stage. Thus, several relevant stages of the parsing process that may contribute to
a comprehensive understanding from an animated representation are proposed.
(a) selection and identification of information
To make sense of any graphical representation, the components of the diagram must be
noticed and, in turn, recognised and mapped onto objects or concepts from the real world. In
animated diagrams not only must these components be recognised as representing things
from the real world, but any dynamics between components or changes of components must
also be noticed and seen to represent events that occur within the real world. The question is
whether or not certain dynamics draw more attention (are more noticeable) than others,
which components or events are most salient and why. Selection of information is concerned
with salience and mapping of motional aspects of the diagram.
(b) Segregation of perceptual dynamic information
By selecting certain pieces of information, graphical objects or movement, the representation
is automatically being segmented or broken into smaller components. According to literature
on vision, perceptual parsing consists of visual segregation. Visual segregation encompasses:
separation of an object from its surroundings by identifying each component object as a
whole: and perceptual grouping, which refers to the way objects are perceptually grouped.
This grouping can significantly effect the perceived image, and potentially the interpretation
of that image. So, in animated diagrams is there any basis for segregation and perceptual
grouping? What criteria are used for segregating dynamics? e.g. type of movement, location
of movement. Are the different categories of dynamics (dynamic form and graphical change
of state) segregated and grouped separately.
(c) Interpretation
This comprises putting meaning onto graphical change and dynamic form in order to make
sense of the dynamics displayed in the context of the domain of the diagram. Interpretation
could be seen to take place on two levels, (i) mapping the graphical object onto something it
is representing in the real world, and (ii) interpreting the meaning of any graphical change
that takes place. It is the latter of these that is the primary focus in terms of interpretation in
this research, as ‘reading’ animated diagrams requires the learner to understand the meaning
of the dynamics displayed.

(d) Information integration
This comprises integrating the pieces of information taken from the diagram, and from
previous knowledge to make sense of the system. Integrating the information from the
diagram consists of at least two aspects, (i) ordering the separate pieces of information, and
(ii) making links between separate pieces of information. Ordering information refers not
only to the order when reconstructing information, but also the order in which focusing and
attending takes place, and the order in which information is sequenced while interacting with
the diagram. These aspects may all affect the meaning and understanding taken from the
diagram. Making links refers to the relevant connections that learners make between various
aspects of the information. Integration of information when using animation may be
complicated by certain properties of the representational format. For example, the animation
is constructed of many different frames depicting change. This not only renders the
information transient, but also creates multiple representations, across which new information
cannot be compared with previous information due to its transience.
3.4.2. Summary of proposed learning process
Individual differences in the amount and type of previous knowledge are inevitable, and
information cannot be tailored to all of these individual differences. The task of the learner in
a given learning context may also differ, as well as the animations themselves. The level of
interactivity and control available to the learner, and the degree to which these activities can
be customised to individuals may also differ. Although this kind of design may have different
cognitive effects than animating alone, the present research concentrates on the cognitive
effects of straight play through non-interactive animation. Despite this the important aspects
of learning must still be to be able to focus on salient pieces of information, understand the
pieces of information and integrate this information to construct relevant mental models. On
one plane, therefore, cognitive processing of animated diagrams can be seen on four
principal levels: a visual graphical level, an interpreting level, an integration level, and a
conceptual level. These principle levels can be explained in the following way:
(i) Visual level, which requires a learner to perceive components of the diagram and different
graphical changes that occur, and is therefore dependent on the salience of the components
and their dynamics. This level will potentially be affected by the multidimensionality of the
representation and the evanescence of the media.
(ii) Interpreting level, which requires that a learner make accurate interpretations of the
diagram. This entails understanding the meaning not only of individual components in terms

of what they represent, but also the dynamic changes that occur to those components and
what this means in relation to the diagram. The meanings in relation to each other also need
to be understood (causality). This level will potentially be affected by the visual level of
processing that is or has taken place.
(iii) Parsing, which requires that learners parse both the dynamic and domain information in
order to make appropriate implications and inferences.
(iv) Integration, which requires the learner to integrate all the information together, making
links between information on the diagram.
These levels are probably processed in parallel in some kind of hierarchical manner in terms
of the above categories, with the surface level at the top level and interpretation at a deeper
level. All of these processing stages or components may be influenced in some way by the
properties or features of the representation itself (e.g. multidimensionality, graphical change,
evanescence). Generally speaking it seems that there is likely to be some trade off between
benefits and disadvantages of all aspects of the properties of the representation in terms of
cognition. More perceptual information may provide computational offloading, but too much
may result in complexity, creating difficulty in focus of attention etc..
The previous two sections have highlighted characteristics and inherent features of animation
which may be considered to affect cognition when using animated diagrams, and has defined
a learning process considered to be appropriate when using this kind of representation. Those
characteristics or features of animated diagrams may facilitate or hinder this process of
learning. Thus, this research will investigate how information is processed from an animated
diagram by exploring how information is selected, segregated, interpreted, ordered, and
finally how links between pieces of information are made, according to the currently defined
CDAR of animation. In this way the manner in which certain features of animation affect
cognitive processing and in what ways they facilitate or hinder learning can be explored. It is
this interaction that will be used as the basis for defining the final CDAR for animation as
explored in this thesis.

3.5. Proposed Cognitive Model
From the learning model proposed above and identified features of animated representations,
the following initial cognitive model can be proposed. At one level of description processing
can initially be seen to consist of four principle components:
(i) Visual graphical level which consists of processing the graphical components and the
different graphical changes that occur on the animation, and is dependent on the salience of
those components and their dynamics.
(ii) Interpretation level, which consists of understanding the meaning not only of individual
components in terms of what they represent, but also of the dynamic changes that occur to
those components and what this means in relation to the diagram as a whole.
(iii) Integration level, which consists of integrating those dynamic pieces of information
together, making links between components, their dynamics and the persistent aspects of
information on the diagram. This level should also include integrating the external
information with current internal knowledge.
(iv) Conceptual level, which consists of understanding the system or process in such a way
that inferences about cause and effect can be made, and higher level inferences about
potential consequences of interruptions r breakdowns in the system or process.
It is expected that these levels are processed in an iterative kind of way. Although at the
beginning of processing the order described above may have some credence, it is expected
that subsequent processing will occur in parallel such that some dynamics are identified,
interpreted and integrated before others, and that the level higher conceptual understanding is
related to the amount of dynamic information that has been processed to this level.
However, it is anticipated that these proposed principle components of processing will be
affected by features of the representation such as, explicit dynamic depiction increasing
perceptual availability of information, sequential presentation of information as well as
parallel presentation, transience of the information. These features may affect the salience of
components an dynamics, memory load for information gone before and anticipation of
information in the future, attention to all the different changes occurring, and require linear
processing as well as parallel processing.
Generally speaking it seems that there will be some trade offs between benefits and
disadvantages of all aspects of the properties of the representation in terms of cognition.

More perceptual information may provide computational offloading to some degree, but too
much perceptual information may result in complexity of the representation, making focus of
attention difficult, and have an effect on the salience of information.
3.6. Researching the process model: methodological considerations
The theoretical basis from which to research a process model of animation has been
explicated, but in order to investigate a cognitive process model of animation several
methodological considerations need to be addressed: (i) the highlighted properties of
animation need to be defined in terms of their proposed effect on cognition, and these aspects
investigated, (ii) the choice of diagram class and domain to use for investigation, (iii) the
choice of participants for experimental exploration, (iv) the design of the materials to be used
(v) a suitable methodology for extracting this kind of information needs to be devised, and
(vi) appropriate tests for assessing learning outcomes need to designed.
3.6.1. Chosen class of diagrams
Research from previous studies looking at the use of animation, suggests that the nature of
the domain space influences the kinds of, and extent to which, investigations about the
benefits of animation can be made. As the aim of the study was to establish more clearly the
cognitive processing of dynamics and the benefits or disadvantages of learning using
animation, and the essence of animation is dynamics, it seemed appropriate to work with
domains where movement and change are inherent in the model or system being depicted.
Thus, diagrams that depict dynamic processes, such as the blood flow in the heart, lend
themselves to this purpose. This thesis, therefore, used the domain of cardiac circulation and
respiration processes to investigate the value of animation when learning a dynamic process.
Although it may be possible to get real pictures of the heart beating or images of the inside of
the heart, the most usual representations for learning this process are schematic. Schematic
representations also have been found to be more conducive to learning than pictorial
representations (Hegarty and Kozhevnikov 1999). The studies reported here used schematic
diagrams of the heart for learning the principles of cardiac circulation.
3.6.2. Choice of participants
Participants in all studies ranged between the ages of 12 – 14 years. This particular age group
were selected as the domain used and the kind of information to be tested was considered

most suitable for this stage within the school curriculum, without pupils being too familiar
(and therefore ‘expert’) with the domain. This research, therefore, primarily involves low
level domain knowledge users, indicating that their processing may be predominantly visuo-
spatially driven (Lowe 1994). Thus the theory behind the design and methodology of the
studies is a focus on visuo-spatial aspects of processing, and how this information may be
integrated or a mental model built. However, the diagrammatic form (in terms of selectivity)
also means that for a low domain knowledge user much information may be missing that
would enable them to make relevant relational connections between information on the
diagram and between relevant information not explicit from the diagram. Thus, another focus
is on which aspects are salient or explicit and the effectiveness or not of these features.
3.6.3. Designing the materials
The materials used were presented and designed with a primarily visual emphasis. The key
rationale for this was to enable specific focus on understanding the form of animation itself
and the effect of this on cognition, without confounding variables on learning such as
verbally given information. This meant isolating the visual aspects of the diagram, by
removing or not including verbal or textual information about the meanings of the diagram or
the conceptual information imparted. Textual information accompanying the diagrams and
explanations from the researcher gave information only on the context and frame of reference
of the diagram.
Diagram context and frame of reference
When learning a dynamic process or how a system works with very little background
knowledge, the knowledge construction process is likely to be distinctive. The representation
and style of introduction to the domain will almost certainly affect the learning process. As
the focus of this research is on animation properties, recognising the context or frame of
reference of the diagram is not an important factor. For this reason the context and frame of
reference was clearly given to the learners before they were introduced to the animation. This
meant that the studies could be focused on the animation and movement aspects of the
system, rather than on the leaner having to first work out the specific frame of reference of
the diagram and the major components of the system .

Learner task
Previous research that involves learning or knowledge acquisition suggests that learning is
affected by the task the learner is required to undertake. The task will influence the kind of
information attended to and the aspects of the information that are relevant to complete the
required task. It is therefore important to ensure that the task set addresses the issues in the
research question(s) being asked. It is also important to ensure that the task is appropriate to
the participants, for example the kind of task given to secondary school students would be
different from the kind of task given to university students. In this research the questions
asked are concerned with the effectiveness or not of different external representations in
cognition, but specifically in relation to animated (and static) diagrams of dynamic processes
or systems. The tasks that were set, therefore, focused on aspects that relate to learning the
dynamics of the system - areas of the system that could be depicted dynamically, such as
learning about blood flow.
3.6.4. Methods
The methods used in the research need to produce data that can both generate descriptions of
processing, as well as generate experimental evidence of patterns of processing. This
necessitates the use of both qualitative and quantitative data. Qualitative data (e.g. verbal
protocols) provides a rich source of description for proposed models of cognitive processing
with animation, while quantitative data (using more rigid experimental conditions) provides
experimental confirmation of proposed aspects of cognitive processing.
(i) Qualitative data
Verbal protocols and verbal description of the animations was the primary approach used.
These were obtained through open ended interviews and co-operative working to encourage
verbal interaction between both pupils and researcher. This method provides a richer kind of
interaction with the information and richer source of data in terms of such, aspects as errors
made, corrections given, and sudden realisation of knowledge. Therefore, despite potential
disadvantages of this kind of approach (such as the need to facilitate interaction as
participants may not be familiar or comfortable with talking, awareness of participants being
selective about what they say due to inexperience at expressing their thoughts), this method
was adopted as data was wanted, not only on the quantitative analysis of test scores, but also
on the qualitative analysis of the kinds of information noticed and the ways in which pupils
gleaned this information. Working in pairs also allows discourse between children,

facilitating the collection of verbal protocols (e.g. Scaife and Rogers 1997, Johnson 1999,
Schnotz & Grondziel 1999). One of the consequences of using verbal protocols is that pupils
automatically embark on self explaining. As described in chapter 1 this can have significant
cognitive benefits, and may affect learning outcomes of those pupils (Chi 1997). However,
although this must be taken into consideration, self explaining still provides relevant
information for this research.
(ii) Quantitative data
This kind of data provides more scientific evidence of the identified aspects of cognition
taken from verbal protocols and descriptions, through the use of experimental manipulations
and investigations of processing using animation. On the basis of descriptive evidence of
processing controlled experiments were undertaken to compare learning and processing about
different dynamic aspects of animations, also with the use of different animations.
Although there are a mixture of advantages and disadvantages to both methods of
investigation, the joint use of qualitative and quantitative data enables a more scientific
approach without losing the benefits of the richness obtained from verbal protocol data.
3.6.5. Assessing learning outcomes
Designing tests for assessing learning outcomes is a complex part of research. There are
many different learning outcomes and many different ways of assessment. The outcomes of
any test are dependent on many different factors such as the mode of assessment (written,
verbal, diagram, computer or paper presentation) and the kind of learning (recognition or
recall) being assessed, each of which comes with its advantages and disadvantages. Not only
do modes of assessment differ, but also the kind of test possible with each mode, for
example, a written test may be in multiple choice format or require a full descriptive
paragraph. Naturally the design of the particular test within a certain mode will depend on the
kind of learning being assessed, for example, multiple choice generates recognition whereas
descriptive writing generates recall. Not only are outcomes affected by the above factors, but
also by the kinds of information required - the specific content of the assessment - whether in
written, verbal or diagram format, for example, factual, conceptual, or inferential. Thus, there
are several design issues to consider when choosing ways of assessing learning. However, the
outcome of the assessment will also be dependent on other issues, for example, the
familiarity of the pupil with the kind of test being completed, as well the time expenditure

required by the pupil, as some forms of assessment are more time consuming than others.
These are important considerations given the constraints of carrying out research in
institutional settings such as schools.
It is important, therefore, when designing assessments to first determine the kinds of learning
required, the familiarity of tests as well as the specific learning outcomes to be measured.
Each assessment format may provide different kinds of information about learning, therefore,
this research makes use of a selection of these ways of measurement in an attempt to build a
comprehensive picture of cognitive processing with animation. In this thesis each empirical
chapter focuses on different learning aspects and assessment was therefore tailored to address
the particular learning aspects involved.
The rationale for requiring learning outcomes also affects the approach of assessment. For
example, comparison across different experimental conditions requires post testing, whereas
an assessment of within subject learning also requires pre testing. Again pre and post tests
and delayed post tests were employed according to the particular requirements of each study.
When designing tests to assess learning various criteria must be taken into consideration,
such as, the aims of experiment, the school curriculum, the age group concerned, varying
pupil ability, pupil time limitations. Therefore for this research the aim was to establish the
most appropriate tests for assessing knowledge for the following criteria;
establishing levels of dynamic and static knowledge
establishing levels of factual and conceptual knowledge
appropriate for 12-14 year age group
appropriate for the domain of cardiac circulation and respiration within the National
Curriculum
However, some generality of design was employed across all studies.
(i) pre-tests
These were used where assessment of learning gains was specifically required. Some studies,
for example, chapter 6 and 7, could not be pre-tested due to the content of the assessment.
The pre-tests used were developed with the aim of providing a base line level of knowledge
to compare with similar knowledge after experimental manipulation. To guard against the
possibility of priming occurring from the pre-test, a split half technique was employed when
pre tests were used.
(ii) post tests

The rationale of the post test will affect the specific content of the test, i.e. the ‘questions’
must be tailored to the information required, therefore different post tests were designed for
the different studies undertaken. All testing was pilot tested to ensure that questions were
valid, worded appropriately, not too difficult or too easy.
(iii) delayed post tests
The limitations of assessing cognitive benefits only with pre and immediate post tests are that
further delays in testing may result in different conclusions (Large 1996). The use of delayed
post tests, not only demonstrates the influence of learning experiences later (Scanlon et al
1998), but also allows conclusions to be drawn between the immediate and delayed effect of
animation. Delayed post tests are, therefore, employed in a number of studies where learning
gains are being evaluated (e.g. Thornton and Scoloff 1998, Sivasubramaniam 1999).
However, although useful, the outcomes of delayed post tests are likely to be dependent on
the time delay between testing. In this thesis delayed post tests were used in the final study as
this study targeted more overall understanding of the depicted concept rather than graphical
salience covered in earlier studies.
(iv) Representational format of tests
Assessing and testing knowledge can be undertaken in many different ways, for example,
verbally, through interview or explanation, written using descriptive writing, multiple choice,
and short answer questions, or through the use of diagrams by e.g. completing blank
diagrams or recognition tasks with diagrams. However, each test format has its advantages
and disadvantages in terms of, for example, what is being tested, familiarity of tests
techniques by participants, duration of time available for participant testing. This thesis uses
primarily short answer and multiple choice techniques, with two of the studies using a
diagram based test, one in combination with written questions. The rationale for employing
these test designs was driven by the information required by the study, as well as familiarity
on the part of pupil participants of using written tests, and the practical considerations in
respect of limiting the amount of class time pupils were missing.
3.7. Summary
The purpose of this chapter was to outline the problem space to be addressed in this thesis
and the theoretical rationale behind the studies undertaken in this current research. The main
aims of the thesis are to explore the use of an analytic framework that focuses on the
properties of the representation in conjunction with cognitive requirements of the learner in

order to identify cognitive components of a processing model of animation. If particular
cognitive dimensions of the representation can also be identified then these dimensions may
serve as a starting point for informing design of animation and/or learner guidance or
assistance in using such representations for learning.

Chapter 4
Diagram Representation: A comparison of animated and
static formats
4.1 Overview
This research investigates learning using animated diagrams of dynamic processes in order to
begin to establish a cognitive process model for animation. In addition, this may inform about
design issues for, and provide guidelines in relation to, learning with this kind of
representation. The studies presented here begin this progression by comparing learning using
either an animated or a static diagram of a dynamic system. The aim is to examine more
closely the validity of cognitive benefits assumed to result from visual explicitness, by
exploring potential differences in processing from different representational formats. The first
study highlights important cognitive and representational issues specific to animation, which
are examined in more detail in a follow up study, providing a clearer basis for the subsequent
research in this thesis.
4.2. Introduction
Multimedia enables novel ways of representing information through different media formats
and advances in graphical technology provide the facility for dynamic processes to be
represented in animated as well as static form. Park (1998), for example, claims that
animation can be an important instructional tool, serving such functions as, attracting and
directing learner attention, representing dynamic domains, and in explaining complex system
events (e.g. structural and functional relationships among system components). It may be true
that animation by virtue of its motion, attracts attention, but does it attract attention merely to
the overall moving image, thus, detracting from the individual components necessary to
understand the system? Or does it draw attention to the actual dynamics taking place,
especially if it is a multidimensional system or consists of a multifaceted dynamical system?
Animation, by enabling visually explicit representation of temporal aspects, may ‘explain’

complex phenomena, but are these explanations explicit enough for the learner to obtain
adequate comprehension? Although, this dynamic form may be more attractive to learners
and may, therefore, be assumed to be educationally beneficial, comprehensive research of
evidence behind the validity of this assumption is lacking.
Furthermore, diagrammatic research suggests that diagrams can facilitate cognition due to
explicit perceptual properties of the representational format. The explicit depiction of
components and relational aspects provides computational offloading precluding the need for
the learner to ‘work out’ certain aspects of the diagram. A resulting assumption, therefore,
could be that the more explicit depiction of movement offered through animation should be
particularly beneficial for learning about dynamics, due to additional computational
offloading for the learner. In contrast to Hegarty et. al. (1999), (where performance levels
were shown to be related to individual spatial ability and the type of system in terms of its
complexity - one moving component or several components moving simultaneously) the
research in this thesis provides explicit visual representation of movement (through animated
diagrams), precluding the need to ‘work out’ dynamic aspects and therefore reducing
cognitive processing through computational offloading. This enables investigation into
discovering the representational properties that may affect cognition and the consequent
learning or understanding that takes place. The onus then, here, is on the interaction between
the representational format and the learner, the interplay between internal and external
representations on cognition by identifying particular cognitive benefits and costs of
animation used to depict dynamic processes.
4.2.1. Summary of relevant research
Research into the effectiveness of computer animation for enhancing learning has been
varied, with inconsistent results often due to methodological problems and variance across
studies (Park 1998). Examples include the use of competing theories (dual coding, single
coding, mental models), the large number of variables involved (text and animation vary
according to lots of criteria - colour/black and white, degree of realism, type and complexity,
textual reading level), individual differences (adults versus children, spatial ability, prior
knowledge, intellectual ability, cognitive style), varied use of testing measures (recall,
recognition, MCQ, problem solving tasks), research environment (situated versus
experimental) (Large 1996) (see chapter 2 for more detail). Research into the use of

animation for learning is, therefore, inconclusive, and leaves much scope for more rigorous
research.
Several studies comparing the use of animated and static representations in varying domains
also show no consistent evidence of improved learner understanding, suggesting that
provision of a moving image may not necessarily facilitate overall conceptual understanding.
According to theories of computational offloading the visual explicit depiction of movement
should reduce cognitive processing and facilitate understanding of dynamics. However,
several researchers have cited the possible complexities of processing dynamic illustration
and multimedia (e.g. Kaiser et. al. 1992, Hoogeveen 1997, Large et. al. 1994, Stenning 1998).
This research suggests that animation may be problematic for comprehension for several
reasons: use of animation on diagrams results in an unmanageable increase of perceptually
available information, especially where multidimensional dynamics are involved (e.g. Kaiser
et al 1992); use of multimedia representations can result in cognitive or memory overload due
to too much information (Kaiser et. al. 1992), due to problems in having to integrate multiple
representations not always simultaneously available on the screen (Rogers and Scaife 1997,
Hoogeveen 1997), and due to the transience of the information (Stenning 1998). This
suggests that the visual explicitness and perceptual availability of information may, therefore,
have thresholds in terms of their cognitive benefit.
Other research into graphical representation and cognition suggest that it is the particular
forms of the representation (i.e. its representational properties) within a particular user
context that will affect cognition (Green 1989, Scaife and Rogers 1996). This idea is
confirmed by Zhang and Norman (1994) whose research into reasoning with graphical
representation suggests that different representational formats of the same structure “can
activate completely different processes” (Zhang and Norman 1994 p.118). Different
processes, in turn, may result in different conceptual understanding. Therefore, the different
representational structures of animated and static diagrams may generate different processes
and consequently result in different understanding. Thus, it may not necessarily follow that
the discovered cognitive benefits of static diagrams (e.g. reduction in cognitive processing
through visual explicitness, perceptual availability of information) also hold true for animated
diagrams. The representational format itself may be critical in the way that comprehension is
realised. As the fundamental representational properties of animated and static diagrams
differ, the kinds of cognitive processing and understanding that is gained from these formats

may also differ. However, although these representational formats clearly display certain
features differently, such as explicit movement depiction, both formats also display ‘static’
information. Thus, an animated diagram consists of a mixture of statically displayed
information and dynamically displayed information. This means that when using an animated
diagram learners need to attend to both of these characteristics of the representation. It might
be that the attraction of the explicit dynamic depiction detracts from the underlying static
aspects of the diagram. Investigating learning from both formats may provide a clearer
insight into the differences in representational formats and their effects on cognition.
4.2.2. Rationale and aims of studies
Thus, it is the representational properties that dictate whether certain aspects of the
representation are cognitively beneficial or not. It is investigating this that will give insight
into the particular cognitive benefits or disadvantages of animation. One example is the
“visibility” and “parsability” of a meaningful structure. This may be interpreted as the
visibility of particular aspects of the representation and particular components within the
information. In terms of an animated diagram this might refer to which aspects are most
visible, and how easy or difficult it is for the learner to parse all the pieces of information
imparted into salient groupings and into a salient order. Therefore, the studies in this chapter
focus on the effect of the explicit dynamic depiction inherently found in animation on
comprehension, as well as exploring issues related to parsing information from the diagram
by looking for patterns of attention focus, evidence of particular complexities of the
representations by examining differences in errors as well as accuracy.
The studies presented here were undertaken as exploratory studies looking at differences in
cognition between static and animated representations of dynamic systems. The aim was to
obtain information on the differences in processing between animated and static
representations, to pinpoint more specifically the features of an animated depiction of a
dynamic system that are different or result in different cognition from features of a static
representation. Moreover, the studies aim to begin to understand more clearly the kinds of
information that is noticed or overlooked, understood or misunderstood, in relation to
particular representational properties. This should facilitate clarification of pertinent
representational properties and learning requirements on which to base further investigation
into the cognitive processing of animated diagrams.

To do this two studies were carried out, which looked generally at two issues (i) differences
in understanding about a dynamic system using an animated or a static representation of the
process, in order to tease out differences in representational properties and variations in
consequent processing, and (ii) differences in understanding using two alternative approaches
to learning with the representations, in order to provide some insight into relevant learning
aspects using these kinds of representations.
4.3 Study 1: Comparison of animated and static formats of diagrammatic
representation
The aim of this study was primarily to investigate the effects of media type, paper-based
diagram versus computer-based animation, but the effects of design of the learning approach
was also investigated. Diagrammatic representation of blood flow through the heart was used
in CD ROM and paper format, to compare animated with static representation of the concept.
Two different task presentations were also used to be compatible with the different type of
learning that CD ROM presentation generates (an open freedom in information exploration)
as opposed to a formal teaching situation (a structured guidance with information); (i) an
open task where pupils were required to find out: how the blood flows in through and out of
the heart; about blood that is rich in oxygen, and blood that has less oxygen and about the
different chambers of the heart, and (ii) a structured task where pupils were given a
worksheet with specific aspects for them to investigate.
4.3.1. Method
Participants
One hundred and twelve year nine pupils aged thirteen and fourteen years, from two Sussex
community colleges participated in the study. Fifty three were male (mean age = 13 years 10
months; 166 months sd=3.2 months), and fifty nine were female (mean age = 13 years 11
months; 167 months sd=3.6 months). ‘Blood flow through the heart’ had not yet been
covered in the curriculum. Pupils using the CD ROM all professed to be familiar with CD
ROM use, and navigated the program with little difficulty. Pupils were informed that the
purpose of the experiment was to investigate learning from different diagram presentations
with a view to improving design.

Materials
Two types of information presentation were used; animated (CD ROM) or static (paper)
information. Two types of task were given; ‘open’ or ‘structured’. The same test was given to
all participants.
(i) CD ROM condition. The ‘heart’ section of ‘What’s the Secret?’ CD ROM from 3M
Learning Software was used (see appendix 1 for example frame). This was run on a
Macintosh Quadra 700 computer and on a Viglen PCI P.560 computer terminal. The
program consisted of information covering varying aspects about the heart, including
animated video presentation of blood flow through the heart, and accompanying text.
Information needed for overall understanding of blood flow was found on separate parts of
the program. Pupils were guided to the relevant areas prior to beginning their own
investigations. This was to ensure that they did not miss relevant aspects of the information,
which was a potential concern as (i) the information on the CD ROM is not confined
whereas the static information was, and (ii) their participation time was limited. Pupils
interacted with the program by selecting and clicking on areas of information or animated
videos as frequently as desired. Pupils were provided with pens and plain paper to make
their own notes while exploring the information if they chose.
(ii) Static paper condition. This consisted of colour printed information selected and taken
from the heart section of ‘What’s the Secret’ CD ROM (see appendix 2). The static
information was designed to ensure that coverage of information relating to blood flow
through the heart was as equivalent, as was possible, to the CD ROM information needed to
complete the test. The resultant information consisted of three static diagrams presented in a
coherent order to represent the different stages in blood flow as it progressed through the
heart. Pupils were provided with pens to make notes on the information if they chose.
(iii) Tasks. These were of two types; an open task and a structured worksheet, designed
collaboratively with a science teacher. The open task required pupils to do the following
(see appendix 3 (i) open task).
You have a friend Iona Heart, who is taking a first aid exam. Iona needs to know how the blood flows through her heart. In fifteen minutes use the CD ROM provided so that you can explain to Iona; How the blood flows in through and out of the heart.

About blood that is rich in oxygen, and blood that has less oxygen. About the different chambers of the heart.
The structured task consisted of a set of questions which pupils completed on their own sheet
as they worked with their allocated information (see appendix 3 (ii) structured worksheet) .
Half of the subjects in both the static and CD ROM conditions used the open task and the
other half used the worksheet. The tasks in this study were designed to elicit information
about pupil understanding of aspects that relate to a mixture of both statically displayed and
dynamically displayed information of the cardiac system, as these aspects relate to the
explicit differences between the two representational formats.
(iv) Post test. This consisted of a black and white diagram of the heart, which pupils had to
complete within five minutes, demonstrating their knowledge of blood flow through the heart
(see appendix 4). The test was a simplified version of the diagram taken from the CD ROM.
The diagram was simplified in terms of the number of vessels entering and leaving the heart,
as pupils in the pilot study found the original number of blood vessels too confusing. This
was not considered to reduce evidence of their knowledge of blood flow through the heart.
To complete the test diagram pupils were given blue and red pens and the eight following
labels; ‘to body’, ‘from body’, ‘to lungs’, ‘from lungs’, ‘right atrium’, ‘left atrium’, ‘right
ventricle’, ‘left ventricle’. They were instructed to use the blue pen for blood ‘less in oxygen’
(deoxygenated) and the red pen for blood ‘rich in oxygen’ (oxygenated), and use arrows to
show where the blood enters, flows through, and leaves the heart. They were also required to
put the eight provided labels in the appropriate places.
The materials were tested in a small pilot study, using four pairs of pupils in each condition,
to ensure that the information, task and test were appropriate. The pilot study was also used
to formulate the task instructions. The pilot study enabled the experimenter to assess CD
ROM interaction within the restricted time allocation, so that relevant guidance could be
given to participants in the CD ROM condition.
Design
Pupils participated in either the animated condition or the static condition, and used either an
open or structured task. The experiment was therefore a 2 (animated or static) x 2 (open or
structured) design. The two independent variables were type of information presentation, and
type of task given. The dependent variable was the test score. Participants were assigned to

work with information either in the animated (CD ROM) or the static (paper) format. Half of
each of these groups worked from the ‘open’ task, the other half used the structured
worksheet. All participants worked in pairs for fifteen minutes on their allocated information,
followed immediately by the test, which was undertaken individually. Time allocation was
decided as a combination of ensuring adequate time for collecting necessary information and
restrictions from school curriculum activities. Pupils either participated in a classroom or
small laboratory room, according to what was available in the school.
Procedure
As co-operative working was important to facilitate verbal interaction, pupils were allocated
in pairs by the teacher on the basis of working well together. This method was adopted as
data was wanted, not only on the quantitative analysis of test scores, but also on the
qualitative analysis of the kinds of information noticed and the ways in which pupils gleaned
this information (see chapter 3.5.5.). Sessions were, therefore, video recorded.
Animated condition. Participants sat in pairs in front of their allocated computer terminal,
with the heart section of ‘What’s the Secret?’ ready loaded. They were informed that they
had fifteen minutes to explore the CD ROM to find out the required information. The same
instructions were given verbally and in print so that participants could refer back to the task.
They were told they could make their own notes if they so desired. Approximately five
minutes was initially spent with the experimenter directing them to the most relevant areas of
information on the CD ROM, (for example, an animated video of blood flowing in through
and out of the heart) as the program covered several other areas relating to the heart, and time
restriction limited the freedom of exploration. Pupils could ask for guidance if they were
unable to find the information they needed, as navigation skills were not of interest in this
study. After fifteen minutes participants were moved to separate tables to complete the test.
Again instructions were given both verbally and in print. Blue and red pens were provided, as
were the eight appropriate labels. Use of information or notes was not permitted for the test.
Static condition. Two classes participated in this condition. One class was given the ‘open’
task, the other used the structured worksheet. Participants were also given the same
instructions verbally as in print. Participants again worked with the information in pairs for
fifteen minutes. They completed the test individually, also being provided with blue and red
pens, eight appropriate labels, and prohibited from using information or notes.

4.3.2. Results
Scoring Method: Four different aspects of the diagram, relating appropriately to the task and
the structured work sheet, were chosen for analysis. One point was allocated for each of the
following; (i) oxygenated and deoxygenated blood represented in separate sides of the heart;
(ii) depicting different types of blood in the correct sides; (iii) correct labelling using all eight
labels; (iv) correct depiction of direction of blood flow using arrows, or from labelling if
arrows were not used. Subjects could therefore receive a score from 0 to 4. An inter-observer
reliability score of 95% was achieved.
Analysis. The data were analysed to determine whether media presentation or task type
affected learning about blood flow through the heart, and to determine the kinds of inferences
made from the diagrams. The data are presented in three sections: (i) analyses of the effects
of both variables on the overall test score; (ii) analyses of the effects of variables on selected
areas of the test from which scores were obtained; (iii) analyses of errors made.
1. Analysis of both variables on the overall test score .
The means and standard deviations of the task scores are given in table 4.1.
Table 4.1. Mean test scores for media presentation and task type. (sd = standard deviation)
structured worksheet open task
CD ROM 2.29 sd = 1.24 1.79 sd = .99
paper static 2.43 sd = 1.43 1.86 sd = 1.33
A two way independent analysis of variance (ANOVA) was performed on the test scores (see
table 4.2).
Table 4.2. ANOVA table for score.
DF Sum of
squares
mean
square
F-value P-value
media 1 .32 .32 .20 0.65
task type 1 8.04 8.04 5.08 0.02
media/task 1 3.57E-2 3.57E-2 2.26E-2 0.88
residual 108 170.71 1.58

No significant main effect of media format was found, thus media presentation did not
significantly affect test scores. However, there was a significant main effect of task type (p =
0.02), Scheffe (p = 0.02). Those using the structured worksheet performed significantly better
than those using the open task, regardless of media presentation. No interaction was found
between the two variables (see figure 4.1).
Figure 4.1
Interaction line plot showing effects of media presentation and task types.
1.7
1.81.9
22.1
2.22.3
2.42.5
open structured
cdstatic
2. Analysis of the effects of variables on selected areas of the test
A series of two-tailed chi-square analyses were performed separately on the four selected
parts of the test to determine whether media presentation or task type affected performance in
particular areas of the test. No significant differences were shown in any section: blood in
separate sides, chi-square 0.017, d.f = 1, not significant; blood in correct sides, chi-square =
0.013, d.f = 1, not significant; labels, chi-square = 0.505, d.f = 1, not significant;
directionality, chi-square = 0.108, d.f = 1, not significant.
3. Analysis of errors made .
Despite the absence of overall significant differences on the four selected aspects, an
inspection of individual scores in percentages showed that pupils made more errors with
labelling and direction of blood flow.
84% = correct perception of separate sides.
69% = oxygenated and deoxygenated blood shown in correct sides
21% = correctly labelled.

34% = correct direction of blood flow.
Analysis of these aspects revealed differences in errors of interpretation of blood flow. The
two most noteworthy errors were; showing blood to flow into the heart deoxygenated but to
flow out oxygenated or vice versa; and perceiving the blood to enter the heart through the
ventricles and leave via the atria. A chi-square was performed to determine whether pupil
interpretations were affected by the two independent variables, and was found to be
significant for ‘in deoxygenated/out oxygenated’ (chi-square = 6.00; d.f = 1; Fisher exact p =
0.02), and approaching significance for ‘blood entry through ventricles’ (chi-square = 4.03;
d.f = 1; Fisher exact p = 0.06).
4.3.3. Discussion
Although overall understanding was not significantly different according to media
presentation (animated computer and static paper diagrams), understanding was significantly
affected by task presentation. Furthermore, analysis of specific areas of pupil learning
showed significant differences in errors made, which may highlight important areas of
diagram presentation in producing effective learning.
Much in line with previous research comparing static with animated diagrams (e.g.
Betrancourt and Tversky 2000), the results showed no significant difference in overall test
performance between computer and paper diagrams. Design of the paper information may
have been a contributing factor. For both formats to be graphically similar and be as
equivalent as possible in expressing the dynamics of the blood flow, the paper format
consisted of three diagrams of the heart demonstrating the different stages of blood flow. This
resulted in multiple representations rather than a single representation to express the
information. Consequently, integration of separate pieces of information (to a certain degree)
was required in learning from both the static and animated formats. Assimilation of multiple
representations and information may not only be more difficult with computer presentation
(Rogers and Scaife 1997), but also with paper presentation. One pupil specifically expressed
difficulty integrating the information from three diagrams into the one diagram presented in
the test. Comparison of diagrams involving one static representation could be beneficial in
clarifying this point. The static diagrams was also lacking in specific depiction of motion
cues, the motion having to be inferred from the differences between the three diagrams. This
may have had a profound effect on those using the static presentation as Park (1998) found

that the difference in performance between static and animated representations may be due to
whether or not static diagram contains appropriate motion cues.
Pupils using a structured worksheet were shown to demonstrate significantly better
understanding of blood flow through the heart than those using an open focused task. As
diagrams contain large amounts of information in one representation the possibility of a
gradual build-up of knowledge is reduced. It is left to the learner to decide which aspects are
important and which aspects to focus on first or second. Sequencing particular aspects in
separate sections may reduce confusion and result in a more logical and understandable
order. This suggests primarily the importance of organising information for learning. Not
only may it be important to guide learners towards specific pieces of information, but also to
order the aspects they attend to, in such a way that it enhances integration of information.
Focusing and sequencing relieves learners from deciding which aspects are important and in
which order to 'read' information, which may reduce confusion and enable focus of attention
on relevant aspects. This issue will be explored further in chapter 8.
Analysis of errors showed that the kinds of errors made differed according to presentational
format. This verifies that different representations not only influence whether problem
solving is easier or more difficult, but also generate different understanding, confirming that
different representational formats of a common structure “can activate completely different
processes” (Zhang and Norman 1994, p.118). This also suggests that certain aspects of a
concept may benefit from being represented either in static or in animated format. Four
particular aspects of comprehension of cardiac circulation were analysed for the purpose of
this study; understanding of oxygenated and deoxygenated blood being confined to separate
sides of the heart; depiction of oxygenated blood in the left side and deoxygenated blood in
the right side; labelling; and direction of blood flow. Errors made in the test were primarily
related to blood flow and labelling. As labelling the different sections of the heart and
circulatory system are not highly relevant to processing dynamics, the implications of errors
relating to blood flow only will be discussed here. The results suggest that either this subject
matter was just less clear from the diagrams and/or was more conceptually complex to grasp.
Understanding the blood flow may have been problematic for several reasons: (i) the static
diagram did not explicitly show direction of blood flow, as it lacked appropriate motion cues,
thus direction of flow had to be inferred from the labels (appendix 2). Pupils in the static
condition predominantly depicted blood flowing in via the ventricles and out via the atria,

suggesting that direction of flow in the static condition was problematic: (ii) on the animation
there was copious simultaneous movement of different parts and different types of blood,
making it difficult to see where each element was going and what each component was
doing. Pupils made comments such as “stop moving” and used the diagram in stationary
format to work out the blood flow. This supports evidence that multidimensional problems
may not be aided by animation (Kaiser et. al. 1992). Multidimensional dynamics in this
instance were not sequenced into separate dynamical processes (as advocated by Kaiser et. al.
1992), and resulted in a confused presentation of movement. It seems plausible that
‘direction’ could easily be misconstrued to show blood flowing in one colour and out the
other, thus resulting in the confusion of oxygenated in, deoxygenated out. This finding also
supports the principle that the design of the diagram in terms of its cognitive properties may
affect understanding, and that attention to the cognitive dimensions of representation is
important in understanding processing with particular representational formats. For example,
in terms of role-expressiveness (Green 1989), the visibility and parsability of salient pieces of
information from an animated diagram may be insufficiently available to the learner,
resulting in ambiguous presentation of information and subsequent errors in learning as cited
above.
Overall, improved understanding of circulation in the heart was not apparent from the use of
animation. Although animation increases perceptually available information and may
therefore be assumed to reduce cognitive processing, this increase may actually have a
different effect. (i) viewing an animation may result in cognitive effort and ‘working out’ of
dynamics being reduced to such a degree that learning is ineffectual, (ii) the increases
perceptually available information is a result of explicit dynamic depiction and may result in
dynamic information overload, increasing cognitive demands, (iii) perceptual availability
may not necessarily facilitate understanding. Although animation may be more explicit “our
perceptual appreciations do not spontaneously form the basis of our conceptual understanding
of dynamics” (Kaiser et. al. 1992, p.686). Anderson (1995) proposes that conceptual
knowledge is based on the meaning of a representation. Errors in pupil learning suggest that
comprehension of the function of the heart was lacking. For example, analysis of depiction of
direction of blood flow showed errors in representation of blood flowing into the heart
oxygenated and out deoxygenated, or vice versa were more prevalent in the animated
condition. This seems to attribute to the heart a similar functional role as the lungs, resulting
in errors in understanding blood flow. Functional information was not clear from either

presentation format. If meaning is important in conceptual understanding then awareness of
the function of the heart, or its components, may constrain inferences made from the diagram.
For example, if the function of the ventricles to ‘pump’ blood out of the heart is made
explicit, then this constrains the way that the blood is likely to flow. The function of a
represented structure may critically influence diagram interpretation. This also raises the
issue of external internal interaction and the effect of prior knowledge on the kinds of
information noticed and retrieved from diagrams (e.g. Lowe 1994 expert/ novice differences).
However, this error could also be seen to be a result of a representational feature which can
conceptually be seen to relate to Green’s (1989) concept of hidden dependencies in the role
that they play in cognition. In the context of this research understanding the way the system
works may be dependent on understanding the functions of particular components in their
relation to the functioning of the system as a whole and understanding links between the heart
and other processes within the lungs and the body. These ‘peripheral’ links and relationships
(to other interrelated processes) may be ‘hidden’ in the information presented in the
animation used in this study. Thus, the functions of individual components of a dynamic
system may be considered as dependencies, and a process within a process may be a
peripheral dependency for understanding the whole concept of cardiac circulation (also see
chapter 2.3.2. and 3.2.2. for detail on Cognitive Dimensions concept).
4.4. Study 2: Investigation of knowledge construction from animated diagrams
Study 1 demonstrated that different representational formats of the same process result in
different understanding, that understanding multidimensional dynamics is not necessarily
facilitated by animation alone, comprehension being dependent on other factors. However,
time restrictions within school and pupil participation meant that pupils were unable to
participate in further assessment such as talking more specifically through the process either
during their interaction with the diagram, or afterwards, thus, showing more explicitly where
the difficulties in comprehension lay. Study 2, therefore, examined more specifically, using
qualitative data, the differences in ways that pupils worked with animation and static
diagrams of blood flow, which parts they found hard or easy to understand, and investigated
cited claims about animation, for example, complexity from increased availability of
information, salience of certain aspects.

4.4.1. Method
Participants
Twenty two pupils aged thirteen and fourteen years from a Sussex Community College
participated in the study. Thirteen were male (mean age = 14 years; 168 months, sd = 6.9
months) and nine female (mean age = 14 years 2 months; 170 months, sd = 2.5 months).
Pupils were informed that the purpose of the study was to explore the kinds of information
they could retrieve from the diagrams they worked with.
Materials
Two types of information presentation were used:
Animated condition: The same CD ROM programme was used as in study1 and was run
on a Macintosh Quadra 700 computer terminal. However, in this study pupils worked only
with the animated diagram. Text information was obscured and introduced only if pupils
found it too difficult to retrieve information from the diagram alone. The purpose of this
was to enable specific focus on the effect of animation on understanding, by removing
other variables that could contribute to learning (see appendix 5 for example frame).
Pupils interacted with the programme only by clicking to view the animation again.
Static paper condition: This consisted of a single diagram taken from study1 showing
the heart and the lungs with blood vessels labelled to body from body, to lungs and from
lungs (see appendix 6). This diagram was used initially without the accompanying text to
again to avoid learning from other media than the diagram, e.g. textual explanation.
Task: Pupils were asked to use their allocated diagram to find out as much as they could
about the pathway of blood flow through the heart, how the heart pumped blood and how
the valves worked. The task set was fairly general in order to discover the kinds of things
noticed or attended to by pupils and the kinds of inferences made, whereas a specific task
would focus their attention on particular aspects.
Tests: These were of two types (see appendix 7);
i) A written questionnaire comprising a combination of multiple choice questions and free
recall questions. This kind of test enabled access to information about factual, functional and
conceptual knowledge, as well as specifically about blood flow pathways.
ii) A black and white blank diagram of the heart, which pupils had to complete,
demonstrating their knowledge of blood flow through the heart. This test facilitated
representation of knowledge in a similar format to the learning situation. The test was a
simplified version of the diagram taken from the CD ROM, as in study1. Pupils were

instructed to use the blue pen for blood ‘less in oxygen’ (deoxygenated) and the red pen for
blood ‘rich in oxygen’ (oxygenated), and use arrows to show where the blood enters, flows
through, and leaves the heart. They were also required to put labels indicating where the
blood was flowing to and from in appropriate places.
Design
This study primarily used verbal protocols, in order to obtain richer data on the kinds of
observations and understandings that were made by pupils. Pupils worked either with a
computer presented animated diagram or with a static paper diagram. All participants worked
in pairs with the researcher for approximately half an hour on their allocated information, but
those using the static diagram were also given an opportunity to briefly work with the
animated version, to investigate any further information. All sessions with pupils were video-
recorded.
Procedure
Pupils were allocated in pairs by the teacher. One of each pair was given a few minutes to
study the diagram alone. Time allowed was dependent on the individual pupil, but generally
did not exceed five minutes. This flexibility was to allow for individual differences and was
not considered to violate findings as direct comparison between pupil learning was not being
made. Pupil 1 was then required to explain to pupil 2 what the diagram was showing . They
then worked with the information together participating in discussions between themselves.
The researcher intervened only when pupils were unable to glean any more information, by
asking open questions or more specific questions depending on pupil progress (see appendix
2d for examples). The data was collected in this way to try to find out more specifically the
kinds of information that was clear or unclear, and the ways in which information was pieced
together.
4.4.2. Results and Discussion
Analysis in this study was made from transcripts taken from video-recordings of all sessions.
The results reported here are descriptive due to the methodology and kind of data collected,
and each pertinent aspect is identified and discussed simultaneously.
(i) One interesting and unexpected finding was that animation appeared to generate
artificially high confidence levels, increasing complexity and preventing learners from paying

appropriate attention to the information. For example, all pupils working with animation
expressed confidence of their understanding of the diagram, but when asked specific
questions e.g. about blood pathways, they were unable to give clear or complete answers.
This suggests that animation provides inappropriate computational offloading precluding the
possibility of effective learning, by giving the learner false certainty of gained knowledge.
Only when learners had to explain the process or were asked specific questions, were they
aware of their lack of understanding.
(ii)Two pairs made inaccurate interpretations of blood flow, perceiving blood flowing in one
colour but flowing out the other. This was interpreted as perceiving oxygen exchange taking
place inside the heart. Furthermore, these pupils stated that the function of the heart was to
‘clean the blood’ i.e. to oxygenate the blood. This equates with errors found in study1, also
suggesting that meaning and interpretation of a representation may be related, and that
understanding is dependent on aspects from the diagram that were ‘hidden’ or peripheral to
the system depicted i.e. functional relationships and the processes within the greater system.
(iii) Some pupils expressed difficulty with focusing, suggesting that directing attention to
pertinent pieces of information is important. With each viewing of the animation pupils were
able to explain blood flow in more detail, and combine this information with contraction and
valve action. Thus, they appear to take in small amounts of information at one time, gradually
combining their knowledge with previous pieces of information, which in line with previous
research, provides evidence of incremental reasoning (e.g. Hegarty 1992, Narayanan et al.
1994). This kind of reasoning highlights the importance of parsing or sequencing knowledge
acquisition. However, distinct patterns of attention became apparent when pupils were asked
questions about specific aspects. For example, all pupils primarily focused on blood flow.
After one more viewing four of the pairs noticed the heart contracting. No pupils
spontaneously noticed valve action and were specifically directed to this component by the
researcher. In terms of the concept of role-expressiveness this suggests that certain areas may
be identified as salient components to parse, and have a particular coherent order for parsing.
4.5. General Discussion
These two studies, then, have made some progress towards establishing aspects of the
representational format that affect cognition. As the focus of this research is on animation,

this discussion will primarily refer to findings that are pertinent to animated representation
and its further investigation. The discussion is structured around the representational
properties evident from these studies and their cognitive effects, under the following
headings; complexity of the representation, parsability of the representation and hidden
processes or peripheral dependencies.
4.5.1. Complexity of the representation:
Complexity of the representation may be due to several inherent characteristics of animation:
multidimensional dynamics, speed of motion, multifaceted moving components, transience of
information, difficulty in focusing attention, salience. Stenning (1998) suggests that such
complexity may be a result of the following characteristics of animation; i) evanescence, the
problem of memory load is enhanced by the 'transient form' of animation, which means that
all sequences of movement need to be held in memory to integrate with new pieces of
information to understand the process; ii) expressiveness (as defined by Stenning 1998, see
chapter 1); Animation demands a more expressive representation, as all aspects of a process
must be shown simultaneously, making focus on one aspect difficult; iii) control, the
evanescent form means that learners are unable to reaccess pieces of information as that
information is no longer perceptually available. Learners, therefore, have no control over
what information is viewed, or for how long, as information is continuously passing by.
These studies have shown evidence of some of these features and suggest ways in which they
affect cognitive processing with animation, all of which appear to fall within a more general
category of ‘visual explicitness’. An animated diagram of a dynamic system shows the
motion aspects and changes that occur more visually explicitly than a static representation.
Visual explicitness, however, results in an increased availability of information about
dynamics. In terms of computational offloading this visual explicitness should reduce
cognitive processing through increased availability of the dynamic information. However,
although this information is visually explicitly available, the learner may not always be able
to make good cognitive use of it, cognition possibly being affected in the following ways:
(i) A learner is aware that all this information is visually available, and can ‘see’ what is
happening (on a superficial level) while the animation is running. This can result in
overconfidence in the actual knowledge accrued from the diagram, which in turn inhibits
efforts at comprehensive learning through cognitively working out relevant aspects from the

diagram. Study 2 showed that learners were prematurely ready to declare their understanding
of the process, and that when required to explain the process were unable to give any
comprehensive account of the system, clearly showing their knowledge was lacking.
(ii) Visual explicitness in an animation inevitably results in an increased amount of
information, as all dynamic changes occurring in the system are depicted. This seems to
contribute to the cognitive complexity of the representation for the learner who has more
information to attend to and more aspects to focus on. Thus, not only is there additional
cognitive work (as the learner is required to choose which aspects to focus on), but also some
information may be missed altogether. Evidence for this came from study1 where dynamic
information load and the transience of the representation made it difficult for pupils to
identify all the events taking place and caused some pupils to look at the diagram in static
mode to try to work out the blood flow.
(iii) The visually explicit depiction of dynamics may also result in distraction for the learner.
In order to accurately understand the dynamics the learner is required to distinguish one
dynamic change from another. Study1 showed evidence that some areas of blood flow were
more confusing than others, for example, blood flow inside the heart. Here pupils became
confused about where the blood was actually flowing inside the heart, the movement possibly
detracting their ability to perceive that different blood colours flowed through different sides,
and therefore resulted in a false perception that blood was flowing in one colour and out
another. This consequently resulted in a false inference that blood is oxygenated in the heart.
(iv) Increased amount of perceptually available information also means that pupils have to
remember more pieces of information. In both studies pupils found it difficult to follow the
complete blood flow pathway. They were able to remember some aspects of it, but not all,
which was demonstrated in study 2 when pupils were describing blood flow to their peers,
they began by explaining the first couple of steps in the blood flow cycle, but then were
unable to continue. This particular aspect of cognition may be compounded by lack of learner
control over the information. The inherent transient nature of the representation prevents easy
reaccess to information.
In summary, then, animation contains more perceptually available information than static by
explicitly illustrating dynamic aspects of a process with varying consequences. Explicit

dynamic depiction may mean that less ‘working out’ of dynamics is necessary, lessening
cognitive processing to such a degree that no specific inferences or false inferences are made
and consequently learners fail to achieve deep comprehension. Increased perceptual
information on animation means more dynamic information, the level of which may
significantly affect cognition. Therefore, visual explicitness of this representational format
has implications cognitively in terms of learner confidence, attention focus, attention
distraction, and memory, all of which affect processing and subsequent learning.
However, despite some disadvantages, animation may provide benefits over use of static
diagrams alone. When attention was focused and pupils were directed, animation imparted
more information about the dynamics of the system than pupils could obtain from the static
diagram, for example, they could construct clearer models about how the valves worked and
how the heart 'pumped'.
4.5.2. Parsability of the representation
Although there are potential educational advantages in terms of understanding motion aspects
more clearly, animation is a complex representation with which to work, and appears to be
cognitively demanding in certain respects. Kaiser et. al. (1992) showed that animation was
beneficial where only one perceptual dimension of motion was displayed. Such a breakdown,
or parsing, of the motion may add clarity, for example, looking at the path of the
deoxygenated blood and oxygenated blood separately, or alternatively depicting one particle
moving through the entire sequence of blood flow, could illustrate the blood path more
unambiguously. However, despite multidimensional aspects of motion, these studies showed
evidence of patterns of attention focus on varying motion features of the diagram suggesting
that gross parsing of dynamics may take place. This ‘automatic’ learner parsing corresponds
to the proposal of domain parsing of dynamics (see chapter 2) (here the domain dynamics are
classified as blood flow, valves, muscle action). However, it appears that parsing at a more
specific level, the level of dynamic change is also important in order to segregate the
individual dynamic changes that take place. This would enable learners to identify all the
different components, easing the problem of distraction, difficulty in focusing attention and
may aid integration of information. There is evidence that investigating the parsability of
animated diagrams would be particularly pertinent in view of the importance of reducing
complexity through parsing information. These studies point to potentially salient
components to parse and a coherent order of parsing.

4.5.3. Peripheral dependencies of the representation
One other main aspect that seemed to emerge from this study was the potential importance of
understanding links with other processes that are ultimately integral to the process being
displayed. For example, there seems to be evidence that pupils misunderstand the
functionality of the heart, perceiving oxygen exchange to occur in the heart. One explanation
may be that the information links between processes that are not primary to the displayed
process are lacking. In this context understanding the system as a whole (cardiac circulation)
is dependent on understanding the relational functions of processes peripheral to the primary
process (in this instance the lungs). These aspects appear to be ‘hidden’, and therefore may
result in misunderstanding. This issue will be discussed further in chapter eight.
Despite cited disadvantages, animation imparted more information about the dynamics of the
system than pupils could obtain from a static diagram, for example, they could construct
clearer models about how the valves worked, how the heart 'pumped' and the temporal
relations between the two. There was evidence of patterns in attention focus, i.e. there were
similar patterns across pupils in the order that information was selected to be parsed. Not
only does this suggest the kinds of aspects that may more visually discernible, but also
confirms previous research demonstrating ‘incremental reasoning’ and the intuitive need to
take in small amounts of information at one time, gradually combining their knowledge with
previous pieces of information (e.g. Hegarty 1992, Narayanan et. al. 1994). This also
confirms the importance of parsing or sequencing information for knowledge acquisition.
4.5.4. Summary
There are dichotomous findings here as the results suggest that animation can provide more
information about dynamics than a single static representation, but that it is too cognitively
complex in a non-interactive, illustrative capacity, resulting in cognitive overload and
ineffectual learning. However, animation depicts more information about motion changes,
temporal sequences and relational effects of motion or temporal aspects on the dynamic
system than a single static representation. Therefore, there is a conflict between providing
more ‘explicit’ information of dynamics in combination with increased cognitive and
memory load and complexity, versus more implicit information about dynamics combined
with reduced complexity, and as a consequence, with reduced dynamic information as well.
Therefore, provision of an animation in and of itself may be too cognitively complex - being
too fast, lacking in learner control, and impeding attention focus - to generate learning of a

dynamic process or system, and more detailed investigation into the cognitive dimensions of
representation for animated diagrams is needed. Explicitness itself may be identified as a
CDAR, where a more explicit depiction results in tradeoffs of potentially more dynamic
information available, but cognitively difficult to manage.
4.6. Limitations of studies
Several problems with the design of these studies can be identified, and are noted here in
order to explain the basis for modifications and improvements of the design of subsequent
studies.
(i) Materials
As this was an initial exploratory study to identify in more specific detail properties and
learning using animated diagrams, a computer presented diagram was taken from a
commercial CD ROM. Although this served the purpose for the present studies, several
disadvantages of this particular material became apparent. The particular design of the
diagram may have affected learning in, for example, its clarity (or lack of) of depiction of
direction of blood flow, links with other processes in the lungs and body, and the speed of the
depiction of the diagram. Also by using a pre-designed animation there was no facility to
manipulate particular aspects of the representation for research, such as, isolating or changing
particular aspects of the diagram. It also meant that there was no facility for the learners
themselves to control or interact with the representation, such as stopping and starting the
animation, or slowing the speed. Being part of a CD ROM topic, it was also designed to be
one part of a larger amount of information, and as such was supportive to other media
information. Taking these aspects into consideration it seemed more appropriate to design
and build an animated diagram that could be productively used for this research (see chapter
4).
(ii) Testing
A more thorough investigation into previous knowledge and experience with this type of
diagram may have enabled a clearer understanding of how pupil inferences were achieved
and differences between pre and post test conceptual knowledge. On the basis of this pre
testing was used in future studies where analysis of these differences was required. The post
test here was also designed to tap broad areas of understanding, some of which it became
apparent were irrelevant to the specifics of cognitive effects of animation. Therefore, tests in

subsequent studies were designed to focus more specifically on those particular features of
animation being investigated.
4.7. Conclusion
Although this study did not demonstrate improved learning from a particular diagram format,
it has demonstrated that different representational formats of the same process result in
different inferences made. So far this research has exposed the complexities of presenting
dynamic systems as animated diagrams for learning, but has also shown the enhanced level of
information imparted over static representations of the same domains. These studies have
begun to try to identify particular properties of animated diagrams (e.g. visual explicitness,
multidimensional movement, transient information, high quantities of information, lack of
salience) that could be analysed in terms of identifying important cognitive dimensions of
representation for comprehensive understanding (e.g. visibility, hidden/peripheral processes,
parsability) and investigating different design issues in relation to these dimensions. Overall
these studies suggest that the use of animated diagrams to facilitate understanding of a
dynamic process is not merely a matter of providing visually explicit information. There is
more for the learner to achieve in understanding from this kind of representation than
‘seeing’ the depicted dynamics. The visual explicitness of dynamics in theory supplies the
basis for a fuller understanding of dynamic systems, but the learner is required not only to
‘see’ (which in itself is a mammoth task from animation due to the large amount of transient
information) the dynamics, but also to interpret the meaning behind the changes that are
occurring in the representation, and to integrate all of these pieces of information into a
coherent understanding of the system as a whole. The next chapter (chapter five) describes
steps taken to address some of the limitations uncovered in the studies presented here. The
subsequent three chapters (chapters six to eight) present studies addressing issues specifically
related to identifying graphical change, interpreting graphical change and domain parsing of
animated diagrams.

Chapter 5
Research Modifications
5. 1. Introduction
Chapter three in this thesis identified the fundamental form of animation and chapter four
began an investigation into the general advantages and cognitive disadvantages of learning
with animation. These comparative studies of animated and static representations showed
differences in learning, some of which may be attributed to the structural differences between
the presentational formats. Thus, the studies highlighted particular properties of the animated
representations relevant to cognitive processing that can be isolated for further investigation,
for example, the effect of visual explicitness of dynamic change on cognition. Overall these
properties seem to be related to the salience and interpretation of individual dynamic
components (the degree to which the representation can be dynamically parsed – see chapter
3.3.1.) and the integration of these and domain specific aspects of the representation (the
degree to which domain parsing and integration takes place). Particular properties are defined
more specifically and related to the proposed learning model (chapter 3.3.2.) at the beginning
of each of the following relevant chapters as a basis for investigating the effects of animation
properties. However, studies one and two also highlighted issues relating to both materials
(animations and assessment) and methodology that need to be addressed. The purpose of this
chapter is to address those issues and explain measures taken to improve these aspects for
subsequent studies.
5.2. Limitations of studies one and two
Chapter four identified some limitations of studies one and two, particularly those relevant to
subsequent investigation into cognitive processing with animation. The main limitations
apparent were those relating to certain materials used and aspects of the methodology.

5.2.1. Changes in materials
From results of studies one and two it became apparent that the animation used had several
weaknesses for research in this area. At the initial stages of the research choice of an
animation was confined to one that was already produced on CD ROM. However, it
transpired that this particular diagram was deficient in the following ways: (i) motion
depiction of blood flow contained no directional cues, such as arrows, causing the static
comparison to lack explicit directional cues and be shown in multiple static diagrams, (ii) the
animation on the CD ROM was not ‘stand alone’ and was designed to be only one part of a
collection of pieces of information for a larger topic, therefore could be considered deficient
in some aspects of information display, (iii) the animation was non-interactive and could not
be manipulated by the learner to stop, start or slow it down, (iv) but most importantly, a pre-
developed CD ROM precluded the researcher from manipulating the animation to investigate
pertinent aspects of cognition. Therefore, an animation specifically for the purposes of this
research was designed and built using Macromedia Director.
This software was chosen on the grounds of its ease of implementation and the facilities it
provides for customising by the researcher, and interactivity for the learner. The animations
were designed and built to be appropriate for pupils, between the ages of 12-14 years,
learning the principles of cardiac circulation (heart) and gas exchange in the lungs
(respiration). These topics were both appropriate to the school curriculum of the targeted age
group. Both animations were created using Macromedia Director, and were designed in
colour to match conventions for representing oxygenated (red) and deoxygenated (blue)
blood, and for representing oxygen (red) and carbon dioxide (blue).

The basis for the design of the heart animation (see fig. 5.1 for example frame) was taken
from The Cardiac Cycle CD ROM (Andromeda), with additional components such as the
lungs and upper and lower body, and incorporating a minimum amount of learner control.
The final animation consisted of ninety four frames running at fifteen frames per second (see
CD ROM provided). The number of frames used was a product of the number needed to
depict blood flow changes as smoothly as possible, the speed was selected such that the
animation depicted changes fairly smoothly, but not so fast that changes became
imperceptible.
Figure 5.1. One frame from the heart animation

The basic graphical outline design of the respiration animation (fig. 5.2.) was taken from the
BBC GCSE Bitesize web page
(www.bbc.co.uk/education/gcsebitesize/science-biology/humans/breathing_rev.html), with
changes being made to some components and dynamic aspects of the diagram. Discussion
with science teachers from the school involved in the research led to some minor alterations,
which were made accordingly to the animations. The final animation consisted of fifty frames
running at eight frames per second. Again the number of frames used was a product of the
number needed to depict motion as smoothly as possible, and the speed such that motion was
depicted smoothly but perceptibly. Both of these animations were used in studies three and
four, but only the heart animation was used in studies five and six.
Figure 5.2. One frame from the respiration animation.
The animations were also designed more specifically for this research by contextualising the
diagram prior to animating it, i.e. providing information for the learner so that their
processing was directed specifically to areas of investigation. The rationale behind this was
as follows: any system or process usually consists of several components that, alone, may be

foreign to the learner. These individual components and their function may be vital for
understanding the process as a whole. However, a novice to the domain may first need to see
the main components of the diagram in context before being able to integrate them into the
dynamic aspects of the system. Thus, introducing an animation of the complete system
straight away may result in the learner having to pay attention to parts of the diagram or take
learning steps that were not applicable to the research being undertaken. As the focus of the
research is on dynamic change, the diagram was first shown to learners in static form so that
the main diagrammatic components (e.g. the heart, the lungs, the body) could be specifically
identified to the learners by the researcher. This meant that cognitive effort would hopefully
be directed towards the dynamic aspects of the diagram. The animations were, therefore,
designed to appear on the screen initially in static format so that the learner could familiarise
themselves with the context of the diagram and the relevant component locations, and so that
the researcher could explain important aspects of the diagram that were not specifically
related to the dynamic aspects being investigated (e.g. that the red colour represented
oxygenated blood and the blue colour represented deoxygenated blood).
5.2.2. Methodology
In study 1, pupils worked in pairs to encourage verbal interaction and all sessions were video
recorded. Data collected was twofold: quantitative from test scores and qualitative from video
analysis. In study 2 data was primarily qualitative from video recordings of pupils both
explaining diagrams to one another and responding to researcher questions. Although, these
methods of collecting data were still considered appropriate, certain aspects were refined to
facilitate improved data about processing using animated diagrams. As pointed out in chapter
three both quantitative and qualitative data positively contribute to understanding models of
cognition, therefore, both methods were implemented in the subsequent studies.
Paired participants: For qualitative data collection pupils worked in pairs to facilitate verbal
protocols while working with animation. Pupils either discussed together or one explained to
another, depending on the appropriateness for the particular study. Individual participants:
However, pupils also worked individually with the diagrams (with no interaction with either
peers or researcher) in order to preclude the potential cognitive advantage that explainers may
have through ‘explaining’. The self explanation effect suggests that through self explaining
the learner acquires a conscious awareness of mismatches between internal representation

and external representation, which facilitates the learner to move towards clearer
understanding (Chi 1997).
5.3. Introduction to subsequent studies
The purpose of this section is to provide background research particularly relevant to the
current studies and a brief outline of the relevant learning aspects for understanding the
graphical change of animation. This introduction, therefore, consists of a summary of
relevant issues about cognitive interaction that are (or may be considered to be) pertinent to
animation. It then defines the properties of animation being investigated in the studies
showing how these relate to the animations and defines the relevant aspects of the learning
process. Through this the rationale and aims of the studies will be explicated.
To recap from chapter two, although research has demonstrated evidence for cognitive
benefits of diagrammatic representation, the cognitive benefits of diagrammatic animation
may not have the same underlying characteristics. So far, empirical research into the
effectiveness of computer animation for enhancing learning is inconclusive and claims for its
cognitive value for depicting dynamic requires further investigation. Comparing learning
from animated and static diagrams may serve to extract information about the ways in which
different representational formats might activate different cognitive processes, as the
representational format may be critical in the way in which comprehension is realised (c.f.
Zhang and Norman 1994). However, prior research into comparisons of static and animated
diagrams shows no consistent evidence of improved understanding, (e.g. Tversky 2000).
Studies one and two of the current research comparing the effects of static over animated
diagrams of a dynamic process, for students learning the principles of cardiac circulation,
suggested that provision of a moving image does not necessarily facilitate overall conceptual
understanding. Findings suggested that although visual explicit representation of movement,
in theory provides the potential for a clearer understanding of dynamics, it appears that
providing such explicit representation increases the cognitive demands on the learner. The
multidimensional aspect of movement depiction increases the dynamic events for the learner
to attend to. The large amount of transient information in the animation increases cognitive
load by increasing the amount of information that needs to remembered from one frame to
the next. The learner is required not only to ‘see’ all of the graphical changes (which depict

the dynamics) taking place, but also to interpret the representational or conceptual meaning
behind the changes. The following three chapters, therefore, focus on particular critical
cognitive aspects of interaction with animated graphics. The next two chapters (chapters six
and seven) look at the process of cognitive interaction with animated diagrams, focusing on
what and how learners see and interpret in terms of graphical change, and whether this is
affected by complexity of the animation defined in terms of memory overload. The following
chapter (chapter eight) focuses on exploring the integration process of animated information
from the diagram.
5.3.1. Graphical properties of animation
Two principal factors are used in the studies in this thesis as a basis for examining the effects
of specific properties of diagrammatic animation on learning: (i) identification of relevant
CDAR of the representation, such as graphical properties of animation, (ii) the learning
process itself when using this kind of representation. Chapter three identified some specific
features of animated representational formats, that may be beneficial (or not) to cognitive
processing. These were described in under the headings of multidimensionality, transience,
visual dynamic explicitness (see chapter 3 for more detail). The current studies focus on how
learners read and understand graphical change taking into account the complexity of such
representations. Therefore the representational properties investigated here are transience,
multidimensionality and graphical change, the related CDAR being memory overload,
dynamic information load and visibility of graphical change.
5.3.2. Cognitive dimensions of animated representations (CDAR)
The identified inherent features of animation all have implications for cognitive processing of
animated representations. Subsequent studies in this thesis examine animation in relation to
the following possible cognitive dimensions.
(i) complexity
Transience (memory overload quality) and multidimensionality (dynamic information load)
are both features of animated representations likely to affect how learners process or read
graphical change. These features may contribute to complexity of the representation in terms
of memory overload. In this study complexity of the animation is defined in relation to
amount of information and dimensions. Broadly speaking complexity relating to dynamic
information load can be defined by the number of dynamic changes or events that occur. The
more different changes and events that take place, the more facets the learner is required to

notice and interpret, and the more information the learner is required to remember from one
frame to another, the more complex the representation is likely to be. Table 5.1. shows how
memory overload has been categorised in relation to the animations used in this study. It can
be seen from the table that overall there is a higher quantity of dynamic changes that occur in
the circulation animation than the respiration animation. As a result of this categorisation the
circulation animation was classified as complex and the respiration animation classified as
simple.
(ii) salience and interpretation
The dynamics of an animated diagram are depicted through graphical change, which needs to
be perceived, identified and interpreted by the learner. This can be seen in terms of the
salience and interpretability of particular graphical changes. Table 5.2. shows salient features
and the required interpretation of graphical change in relation to the animations used.
Salience of graphical elements is identified in terms of their dynamic features in relation to
one another in the animations used, to allow comparisons to be made between graphical
elements and the two animations. The terms used under each column are, therefore,
subjective to these animations rather than generic descriptions of the dynamics. The table
shows that graphical elements in the circulation animation have more variance in their
dynamic features than do the graphical elements in the respiration animation.
5.3.3. The learning process
Although both individual prior knowledge and learning tasks may differ the important goal
for any learner is to be able to understand the process or system that the animated diagram is
depicting. In cognitive terms the learner is required to focus on salient pieces of information,
perceive the individual motional components, interpret what it is they are representing (not
only graphically, but also dynamically), relate the motional aspects to the static aspects of the
diagram, and integrate all of this information into a coherent model of the process.
Describing this process is the beginnings of a formulating model of learning that could
usefully be applied to working with animation. Park (1998) maintains that animation serves
to attract and direct attention, but Lowe (1999) found that novice learners focused on (their
attention was directed to) information that was perceptually salient rather than thematically
relevant. However, it is likely that more is needed, cognitively, than just salience in order to
understand an animation. Although animation may be more perceptually explicit “our
perceptual appreciations do not spontaneously form the basis of our conceptual understanding
of dynamics” (Kaiser et. al. 1992, p.686). Anderson (1995) proposes that conceptual

knowledge is based on the meaning of a representation. Studies one and two suggested that a
lack of explicit information about the function or reasoning behind a system obscures the
overall meaning of the representation. However, the overall meaning of the representation
may also be affected by potentially earlier processing of the dynamic information in terms of
its salience and interpretation. Thus, it seems likely that understanding the meaning of the
graphical changes that occur would be of paramount importance in building an appropriate
mental model of the system. The understanding of the change may also serve to direct
novices of the domain to thematically relevant as well as perceptually salient aspects. Once
the learner has perceived and interpreted changes within the diagram, these pieces of
information need to be integrated and relating inferences made about function and causality
of the system depicted, but the focus of this chapter is on processing graphical change.
5.3.4. Summary
This chapter has explained the motivation for designing and building purpose built animations
for subsequent research in this thesis. This enabled the researcher to manipulate the animation
design in order to investigate particular pertinent aspects of cognitive processing with
animation. The definition of complexity in relation to each animation for the purposes of this
research was described, the aim being to explore the effect of these levels of complexity on
particular aspects of the learning process, namely, noticing and identifying dynamic change
(this refers to awareness that a change is occurring, and identification of the details of those
changes), interpreting dynamic change and integrating this information from the animated
diagram. The following three chapters present studies and their findings that explore these
issues.
Table 5.1. Identification of levels of complexity
(i) Dynamic information load
Number of moving parts (object action)
Circulation Respiration
Blood
Heart Muscle
Valves
Atria and ventricles
Blood
Oxygen
Carbon dioxide
Number of directions of movement
Circulation Respiration
Blood – Heart to right lung
Heart to left lung
Heart to upper body
Heart to lower body
Right lung to heart
Left lung to heart
Lower body to heart
Upper body to heart
Inside right side of heart
Inside left side of heart
Blood through capillary
Carbon dioxide to alveolar sac
Oxygen to capillary
Non directional floating in alveolar sac of
carbon dioxide and oxygen
Number of static locations of movement (to and from)
Circulation Respiration
Heart
Right lung
Left lung
Lower body
Upper body
Capillary (from body to
body)
Alveolar sac
Blood cells

Number of objects that move from one place to another
Circulation Respiration
Oxygenated blood
Deoxygenated blood
Blood
Oxygen
Carbon dioxide
Number of sections demonstrating the process
Circulation Respiration
Blood from heart to right lung
Blood from heart to left lung
Deoxygenated blood into oxygenated blood
Blood from right lung to heart
Blood from left lung to heart
Enters left atrium
*Atrium contracts
Valve opens
Blood flows into ventricle
Ventricle expands
Heart muscle contracts
Valve opens
Blood pushed to upper body
Blood pushed to lower body
Valve closes
Oxygenated blood into deoxygenated blood
Deoxygenated blood flows in to right atrium
*Atrium contracts
Deoxygenated blood enters capillary
Carbon dioxide diffuses into alveolar sac
Carbon dioxide is breathed out
Oxygen is breathed in
Oxygen diffuses into blood
Blood leaves lungs via capillary
Number of translation dynamics and transformational dynamics on each animation.
Circulation Respiration
Translation Deoxygenated blood
Goes from upper & lower body into heartFlows from atrium into ventricle
Flows out of heart to both lungs
Oxygenated blood
Flows from both lungs into heart
Flows from atrium into ventricle
Flows out of heart to upper and
lower body
Grey cells entering capillary flowing
through capillary and exiting the
capillary
Blue circles moving from capillary to
alveolar sac
Red circles moving from alveolar sac
to capillary
Red circles moving within sac
Blue circles moving within sac
Transformation Red cells change to blue in the
upper and lower body
Blue cells change to red in both
lungs
Valves open and close
Atria contract and expand
Ventricles contract and expand
Change in speed of blood flows
Blue circles change from opaque to
transparent
Red circles change from transparent to
opaque
Grey circle loses a blue circle
Grey circle gains a red circle
0 Feature
presence
Blue circle disappears
Red circle appears

Table 5.2. Identification of salience and interpretation
Salience of change may be affected by the following
1 Circulation
Graphical
element
Type of
movement
Frequency of
the motion
Duration of
motion
Speed of
motion
Relative
magnitude of
motion
Blood Translation
Transformation
Constant
Constant
High
Short
Variable
Fast
Large
Small
Muscle Transformation Once Medium Medium Medium
Valves Transformation Once Short Fast Small
Respiration
Blood cells Translation
Transformation
Constant
Regular
Constant
Regular
Medium
Fast
Large
Medium
Oxygen Translation
Transformation
Constant
Regular
Constant
Regular
Medium
Fast
Medium
Small
Carbon
dioxide
Translation
Transformation
Constant
Regular
Constant
Regular
Medium
Fast
Medium
Small
Interpretative changes to be understood
Circulation Respiration
Red cells to blue cells
Blue cells to red cells
Heart muscle contracting
Valves opening and closing
Heart chambers changing
Blood cells moving
Blue circle leaving blood
Red circle entering blood
Blood cells moving
Red circles appearing
Blue circles disappearing

Chapter 6
Dynamic parsing: The effect of dynamics on salience and
interpretation of graphical change; A case study.
6.1. Summary
The current chapter and chapter seven look at the process of cognitive interaction with
animated diagrams, focusing on how and what learners see and interpret in terms of graphical
change, and whether this is affected by complexity of the animation defined in terms of
memory load due to transience and multidimensionality of the representation. These two sets
of properties specific to animation have been identified in relation to the animations
employed in this study, and a model of learning with an animated diagram in relation to these
graphical properties is proposed (see chapter five). With these perspectives as a basis, an
empirical case-study and an experimental study investigated the kinds of graphical change
noticed, identified and the ways in which each of these changes were interpreted by pupils
studying dynamic processes. To do this two animations were used both identified as being
different in terms of their complexity to see if differences in processing could be attributable
to animation complexity in terms of its memory overload. Processing aspects focused on here
were issues concerned with visibility and parsability of dynamic change. This chapter,
therefore, describes and analyses an empirical case study, which exemplifies ways in which
some of the points raised about cognitive interaction with animation may be investigated. The
results show evidence of patterns in cognitive processing, providing the basis for generating
an initial cognitive model for processing graphical change.
6.2. Rationale and aims of studies
The primary aim of these studies was to investigate cognitive processing of graphical change
in terms of the salience of the graphical change and the interpretability of those changes.
Kaiser et al (1992) proposed that processing dynamics was easier where only one dimension
of movement was displayed. Generally speaking an animation of a dynamic system will
consist of more than one dimension of movement (simultaneous display of different kinds of
movement), but research suggests that the more dimensions of movement the more

cognitively complex the representation (Kaiser et al. 1992). Therefore, these studies also
investigated the effect of complexity of the animation in terms of memory load due to
multidimensionality of dynamics on this processing. By examining the learning process in
relation to the properties of graphical change and multidimensional dynamics the aim is to
identify and establish some components of a process model of cognitive interaction with
animated graphical representation. To achieve this two separate studies were designed, (i) a
case study using qualitative data (presented in this chapter) to exemplify the way in which the
use of animation as a diagrammatic representation can be investigated in terms of the
relationship between graphical properties and the learning process, and (ii) an experimental
study (presented in chapter seven) using more rigorous methodology, which was completed
to validate findings from the case study.
6.3. Method
6.3.1. Participants
Participants were fifty two pupils aged twelve and thirteen years. Twenty eight were male
(mean age = 12 years 8 months; 152 months, sd = 3.4 months) and twenty four were female
(mean age = 12 years 8 months; 152 months, sd = 3.6 months). All participants attended a
Sussex comprehensive school where science classes were of mixed ability. Participants were
assigned to work in pairs by their teacher on the basis of working well together. Each pair
was assigned to one of the animations, complex (heart) or simple (respiration), and one of
each pair was either an active (explainers) or a passive (listeners) learner.
6.3.2. Materials
(i) The animations (see appendix 8)
Establishing more clearly the benefits or disadvantages of learning using animation requires
examination of the inherent dynamic property of animation, therefore, diagrams that depicted
dynamic processes were selected. In this study the animations were analysed in terms of the
properties identified above: memory overload and graphical change. Properties of the
animations were identified in the following way (also see table 5.1): (i) The degree of
memory overload was operationalised by the number of dynamic changes that occur in the
animation. This comprised of: the number of moving parts, the number of directional
movements, the number of locations of movement (to and from), the number of objects

moving from one place to another, the number of sections demonstrating the process, and the
number of simultaneous movements. (ii) Type of dynamic change was identified by the
number of translation or transformational changes taking place. The distinction between
types of graphical change (translation and transformation) allowed investigation into whether
or not differences existed in processing these two types of information, both in terms of
salience and in interpretation of the changes. To recap, translation change comprises
movement from one location to another, transformational change comprises change in
(object) form. In the heart animation an example of a translation change would be the
depiction of blood flowing from the lungs into the heart. An example of transformational
change would be red dots changing into blue dots in the body representing the change from
oxygenated to deoxygenated blood (also see table 5.2.).
Two animations were used in this study in order to provide differences in complexity level of
the animations in terms of memory overload and of graphical change. The animations used in
this study were of blood flow through the heart and gas exchange in the lungs, and are
described in detail in chapter five. The heart animation was categorised as ‘complex’, relative
to the respiration animation which was categorised as ‘simple’, on the basis of the analysis
described in chapter five. The animations were designed to appear on the screen initially in
static format in order that the learner could familiarise themselves with the context of the
diagram and the relevant component locations, and so that the researcher could explain
relevant aspects of the diagram for understanding that were not specifically related to the
dynamic aspects being investigated. The learner was then required to click anywhere on the
diagram to begin the animation. The animation played for the pre-selected time (loop)
determined on the basis of the pilot study. To play further loops the learner again was
required to click anywhere on the diagram.
(ii) Task
Pupils were given a comparatively open task to preclude possibilities of priming for specific
information which would compel pupils to focus on some aspects and ignore others. For the
heart animation they were requested to find out about blood flow through the heart and body,
and as much as they could about how the heart works:
‘Use the animation to find out as much as you can about the process of
blood flow and how the heart works’.

In the respiration animation they were requested to find out as much as they could about how
gas exchange takes place in the lungs.
‘Use the animation to find out as much as you can about the process of
gas exchange during respiration’.
(iii) Outcome Measures
Learning outcomes were assessed in two ways: (i) by using data from video recordings taken
of pupils explaining their understanding of the animation to one another at regular points
throughout the learning session. Information was extracted by coding verbal data in relation
to identifying and interpreting the dynamics on the animations, and (ii) with a written post-
test completed individually by all participants, identifying specific dynamic information from
the animations (see appendix 9). These aspects were related to cognitive processing through
categorising questions in order to elicit information about the learning process as described
above.
The post test consisted of a series of written questions with a mixture of multiple choice and
open questions, according to the kind of information required. The test questions were
designed and classified into the two relevant categories described above for acquiring
information from the animations in terms of their complexity and the graphical changes. A
small section of the test also targeted some overall conceptual understanding of the system.
Thus, there were three categories of questions: (i) salience, which incorporated noticing both
translation and transformational graphical changes; (ii) interpretation, which required the
learner to suggest what each of the graphical changes was representing; and (iii) conceptual
questions, which looked at evidence for a higher conceptual understanding of the process
being learned (for categorisation see appendix 9b). The number of conceptual questions were
minimal, as this was not the primary focus of the study. Open questions were used primarily
for assessing interpretation of graphical change in order to elicit spontaneous descriptions,
whereas salience of graphical change was assessed primarily through multiple choice
questions. An example of a typical multiple choice question about salience required pupils to
tick whether a statement about certain graphical changes was true or false. Typical questions
eliciting information on interpretation required pupils to write the meaning of, for example,
the blue dots changing to red. This enabled analysis of specific aspects of graphical change,
both in correct perception, interpretation and inference, and in the kinds of errors made in
each category. The aim of categorising the questions was to establish which kinds of

graphical changes were noticed, or not, those changes that were interpreted, or not, whether
any relationship existed between noticing and interpreting, and whether performance on one
or both of these aspects influenced conceptual understanding. Video recordings of activity
and collection of verbal protocols during the session gave additional information about the
kinds of graphical change noticed and the interpretation placed on the graphical change, as
well as difficulties pupils experienced in explaining aspects of the diagrams.
6.3.3. Design
A consequence of the proposed methodology, which required verbal protocols from pupils,
meant that another aspect could be investigated in this study, that of learning mode in terms
of active or passive learners. Working with pupils in this way is beneficial to the research, as
not only does it provide rich verbal information, but also it is a familiar way of working for
the pupils, and reassuring to work with a fellow pupils in a new situation. As a result one
pupil became an explainer (classed as an ‘active’ learner) and the other a listener (classed as a
‘passive’ learner), with each completing separate test questions. This experiment was,
therefore, a 2 x 2 independent measures design with a written post test to measure learning.
Independent variables were complexity of animation and learning mode. Dependent variables
were test scores on salience of graphical change, interpretation of graphical change, and
conceptual understanding.
6.3.4. Procedure
Pupils worked with the animation in pairs. The researcher randomly selected one of them as
explainer and one as listener. They were told that the explainer would be required to explain
what they had seen and understood from the animation to their ‘listener’ peer. They were
informed that they would view five separate runs of the animation, but between each run that
the explainer would be required to describe to their partner what they had seen happen on the
screen and what they thought this meant in terms of how the heart worked or how gas
exchange occurred in the lungs. Pupils used the still frame left after each animation as a tool
for their explanation, facilitating both gestural and verbal data. During the session, the
researcher also prompted where necessary with statements such as, What did you see
happen? What do you think this means? What do you think this is showing?
Before the animation began pupils were given an introduction to the diagram in static format.
For the heart this entailed a verbal explanation from the researcher that the blue colour

represented deoxygenated blood and the red colour represented oxygenated blood (this
information was also in text form on the diagram), and an indication of the location of the
body and lungs in relation to the heart. For the respiration animation this consisted of
showing the location of the capillary and the alveolar sac, the relevance of the alveolar sac to
the lung, and the representation of blue as carbon dioxide and red as oxygen (this information
was also in text form on the diagram). Both animations were run on an Apple Macintosh
Powerbook in a classroom at the school. All sessions were openly video recorded. At the
beginning of the session all pupils were also informed of the requirement to complete a
written post test questionnaire at the end of the session. After completion of the test pupils
were shown a continuous version of the animation and the process depicted was explained to
them by the researcher.
6.3.5. Pilot study
A pilot study was conducted with six pairs of pupils to establish important criteria for
working with the animation. Each of the animations were cyclical and could therefore be
looped. Thus, it was important to establish an appropriate number of runs or loops of
animation to enable understanding of the domain, but guarding against the possibility of all
pupils understanding everything due to seeing many runs of the animation. It was determined
that five runs (94 frames at 15 fps, approx. 8 seconds running time) of the heart animation
and four runs (55 frames at 8 fps, 8 seconds running time) of the respiration animation used
here were sufficient for the purposes of this experiment. The suitability of the wording and
design of the test questionnaire for the target age group was also established, as was the
feasibility of pupils watching an animation and explaining what they saw and understood to a
peer. Some questions on the test were altered or reworded to improve clarity of the test. It
was clearly established that pupils were able and willing to explain the diagram to their
partners, thus enabling verbal protocol data as well as written data, providing more
comprehensive information on the learning taking place.
6.4. Results
Data was obtained through post-test scores, verbal protocols, and video analysis. The results
are reported here in two parts; (i) quantitative analysis of performance according to overall
test scores, different question categories, complexity of animation, and learning mode; and

(ii) qualitative data taken from video recordings and verbal protocols. In order to analyse
graphical change coding of the different kinds of change was required.
Graphical change coding.
Translation refers to graphical change that is a movement of an object or item from one place
to another. Transformation refers to graphical change that involves the object transforming in
some way, be it shape, size, colour, identity etc… Unsurprisingly, there are occasions when
the distinction between translation and transformation may be blurred when the gross
movement involves both of these transitions. In these cases coding was done according to the
reference of the pupil, whether they referred to the translating object or the transforming
object. For example in the respiration animation a grey circle (representing blood cells)
travelling along the capillary has components inside it, one of which is a blue circle
representing carbon dioxide. The blue circle or carbon dioxide moves from the grey circle in
the capillary across a membrane into the alveolar sac. The movement of the blue circle across
the membrane would be coded as translation, whereas reference to the change in the grey
circle would be coded as transformational. Thus, a description such as “the blue circle went
into the sac” would be coded as a translation change, whereas a description such as, “as the
capillary passed, oxygen went in and carbon dioxide was taken out” or “red oxygen goes into
grey circles and blue circles get put back” would be coded as a transformation change. Here
the reference is to the change that is occurring in the grey cells rather than the movement of a
circle from one place to another.
6.4.1. Quantitative analysis
The tests were divided into three categories for analysis. Due to differences in domain and
complexity of animation the heart and respiration tests differed in number of questions. The
total possible scores for the heart animation were: total test score – 32; salience category –
19; interpretation category – 7; conceptual category – 6. The total possible scores for the
respiration animation were as follows: total test score – 22; salience – 9; interpretation – 6;
conceptual – 7. All scores were transformed and computed into percentages prior to analysis
in order to standardise the scores for comparison.
(i) Performance according to complexity of animation and learning mode
This analysis looked for differences in test scores between active and passive learners
according to animation used (complex or simple).

The means and standard deviations of the test scores are given in table 6.1.
Table 6.1. Mean test scores for complexity of animation and learning mode
Complexity level
learning style
Mean Std. Deviation N
complex active 59.13 10.70 13passive 55.28 20.30 13Total 57.21 16.02 26
simple active 48.95 18.00 13passive 40.20 21.86 13Total 44.58 20.12 26
Total active 54.04 15.41 26passive 47.74 22.05 26Total 50.89 19.10 52
A two way independent analysis of variance (ANOVA) was performed on the overall test
scores. There was a significant main effect of complexity of animation (p=0.01). Those using
the complex animation performed significantly better overall on the test than those using the
simple animation. No significant effect of learning mode was found (see figure 6.1.). Overall
active and passive learners scored similarly on the test.
Figure 6.1. Graph showing main effects of complexity of animation and learning mode
learning style
passiveactive
70
60
50
40
30
complexity level
complex
simple

(ii) Differences in performance according to question category and complexity of animation
and learning mode.
A MANOVA was used to assess differences within question categories according to
complexity of animation and learning mode (see table 6.2. for mean scores).
Table 6.2. Means of scores in different question categories according to complexity level and learning mode
complexity level
learning style mean standard deviation
N
Salience complex active 68.01 8.44 13passive 65.18 19.87 13
total 66.59 15.03 26simple active 63.24 24.58 13
passive 62.39 24.23 13total 62.82 23.92 26
total active 65.63 18.17 26passive 63.78 21.75 26
total 64.70 19.87 52 Interpretation complex active 53.84 19.47 13
passive 46.15 19.47 13total 50.00 19.48 26
simple active 56.41 27.67 13passive 34.61 32.24 13
total 45.51 31.46 26total active 55.12 23.48 26
passive 40.38 26.75 26total 47.75 26.01 52
Conceptual complex active 37.17 30.54 13passive 34.61 36.29 13
total 35.89 32.89 26simple active 24.17 18.79 13
passive 16.48 20.90 13total 20.32 19.86 26
total active 30.67 25.71 26passive 25.54 30.45 26
total 28.11 28.02 52 The analysis showed a significant difference within the interpretation category (p = 0.04),
showing that active learners performed better on interpretation of graphical change than
passive learners. The analysis also showed significant differences in the conceptual category
(p = 0.04) showing that those using the complex animation scored higher on conceptual
questions than those using the simple animation.
(iii) Performance on different question categories
A repeated measures ANOVA showed significant differences between scores on the separate
question categories (p = 0.00). The means (table 6.3.) suggest that, overall, higher scores

were obtained for salience questions than for either interpretation or conceptual questions
regardless of complexity of animation or of learning mode.
Table 6.3. Overall mean scores obtained for each question category
mean standard deviation N salience 64.70 19.87 52 interpretation 47.75 26.01 52 conceptual 28.11 28.02 52
A polynomial contrast showed a significant linear trend. Thus, performance on the salience
questions was significantly better than on the interpretation questions, and performance on
interpretation was significantly better than on conceptual questions (see graph 6.2.).
Figure 6.2. Overall means of performance on question categories
question categories
conceptualinterpretsalience
70
60
50
40
30
20
(iv) Analysis of errors made
Detailed examination of individual questions within each question category, was undertaken
to find out whether there were any patterns of responses within each category. This was done
by focusing on both accurate responses and the types of errors made. Thus, each of the
question categories was inspected in terms of which individual questions were correctly
answered 80% of the time, or more, and which questions were poorly answered to find out

more specifically which dynamics were or were not noticed, which were or were not
interpreted.
Overall, pupils scored well on most aspects categorised as salience and the majority of the
graphical changes were accurately noticed. However, some questions showed consistent
errors, primarily in recall of identifying translation graphical change. Accurate interpretation
of graphical change primarily occurred in relation to transformational changes. All scores in
the conceptual questions category, regardless of animation, were low.
6.4.2. Qualitative analysis
Information was collected from video recordings of pupils working with the animations. This
comprised verbal and gestural data, both explaining and pointing out aspects on the diagram
to their peer after each run of the animation. Analysis of video recordings and verbal protocol
data comprised coding of particular aspects to look at identification and interpretation of
graphical change, patterns of information acquisition and kinds of errors made. The most
noteworthy of these aspects was in relation to perceiving and understanding translation and
transformational differences in graphical change. (For detailed coding of graphical change
see 6.4.1.)
(i) salience
Patterns of identification of dynamics according to translation and transformation change
were evident. After one run of the animation, the number of translation dynamics noticed or
commented on were notably higher than the number of transformational dynamics in both
animation conditions (i.e. the total number of translation dynamics noted was 45, whereas the
total number of transformations noted was 12). After a further run of the animation this
difference was apparent only in the respiration animation, but after more runs the number of
each type of change was similar. Thus, the differences between the two kinds of graphical
change were most distinctive in the early stages of using the diagrams. The implications of
this in relation to processing dynamics is discussed below.
(ii) Interpretation
Generally, on the respiration animation pupils were unable to accurately interpret the
graphical change, unlike the heart animation where fairly good interpretations were made.
Three questions from the heart animation were identified as receiving a ‘high’ number of
correct answers. These were that the blue dots changed to red dots, the red dots changed to
blue dots, and the heart muscle got thinner and thicker. These answers suggest that the

change of blood from oxygenated to deoxygenated and vice versa was understood correctly,
and the cardiac muscle action. However, poor interpretation was achieved for alteration in
speed of blood flow and different graphical changes of the ventricles.
6.5. Discussion
The focus of the discussion, from the results presented here, is on the information gleaned
from both the test questions and from the variability of processing noted after each run of the
animation from video data, the aim being to identify cognitive components of a processing
model of animation. To do this information was collated that related specifically to learning
through dynamics of the representation. The dynamics of the diagram were identified as
particular types of graphical change (transformation and translation), and the kinds of
learning were specifically identified in relation to perceiving and understanding of graphical
change (salience and interpretation). The aim of categorising the questions was to establish
which kinds of graphical changes were noticed, or not, those changes that were interpreted, or
not, whether any relationship existed between noticing and interpreting, and whether
performance on one or both of these aspects influenced conceptual understanding.
Understanding animation is a gradual process of acquiring and integrating pieces of
information, but what are the components of this process? Using data from the perspective of
the learning process (question categories) and of graphical representation (type of graphical
change), the results from this study point to possible cognitive components of processing
information using animation.
6.5.1. Main effects of complexity of animation and learning mode
This section discusses the implications of complexity of animation and learning mode for
using animated diagrams of dynamic processes.
(i) Complexity of animation
The test results showed that overall those using the complex animation performed
significantly better than those using the simple animation. Further analysis showed that this
was significant for the conceptual category of questions. These results were not expected, but
could be explained by higher prior knowledge in pupils working in the domain of the heart. It
transpired that science coursework at the time of data collection included instruction in class
on the heart, but no pupils had received any teaching on respiration. It was therefore likely
that this affected the kind of processing that is required for reading an animated

representation. Previous research has shown that there are differences in the way information
is perceived and understood according to the level of expertise of the learner/user, due to the
effect of their internal representations on the way they interact with the diagram (e.g. De
Groot 1965, Egan and Schwartz 1979, Lowe 1994, Satchwell 1996, Brna et. al. 1997). This
domain knowledge acquired by participants using the heart animation may have meant that
the learner was not necessarily required to rely on salience and interpretation of graphical
change to the same degree as those with less domain knowledge, in order to have conceptual
understanding. It may also have lessened the detrimental effect of some properties of the
representation, such as transience and multidimensional dynamics (see 6.5.2. for these
effects).
(ii) Learning mode
The test results showed that active learners interpreted graphical change significantly better
than passive learners. This could be a result of the active learners having to explain the
representation to their peer and in so doing, externalise their reasoning. This gave the
opportunity for them to discover what they understood and what they did not, clarifying
which aspects of the representation they needed to focus on more. This correlates with Chi’s
(1997) self explanation model. Explaining may have the effect of prompting not only more
cognitive effort, but also more appropriate cognitive effort through identifying errors and
mismatches in their explanations.
6.5.2. Differences in knowledge acquisition according to graphical change
From the test score means it was evident that scores in the salience category were superior to
scores in the interpretation category, and scores on interpretation were superior to those in the
conceptual category. Higher scores in the salience category may suggest two things: (i) that
identifying salient dynamic aspects are processed before interpretation of those aspects; (ii)
that salient aspects of graphical change were less cognitively demanding for learners than
interpretation. Higher scores in the interpretation category may suggest that interpreting the
graphical change is an important part of identifying relevant information that serves as a pre-
requisite for conceptual understanding. This progression points towards the beginnings of a
cognitive model for processing graphical change in that seeing an event happen occurs before
interpreting the meaning of the event, which occurs before the individual meanings are
combined to make a coherent understanding of the process. However, other aspects of
graphical change are also relevant to a proposed processing model. Data collected from
verbal protocols and video recordings, also revealed pertinent differences in processing.

(i) Salience
Differences relating to the morphological properties of the animation (salience) according to
type of graphical change were apparent. In the early stages of animation viewing translation
change was primarily identified. In both animations, after one run of the animation, more
translation than transformational changes were identified. This suggests that translation
change may initially be more prominent than transformation. There was also a high degree of
uniformity in the actual translations on which pupils focused. For example, translations in the
heart focused primarily on deoxygenated blood going out of the heart and the oxygenated
blood flowing in. Translations noted in the respiration animation consistently focused on the
blue circle moving from the capillary to the alveolar sac and the red circle moving from the
alveolar sac to the capillary. This might suggest that certain areas of the diagram are more
initially prominent than others.
As viewing increased, the number of both transformational and translation changes identified
were more evenly distributed, although the pattern differed according to animation. In further
runs of the heart animation the number of transformations noted gradually increased. Initially
these transformations focused on changes in size or behaviour (e.g. ventricle and valve
movement) rather than changes in colour (e.g. red dots to blue dots). However, by three runs
of the heart animation pupils were beginning to notice dots changing colour (representing
blood change). This pattern may be a result of the fact that transformation involving change
in size shows a gross motion change, whereas a change in colour is a more subtle superficial
change. This may cause some transformations to be more salient than others, but, the results
suggest that, as more interaction with the animation occurs, additional kinds of graphical
change can be attended to and assimilated.
In contrast, in the respiration animation, translation change was identified more frequently
after each run, than transformational. Few pupils identified transformational change, and only
one pupil accurately perceived transformational change. For example, the blue circles
(carbon dioxide) were falsely noticed to change into red circles (oxygen). This evidence also
suggests that translation change is identified prior to transformational change. However,
identification may not necessarily be accurate, which has additional adverse effects on the
quality of the translation of the graphical change.

(ii) Interpretation
When it comes to understanding the semantic properties of graphical change (interpretation)
the story is more complicated. Although, on the whole, interpretation given was minimal, on
one hand there is evidence for some graphical change being interpreted more easily (or
perhaps readily) than others, but on the other hand, the same graphical change results in
multiple errors. Initially it appears that translation changes are more easily interpreted than
transformation changes, as more ready interpretations were made for this kind of change. One
reason for this could be that interpretation, in this instance, is combined with the
identification of the movement. For example, from verbal protocols translation change was
generally described in the following way, (it) ‘comes in here and goes out there’
accompanied by pointing. However, errors evident from test data suggest that translation
change is not necessarily more easily interpreted than transformation. Although some blood
pathways were correctly perceived, others were not, and pupil answers demonstrated that a
mixture of accurate and inaccurate perceptions of blood flow were held. For example, pupils
perceived both red (oxygenated blood) and blue dots (deoxygenated blood) going to the lungs
from the heart; both red and blue dots entering the heart from the body; and both red and blue
dots entering the heart from the lungs, when in actuality only one type of blood follows each
of these pathways. The same confused pattern of movement in terms of blood flow pathways
was apparent from the conceptual questions relating to locations of flow of different kinds of
blood. This also suggests that the blood flow pathway is not clear and the translation
dynamics are confusing, and result in an incoherent pattern of understanding blood flow
pathways. This may suggest that;
(i) Although the form of translation movement may render it more easily perceived initially,
the understanding or the interpretation of this kind of movement does not necessarily follow
the same principle. Therefore, in processing animated information ease of perception does
not guarantee ease of interpretation or understanding.
(ii) Confusion of translation movement was apparent in the ‘complex’ animation rather than
the ‘simple’ animation, which suggests that the difficulty of fully perceiving or of
interpreting translation may lie in the multidimensionality of the graphical change, rather than
the graphical change per se. The level of information load resulting from multidimensionality
may increase the number of potential dynamic distractions for the learner.
(iii) The problem of the transient nature of animation is apparent, in that information is lost
between viewing the start and end of the translation movement, precluding pupils from fully
identifying the change occurring.

(iv) That despite increased exposure to the animation pupil integration of what they saw and
what they understood as a whole was not taking place.
Interpretation of transformation was minimal, and forced more errors in the respiration
animation than on the heart animation. This could have been due to differences in prior
knowledge, facilitating focus of attention, kinds of changes or processes taking place. This
suggests that when there is less prior knowledge then interaction with the animation may
need to be radically different from when a higher level of prior knowledge exists.
Interpretation of representations has been found to be affected by prior knowledge (and
expertise with the representation) (Brna 1996). Errors on the heart animation could be
equated to lack of perception of those changes. Several pupils had not noticed these changes
occurring during the animation, so would be unable to map the action to any meaning.
Transformation interpretation also forced more errors than interpretation of translation
change on the respiration animation. For example, the carbon dioxide was falsely perceived
to change into oxygen in the capillary.
Few interpretations given, and inaccuracy in those made, could suggest the following;
(i) identifying a change may be a prerequisite to interpreting the change.
(ii) generally, making interpretations at an early stage of processing the dynamic information
may be problematical.
(iii) making interpretation of transformation changes requires a further step in cognitive
processing than translation changes, as the interpretation of what is happening when an object
moves from one place to another is integral to the dynamics themselves, whereas a
transformation is representing something more than a change in location and requires
identification of the change (e.g. change in colour, change in size, change in shape) and
placing some coherent meaning on the change depicted.
(iv) translation changes become more difficult to interpret as the number of similar translation
changes increases.
(v) identifying the change as translation, transformation or feature presence affects the kind
of interpretation made. Therefore clarity of the kind of movement or change is essential in
facilitating accurate interpretation.
Responses to the conceptual category were generally unsatisfactory. This could be because
conceptual understanding is harder to achieve anyway; better interpretation of graphical
change may be necessary before a higher level of understanding is reached; better
interpretation or longer spent working with the animation may have enabled improved
integration of information and the inferences necessary to achieve better conceptual
understanding; the problem of hidden processes was evident when the pupils were working
with the animations. For example, the relevant or accurate links between peripheral processes
relating to respiration and circulation were not at all apparent from pupils reports.
6.5.3. Further errors in learning
As seen above analysing errors in pupils learning provides information that contributes
towards a cognitive model of processing animation. Two further errors evident from the
respiration animation are noteworthy. Poor scoring was obtained for the salience of the
events of the blue circle (carbon dioxide). The category most selected about the blue circle
was the one that stated that the blue circle changes to a red circle (thirteen of seventeen
wrong answers). Verbal protocol data is consistent with this, indicating that a high proportion
of pupils thought that the blue circle changed into a red circle rather than identifying the blue
circle (carbon dioxide) moving out and the red circle (oxygen) moving in, in separate actions .
This error might lead to misinterpreting that carbon dioxide is changed into oxygen rather
than carbon dioxide being removed and oxygen being absorbed. If this is the case then the
process of diffusion is unlikely to be attended to as the only process being perceived is a false
exchange process. In terms of a processing model this suggests that:
(i) each step in the perception, or identification, of and interpretation of graphical change can
have significant effects on understanding, and
(ii) that a misidentification of change being a transformation as oppose to a translation will
effect the kind of interpretation placed on the meaning of the representation.
Another frequent error made in the respiration animation was the misperception of the blue
circle disappearing and the red circle appearing in the alveolar sac. This may be because this
kind of graphical change is more difficult to perceive. The form of this graphical change is
different from the explicit motion intrinsic in translation and explicit visual alteration in
transformation changes, and may not, therefore, attract attention. This type of change might
be described as an addition and/or subtraction of a graphical element. The change specifies
whether a particular graphical feature is present or not present (“feature presence”), but its
appearance or disappearance is not obvious in any way. ‘Feature presence’ might explain the

lack of ‘noticing’ of these events, which may need to be accompanied by other means of
attracting attention, such as highlighting or sound.
6.5.4. Summary of discussion
From this study several points have emerged that are relevant to cognitive interaction with
graphical animation. The emergence of another type of graphical change, termed here
‘feature presence’, is a change which turns out to be difficult to perceive, and therefore has a
tendency to go unnoticed. This is an important factor in designing animation and/ or guiding
learners using this form of representation. There is evidence that different types of graphical
change are processed differently in terms of salience and interpretation. This may be
important in understanding how learning may be guided and/or shaped according to the
design and use of these graphical changes. More importantly, the study provides information
towards a preliminary description of a cognitive model for processing graphical change.
6.6. Contribution to cognitive model of processing
The results from this study suggest certain stages in processing graphical change from
animated diagrams of dynamic processes, which will be related to the cognitive demands of
‘reading’ graphical change.
6.6.1. Visibility demands
The above study suggests that processing of graphical change consists of not only of
visibility in terms of noticing the changes taking place, but also the identification of the kinds
of graphical changes taking place.
(i) noticing graphical change
The salience of this may be dependent on the type of graphical change. Translation appears to
be initially noticed more readily than transformation, whereas feature presence appears to be
problematic to notice. However, ease of perception does not necessarily guarantee ease of
identification or interpretation. Thorough noticing of graphical change may, however, be
affected by the multidimensionality of the animation (the more changes occurring the more
difficult it is to notice accurately) and by the transient nature of the representation, which
contributes to potential loss of information from the start to the end of a translation. These
interferences in cognition may also apply to transformation changes.
(ii) identification of graphical change

Accurate identification of the type of graphical change is imperative to coherent
interpretation of the representation. Whether the graphical change is seen as transformation,
translation or feature presence will affect the interpretation made.
6.6.2. Interpretative demands
Interpretation of graphical change
Accurate interpretation is necessary for a coherent understanding of the system or process
depicted, but making interpretations at an early stage of processing dynamic information can
be problematical. The interpretation that is placed on the graphical change is dependent on
the type of change that is perceived and identified, and on the extent to which the change
observed. For example, understanding will be incomplete if only part of a translation change
is viewed. It is also apparent that making interpretation of transformation changes requires a
further step in cognitive processing than translation change, as the interpretation of what is
happening when an object moves from one place to another is integral to the dynamics
themselves, whereas a transformation is representing something more than a change in
location and requires identification of the change (e.g. change in colour, change in size,
change in shape) and placing some coherent meaning on the change depicted.
It can be seen from these findings that visibility, in terms of clarity of graphical change taking
place and the kind of change that occurs, is important in providing a good basis for reading
animation. However, it is also clear that for animated diagrams there is another dimension -
that of interpretability – that is fundamental to coherent understanding of animation. So not
only is visibility important, but also interpretability (of the dynamic change) in the readability
of the diagram.
6.7. Limitations of study
During data collection and analysis several limitations of the experimental design, and
alternative ways of examining proposed issues within this study became apparent, as well as
limitations on the conclusions drawn. As the majority of these issues are also shared by the
following experimental study, these limitations will be discussed in full in chapter seven (see
7.5.). However, one particular aspect emerged suggesting that modification of categorisation
of test questions was required. Examination of the results indicates that there are differences
in processing according to the type of graphical change (tranlsation or transformation). On

the basis of this it became apparent that some questions relating to the heart animation that
were originally designed to elicit conceptual knowledge actually targeted the accuracy of
interpretation of translation change (blood flow pathways). Although this generally highlights
the difficulties in designing questions for assessment, it is essential that the questions be
categorised in the most appropriate way for the issues being investigated. The test questions
were, therefore, re-categorised for the following experimental study (Study 4, see 7.2.2.).
6.8. Conclusion
This chapter focused on specific properties of dynamic graphical representation, and on
particular aspects of learning with animation, to investigate the feasibility of bringing to light
information about the cognitive processing of animated diagrams. The first part of the chapter
highlighted particular properties of animation that could be used to identify certain cognitive
processes, and identified particular learning aspects that are pertinent to the processing of
dynamic information. The second part of the chapter described an empirical case-study
investigating aspects of learning with animated diagrams, the results of which can be used for
an initial description of the early stages of processing dynamics from animated diagrams.
However, there are limitations to conclusions which can be drawn from a case-study in terms
of the number of participants and the methodology, for example, discretion must be taken in
making inferences from comparisons of processing with two different animations in terms of,
for example, equivalent complexity in test questions. The same study was, therefore, carried
out using different subjects under more rigorous experimental conditions, which enabled
progression of processing to be examined within each domain animation. The following
chapter describes this experimental study.

Chapter 7
Dynamic parsing: The effect of dynamics on salience and
interpretation of graphical change; An experimental study.
7.1. Summary
Chapter six presented a case study investigating the effect of dynamics on the salience and
interpretation of graphical change accounting for complexity of the representation in terms of
its properties of transience and multidimensionality. This chapter presents an experimental
version of the case study providing more rigorous experimental evidence for a cognitive
process model of reading animation. A brief introduction will summarise the relevant details
of animation properties and learning aspects appropriate for this study (for a more
comprehensive description see chapter three and chapter 6.2.) The methodology was
modified in line with an experimental design, consisting of three levels of viewing the
animation (amount of exposure according to number of runs), in order to establish
differences, or not, in cognitive processing of graphical change with more exposure to
animation. The results of the study enable discussion on cognitive processing at each
exposure level according to complexity of animation, processing of graphical change, as well
as differences in cognitive processing across all exposure levels.
7.2. Introduction
This experiment set out to find out more specifically the cognitive steps involved in
processing graphical change from an animation. This chapter begins by summarising the
relevant cognitive properties of animation and the principles behind the outcome measures
used, as explained and described in full detail in the previous chapter. The chapter then
introduces the rationale behind the design and method of an experimental study, which
clarifies some of the points raised about cognitive interaction with animation from the case
study in the previous chapter. This study continues to focus specifically on dynamic aspects
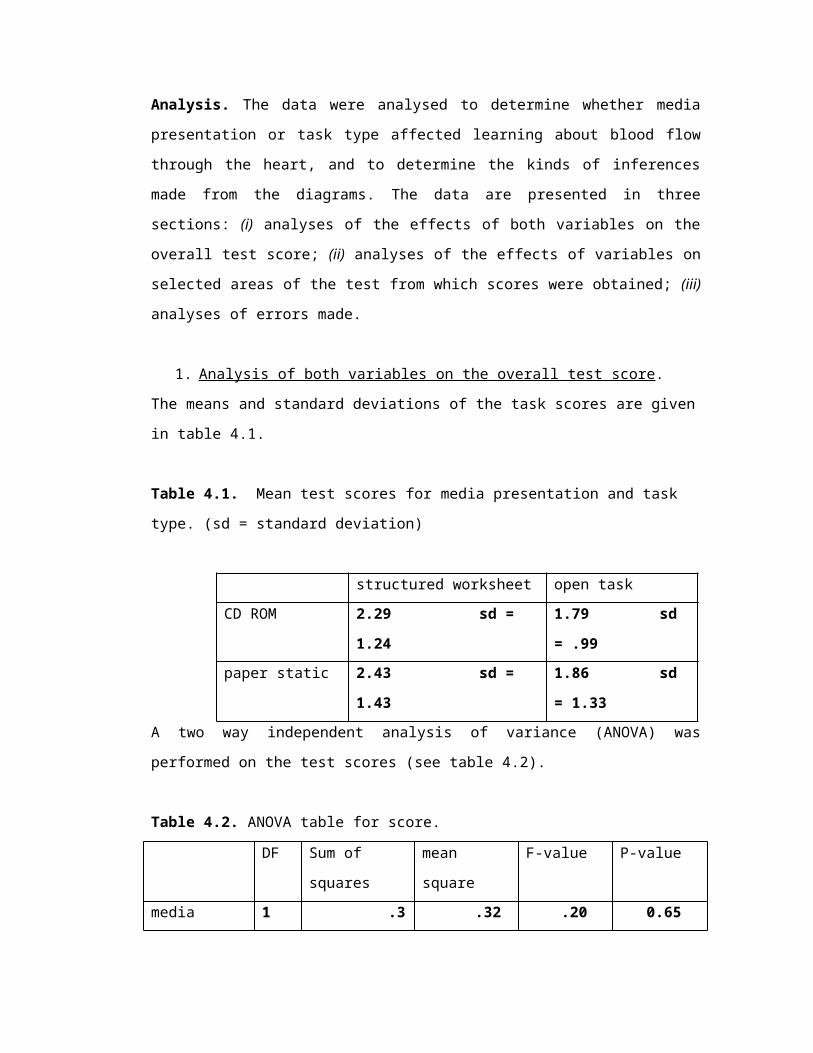
of the representation, linked with cognitive factors identified as important for processing
dynamic information.
As in the case study, the cognitive properties of animation pertinent to this experiment were
those relating to complexity of the representation (due to transience, multidimensionality)
and graphical change. In terms of dynamics these features of animation all contribute to
memory overload, which can be identified according to the quantity of changes, both the
same and different, both occurring individually or simultaneously, that are depicted via the
animation to accurately illustrate the depicted process. Graphical change can be further
identified in terms of the form or kind of change, namely translation, transformation and
feature presence. In chapter three a learning process model was proposed, suggesting that in
order to understand dynamics using animated graphics each graphical change needs to be
noticed (awareness that a change is taking place), identified (appreciation of the details of this
change) and interpreted (placing appropriate meaning of the change in the context of the
diagram) accurately within the context of the represented system. These pieces of information
then have to be integrated coherently to begin to understand the entire concept depicted. By
using the data sets across three different exposure times we can investigate whether any
progression in learning occurs in terms of identifying and interpreting graphical change (a
core feature of animation), and whether or not this is affected by the complexity of the
animation depiction itself.
The previous chapter explicated a case study, whereas this experiment investigated, under
more controlled conditions, the stages involved in ‘reading’ dynamics from an animated
diagram. To do this the animations, as used in the case study, were presented to pupils in
different multiples of short sequences of the diagram, e.g. pupils using the heart animation
viewed either one, three or five pre-defined runs of the animation. For all experimental
conditions apparatus was the same, instructions given to participants were identical,
questionnaires were designed to provide more systematic assessment of the stages of
cognitive processing of graphical change. All pupils were then required to complete the same
questionnaire regardless of the amount of exposure to the animation. The aim of this was to
gain specific information about which aspects of the diagram were attended to, identified,
interpreted and at what stage of viewing the animation.

The hypothesis here was that the more times the animation was viewed the greater the
amount of information seen, interpreted and understood. The results of this study will be
reported and discussed in three separate sections: section one will cover the overall results for
each separate condition of the experiment in terms of complexity of animation and processing
of graphical change; section two will use the combined data to look at the differences in
processing according to exposure to animation, comparing learning or processing from
minimum to maximum exposure; and section three will look at errors in learning that may
contribute to description of a model of processing graphical change.
7.3. Experimental study
7.3.1 Method
Seventy two pupils aged twelve and thirteen years from year eight of a Sussex
comprehensive school participated in this experiment. There were 23 females (mean age = 12
years 10 months; 154 months, sd = 5.3 months) and 49 males (mean age = 12 years 11
months; 155 months, sd = 5.7 months). All pupils in the mixed ability classes participated
providing a wide range of abilities. No pupils had taken part in the previous studies. Pupils
worked with their allocated animation on an individual basis. No verbal protocols or
explanations were required in this study.
7.3.2. Materials
(i) Animations
The animations used in this study were identical to those used in the case study (see 6.3.2.
and appendix 8). The animations were designed such that they had a fixed looping or running
time, and could be restarted by the participant pressing any button on the keyboard.
(ii) Task
Tasks given to pupils were identical to those given in the case study (also see 6.3.2.). Pupils
were again given a comparatively open task to preclude possibilities of priming for specific
information, which would compel pupils to focus on some aspects and ignore others. For the
heart animation they were requested to find out about blood flow through the heart and body,

and as much as they could about how the heart works. For the respiration animation they
were requested to find out as much as they could about how gas exchange takes place in the
lungs.
(iii) Outcome measures
Learning in this study was assessed via a written questionnaire consisting of multiple choice
and open questions (see appendix 10(i) for heart and appendix 10(ii) for respiration).
Questionnaires were completed individually by pupils immediately after viewing the
animation. Some open test questions from the case study were modified into multiple choice
questions for this study, as multiple choice questions were found to be more reliable in terms
of scoring and, therefore, more reliable for making comparisons across groups. Open
questions remained for interpretation of graphical change in order to elicit descriptions.
Questions were again categorised according to relevant themes in terms of the identified
learning process: salience (which targeted noticing and identifying graphical change),
interpretation (which targeted the meaning placed on the graphical change) and conceptual
understanding (also see 6.3.2.). Categorisation of some of the heart questions was slightly
modified on the basis of results from the case study, which indicated that a more precise
categorisation of questions eliciting knowledge about blood flow pathways would be
interpretation of translation change (see appendix 10b). Whilst completing the test pupils
were provided with a black and white static diagram of the main outline of their depicted
animation together with relevant labels. This enabled them to understand more easily what
certain questions referred to, so that the focus of the assessment could remain on salience and
interpretation of graphical change rather than on the static components of the diagram (see
appendix 11(i) for heart and appendix 11(ii) for respiration). Neither pre tests nor delayed
post tests were implemented in this experiment as the focus of the assessment was to
establish understanding of graphical change within the depicted domains. This requires
accessing processing that is occurring at the time of ‘reading’ and involves information that is
only appropriately available either during or immediately after participation.
7.3.3. Design
This experiment comprised two animations (complex and simple) and three different levels
of exposure to each of the animations (minimum exposure, intermediate exposure, maximum
exposure). Pupils were allocated to either the minimum, intermediate or maximum exposure,
and used either the complex animation or the simple animation. Thus, it was a 2 x 3

independent measures design, with the test scores as the dependent variables. All participants
worked on an individual basis.
7.3.4. Procedure
Pupils viewed the respective animation in pairs for the required number of times as allocated.
They were not allowed to discuss between them what they had viewed and communicated
only to agree when to run the animation for a second or third etc… time. They were informed
of the number of runs of the animation they were required to view. Before the animation
began pupils were given an introduction to the diagram in static format. This part of the
procedure was identical to the case study (also see 6.3.4.). Again, for the heart this entailed an
explanation that the blue colour represented deoxygenated blood and the red colour
represented oxygenated blood (also in text on the diagram), and an indication of the location
of the body and lungs in relation to the heart. For the respiration animation this consisted of
showing the location of the capillary and the alveolar sac, the relevance of the alveolar sac to
the lung, and the representation of blue as carbon dioxide and red as oxygen (also in text on
the diagram). Both animations were run on an Apple Macintosh Powerbook in a classroom at
the school. Pupils then completed the questionnaire independently, before returning to their
classroom.
7.3.5. Pilot study
A pilot study was undertaken prior to the main study to establish an appropriate running time
for each viewing, as well as an appropriate maximum number of runs for each animation for
adequate comprehension, and to ensure ceiling effects would not be obtained. It was
established for the complex animation that five runs was an appropriate maximum exposure,
thus the one run was used for the minimum exposure and three runs were used for the
intermediate exposure. For the simple animation it was established that four runs was an
appropriate maximum exposure, thus one run was used for minimum exposure and two runs
for intermediate exposure. The pilot study also confirmed the suitability of the test used, and
any ambiguous wording was altered accordingly.
7.4. Results
The data collected from this experiment were primarily quantitative data obtained from test
scores. The test was divided into three different categories according to type of question

asked; salience, interpretation and conceptual. Thus, the final data consisted of overall test
scores, and scores for each of the different categories. Total possible test scores for the heart
animation were as follows: total test score – 46; salience – 25; interpretation – 7; conceptual
– 14. The total possible test scores for respiration animation were as follows: total test score –
24; salience – 9; interpretation – 6; conceptual – 9. All scores were transformed and
computed into percentages to enable comparison across groups. The different exposures of
animation provided the facility for several different analyses. The results will, therefore, be
presented in three sections; firstly, results for each animation exposure separately (minimum,
intermediate and maximum exposure); secondly, comparisons across all animation exposure
levels; and thirdly, errors in learning giving more specific differences in processing. As the
focus of this study was primarily on salience and interpretation of graphical change, and the
conceptual aspects elicited were minimal, the subsequent discussion will focus on results
relating to understanding graphical change.
7.4.1. Results of each separate exposure condition
The results reported here investigated differences in test scores between complex and simple
animations, both total test scores and individual question category scores. Analysis of each
exposure condition will be presented separately.
(i) Minimum exposure
A MANOVA was performed to investigate the interaction of the question categories, with
complexity as the independent variable and question categories are three dependent variables.
Table 7.1. Showing the mean scores for complexity and question categories in the minimum exposure
condition.
Question category Complexity Mean Std. Deviation NSalience complex 44.33 11.37 12
simple 33.33 15.71 12Total 38.83 14.54 24
Interpretation complex 15.47 23.94 12simple 23.61 29.69 12Total 19.54 26.70 24
Conceptual
complex 48.21 19.53 12simple 23.14 16.03 12Total 35.68 21.66 24
The analysis showed that performance significantly differed according to complexity of the
animation (p=0.01). The test of between subject effects showed that these differences were

significant in the conceptual category (p=0.00) and approaching significance for the salience
category (p=0.06). In both of these categories those using the complex (heart) animation
performed better than those using the respiration animation.
Figure 7.1. Graph showing the effect of animation complexity on performance after minimum
exposure to animation
test question categories
conceptualinterpretationsalience
60
50
40
30
20
10
animation complexity
complex
simple
The MANOVA also showed significant differences in overall performance on the different
question categories (p=0.00). Salience and conceptual questions were answered better than
interpretation. A mixed ANOVA comparing the effects of complexity on the different
question categories confirmed these findings. The independent variables were complexity
(simple and complex) as a between subject factor and question category as a repeated
measures variable with three levels (salience, interpretation and conceptual). A repeated
contrast showed a significant difference between salience and interpretation categories
(p=0.00) and between interpretation and conceptual categories (p=0.02). Overall pupils
scored higher in the salience category than interpretation and higher in the conceptual
category than interpretation.

Figure 7.2. Graph to show the effect of minimum animation exposure on processing of different types
of information.
test question categories
conceptual
interpretation
salience
40
30
20
10
(ii) Intermediate exposure
A MANOVA was performed to analyse the effects of the independent variable (complexity
of animation) on the dependent measures (salience, interpretation and conceptual) and look
for any interactions (see table 7.2. for mean scores).
Table 7.2. Showing mean scores for complexity and question category in the intermediate exposure
condition
Complexity Mean Std. Deviation N Salience complex 52.66 17.37 12
simple 48.14 15.94 12Total 50.40 16.47 24
Interpretation complex 34.52 30.12 12simple 12.50 16.08 12Total 23.51 26.16 24
Conceptual complex 49.40 23.87 12simple 25.92 19.72 12Total 37.66 24.54 24
The MANOVA showed differences approaching significance according to complexity of
animation (p=0.07). The between subject effects show no significant differences in the
salience category, but significant differences in the interpretation (p=0.03) and conceptual
(p=0.01) categories according to complexity of animation. However, Levene’s test of

homogeneity of variance was significant for the interpretation question category, therefore
caution should be taken in interpreting results for this category.
Figure 7.3. Graph to show the effect of intermediate animation exposure on processing of different
types of information
test questioncategories
conceptualinterpretationsalience
60
50
40
30
20
From the means those using the complex animation scored significantly higher than those
using the simple (respiration) animation in those two question categories. The MANOVA
also showed significant differences in performance according to question category (p=0.00).
Repeated contrasts from a mixed ANOVA showed significant differences in performance
between salience and interpretation (p=0.00) and between interpretation and conceptual
categories (p=0.01). From the means and the graph it is evident that pupils scored higher
overall on the salience and conceptual categories than interpretation (see fig. 7.3.).

Figure 7.4. Graph showing the effect of complexity on performance after intermediate exposure to animation.
test question categories
conceptualinterpretationsalience
60
50
40
30
20
10
animation complexity
complex
simple
(iii) Maximum exposure
A MANOVA was again performed to compare the independent variable (complexity of
animation) and the dependent measures variables (salience, interpretation and conceptual
question categories) and look for any interactions (see table 7.3. for mean scores).
Table. 7.3. Mean scores for complexity and question category in the maximum exposure
condition
Complexity Mean Std. Deviation N Salience complex 53.33 14.20 12
simple 56.48 22.45 12Total 54.90 18.44 24
Interpretation complex 50.00 37.30 12simple 43.05 32.14 12Total 46.52 34.23 24
Conceptual complex 60.11 19.61 12simple 41.66 22.28 12Total 50.89 22.58 24
The MANOVA showed no significant differences according to complexity of animation
overall. However, the univariate tests suggest that there is a significant difference in
performance in the conceptual category according to complexity of animation. Those using
the complex (heart) animation performed significantly better than those using the simple
(respiration) animation on conceptual questions.

Figure 7.5. Graph showing the effect of complexity on performance after maximum exposure to
animation.
Question categories
conceptualinterpretationsalience
70
60
50
40
animation complexity
complex
simple
A mixed ANOVA showed no significant differences between question category for the
maximum exposure animation.
Figure 7.6. Graph to show the effect of maximum animation exposure on processing of different types
of information
test question categories
conceptualinterpretationsalience
56
54
52
50
48
46
44
Summary
The complexity of the animations significantly affected performance in all exposure
conditions, but in different ways in each exposure condition. In the minimum condition those
using the complex animation performed better on salience and conceptual questions, in the
intermediate condition those using the complex animation performed better on interpretation

and conceptual questions, and in the maximum exposure condition those using the complex
animation scored higher on conceptual questions. Not accounting for animation complexity,
the interpretation category received the lower scoring in all exposure conditions.
7.4.2. Results of comparisons across all exposure conditions
For these analyses all data were combined to enable comparisons of performance across all
exposure conditions. A MANOVA was performed with animation complexity (complex and
simple) and exposure (minimum, intermediate, and maximum) as independent variables, and
test question category scores (salience, interpretation and conceptual) as dependent variables.
The analysis showed significant differences according to exposure (p=0.00) and according to
complexity (p=0.00). Performance on the test questions was significantly affected by the
exposure to the animation and by the complexity of the animation. The univariate analysis
showed significant differences in all question categories according to exposure (p=0.00 for
salience and interpretation, p=0.02 for conceptual). The means show that for all question
categories scores increased with an increase in exposure to the animations. However, caution
must be taken in interpreting results from the interpretation question category, as Levene’s
test of homogeneity of variance was significant for this category which reduces the reliability
of the univariate analysis. The analysis also showed significant differences in performance on
the conceptual question category according to complexity of the animation (p=0.00). The
means show that those using the complex animation scored significantly better than those
using the simple animation on conceptual questions.

Table 7.4. Showing mean scores for each question category according to complexity and exposure to
animation.
Animation exposure
Complexity Mean Std. Deviation
N
Salience minimum complex 44.33 11.37 12simple 33.33 15.71 12Total 38.83 14.54 24
intermediate complex 52.66 17.37 12simple 48.14 15.94 12Total 50.40 16.47 24
maximum complex 53.33 14.20 12simple 56.48 22.45 12Total 54.90 18.44 24
total complex 50.11 14.70 36simple 45.98 20.25 36Total 48.04 17.69 72
Interpretation minimum complex 15.47 23.94 12simple 23.61 29.69 12Total 19.54 26.70 24
intermediate complex 34.52 30.12 12simple 12.50 16.08 12Total 23.51 26.16 24
maximum complex 50.00 37.30 12simple 43.05 32.14 12Total 46.52 34.23 24
total complex 33.33 33.28 36simple 26.38 29.10 36Total 29.86 31.24 72
Conceptual minimum complex 48.21 19.53 12simple 23.14 16.03 12Total 35.68 21.66 24
intermediate complex 49.40 23.87 12simple 25.92 19.72 12Total 37.66 24.54 24
maximum complex 60.11 19.61 12simple 41.66 22.28 12Total 50.89 22.58 24
total complex 52.57 21.19 36simple 30.24 20.67 36Total 41.41 23.63 72

Figure 7.7. Showing scores for salience according to complexity and exposure to animation
animation exposure
maximumintermediateminimum
60
50
40
30
animation complexity
complex
simple
A repeated contrast showed a significant difference in performance for the salience category
from minimum to intermediate exposure (p=0.01) and a significant difference in performance
for interpretation and conceptual categories from intermediate to maximum exposure (p=0.00
and p=0.02 respectively).
Figure 7.8. Showing scores for interpretation according to complexity and exposure to animation.
animation exposure
maximumintermediateminimum
60
50
40
30
20
10
animation complexity
complex
simple
Performance on salience question significantly improved from minimum to intermediate
exposure (see graph 7.7), and performance on interpretation (see graph 7.8.) and conceptual
questions significantly improved from intermediate to maximum exposure to animation.

Figure 7.9. Graph showing overall test scores according to question category and exposure to
animation.
animation exposure
maximumintermediateminimum
60
50
40
30
20
10
salience
interpretation
conceptual
7.4.3. Errors analysis on individual question analysis
Detailed examination of individual questions from the test questionnaire was undertaken to
establish whether any particular patterns of responses emerged that would inform us about
the kind of processing taking place. Each category of questions was examined for evidence of
patterns in performance level on each individual question, and any evidence of improved
performance with increased exposure to the animation.
In the salience category both translation and transformation change were identified initially,
but with increased exposure transformation was more accurately identified than translation
change. For example, there was a substantial improvement with increased exposure to the
respiration animation in identifying that the ‘grey circle loses a blue circle and gains a red
circle’ (this is showing carbon dioxide leaving the cells and oxygen entering the cells in the
capillary). This question was answered correctly by four out of twelve pupils in the minimum
exposure, five out of twelve pupils in the intermediate exposure and eleven out of twelve
pupils in the maximum exposure condition. There was no evidence of improved performance
on accurately identifying translation change (primarily blood flow pathways) on the heart

animation. After minimum exposure no pupils were able to give comprehensively accurate
answers blood flow pathways, after intermediate exposure ten out of twelve were unable to
give comprehensively accurate answers and after maximum exposure to the animation eight
out of twelve were unable to give comprehensively accurate answers. Performance was
consistently poor for feature presence change, for example there was no evidence of
improved performance with increased exposure for identifying that the blue circle
disappeared in the alveolar sac. This question was answered correctly by one pupil in the
minimum exposure and two pupils in the intermediate and maximum conditions.
In the interpretation category performance was generally lower than for other question
categories, although showed a larger improvement in performance after maximum exposure
to the animations. In the heart animation the biggest score increases across exposure were for
transformational interpretation. Scores on interpretation of translation change indicated no
coherent pattern of understanding of blood flow pathways. In the respiration animation scores
for translation interpretation were poor overall, and although some increases in interpretation
performance were evident these were minimal, such that a maximum of five out of twelve
pupils gave accurate responses to four of the six interpretations in the maximum exposure
condition. In the conceptual category performance again was generally stable across all
conditions, but this category in this study facilitated minimal elicitation of conceptual
understanding.
7.5. Discussion
This section uses data from the above experiment investigating processing of dynamic
information at the three different stages of learning.
7.5.1. Minimum exposure
Complexity of animation
The results show that complexity (as defined in this thesis) significantly affected
performance. After one run of the animation those using the heart (complex) animation
scored significantly better than those using the respiration (simple) animation on conceptual
questions and approaching significance on the salience questions. These results conflict with
the concept that a more complex animation (in terms of levels of dimensionality and
transience) will increase cognitive processing and effort, in which case one would expect
scores of salience and interpretation to be higher for the simple than for the complex

animation. However, during the period of data collection it transpired that pupils were being
taught in class about the heart, but had received, (and were receiving) no teaching about the
lungs or respiration. Thus, the level of prior knowledge between the two domains differed.
Level of prior knowledge has been noted to influence learning with external representations
(Brna et. al. 1997) and may have influenced performance with the animations for several
reasons; (i) current knowledge might facilitate identification of relevant information, such as
components, graphical change, which graphical changes mapped onto what they already
knew, thus increasing their ability to notice and identify graphical change; (ii) not only was
the level of prior knowledge different, but the instruction given was recent, making this
domain (the heart) particularly relevant for pupils at that time, possibly influencing their
ability to answer the kind of conceptual questions addressed in this study; (iii) the difference
between these groups was apparent on a visuo-spatial level (the salience of the graphical
change). Lowe (1994) suggested that low domain knowledge users used visuo-spatial aspects
of the diagram to drive their processing, and although those using the heart animation were
unlikely to be ‘experts’, they may have had more internal cognitive tools with which to
‘drive’ or direct their processing, facilitating their visuo-spatial processing of graphical
change. Therefore, the most likely explanation for the results obtained here is the effect of the
level of prior knowledge on ability to read certain aspects of the animation. Two issues
emerge from this proposed finding:
(i) Possible contribution to a cognitive processing model
If we look at performance on reading graphical change, we can begin to see where prior
knowledge may influence processing. The analysis showed that those using the heart
animation performed better on salience of graphical change than those using the respiration
animation, but not on interpretation questions. This may suggest that higher prior domain
knowledge facilitates perception and identification of graphical change, and serves to
appropriately guide and focus learner attention. This may suggest that focusing attention on
appropriate dynamic aspects is an important part of noticing and identifying graphical
change. However, despite higher prior knowledge pupils performed poorly on the
interpretation of graphical change questions. This may be a more complex aspect of
processing at this stage of viewing the animation.
(ii) The issue of defining complexity.

The events here suggest that complexity as defined prior to this experiment are not the only
dimensions of complexity to be taken into account when processing animated diagrams or
indeed any diagram. Complexity may also be defined in terms of the level or even type
(general or domain specific) of ‘internal’ cognitive resources available to pupils when
interacting with the external representation. The knowledge or perception already present
cognitively influences the way the external representation is perceived and interpreted. De
Groot (1965) showed that expert chess players used information from a chess display
significantly differently from novice chess players. Experts not only recognised more
meaningful chess configurations, but organised the information into chunks that related to
specific functions or strategies. Chunking meaningful information also facilitated their
memory of what they saw. Similar results have been found in mathematics (Hinsley et. al
1977), electronics (Egan and Schwartz 1979), computer programming (Ehrlich and Soloway
1984). This factor deserves further research which would provide another dimension to the
cognitive model of animation being developed here. Investigation targeting interactions
specific to previous knowledge and post animation understanding would be beneficial (see
chapter 9 for more detail). These results may also suggest that the effects of transience and
multidimensionality of the representation are counterbalanced by some level of prior domain
knowledge. It is possible to imagine that the interaction of prior domain knowledge and
transience or multidimensionality of the representation significantly affect the effectiveness
of the representation and are, therefore, important design considerations.
Graphical change
In terms of graphical change, overall the results showed that salience and conceptual
questions were answered significantly better than interpretation. This suggests that after one
run of the animation, regardless of complexity of animation or prior knowledge, graphical
change is accurately noticed and identified more than it is being interpreted. At this stage
pupils focus more on the salient attributes of the graphical change than the interpretation.
7.5.2. Intermediate exposure
The results of intermediate exposure to animation suggests that processing of graphical
change is potentially affected by level of prior knowledge, and that progressive stages in
processing are taking place.
Complexity of animation (or level of prior knowledge)

Those using the heart animation performed significantly better than those using the
respiration animation on interpretation and conceptual questions. Thus, after more exposure
to the animation those with the higher prior domain knowledge continued to perform better
on particular aspects of processing graphical change than those with lower prior domain
knowledge. Although those using the heart animation did significantly better than the
respiration animation in interpretation of graphical change, there was no significant
difference between animations in the salience category. This may suggest that increased
viewing brings lower prior knowledge pupils in line with higher prior knowledge pupils in
the context of noticing and identifying graphical change, thus showing no significant
difference in salience between the two animations. Thus, when there is low prior domain
knowledge salience of graphical change is no more difficult to assimilate than with high prior
domain knowledge after an intermediate number of runs of the animation, but interpretation
of that graphical change is still significantly different, interpretation of the heart continuing to
be potentially facilitated by increased prior knowledge (although it must be remembered that
homogeneity of variance was not found for this dependent variable in the MANOVA). This
suggests that a progression in processing may occur from noticing and identifying to
interpreting the changes taking place on the diagram.
Graphical change
The analysis showed significant differences in performance according to the question
category, specifically between salience and interpretation, and interpretation and conceptual.
Regardless of complexity pupils scored higher on salience than on interpretation questions.
This suggests that after an intermediate number of runs pupils were still focusing primarily
on noticing and identifying graphical change, but not yet accurately interpreting those
changes in relation to the diagram. This suggests that processing of salience of graphical
change occurs prior to interpretation of the change or that interpretation of change is
facilitated by the level of internal domain knowledge. The graphs show that performance
dramatically decreased from salience to interpretation, but then improved for conceptual
questions (see graph 7.3.). This might suggest that overall conceptual understanding may not
necessarily be dependent upon appropriate interpretation of graphical change. However, it is
more likely that general prior knowledge of the domain was sufficient to answer the minimal
number of conceptual questions in this particular test without relying on the interpretation of
graphical change in the animation.
7.5.3. Maximum exposure
The results of the maximum exposure to animation showed two relevant aspects for
informing about processing of graphical change.
Complexity of animation (or level of prior knowledge)
Overall no significant differences in performance according to complexity of the animation
were evident. This suggests that, after the maximum number of animation runs, the ability of
lower prior domain knowledge pupils to process graphical change was by this stage similar to
those with higher prior domain knowledge. This suggests that improvement on salience and
interpretation of graphical change had (as a minimum) taken place for those with lower prior
domain knowledge. However, there was some evidence that conceptual questions were better
answered by those using the heart animation. Reasons for this are again likely to be due to
potential effects of prior knowledge, combined with the particular questions used in this
study.
Results in relation to graphical change
The analysis showed no significant differences in overall performance between question
categories, the pattern remaining the same as for other exposure conditions. Thus, pupil
performance deteriorated from salience to interpretation but improved again for the
conceptual questions regardless of complexity or domain knowledge. However, it can be seen
from Fig. 7.3. that the pattern of knowledge for the heart animation differs from that of the
respiration animation. In the heart animation scores for salience and interpretation were
similar, whereas in the respiration animation scores deteriorated from salience to
interpretation to conceptual questions. Those using the heart animation performed
significantly better on salience questions after one exposure to animation, thus, processing
progression patterns may be different with increased exposure to animation. By this stage
similar scores fro salience and interpretation suggests that with increased exposure
interpretation is placed on identified graphical changes. However, scores overall are not high
for any category, suggesting that noticing and identifying and interpreting is an iterative
process. This will be discussed in more detail in section 7.4.4. where data across all
conditions will be addressed.
7.5.4. Minimum, intermediate and maximum exposure
Animation exposure
The results showed that exposure to animation significantly affected scores in each question
category. From the means it is evident that in all question categories scores increased with an
increase in exposure to animation (see table 7.3. and fig.7.6.). This is not a surprising result,
as one would expect increased viewing to improve recall of the salience and interpretation of
graphical change. This confirms that understanding graphical change is a gradual process of
increasing the number of graphical changes identified at the same time as increasing the
number of changes interpreted.
Complexity of animation (or level of prior knowledge)
The results showed that those using the complex animation performed significantly better on
conceptual questions than those using the respiration animation. This is probably a product of
the particular questions used and more detailed intensive elicitation of conceptual aspects
would be beneficial in clarifying the effect of animation on higher conceptual understanding.
However, the results show no significant differences
Graphical change
The results show that there is a significant difference in salience scores between minimum
and intermediate exposure, thus increased exposure to the animation at this level resulted in
an increase in the amount and type of graphical change noticed and identified. Processing at
this stage appears to focus primarily on noticing and identifying changes, more than
interpreting those changes. Reading diagrams in static format requires learners to identify
features and relationships between features, read any text etc.. in order to understand the
diagram. Therefore, reading an animation also requires the learner initially to see ‘what’s
going on’. With this kind of external representation this means identifying features that are
moving. The fact that pupils noticed and identified dynamic features initially and increasingly
across exposures may be due to at least two factors; (i) that the movement on the animation
attracts attention; (ii) that identifying features of a diagram is a task that is familiar in that it is
similar to the requirements of reading a static diagram.
However, an animation, because of the dynamic change (be it transformation or translation)
requires a reader to also interpret not only the meaning of the graphical object itself, but also
the meaning of the graphical changes occurring. Accuracy of interpretation of graphical
change only improved significantly after maximum exposure to animation, which may
suggest the following; (i) that interpretation is processed after identification. Once a certain
amount of graphical changes have been identified processing of interpretation of these
changes begins to take place. Furthermore, the amount of changes noticed and identified after
increased exposure levels out at the time that an increase in interpretation is occurring (see
fig. 7.7. and fig. 7.8.). The salience scores show that there are still a substantial amount of
graphical changes to be noticed and identified even after the maximum exposure to the
animations, which suggests that an iterative process of noticing, identifying, and interpreting
is taking place. User activity has been described as being cyclical or iterative in nature (Green
1989). This conception can also be applied to diagrams such that information is being
returned to at some time during the integration process. In this way the use of the diagram is
iterative in the sense that it is being re-used, most likely in a slightly different or modified
way than before; (ii) That interpretation is more cognitively demanding than noticing and
identifying. It may be the case that interpretation of graphical change is more cognitively
demanding than interpretation of graphical objects from, for example, a static diagram.
Reading graphical change requires understanding the current representation (e.g. red dot
representing oxygenated blood), identifying the change (change in colour from red to blue),
and understanding the new representation of the feature identified (blue dot representing
deoxygenated blood). This is arguably more cognitively demanding than having to ‘read’
features that do not undergo this explicit change. In addition, expertise in reading
animation/dynamics may be limited. Interpretation may be hampered by inexperience with
working with animated diagrams, and interpreting graphical change, resulting in less
cognitive attention and effort applied to this task.
From the graph (fig 7.9.) it can be seen that scores in the conceptual category improved from
the minimum to intermediate condition, and from intermediate to maximum exposure. This
may suggest that more identification of graphical change enables integration of the identified
aspects with a more general conceptual understanding, but little conclusion should be drawn
regarding conceptual understanding as this was a side issue in this study with minimal focus
in assessment measures.

7.5.5. Analysis of individual questions
These results will be discussed under each question category heading.
Salience. Patterns of answers in the salience category suggest no definitive pattern of
processing transformational or translation change. However, in the initial exposure to
animation identification was primarily transformational, for example on the heart animation,
noting that the blue dots changed to red and vice versa, and with increased exposure on the
respiration animation noting that the grey cell loses a blue circle and gains a red circle.
Although some translation change was distinguished transformational change appears to be
more readily identified. It may be that transformational change, on the animations in these
studies exclusively takes place in one location, whereas translation change requires tracking
movement across differing locations and over a longer period of time. This requires an
intention to follow movement, and that attention be maintained on one graphical object for a
longer period of time than for transformational change, and therefore runs the risk of
attention being interrupted by other movement before processing of the full ‘tracking’ has
taken place. If this is the case then translation change may be more cognitively demanding to
identify accurately. It might be that the same effect would occur with transformational
change that occurred over a longer period of time. In the animations used in this thesis
transformational change is generally rapid, but other animations may show slow
transformations. If cognition was affected in these circumstances, then the speed of graphical
change may be instrumental to cognitive processing. The results also suggested that graphical
change, such as feature presence is not readily identified. This kind of change in the display
is perhaps not so explicit or apparent as translation and transformation. However, scores
noting that the red circle appeared (respiration animation) increased with exposure, whereas
the disappearance of the blue circle (respiration animation) did not. This may suggest that
appearance of a new feature is more readily identified than the disappearance of current
feature.
Interpretation. Analysis of questions relating to interpretation shows that correct
interpretation of transformational change increased with an increase in exposure to
animation. For example, interpretation of change of dots from blue to red and red to blue was
more accurate with more exposure to animation. If pupils notice this event then this may
demonstrate a cognitive progression, from identification to interpretation. The number of
subjects seeing or noticing that dots change from red to blue and blue to red is the same after

minimum exposure as after intermediate exposure. This suggests then, that the salience of the
event is processed early on, but that more exposure to the animation facilitates accurate
interpretation of this event. Accurate interpretation of translation change was generally poor.
This is most likely related to the degree to which each translation movement has been
identified. It would be reasonable to assume that difficulty in accurate full identification of
the movement would result in problems with accurate interpretation. It was clear from
detailed examination of the answers on blood flow that there was no evidence of a coherent
pattern of understanding the blood flow pathways. Overall the answers given suggest that
pupils were confused about where the blood flowed to and from, as both oxygenated and
deoxygenated blood were perceived as flowing into the heart both from the lungs and the
body. The distribution of these answers was not notably different.
7.5.6. Summary discussion
From the above results it can be seen that the level of prior domain knowledge affects the
level of processing of graphical change at different stages of exposure to animation. Those
with higher prior domain knowledge were able to both perceive (notice and identify)
graphical change better after minimum exposure to animation, than those with lower prior
domain knowledge. However, after intermediate exposure no difference was apparent in the
salience category between the two groups, but a difference was evident in the interpretation
category. This suggests that increased exposure to animation facilitated increased accurate
perception of graphical change in the respiration animation (lower prior knowledge), but was
not yet sufficient to bring about improved interpretation of graphical change, whereas
increased exposure in the heart animation (higher prior knowledge) facilitated interpretation
of graphical change. After a further increase in exposure to animation a difference in
interpreting graphical change was no longer evident. However, neither group scored
particularly highly on any question category. This might suggest that further exposure to
animation (or even other factors, such as learner guidance) may be necessary for improving
understanding of graphical change and integrating that information in order to make
inferences required for higher level conceptual understanding. The conceptual questions in
the test, however, were not sufficient to comprehensively assess conceptual understanding.
Further specific research on inferences from graphical change would be fruitful.
Overall there is evidence to suggest that some prior knowledge facilitates focus of attention
and identification and interpretation of graphical change, but may not necessarily facilitate
increased conceptual understanding. There is also evidence from learners that salient aspects
of the dynamics are processed prior to interpretation of the dynamics, and that both of these
aspects improve with increased exposure to animation. As there is no evidence of an increase
in conceptual understanding, the amount of exposure to the animation may not have been
sufficient for this kind of integration of information.
Detailed examination of pupil answers suggest that translation and transformation change
may be processed differently, and that this may be affected by, for example, speed of change
(in terms of number of frames as well as speed of frames), or dimensionality of the
representation. Additional research may serve to clarify these issues further.
7.5.7. Limitations of conclusions drawn
(i) From the results it is apparent that generally learners were unable to identify and interpret
all of the graphical changes that took place on the animations within the number of loops
used in these studies. To establish further information it may be necessary for learner to view
the animations for longer at each run, or encounter more exposures. It may be that a limited
threshold for processing graphical change exists, thus that no more changes are identified or
interpreted.

(ii) Conclusions about processing of salience and interpretation of graphical change is based
on the animations used in these experiments. This meant that not all possible variables in
terms of the kinds of graphics used were incorporated into the design. It might be, therefore,
that perception, identification and interpretation of graphical change are also affected by the
relative grossness of the change, the relative brightness of the colour, the relative size of the
object changing or the particular location on the diagram.
7.6. Limitations of experimental design
During data collection and analysis several limitations of the experimental design and
alternative ways of examining proposed issues within this study became apparent.
7.6.1. Complexity investigation
Using two different topics in this particular instance resulted in confounding variables, as due
to the teaching program within the school, pupils using one animation were being taught the
related topic while those using the other animation had had no teaching about the related
topic. This meant that pupil expertise in the domain differed, which no doubt had an effect on
the results and the conclusions that could be drawn in terms of comparisons in cognition
according to complexity of the representation as defined in this research. An alternative way
of investigating this would be to use a simplified version and a more complex version of one
topic, rather than two different topics for investigating complexity.
7.6.2. Animation design
A number of design aspects of the representation resulted in some ambiguity of information.
For example, the respiration animation showed flow of ‘air’ in and out of alveolar sac using
static arrows, which were frequently unnoticed. Several pupils suggested that this event or
action would have been clearer if the red and blue dots (representing oxygen and carbon
dioxide) had continued to flow in and out through the entrance to the alveolar sac. This would
have resulted in a more consistent representation of those substances, and made the
continuation of their movements more apparent through representational continuity.
However, these particular design aspects were not considered to undermine the results of the
study, although they do have implications for designing animations in terms of continuity of
representation type and clarity.

7.6.3. Test design
Designing assessment tests is a complex process and during analysis of test questions it
became apparent that some questions were redundant. These questions were isolated during
analysis, but were not found to cause significant differences in results. Using two different
animation domains demanded different sets of questions, therefore, potential inequality in
terms of complexity or ease of questions was present. The conceptual category of questions
comprised of a limited number of questions which may have been inefficient in generating
comprehensive information about conceptual understanding.
7.6.4. Procedures
An alternative way to establishing steps in understanding the salience and interpretation of
graphical change would be to have the same participants in the minimum, intermediate and
maximum exposure conditions, answering questions between each condition, using split file
technique. This would establish more clearly the kinds of links and cognitive progress made
by individuals, and may show regular patterns of cognition, suggesting different strategies of
learning. However, using this design would mean longer pupil participation time. Pupils
participation time within the school was limited as pupils were taken out of class time to take
part in the studies.
7.7. Conclusion
Chapters six and seven provide information about possible methodologies for evolving a
cognitive model of processing animation, and show the importance of detailed analysis of
pupil learning to inform about cognitive interaction with animation. This chapter has looked
in more experimental detail at the effect of the salience or visibility of graphical change on
cognition and has also discovered the importance of interpretability of the graphical change
in understanding animation. The next chapter goes on to look at parsability of an animation,
and the effectiveness of this on integrating information.

Chapter 8
Processing animation: How information is integrated from
a dynamic representation.
8.1. Summary
This research has concentrated on looking at cognitive processing of animation by focusing
on the properties specific to animation, and investigating learning in relation to these
properties. Studies and experiments in the previous chapters have focused on the perceptual
salience and the understanding of graphical change, (a dynamic property inherent to
animation) within a proposed cognitive model of learning with dynamic representations.
These studies suggested that some progression in understanding occurs from identifying
graphical change to understanding the meaning of the graphical change, but also suggested
that the type of graphical change itself may be instrumental in subsequent interpretation of
the change and consequent clarity of conceptual understanding. In terms of cognitive
dimensions of animated representations (visibility demands, akin to Green 1991 role-
expressiveness) this suggests that not only is visibility of the representation a dimension to be
considered, but also interpretability of the representation. As well as providing evidence for
an additional dimension to role-expressiveness, the studies also demonstrated how learners
extract and use information from animated diagrams, highlighting design issues for animation
(i) in terms of its graphical change, such as, the explicitness of the type of graphical change,
for example, whether the change is identified by the learner as transformation or translation
will affect the interpretation and meaning derived from the dynamics, and (ii) in terms of the
guidance that may be given to pupils, for example, guidance in focusing their attention to
specifically relevant graphical changes, making them more salient.
However, whether relevant information is attended to and processed due to its perceptual
salience or due to guiding attention, is only one factor towards fuller understanding. Green’s
(1991) definition of role-expressiveness entails the cognitive dimension of parsability of the
representation as well as visibility. Thus, a model of learning from an animation not only

includes visibility and interpretability of graphical change, but also consists of parsing the
diagram into appropriate sections. In addition, the importance of coherently integrating
relevant pieces of information has also been highlighted. “The ability to translate and
integrate new and stored knowledge is critical to understanding and being able to reason
about a domain” (Rogers 1999, p.8). In terms of animation this means integrating information
derived from both graphical change, other diagrammatic components, and domain relevant
events. The studies in this chapter investigate ways in which integration of information from
the animation may take place, based on concepts raised regarding domain parsing in chapter
three (3.3.1.ii).
8.2. Introduction
Complexity of animated information in terms of an increase in perceptually available
information, potentially resulting in high dynamic information load and in memory overload,
could point to the importance of learners being able to break down the information into
smaller components, in order that adequate comprehension or relevant reading of dynamic
representations can take place. Kaiser et al. (1992) found that where only one dimension of
the dynamic information was present then animation facilitated accurate observation. This
suggests that the number of simultaneous dynamic events is cognitively influential and that
'parsing' of dynamic events may be important in facilitating correct dynamical judgment. If
learners were able to isolate the different dynamic events, then this may suggest that parsing
the dynamics into single dimensional units is feasible and it may also facilitate understanding.
Studies one, two and three provided evidence that learners, to some degree, spontaneously
parsed information in particular ways, and appeared to take in small amounts of information
at one time, gradually combining their knowledge with previously acquired pieces of
information.
However, although the previous experiment focused on salience and interpretation of
graphical change, pupil performance in these studies also suggested that integration of those
features was lacking in building a coherent picture of the dynamic system being displayed.
Successful integration of information may be affected by several factors. On a general level
such aspects as, previous knowledge, learner task or even cognitive style may affect a
learner’s ability to integrate information. In terms of diagrams, integration may be affected by
aspects such as the frame of reference, identifying relational components, or successfully

ordering pieces of information (e.g. Witrock’s (1989), Narayanan and Hegarty 2000).
Research into understanding any representation, be it text, speech, graphics has cited the
importance of ‘parsing’ the information into smaller understandable components (e.g. Rieber
1990, Green 1991).
Although, these are critical to successful comprehension, on a more specific level integrating
information from an animated diagram may be problematic for reasons relating to the
fundamental properties of animation. The basic form of animation immediately renders the
information into a series of multiple representations. This means that understanding an
animated diagram requires the integration of information across multiple changing
representations. The learner is, therefore, required to remember previous transitory
information (e.g. object location, relational components) to order and integrate.
Decomposition into smaller components prior to reintegration is more complex with
animation requiring the learner to identify and segregate not only domain relevant sub sets,
but also graphical change mechanisms, and integrate information across these two aspects.
One important facet of integration is to make coherent and relevant links between all these
various types of information accumulated from the representation. Thus, relevant properties
of animation in relation to integration of information relate primarily to cognitive overload in
terms of: (i) the transient nature of the representation precluding learner control in reaccess
to information (Stenning 1998), which may be important in integrating information
coherently, and (ii) the large (even unmanageable) amount of salient perceptual information
being displayed (Kaiser et al 1992), impeding focus of attention.
The proposed learning model (chapter three) suggests that to understand from an animated
diagram a learner must first notice and identify graphical change (which may be in the form
of translation, transformation or feature presence). This graphical change must in turn be
interpreted in terms of its representational meaning, and these meanings or interpretations be
linked together to produce a coherent understanding or model of the dynamics of the system.
For an animation this involves understanding that a movement of an object from one place to
another must be understood in terms of what it is representing, and how this relates to another
object moving from one place to another, or to the same object making a further movement,
and to the static components of the diagram. It also entails understanding the relationship
between a transformational change and a translation change. For example, in the heart
animation this would mean understanding that the movement of deoxygenated blood from the
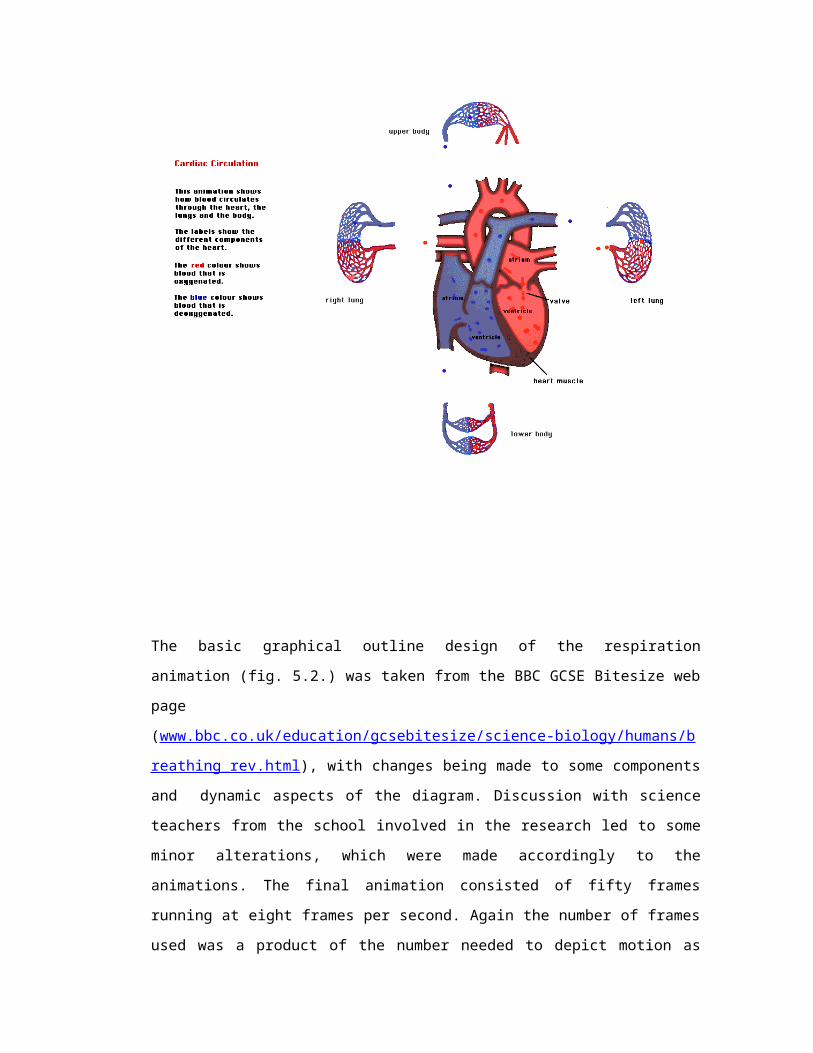
heart to the lungs is related to the transformational change from blue (deoxygenated) to red
(oxygenated) in the lungs, which is also related to the translation change of oxygenated blood
from the lungs back to the heart, in terms of the functionality within the cardiac system.
Noticing, identifying and translating a graphical change alone is not sufficient for full
understanding of a system, understanding the relationship between one graphical change and
another is important in determining comprehensive meaning about the dynamics of the
domain. It seems to reasonable to assume, therefore, that there are four broad steps to this
learning process; (i) identifying separate pieces of the dynamic information, (ii) interpreting
this graphical change (iii) identifying separate components or subsections of the diagram and
(iv) integrating all of these pieces of information to make a coherent whole. The latter two of
these is the focus of this chapter.
Studies one and two (comparison of animated and static representations) and study 3
(perceiving and understanding graphical change) both provided information which is
pertinent to issues relating to integration of information from animated diagrams. In study 1
the manner of structuring information (through task) was found to be predictive of
performance whether using an animated or static diagram. The results from this study relating
to differences in task type, primarily suggested the importance of organising information for
learning, not only in terms of guiding learners towards specific pieces of information, but also
in terms of ordering the aspects they attend to, in such a way that it enhances integration of
information. Studies one, two and three all generated evidence of patterns of attention focus
suggesting ways in which pupils ‘parsed’ the diagram and structured the information they
were studying. Focusing attention and sequencing information relieves learners from
deciding which aspects are important and in which order to 'read' information. This may
reduce confusion, enhance focus of attention on relevant aspects, and facilitate integration of
information. Study 3 also suggested that with animated diagrams learners are required to
integrate dynamic features with static features of the representation, and although this
characteristic may sometimes arise due to design features (e.g. the respiration animation in
this thesis showed flow using static arrows combined with explicit dynamics), the necessity
to integrate static with animated features remains.
Studies one and two showed errors in understanding that related to Green’s (1998) concept of
hidden dependencies, and was identified in this current research as peripheral dependencies
relevant to comprehensive understanding about a system (see 4.3.3.). This dimension refers to

the provision within the representation to convey ‘peripheral’ processes that are integral to
understanding the specific process depicted in the animation, for example, the process of gas
exchange in the lungs and the body for understanding cardiac circulation. Evidence from
previous studies in this thesis suggest that peripheral process information is not well
integrated with information about the depicted system by learners. The studies on graphical
change suggest that pupils identified the relevant transformational changes of the blood, but
it was not clear whether this information was integrated into and related to cardiac
circulation.
To investigate integration of information it is necessary to consider the kinds of links pupils
make or do not make, and whether or not these links result in comprehensive understanding.
This study examined these aspects by providing diagrams with smaller pieces of information
from which links could be made and pupils were tested on whether or not these links were
achieved and whether this contributed to their understanding. The animations were, therefore,
‘parsed’ and presented in identifiable domain specific (as oppose to graphical change
specific) components (see chapter three). Thus the focus was to use different stand alone
sections of information that could be combined, rather than individual dynamics, such as one
transformation or translation event. The appropriate components were constructed in an order
concurrent with previous research (study 1 and three) for the purpose of integration.
However, when information is divided up, representations automatically become multiple,
e.g. there may be six different diagrams showing smaller amounts of information instead of
one. Research suggests that integrating information across representations can be problematic
(Rogers and Scaife 1997, Hoogeveen 1997, Kim and Hahn 1997). There may be several
reasons for this; the amount of visual search required to find related information from
different representations (Kim and Hahn 1997); information not being simultaneously
available on the screen, causing the learner to have to remember information from one
‘screen’ to another and make links without the previous information being present (Rogers
and Scaife 1997). The concept of dynalinking, (where different representations are
simultaneously presented together with explicit links between representations) has been
shown to facilitate integration of information due to the proximity of the representations and
the explicit demonstration of relational elements, and cause and effect (Rogers and Scaife
1997). Although dynalinking also used different kinds of external representations across
which to share information, nevertheless the need to integrate information from one screen to
another was removed. To encompass this finding, animations can be designed in such a way

that the whole animation continues to run on the screen, while a particular section of the
diagram is simultaneously visibly more explicit. This also enables parsing of the animation,
which inherently guides attention focus, at the same time as maintaining links between the
more visibly explicit information and the rest of the animation. Structuring the animation in
this way enables the investigation to focus on whether or not pupils make relevant
information links between one section and another.
During design of the parsed animation, two different ways of presenting the decomposed
information emerged (either adding each new component to the current display or
substituting one component for another). This also enabled investigation into the
effectiveness or not of focusing learner attention to specific domain aspects, and ordering the
information in a relevant fashion. Decomposing the animation for the learner removes one
step of the cognitive load required to understand the animation. Therefore, not only can
integration of information be identified, but also the benefits or disadvantages of ‘parsing’ the
animation in terms of overall learning.
In studies four and five two animations were employed, the original rationale being an issue
of complexity in terms of, for example, the quantity of dynamics, multidimensionality, to
establish whether differences in processing existed between the two kinds of representations.
However, in this study the ability to integrate information was established through animations
where information was pre parsed, and although there may be differences in processing with
dynamics of more or less complexity in terms of the number of sections to parse and
integrate, the use of one animation was considered to be sufficient for investigating how
information from an animated diagram may be integrated. The heart animation was selected
for this purpose, as it provided more parsing facility and was more complex in terms of
amount, and dimensionality of information.
Thus, using identified properties particular to animation as a basis for understanding
cognitive processing specific to this kind of representation, the aim of this study is twofold:
(i) to investigate the relational links that may or may not be being made, and (ii) to identify
ways in which integration may be facilitated given the documented difficulties inherent in an
animated representation and the preliminary findings in study 1. This study was, therefore,
divided into two parts:

Study 5: description generation of cognitive processing when integrating information from an
animation.
Study 6: experimental evidence of the effectiveness of different parsing manipulations on an
animation.
8.3. Study 5
The aim of this study was to generate a description of the cognitive process of integration of
information using an animation. Two different parsing manipulations were used on the heart
animation. Data was obtained through verbal protocols from pupils between each addition of
parsed sections of the animations, as well as a written post test.
8.3.1. Method
Participants
Participants were sixteen year 8 pupils from a Comprehensive School who were novel to this
research. Ten were female (mean age = 13 years 3 months; 159 months, sd = 3.9 months)and
six were male (mean age = 13 years 2 months; 158 months, sd = 2.5 months). Pupils were
taken from mixed ability science classes, thus providing a distribution of ability across
experimental conditions. Pupils worked in pairs as allocated by their teachers on the basis of
working well together.
Materials
(i) The animations (see CD ROM provided)
The heart animation from the immediately previous studies was used as a basis for this
experiment, with particular modifications in relation to parsing. The modifications consisted
of parsing the information into six smaller coherent sections. The basis for the manner in
which the information was to be parsed was taken from previous experiments showing
patterns of order of information attendance, and processing of graphical change in terms of its
salience, with the focus being on learning blood flow through the heart and the circulatory
system.

In this experiment parsing the animation was implemented in Multimedia Director through
the use of masking. The selected subsections of the animation were made visually explicit,
while the rest of the animation was still present but masked, such that it was dimmed, making
it less likely to draw attention. The rationale for maintaining the animation in the background
was to avoid placing the selected parsed section out of context of the rest of the animation, in
accordance with conclusions from previous research (e.g. Scaife and Rogers 1997). A
consequence of this was that in order for the masking to merge with the rest of the diagram
the background of the animation had to be black as oppose to the white background used in
the previous studies. The visually explicit subsection changed or increased (according to
experimental condition) on a mouse click by the user. In order that pupils had a coherent
frame of reference prior to viewing the parsed animation, the display initially consisted of the
whole diagram in static format. A static diagram provides the context and frame of reference
without exposing the dynamics of the animation. If pupils were exposed to animation prior to
manipulation this could have some influence on their processing of the parsed animation. The
final design of the mini program, therefore, shows an initial static representation of the heart
together with some textual information explaining what the diagram was showing and
explaining that blue represented deoxygenated blood and red represented oxygenated blood.
A play button was provided for the learner to begin the animation when ready. The animation
began with all areas masked, so that when the first masked area was uncovered, the content
of the revealed information was clearly evident (see CD ROM).

Additional parsed animation
The animation began with the heart diagram in static form. The learner was required to click
a “PLAY” button to begin the movie. The movie then began with all parsed sections masked.
A “NEXT” button enabled the learner to go to the first parsed section. Another click on the
“NEXT” button took the learner to the second parsed section. This parsed section was
displayed together with the previous one, while other parsed sections remain masked. This
pattern continued until all parsed sections were simultaneously displayed. In this
manipulation each parsed section displayed was additional to the previous parsed section(s).
During the animation the learner always had the facility to go to the previous parsed section
by clicking on a button labelled “BACK”.
Figure 8.1. Example frame from additive parsed animation, showing three revealed sections of the
parsed animation.

Substitute parsed animation
The animation started with the diagram in static form. The learner was required to click a
“PLAY” button to start the movie. The movie then began with all parsed sections masked. A
“NEXT” button enabled the learner to go to the first parsed section. Another click on the
“NEXT” button took the learner to the second parsed section, but unlike the additive parsed
animation, as this parsed section was displayed the previous one became masked again. This
pattern continued until all parsed sections had been displayed. At this point the learner could
view the full animation. During the animation there was always the facility for the learner to
go to the previous parsed section by clicking on a button labelled “BACK”.
Figure 8.2. Example frame from substitute parsed animation
The animations were run on Macintosh PowerBooks in a laboratory in the school. The
lighting conditions were such that masking was set at 90% transparency, in order that the
masked parts remained visible, but distinctively different in visual explicitness that the non-
masked sections. As the angle of the screen significantly affected the visibility of the masked
sections, each time the screen was checked for optimum positioning. The animations
consisted of 90 frames, and were played at 25 frames per second.

(ii) Task
A fairly general task was chosen so that pupils attention was not too specifically directed,
enabling more explorative kind of research. Pupils were informed that their task was to find
out as much as they could about how and where the blood flowed through the heart and the
circulatory system.
(iii) Testing and analysis
Verbal protocols were recorded from participants between each addition or change of the
parsed subsections of the animation. This produced information for generating a description
of the cognitive process of integrating information, providing both correct interpretations and
errors in understanding, and establishing when, if or why errors were corrected.
(iv) Assessing learning outcomes
Learning was assessed using a written test and a computer presented diagram test (see
appendix 12a for pre tests, 12b for post tests). Using two different representational formats
for testing may provide more comprehensive information about knowledge representation,
and integration of information by using cross representational formats (Mintzes et al. 1999).
The written test was designed to focus on links between pieces of information, and assess
understanding of higher level conceptual issues, such as, the links between the heart and the
processes within the lungs and the heart and the processes within the body. The optimum way
of designing pre and post tests in this experimental environment was considered to be to use a
split half technique giving half of the subjects test A as a pre-test and test B as a post test, and
the other half of the participants test B as a pre-test and test A as a post test. This served two
functions: firstly, it enabled analysis of levels of prior knowledge to establish any differences
that may have existed between experimental groups, thus confirming uniformity of
knowledge across experimental conditions. If uniformity of prior knowledge exists, then any
differences in learning between experimental groups cannot be attributed to differences in
prior knowledge: and secondly, it enabled comparison of performance between pre
experiment and post experimental effects, by using the same test in a split half technique.
This means that any differences in learning can be attributed to the experimental effect. For
the diagram test (see appendix 13) pupils were required to note the numbers displayed on the
diagram in the order that the blood flows around the system, beginning with number 1. Pupils
were then required to use paint tools to show where oxygenated and deoxygenated blood
flowed around the cardiac system.
Design
Pairs of pupils worked with either the additive parsed animation or the substitute parsed
animation, in order to extract verbal protocol descriptions at each new parsed stage of the
animation. All sessions were video-recorded for later analysis and to provide a description of
the integration process.
Procedure
Subjects were given the written pre-test, completed on an individual basis, three weeks prior
to commencement of data collection. Immediately prior to the experiment pupils were
informed that they would work with an animation that had been subdivided into sections and
were instructed to try to describe what they saw, what they thought it meant and how it fitted
with the previous section of information they had viewed. Verbal description was encouraged
through prompting such as, What did you see? What does that mean? How does that fit with
what you’ve already understood/ seen? They were aware that the session would be video-
recorded. All pupils completed the post tests immediately after the interview. The written
post test was completed individually, followed by the computer diagram test, which was done
co-operatively. These aspects of testing will be presented and discussed in the second half of
this chapter (see 8.4.2.).
8.3.2. Results
The results for this study were taken from qualitative data obtained from video recordings of
verbal protocols. Pupils were encouraged to verbalise not only what they could see and
understand from each component of the animation, but also to verbalise the links that existed
between each section of information, and finally to give a description of the blood flow
process. Analysis of verbal protocols therefore consisted of three aspects; (i) identification of
relevant facets of each section, (ii) making referential links between information sections, and
(iii) describing blood flow.
(i) Identification of relevant facets of each section
No overall significant difference was apparent in the information pupils obtained from each
section of the diagram regardless of animation permutation. However, it was evident that
certain pieces of information were not identified (again regardless of animation permutation),
as follows:
no pupils noted that oxygenated blood flowed in from the right as well as left lung
no pupils noted that oxygenated blood flowed out of heart to lower body
only one pair noted that deoxygenated blood flowed to the right as well as left lung
specific reference to the blood changes was lacking, despite it being generally noted
that blood flowed in oxygenated and out deoxygenated, or vice versa. This occurred most
notably in the body, for example, in the body 4 out of a possible 16 references were made
to blood changes, whereas in the lungs 9 out of a possible 16 references were made to
blood changes.
(ii) Making referential links
There was a significant difference in the number of links made between sections of
information according to permutation of animation. A sub set of those using the substitute
animation made a total of three of a possible eight links, whereas all eight links were noted
by those using the additive animation (see table 8.1.).
Table 8.1. Showing the number of links made between sections of information according to animation permutation.
Number of subjects additive Number of subjects substitutive
Link 1 8
Link 2 4 2
Link 3 2
Link 4 2
Link 5 6 4
Link 6 6 4
Link 7 4
Link 8 2
total 34 10

(iii) Blood flow descriptions
Of those using the substitute animation only one (out of eight) pair gave a full accurate
description of blood flow, the other pairs missed out either the right lung and lower body or
the right lung and upper body in the cycle. Of those using the additive animation three (out of
eight) pairs gave an accurate full description of blood flow, including blood changes.
8.3.3. Discussion
The aim of level one of this study was to generate a description of the process of integrating
information from a ‘parsed’ animation of the heart. The parsed animation was presented in
two different ways, which generated some differences in degree of success in integrating
information. Three aspects of verbal explanation were analysed; (i) identification of relevant
facets of each section, (ii) making referential links between information sections, and (iii)
complete description of blood flow.
Relevant factors identified from each section of the parsed animation were found to be
similar across the two animations, in terms of both accuracies and omissions of information.
On one hand this is not surprising given that both animations clearly showed each new
section being displayed, thus focusing pupil attention to a particular part of the diagram.
However, it is interesting to note that even those using the additive animation were able to
maintain their attention focus specifically despite the presence of an increasing amount of the
animation information. This suggests then, that contrary to earlier studies in this thesis, that it
is not necessarily the amount of perceptually available information per se being displayed on
an animation that is problematic for comprehension (Kaiser et al 1992), but the reduction of
attention focus that this can cause. This would link with information found in study 1 relating
to the kind of task used. Once the problem of attention focus has been addressed the amount
of perceptual information per se may be a less significant factor in hindering learning with
animation. Focusing attention inherently reduces the amount of perceptual information being
attended to, reducing the amount of translation of graphical change, reducing the amount of
information needed to be held in memory, and in a cyclical animation allows the learner to
reaccess specific parts of the dynamics. This means that an animation could display all fields
(at some level of visibility) without dynamic information load, and cognitive overload, if
attention focus is relevantly guided.

The omissions pupils made were most likely to be a result of the complexity of the cardiac
system itself and the resultant graphics in 2D representation. The 2D format means that some
vessels are displayed running behind either the heart itself or other vessels. This makes some
blood pathways much less perceptible than others, for example, no pupils noted blood flow
from the heart to the lower body, and no pupils noted blood flow from the right lung into the
heart, while looking at the oxygenated heart section.
The most striking difference between the two animations was in the pupils’ abilities to make
links between the parsed sections. A minority of pupils using the substitute animation made
links between sections at all and those that did made few. All of the links identified for
analysis were made by those using the additive animation. This suggests that one animation
permutation provided information that was lacking in the other. In the substitute animation
each parsed section disappeared when a new one was displayed. This resulted in clearly
segregating each section. Conversely, in additive animation each parsed section was added to
the previous one displayed, making an explicit link for the learner between one section and
the next, and enabling the learner to continue to see the links as previous information was still
being displayed.
Descriptions of blood flow between the two animation groups also differed. The majority of
those using the additive animation gave full accurate descriptions of the blood pathway and
blood changes within the circulatory system. However, those using the substitute animation,
although giving accurate descriptions in terms of blood changes and some of the pathways,
particular omissions in the cycle were evident, for example, omissions of flow to the lower
body or upper body and to the right lung. This confirms evidence that links between pieces
of information were more problematic with the substitute parsed animation.
In summary, this case study suggests that when interacting with a parsed animation learners
can focus their attention on specific aspects of information enabling them to notice, identify
and interpret graphical changes within each section, but that making links between those
sections and pieces of information is more problematic when those links are not made
explicit within the representational format.

8.4. Study 6
In this study the aim was to collect quantitative data about information integration, overall
learning and design issues using the same ‘parsed’ animations as in study 5, together with a
‘control’ animation and a ‘test control’ group. Therefore, three experimental conditions were
implemented to assess differences in overall learning according to the design of animation
presentation, plus the test control group.
8.4.1. Method
Participants
A total of sixty pupils participated, twelve pupils in each experimental condition, and 24 in
the test control group (12 for each half of the test). Participants were different year 8 pupils
than those participating in study 5, from the same comprehensive school who were novel to
this research. These pupils were again taken from mixed ability science classes, thus
providing a distribution of ability across experimental conditions. Thirteen were female
(mean age = 13 years 2 months; 158 months, sd = 3.5) and forty seven were male (mean age
= 13 years 2 months; 158 months, sd = 3.1).
Materials
Figure 8.3. Example frame from control animation.

The same animations were used as in study 5, but in addition a control animation was used,
which was a continuous looping animation without any masking or pre-parsed sections.
This animation was similar to that used in the previous experiments (studies three and four,
chapters five and six) but was set out on the screen in the same format as the additive and
substitutive animations (see CD ROM provided and fig.8.3.).
Pre and post tests were also of the same design as in study 5 (see appendix 12a, 12b and 13).
The tests were also given to a control group who did not participate in any experimental
condition. This enabled comparison of performance on both test A and B establishing that the
questions in each half were similar, and could be reasonably used as a comparative basis for
performance. It also enabled questions that were considered to be unique within the test to be
given half as pre-test and half as post test to this control group, and could be reasonably used
as a baseline measurement of performance on these questions. Total possible scores on each
test were as follows: pre tests A and B could score 12; post tests A and B could score 24;
delayed post tests A and B could score 24; computer diagram test could score 10.
Design
This experiment consisted of four conditions; (i) an additive parsed animation; (ii) a
substitute parsed animation (iii) a control animation, which was a continuous looping of the
heart animation, and (iv) an overall control group, which completed all pre and post test
papers, but did not receive any experimental manipulation.
Experimental group 1 received the additive parsed animation, where each parsed
section of animation was additional to the current display, so that increasingly more
dynamics were displayed. Pupils had control over when the next section was displayed.
Experimental group 2 received the substitute parsed animation, where the parsed
sections were displayed separately in a prescribed order, so that only one section of
dynamics is displayed at one time, thus, each parsed section was substituted by another.
Pupils had control over when the next section was displayed.
Experimental group 3 received the control animation in a continuous looping format.
Experimental group 4 received only the pre and post tests each three weeks apart and
served as a control test group.

Procedure
Pupils worked with their allocated animation individually on Macintosh PowerBooks. The
layout of the animation mini-program was explained to them prior to its use, and they were
given instructions as follows.
Instructions for the animations:
Pupils were informed that the animation showed blood flow through the heart and circulatory
system, and how the heart worked; that the animation began with a static diagram of the heart
and some text information; that to start the animation they would need to click on a button
labelled ‘play’, or in the case of the ‘control’ heart they could press any keyboard button.
For the additional parsed animation:
Pupils were informed of the following: “When the animation plays it will be shown in small
sections. If you click the ‘next’ button a new additional section of the diagram will be visible.
This continues until the whole diagram is displayed. If you click on the ‘back’ button it will
take you to the previous section.”
For the substitute parsed animation
Pupils were informed of the following: “When the animation plays it will be shown in small
sections. If you click the ‘next’ button a new difference section of the diagram will be visible.
When all sections have been seen the whole diagram will be displayed. If you click on the
‘back’ button it will take you to the previous section.”
Pupils were allowed to work with the animation for a period of time that was considered to be
sufficient by each pupil. Time taken was recorded in seconds. No interviews took place in
these sessions. All pupils completed the post test immediately after working with the
animation. A delayed post test was also completed four weeks later.
8.4.2. Results
The results for this study were quantitative, taken from written and diagram post tests. Scores
on all tests were transformed and computed into percentage scores so that comparisons could
legitimately be made across different tests. The results will be presented in two sections: the
first consists of an analysis of the control test group providing confirmation of reliability of
test scores used in subsequent analyses, and the second comprises analyses of the following
aspects (i) analysis comparing performance according to animation manipulation, (ii) analysis
comparing learning differences from pre to post tests, (iii) analysis of hidden process

features, (iv) analysis of time taken with each animation manipulation, (v) analysis of delayed
post test scores.
Section 1
Analyses of test scores were performed to establish that no differences existed between test A
and test B, or between pre and post test scores in the group that did not receive any animation
manipulation. An independent t-test showed no significant differences between scores for
group A tests and group B tests (p = 0.19). This suggests that performance on one test could
be reasonably compared with performance on the other. A further dependent t-test showed no
significant difference in within subject scores from pre to post test in the test control group (p
= 0.10). This shows that there were no significant differences in the split half of each of the
tests given, and that there were no improvement in scores from pre to post test in the group
who received no animation permutation. This means, therefore, that any significant
differences in scores for groups who received an animation permutation can reasonably be
attributed to the animation and is unlikely to be a product of a difference in the split half of
the test.
Section 2
(i) Comparison of performance according to animation manipulation
For this analysis the independent variable was animation permutation with three levels;
additive parsed animation; substitute parsed animation; and control animation. The
dependent variable was the total post test score. A one way independent ANOVA showed
significant differences in test scores according to animation (p = 0.02). Pupils performed
significantly better or worse according to the animation they used. Bonferroni post hoc tests
showed that those in the additive group performed significantly better than those in the
substitute group (p = 0.02), but not in the control group.

Figure 8.4. Graph showing differences in total post test scores according to animation permutation.
animation design
controlsubstitutiveadditive
30
28
26
24
22
20
18
A one way ANOVA looking for differences in performance with the diagram test showed
results approaching significance for those using the additive animation (p=0.06).
Table 8.2. Showing means and standard deviations for diagram test
N Mean Std. Deviation additive 12 12.75 3.98
substitutive 12 8.41 4.96 control 12 10.83 4.13 Total 36 10.66 4.61
A Bonferroni post hoc test showed that this difference was between those using the additive
animation and those using the substitutive animation. From the means (table 8.2.) it can be
seen that those using the additive animation performed better than those using the substitutive
animation on the diagram test. These results follow a similar pattern to results obtained for
the written test (see fig. 8.5).
Figure 8.5. Graph showing scores for written and diagram tests according to animation permutation.

animation design
controlsubstitutiveadditive
80
70
60
50
40
test type
written test
diagram test
(ii) Comparison of performance between written pre and post tests according to animation.
For this analysis a mixed ANOVA was used. The repeated measures variable was the pre and
post test scores, the independent measures was the animation permutation. The ANOVA
showed a significant main effect, pre and post test scores were significantly affected by
permutation of animation (p = 0.03). Significant differences were also found between the pre
and post test scores (p = 0.00), showing that significant improvement in performance was
apparent following animation use. A significant interaction between the two factors (p =
0.03), suggests that pre and post test scores differed significantly according to permutation of
animation. Those using the additive parsed animation and the control animation performed
significantly better following participation with the animation whereas those using the
substitute parsed animation did not.
The graph (fig.8.6.) shows that pre test scores were similar across animation conditions, but
that the post test score was significantly affected by the animation permutation received.
Those in the control and additive condition scored significantly higher on their post than pre-
tests, whereas those in the substitute condition scored similarly on the post as in the pre-test.
Figure 8.6. Graph showing pre and post test score according to animation

animation design
controlsubstitutiveadditive
70
60
50
40
30
test
pre test
post test
(iv) Analysis of questions on peripheral dependencies aspect.
This analysis was taken from questions 7 and 8 of the post test (see appendix 12b). Overall
pupils scored poorly on questions related to function and ‘hidden’ processes or peripheral
dependencies within the cardiac system (e.g. processes such as gas exchange in the lungs and
the body). No group scored significantly better than the test control group on either question.
Statistical analysis shows that pupils scored significantly lower on hidden process aspects
than on functional aspects (p=0.00).
Figure 8.7. Graph showing differences in function and process understanding
group
controlsubstituteadditivetest
90
80
70
60
50
40
30
20
question type
process
function

(v) Analysis of time taken
A one way independent ANOVA (independent variable – animation permutation, dependent
variable - time taken) showed that time taken using the animations significantly differed
across groups (p = 0.04). Those in the additive condition spent significantly longer with their
animation than those in the substitutive group and the control group. However, it is also
important to know if there is a significant relationship between time taken and test scores. A
Pearson’s correlation between time taken and test scores showed no significance (Pearson’s
correlation = 0.09, p = 0.59). Therefore, although the time taken with the animation may be
significantly different, this difference did not affect the test scores. This means that the
difference in scores between permutations can be reasonably attributed to the permutation
and not to differences in time spent with the respective animations.
(vi) Delayed post test results
A delayed written post test was administered to participants in all animation groups.
However, due to time delay a few participants were not available to complete the test on the
day of administration. The scores of these participants were, therefore, removed from the
analysis (see table 8.3. for ‘n’ participants in each condition).
Table 8.3. Showing means, standard deviations and number of participants in each group.
animation design mean standard deviation N additive 43.93 27.91 11
substitutive 47.72 27.66 11control 37.03 24.33 9
interview 35.55 20.76 15Total 40.76 24.67 46
post test additive 60.98 22.22 11substitutive 46.21 22.70 11
control 62.50 24.91 9interview 59.72 27.30 15
Total 57.33 24.64 46 delayed post
testadditive 52.27 30.69 11
substitutive 56.06 16.70 11control 61.11 28.02 9
interview 54.72 24.33 15Total 55.70 24.58 46
A mixed measures ANOVA was performed on the written pre tests, post tests and delayed
post tests to analyse any differences across animation groups or tests. The ANOVA showed
significant differences in test scores according to time of testing (p = 0.00). A repeated

contrast showed that this difference was significant between the pre and post test scores, but
not between the post and delayed post test scores (p = 0.00).
A one way ANOVA showed that delayed test scores across groups did not significantly
differ. Animation design had no significant effect on delayed post test scores.
Figure 8.8. Graph showing pre post and delayed post test scores across animation conditions.
test
delayed post testpost testpre test
70
60
50
40
30
animation design
additive
substitutive
control
interview
8.4.3. Discussion
This study elicits information about several aspects of processing animation. The discussion
of findings will therefore be presented under specific relevant headings.
1. Effect of parsed animations on information integration
The results of this study confirm initial findings from the study 5 (level 1) that understanding
was more problematic for those using the substitute parsed animation than either the additive
animation or the control animation. Those in the additive animation performed significantly
better than those in the substitute animation. In fact the differences in pre and post test scores
suggest that the substitute animation provided no assistance to learning at all. Those using the
additive animation performed significantly better in the post test than the pre test, whereas
those using the substitute animation showed no short term learning benefits. This pattern was
similar for both written and diagram tests, suggesting that the test format itself was not
indicative of particular results.

The most likely reason for this discrepancy is related to making information links. The case
study demonstrated that links between information sections were not identified or noted by
pupils using the substitute animation. As the test was designed to focus on linking of
information (together with some general conceptual issues) these results confirm that pupils
using the substitute parsed animation found making appropriate information links
problematic.
There are several factors that could contribute to this result. (i) Although on both parsed
animations information sections were presented in the same order, the links on the substitute
parsed animations were not explicit as in the additive animation. Since the parsed sections
remained on the screen, the links from one section to a new section were more explicit,
merely due to the fact that the previous parsed section did not disappear. This supports
learners in integrating information by providing explicit links between consecutive sections
of information (ii) The design of the parsing (showing only one parsed section at a time)
inherently caused the representation to become a multiple representational format, thus
requiring pupils to integrate across representations. Animation maybe shows changes
occurring over time more explicitly because of the rate at which diagrams are displayed, but
precludes the ease of integrating elements from one representation to another. Without
specific reference to linked aspects this makes integration difficult (Narayanan and Hegarty
2000) and adds to the memory load needed to remember information across representations.
It could be argued that there is some inconsistency in this explanation, as both parsed
animations were designed in such a way that any parsed sections not yet clearly visible were
merely masked, allowing the rest of the animation to be discernible. This design should have
removed problems associated with this aspect of multiple representations, as the whole
animation was perceptible on the screen. The results, however, may be explained by an
attentional problem that could have arisen as a result of parsing the animation. Learners
attention is directed to such a degree that they are unable to attend to the masked areas of the
animation, or they become unaware of the importance of the rest of the information in
relation to the section on which they are currently focused.
In essence, then, it is not only ‘parsability’ of the representation that is important (Green
1989) but also ‘linkability’ – facilitating links to be made between relevant parsed sections of
information.

2. Effect of the control animation on integration of information
The importance of specific perceptible links is further verified if we compare performance on
the parsed animations with that of the control animation. It appears that, although the additive
parsed animation was most beneficial in aiding integration, the test results suggest that the
control animation provided some facilitation of this process. This may be explained by the
fact that the control animation also displayed links between sections, even though those
sections were not explicitly segregated. Explicit segregation of animated information may be
beneficial in terms of focusing attention and reducing perceptual and memory load, but
explicitly displaying links appears to be of higher importance in facilitating understanding
than segregation or ‘parsing’, unless explicit information links are also displayed.
The apparent facilitation in understanding from the control animation may be further
explained by amount of prior pupil knowledge in the domain. The pupils in this study had
covered some aspects of cardiac circulation earlier in the current school year, so using this
animation served at some level as revision. It has been shown that domain experts and
novices differ in the way they use external representations, and in the way information is
perceived and understood, particularly in terms of meaningful chunking of information (e.g.
De Groot 1965, Hinsle et al. 1977, Egan and Schwartz 1979, Ehrlich and Soloway 1984) and
in reliance on domain relevant information rather than visuo-spatial characteristics of the
diagram (Lowe 1994). The parsed animations focused on domain relevant chunking of
information, chunking which the pupils may have been able to achieve themselves when
using the control (non-parsed) animation.

3. Effect of animation manipulation on ‘peripheral dependencies’
A continuing problem is the lack of awareness and understanding of the relevance of
peripheral dependencies or hidden processes (cf. Green 1991 hidden dependencies). These
are aspects integral to a full understanding of the system, but are peripheral to the actual
displayed system. In this instance the processes of gas exchange in the lungs and the body are
inherently difficult for pupils to attend to and link with the displayed cardiac system. This
affects their higher level understanding of the concepts of the system. The results of this
study suggest that, despite parsing the animation, pupils overall still lacked insight into these
peripheral ‘hidden processes’. Studies three and four suggested that pupils were able to
notice, identify and interpret transformational changes relating to blood flow, but this study
suggests that this information is not integrated into the functionality of the system or process
as a whole. However, pupils who were required to give concurrent verbal protocols showed
better insight and clearer explanations of these processes. This may have been because they
were prompted to specifically think about these issues during their explanations, as well as
being made aware of the processes through explicit verbalisation of the diagram. Self
explanation enables students to infer information from inadequate texts and to construct
knowledge that is missing from the text (Chi 1997). This may also be true of learners using
animated diagrams, and may be relevant in further research investigating ways in which
learning with animation may be enhanced.
4. Implications for learning in relation to previous studies
Although graphical change was not explicitly measured in this study, pupils here showed
little difficulty in identifying and interpreting graphical change. This may have been due to a
combination of factors; (i) Smaller components of information reduces the amount of
perceptual information to be attended to at any one time. This not only aids focus of attention
on all changes occurring in the displayed section, but (also due to cyclical looping) allows
reaccess to information by the learner, who can identify and focus on the aspect they need to
‘see’ again, without being distracted by peripheral movement. (ii) The level of prior pupil
knowledge, may have enabled pupils to focus on domain relevant information rather than
visuo-spatial aspects of the representation, facilitating interpretation of graphical change. A
focus on domain relevance may also have been facilitated by parsing, in that smaller sections
leaves less visuo-spatial information on which to focus, enabling parallel focus on domain
relevant aspects. (iii) The animation in this experiment was continually looped, without
exposure restrictions, therefore pupils had potentially more exposure to the animation (and

the graphical changes) than those participating in the graphical change experiment (study 4).
However, it is interesting to note that those pupils interviewed in the case study (study 5)
noticed and identified reasons for changes in blood, including hidden/peripheral processes
within the system, better than those in the experimental conditions. These were aspects on
which those not ‘explaining’ scored poorly. As in study 3 (see 6.5.1.) this could have been
due to ‘explanation’ effects on cognition. Explaining again serves to channel processing into
thinking about the implications of the information being processed in terms of an overall
model of understanding.
5. Implications of differences in time taken with animationAlthough there was no correlation between pupils test scores and time spent working with the
animation, there were significant differences in the amount of time pupils on average spent
according to the permutation of animation used. This suggests that the kind of processing
occurring with each manipulation may differ. The design of the representation facilitates or
generates different processing strategies or encourages processing of different aspects or
amounts of information. The additive animation was on average used for a longer time than
the substitute animation and both of these were used for longer than the control animation.
Why might this be? There are two possible explanations:
(i) Cognitive effort
The control animation consisted of ‘one’ representation in the sense that it was not
partitioned in any way, and although previous research suggests that information presented in
this way is problematic for comprehensive learning due to increased amounts of perceptual
information and memory overload due to transience, research has also suggested that learners
using animation show a high level of confidence in what they understand (Jones and Scaife
1999) possibly due to the large amount of visual explicitness of the information. The quantity
of information and explicitness inhibits information segregation both of graphical change and
domain parsing leaving the learner with a cognitive task that is primarily perceptual (visually)
rather than requiring learners to invest cognitive effort in ‘working out’ dynamics and
integrating information. The time spent using the animation is therefore minimal. The
substitute animation consisted of six parsed sections of the animation. In essence, then, these
learners had six representations to view, followed by a whole representation, rather than the
‘one’ in the control condition. It is therefore, reasonable that more time is taken using this
kind of presentation. The additive animation consisted of not only separated parts, but also a

gradual increase in display of information, thus, requiring the learner not only to process
information from each parsed section, but to explicitly link it to the previous information
already present. This gives the learner a further task in processing the information than with
the substitute animation. This may explain why those using the additive animation on average
spent more time than the other experimental groups.
(ii) Expertise
An alternative, equally valid, explanation is that pupils participating in this experiment had
completed the part of the curriculum covering this topic for their current school year. This
meant that using the animation was to some degree a revision process. This may have
enabled those using the control animation to process the animation without cited complexities
of the representational format, and therefore with more ease and rapidity.
6. Implications for learning and design
These results suggest that although parsing the animation into smaller components may be
beneficial in reintegrating information, it is not the only important aspect in facilitating
integration of information. Relevant links between these pieces of information also need to
made, and it is evident that to facilitate integration these links need to be made explicit within
the representation. The substitute animation had parsed sections that were segregated such
that they became almost equivalent to multiple representations and links were not apparent.
By making the links explicit in the representation the learner is not having to integrate
separate multiple representations. Designers must therefore be wary of reducing memory or
cognitive overload by breaking down the large amount of perceptual information into more
manageable sections, unless explicit information links are displayed.
8.5. Conclusion
One property of animation thought to contribute to problematic learning from this kind of
representation, is its large amount of perceptually available information. However, this study
suggests that it is not necessarily the amount of perceptually available information per se that
causes learning to be problematic, but the effect of this on hindering focus of learner
attention. If attention focus is facilitated and guided then the consequences of the amount of
perceptually available information may be counterbalanced in terms of detrimental effects on
learning.

However, although focusing attention appears to minimize problems associated with large
amounts of perceptually available information, it results in information being segregated into
smaller parts. This means that information must not only be relevantly segregated, but also
coherently integrated. This study suggests that in order to achieve or support this, making
links explicit is important. This was further supported by evidence of difficulties in
perceiving links between highlighted and masked sections of the animation. Thus, learner
attention or awareness to relevant links may be significantly affected by the explicitness of
those links.
Aspects of the representation that are ‘hidden’ and inevitably less discernable, for example,
one object running behind another causing some obscurity, may also hinder a fuller
understanding, as does the difficulty in identifying and operationalising processes that are
‘hidden’ (peripheral) but critical to a higher level understanding of the system. These areas
could benefit from further investigation. This difficulty in relating peripheral processes to the
functionality of the system or process being displayed emphasises a particular place where
learners are not always able to make important links between pieces of information.
In summary then, the parsability of the representation is important in relevantly segregating
important features of the process, and in reducing complexity through large amounts of
visually available information through focusing learner attention, but the linkablity of
relevant aspects of the representation is also critical to comprehensive understanding.
Understanding is more problematic when those links are not made explicit in the
representation.
Chapter 9
General Discussion
9.1. Introduction
9.1.1. Summary of problem space
It can be seen from the literature review on research into the effectiveness of animation, that
although many studies have been undertaken in this domain of research, the emphasis has
been more on the particular domain or subject population being studied, or focusing on
particular variables relevant to animation (e.g. Mayer and Anderson 1991, 1992, Lowe 1994).
Although the studies give some valuable information regarding the effectiveness or not of
using animation, the theoretical grounding for the research has been mixed, creating results
that are difficult to integrate both in terms of cognition and design. However, some
researchers have identified the need to analyse properties of representations in terms of their
cognitive benefits and disadvantages (e.g. Scaife and Rogers 1996, Green 1989). Thus,
research into animated diagrams needs to focus more on the cognitive benefits and
disadvantages of the representation, in the context of particular properties or features of the
representation.
9.1.2. Summary of aims of studies
This thesis, therefore, set out to investigate ways in which animation could be investigated
that would begin to uncover the cognitive effects of animation generally, with the ultimate
aim being to identify cognitive components of a processing model of animation. To do this
the research was conducted by identifying (i) particular features of the representational
format as a basis for investigating the potential cognitive effects, and (ii) a proposed learning
model that would also serve to guide the investigations. The representational properties and
their potential cognitive effects were termed Cognitive Dimensions of Animated

Representations (CDAR) as they are conceptually similar to Green’s (1989) cognitive
dimensions of notation, in that they have some relevance to representation (in this case
animation) being cognitively beneficial or hindering. The ‘dimensions’ identified for the
research here were primarily related to the explicit depiction of dynamics and the consequent
representational effects. The preliminary CDAR selected were multidimensionality, which
referred to the amount of perceptual information simultaneously available; transient media,
which referred to the evanescent quality of the media; and visual dynamic explicitness
through graphical change, which referred to change occurring in different forms, such as
translation and transformation.
9.1.3. Overview of studies
Six studies were undertaken to investigate the above aspects of animated diagrams in a
learning context. Pupils between the ages of twelve and fourteen learning about dynamic
biological processes participated in the studies. The first two studies used comparisons of
learning about a dynamic system from either an animated or a static representation, to explore
potential benefits and disadvantages of learning with animation, and to discover some
properties particular to animation that may affect cognitive processing with this kind of
representation. The first study also looked at the effects of structuring versus not structuring
information while learning with diagrams. Information from these studies provided a basis
for the rationale of the design of subsequent studies investigating more specifically the
cognitive interaction with animated diagrams. Studies three and four investigated the effect of
graphical change on understanding animation, by assessing pupils’ identification and
interpretation of different kinds of graphical change occurring in two animations that differed
in terms of their multidimensionality. Study 3 was a case study, primarily involving the use
of verbal protocols to begin to describe components of a processing model of animation in
terms of understanding graphical change. This was followed by an experimental study which
looked for progressions in pupil understanding of graphical change over different exposure
times to the animations. In this study assessment was based on comparisons of post test
scores between exposures to animation, which targeted primarily the identification and
interpretation of graphical changes taking place in each animation. Studies five and six
investigated integration of information from an animated diagram by exploring the cognitive
effects of parsing a diagram in two different ways. Study 5 was another case study focusing
on verbal protocol data to provide descriptive information of processing in the context of
making links between different sections of information. Study 6 provided experimental
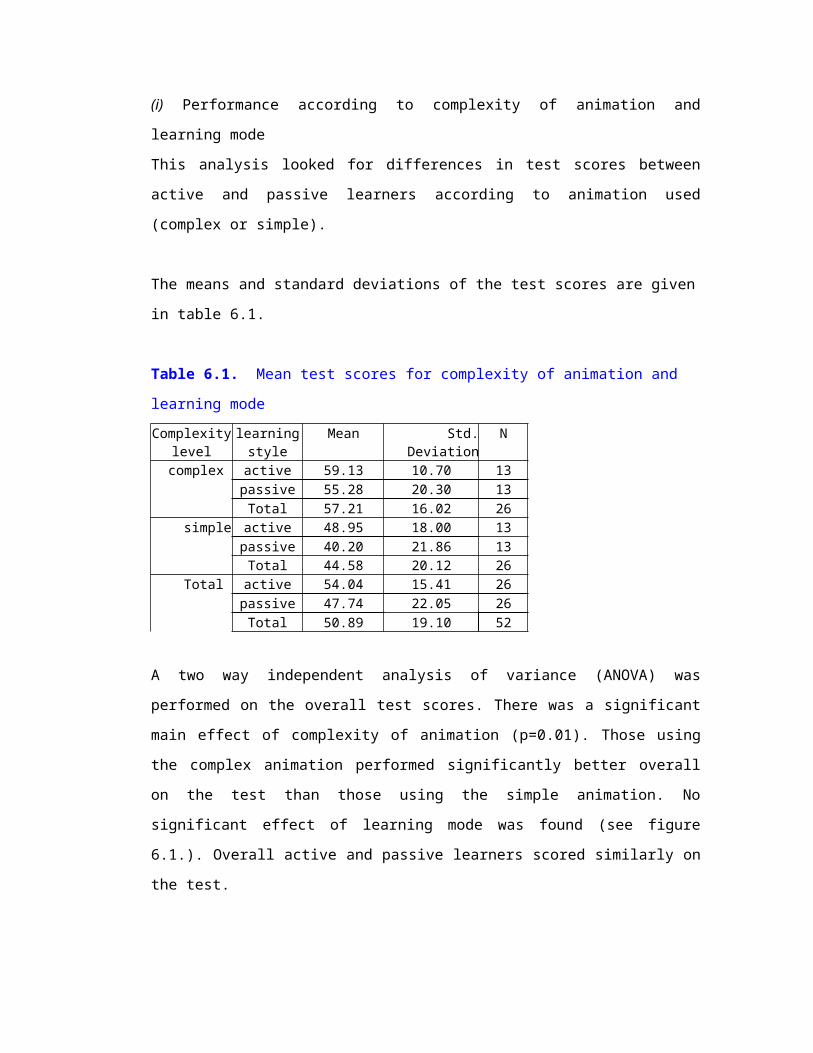
evidence of integrating information by comparing cognitive integration using the two
differently parsed animations and a control animation. Assessment in this study focused on
making links between separate sections of information and enabled analyses of;
understanding according to animation design (parsed manipulations), learning gains between
pre and post tests; and continued learning benefits from delayed post tests. Collectively these
studies provided information about processing of graphical change in terms of identification
and interpretation of dynamics, and the effectiveness of animation in facilitating integration
of dynamic information.
9.1.4. Structure of general discussion
This chapter discusses the findings from all of these studies in relation to particular aspects of
cognition when interacting with animated diagrams (salience, interpretation and integration
of graphical change and domain relevant information), as well as the effect of particular
identified representational properties and learner properties on cognitive processing
(multidimensionality, transience, prior knowledge). Further issues specifically relating to this
research will also be discussed (defining complexity, self explanation effects, multiple
representation effects). The discussion will then place the findings within the cognitive
dimensions of representation analytical framework, and present initial cognitive components
identified for a cognitive processing model of animation.
9.2. Understanding graphical change
Graphical change is a predominant feature of animation. Any dynamic event is displayed
through graphical changes that take place from one frame to the next in an animation.
Research in this thesis in relation to graphical change focused on (i) the salience of changes
taking place, i.e. the degree to which changes were noticed and identified, and (ii) the
interpretation of those changes in relation to the diagram domain, i.e. the meaning inferred
from those changes. Two types of graphical change were initially identified for the purposes
of this research; translation, which refers to movement of an object or entity from one
location to another, and transformation, which refers to change in form e.g. size, shape,
colour (Lowe 1994). However, another form of graphical change, relevant to understanding,
emerged from the research; feature presence, which refers to the appearance or disappearance
of an object or entity during the animated display. In order to understand the dynamics
depicted on an animation each graphical change needs to be distinguished from another,

noticed and identified (salience), and then interpreted (interpretation) in relation to the
diagram as a whole. The cognitive effects of the different graphical changes are discussed
below in relation to their salience and their interpretability.
9.2.1. Salience of graphical change
Salience may be divided into two parts, noticing a change and accurate identification of the
change. This distinction is important as a change may be noticed, but not necessarily
accurately identified. As identification is related to interpretation, the accuracy of
identification ultimately affects understanding.
The results from study 3 exploring understanding of graphical change suggested that
translation change was initially noticed far more readily than transformation change, whereas
study 4 suggested that in the early stages of viewing an animation identification of change
was primarily transformational (for example, identifying changes of dots from blue to red and
red to blue on the heart animation), and although translation change was distinguished,
accurate identification was poor. Together these results suggest that translation change may
attract the attention of the viewer, so is noticed, but that identifying that change is more
complex. Identifying translation change accurately requires the learner to identify the start of
the translation, the end of the translation and all of the steps of the pathway between. This
may be cognitively demanding as it requires continuous tracking from start to finish, which
may be further complicated by potential interruptions from other graphical changes taking
place which attract attention, and by integrating the unfolding event across several frames.
However, the cognitive demands for identifying transformation may be equally complex in
animations where the transformation takes place over several frames. Further research would
clarify whether the cognitive demands are a result of temporal aspects of the representation or
locational differences involved in the change.
Overall, study 4 (looking at processing across different exposures to animation) suggested
that dynamic change was increasingly noticed and identified with increased viewing of the
animation. This suggests some evidence that, in relation to salience of graphical change, the
cognitive effects of dynamic information load (through multidimensionality) and memory
load (through transience) may be counterbalanced by animations that are looped and
therefore allow reaccess, at some level, to dynamic information. However, it is unclear from
the research here whether all graphical changes need to be identified for comprehensive

understanding, nor the level to which looping promotes reaccess. For example, results from
study 4 suggest that the rate at which learners continue to notice and identify new changes
reduces after only a few loops of animation have been viewed, despite the fact that many
graphical changes were left unidentified.
Feature presence was overall problematic to notice and therefore also to identify. Unless
highlighted it is unlikely that an appearance or disappearance of a graphical feature will be
prominent, especially within a representation that already has simultaneous depiction of other
dynamic events. In this thesis the animation where feature presence occurred consisted of
some potentially dynamic information being depicted in static format, which necessitated the
use of ‘feature presence’ graphical change. This usage could have been avoided if all
dynamic information had been displayed dynamically. This may confirm the cognitive
importance that animation displays all fields simultaneously (Stenning 1998). If it is a criteria
for a particular animation that a dynamic event is depicted using feature presence, then it may
be important to highlight this event, for example with an accompanying sound. The cognitive
effect of using sound or verbal narration together with animation was not explored in this
thesis, although the benefits of concurrent verbal narration have been continually shown in
previous research (e.g. Mayer and Anderson 1991, 1992).
In summary, noticing graphical change and the accuracy of identifying that graphical change
may be a function of the type of graphical change itself. It can be seen, therefore, that the
distinction between noticing and identifying change is important. Noticing that a translation
is occurring is one thing but identifying it accurately is another, and accurate identification is
central to coherent interpretation. Whether graphical change is identified as translation or
transformation will significantly affect the meaning placed on the event (see 9.2.2.).
9.2.2. Interpreting graphical change
Interpreting graphical change is an important step in both understanding and making
inferences from an animated diagram. Accurate interpretation is necessary for coherent
understanding. Research from studies in this thesis suggests several things relating to
interpretation of graphical change.
(i) There is evidence that interpretation is dependent on the kind of change that is identified
as taking place. Whether an event is perceived as translation or transformation will

significantly affect the meaning placed on the change. For example, in the respiration
animation, carbon dioxide is shown (as a blue circle) moving from the blood cell in the
capillary into the alveolar sac, and oxygen is shown (as a red circle) moving from the alveolar
sac to the capillary and entering the blood cell. This change was sometimes perceived by
pupils as a transformation (the blue circle changing to a red circle in the blood cell), with the
resultant interpretation being that carbon dioxide was changed into oxygen. These kinds of
misinterpretations may significantly affect the understanding of the processes taking place on
an animation.
(ii) The type of graphical change also affects the processing demands needed to understand
the change. For example, the meaning of a translation change is integral to the dynamics,
whereas a transformational change requires noting the change and then placing meaning on
the change. However, each type of change also has certain cognitive disadvantages. Although
meaning may be seen as integral to the dynamics in translation change (i.e. this object or
feature moves from here to here), the reason for or the function of the movement is not
necessarily explicit, and accurate interpretation of the pathway requires continuous
concentrated visual tracking. When an animation is displaying large amounts of dynamic
information pupil attention may easily be distracted by other dynamic events. Transformation
requires understanding the current representation (e.g. red dot representing oxygenated
blood), identifying the change (change in colour from red to blue), understanding the new
representation of the feature identified (blue dot representing deoxygenated blood), and
making an inference about the represented event that has taken place. Processing
transformation therefore requires more distinct steps, but a transformation that unfolds slowly
across several frames will have the added cognitive steps required for processing translation
change.
(iii) Study 3 showed a high level of errors in interpreting graphical change suggesting that
making interpretations at an early stage of processing or viewing the animation may be
problematic. However, identification and interpretation may be integral to one another,
precluding this cognitive progression from taking place later. Looking more closely at this
issue, identification and interpretation appear more integral to translation than
transformational change. In fact the results from study 4 suggest that accurate interpretation
of transformational change increased with exposure to animation, whereas interpretation of
translation change remained poor. As translation change occurred (in thee animation used

here) over several frames, the transient nature of animation may have contributed to this, in
that information is lost between viewing the start and end of the translation movement.
Confusion of translation change was more evident in the heart animation (where there was a
higher level of dynamic information) than the respiration animation, which suggests that
difficulty in fully identifying or of interpreting translation may be exacerbated by the
multidimensionality of the representation, rather than the graphical change per se.
Interpretation of graphical change is dependent on the type of graphical change in
combination with the dynamic information load. This emphasises the cognitive demands on a
multidimensional animation in both accurately and fully tracking translation change, as
inaccurate identification of movement will result in false interpretation.
9.2.3. Summary of graphical change
From the studies presented here, there is evidence to suggest that more graphical changes are
noticed and identified than are interpreted in the initial stages of viewing an animation. This
suggests that the morphological aspects of graphical change are processed prior to the
semantic aspects. However, the kind of graphical change itself appears to be instrumental in
the accuracy of both identification and interpretation of the change in relation to the diagram,
the accuracy also being influenced by the transience of the representation and the level of
dynamic information load.
9.2.4. Implications for design
Designers need to be aware of the different kinds of change and the potential effects on
interpretation. The clarity of the kind of change occurring is imperative to the kinds of
meanings and inferences that may be made. Feature presence should be used with caution,
and if deemed necessary may require highlighting in order to attract awareness to this
change.
9.3. Integrating information from animation
9.3.1. Relevant review of current studies
Previous research has shown evidence of incremental reasoning during the learning process
(e.g. Hegarty 1992, Naryanan and Hegarty 2000), and of the beneficial effects of parsing

animation (e.g. Kaiser et. al. 1992). Studies one to four of this thesis also showed evidence of
and highlighted the importance of parsing and sequencing information. Study 1 showed that
understanding animation was significantly affected by task presentation where structured
learning resulted in improved pupil performance. Study 2 showed evidence of patterns of
attention focus, indicating that intuitive parsing of gross dynamics may take place. Studies
three and four showed that parsing of the dynamics themselves takes place and the
importance of this process in understanding graphical change. The value then of parsing and
sequencing information was acknowledged and used as a basis for further research in
understanding processing of animation in this thesis. To explore integration of information
from animated diagrams, parsing at a domain level (see 3.3.1.) was considered appropriate
for enabling investigation of the kinds of links made (or not) between different sections of
information. Thus, studies five and six used animations that were pre-parsed in two different
ways in order to investigate the effectiveness of this kind of manipulation and the kinds of
links pupils made to integrate information from the animation. The animations were parsed
into six sections. An ‘additive’ animation showed an increasing number of sections of the
diagram until all of the diagram was displayed. A ‘substitutive’ animation showed only one
parsed section at a time, until each section had been displayed.
9.3.2. Research findings
The results of these studies showed several relevant factors relating to cognition and the
representational format of animation. The studies showed evidence of improved
understanding of blood flow pathways and ability to make appropriate links between
information sections on the diagram. In both the exploratory and experimental studies, these
factors were most prominent in those using the additive animation, which was more
beneficial in terms of making links between the sections of the diagram and in understanding
blood flow pathways. There are several possible explanations for these results;
(i) Each section that was displayed on the additive animation remained as another section was
displayed, making the links from one section to the next more explicit than on the substitutive
animation. The design of the substitutive animation meant that each section was displayed
separately, such that no links between each were apparent. Providing explicit links between
sections of information may facilitate integration of information. Here there is an example of
explicitness being cognitively beneficial, where the explicitness is in terms of guiding
learners to pertinent aspects of the representation in a coherent order.
(ii) The additive animation also appeared to facilitate interpretation of blood flow pathways.
This design may also have resulted in more explicit depiction of blood flow (as well as links)
as each translation section of flow was shown gradually assisting incremental understanding.
Each translation section was also broken into smaller components, which may have been
beneficial in terms of focusing attention and fully tracking translation changes, thus,
facilitating interpretation of this kind of change.
(iii) As the animations were continuously looped, pupils were able to reaccess the smaller
parts of information in the display. Because attention was focused on one particular section
of the diagram reaccess may be more cognitively successful than reaccessing information on
a looped full animation, where focusing attention on a multidimensional representation may
hinder the accessibility of a particular piece of information.
The substitutive animation also had some of these attributes, for example, smaller sections of
information, facility to reaccess information, so why did pupils perform poorly when using
this particular animation? The display of each section separately resulted in the highlighted
sections being multiple representations, requiring pupils to integrate information from one
representation to another without explicit links. This not only adds to memory load (having to
remember information no longer clearly visible) but also the lack of explicit links makes
integration difficult (Narayanan and Hegarty 2000). The highlighted sections of the
animation serve to draw attention, which although facilitating focus of attention may
simultaneously reduce learner awareness of the importance of the non-highlighted sections in
relation to the current section displayed.
9.3.3. Summary
In summary, although explicitly segregating information may reduce the multidimensionality
of the animation, thus facilitating attention focus and reaccess to smaller amounts of
information, the explicit depiction of links between sections is of fundamental importance in
facilitating understanding of the representation as a whole, and indeed appears to also
facilitate interpretation of translation change. Parsability of the representation may be
cognitively beneficial, but in conjunction with linkability of the representational components.
9.3.4. Implications for design

The findings here suggest that inherent features of animation that may result in complexity,
such as, dynamic information load and transience, may be counterbalanced to some degree by
breaking down the information display into smaller components. This reduces the dynamic
information load and facilitates reaccess (in looped animations), as well as focusing attention
relevantly. However, if the animation is parsed in this way, then explicit coherent links
between each section must be incorporated, to enable learners to build appropriate models of
the system or process depicted. Therefore, not only is it important that the representation be
‘parsable’, but also ‘linkable’ (facilitated links to be made between relevant parsed sections
of information).
9.4. The effect of multidimensionality
9.4.1. Multidimensionality in this thesis
Multidimensionality of the representation in this thesis referred to the amount of dynamics
displayed simultaneously on the diagram. Unidimensional animation would display only one
item or ‘dimension’ of movement at any one time. More than one simultaneously displayed
dynamic item renders the animation multidimensional, but the degree of dimensionality of
dynamics will inevitably vary from one domain to another, and even within one animated
representation. The level of multidimensionality may be determined by the following; (i) the
particular domain being displayed will have some bearing on the amount and type of
dynamics that are displayed, and (ii) the level of expressiveness of the representation (the
need to display all aspects of a process simultaneously).
9.4.2. Research findings
Study 1 generally showed that explicit depiction of dynamics resulted in confused
understanding of flow systems by pupils. One explanation for this could be that animation
can result in dynamic information overload, resulting in a confusing presentation of
information. On the other hand, it could be argued that the particular design of the depiction
of movement used in this study contributed to confused understanding of dynamics.
However, further studies with modified animation design also demonstrated that a clear
understanding of the flow system was still problematic (e.g. studies three and four).
Therefore, it is more likely that clear comprehension of this kind of information may be due
something other than the diagram design per se. Dynamic information load (and transience –

see below 9.5.) could contribute to this problem, although research on reading graphical
change identified possible reasons for problematic interpretation of flow pathways, in that
they are represented by translation changes. However, this difficulty may be exacerbated by
dynamic information load, in that the resultant increase in displayed dynamics, although
more explicit in terms of information, (i) increases the number of translations to focus on, and
(ii) increases the potential level of distraction for the learner, making it more difficult for the
learner to focus on any one aspect enabling them to distinguish all dynamic changes
occurring, or even know which movement to focus on, when. For example, in study 1 pupils
remarked that there was too much movement, too fast.
9.4.3. Potential counterbalancing effects
However, the research in this thesis also suggests evidence of factors which may serve to
counterbalance the cognitive effects of multidimensionality of the representation, such as
parsing and prior knowledge.
(i) Parsing (also see 9.3.). Results from study 5 suggest confirming evidence of the
importance of appropriately focusing attention. Here pupils used an additive or substitutive
pre-parsed animation, which showed particular selected areas of the animated diagram at
different times, therefore directing and facilitating attention focus. Yet those using the
additive parsed diagram performed similarly in relation to those using the substitute parsed
animation, despite the fact that the additive parsed animation had increasingly more
simultaneous depicted dynamics than the substitute parsed animation. This suggests that it is
reduction of attention focus that may be cognitively detrimental rather than just the amount of
perceptually available information being displayed on an animation. Thus animated diagrams
can be expressive if pupils are guided in focusing their attention to relevant aspects.
(ii) Prior knowledge. Studies three and four showed that pupils with some prior domain
knowledge benefited from using animation more than those without. This may have enabled
pupils to focus their attention on pertinent aspects of the representation driven by their
internal knowledge, thus lessening the potentially detrimental effect of multidimensionality.
9.4.4. Summary
In summary, animation may result in a multidimensional representation increasing the
dynamic information load for the learner /user. This can reduce the degree to which pupils
are able to focus their attention accurately or appropriately on the dynamics of the diagram,
making comprehension harder. However, if attention is focused this cognitively detrimental

effect may be lessened. Focus of attention may be facilitated, for example, through
particular diagram design, system guidance of pupils learning, differing levels of prior
knowledge.
9.4.5. Implications
When using animation to depict dynamic processes or systems, the interaction of
multidimensionality and focus of attention in relation to animation is an important issue for
designers, teachers and when guiding learner interaction with such representational formats.
9.5. The effect of transience
The form of animation, depicting change through a series of frames, can be described as a
transient media rather than a persistent media, in that information is temporary and passes by
with the progression of the animation. Although animated diagrams may be looped to show
the same set of frames again, the information display remains transient. This means that any
dynamic sequences or changes have to be remembered to be integrated with new information.
The cognitive effect of this is to increase memory load. The increase in perceptually available
information through the level of multidimensionality of the animation will further exacerbate
memory load because of the transience of the representation. Straight play-through animation
also means that learners cannot reaccess information that has already passed by.
9.5.1. Research findings
The transience of the representation may have contributed to the problems pupils had in
accurately identifying graphical change, and specifically the full translation changes that
were displayed, such as, blood flow pathways. The problem of the transient nature of
animation is apparent, in that information is lost between viewing the start and end of the
translation movement. In the animations used here translation changes generally spanned
more frames than transformational changes. This means that not only are learners required to
track specific changes for longer, but are having to simultaneously track and remember the
pathway of the object or entity from previous frames. Were transformational changes to span
several frames the same problem may become apparent. Thus, the effects of transience on
accurately noticing and identifying graphical change may be to make it more problematic.
Study 6, which used parsed animations, suggested that understanding of graphical change
was improved over studies three and four. This may have been due to having smaller

components of information displayed, thus reducing the amount of information needing to be
held in memory, and also to the cyclical looping of the animation, combined with the
reduction of perceptual information, enabling reaccess to aspects that needed to be attended
to again.
9.5.2. Summary
The form of animation depicting changes over time results in a transient representation of
information. This demands that learners hold in memory parts of the animation that have
already passed by in order to integrate them with the current and future display. This may
increase both memory demands (remembering each change) and cognitive demands (having
to integrate changes as more changes are unfolding), making processing of animation
complex. Although, some of these problems may be reduced by parsing or breaking down an
animation into smaller relevant components of information, provided that links between
pieces of information are made explicit, the degree to which transience of the representation
affects cognition and contributes to memory load, may also be a function of the frame rate
and the frame quantity with which the animation is displayed.
9.5.3. Implications
The design of the particular animation needs to balanced in terms of the potential loss of
information between the start and end of either each graphical change or the entire animation
itself, and facilitating accurate processing of change by guiding attention, for example,
through parsing the animation. However, further research exploring in more detail alternative
ways of guiding learning or directing attention, as well as exploring the effect of frame
quantity and rate in relation to transience and cognitive processing of animation would be
informative.
9.6. Potential effects of prior knowledge
Although this thesis did not set out to specifically measure or compare the effects of level of
prior knowledge on reading animation, the circumstances of data collection meant that the
potential interaction between level of prior knowledge and performance using animation
warrants some consideration. As no specific measurements were taken, the assessment of
higher or lower prior knowledge was merely estimated on the basis that teaching about one
topic used in this thesis was concurrent with and prior to data collection, whilst the other was

not. This meant that not only was it likely that pupils had more domain knowledge for one
animation than for the other, but that knowledge was recent and relevant to the experimental
domain used in this research.
Overall the findings suggest that those with recent relevant teaching performed better on test
scores on understanding graphical change than those that did not. Study 3 and study 4 in the
minimum and intermediate exposure to animation showed that those using the heart
animation (higher prior knowledge) performed significantly better than those using the
respiration animation (lower prior knowledge). More specifically these studies showed that
those with higher prior knowledge performed better on interpreting graphical change and on
conceptual questions. This particular progression may suggest that salience and interpreting
graphical change occurs sooner for those with higher prior knowledge, but that those with
lower prior knowledge are not precluded from achieving a similar level of understanding, if
exposure to the animation is sufficient. Those with higher prior knowledge reached a similar
level of processing the salient features of the animation after an intermediate number of runs,
and of processing interpretation after the maximum number of runs. This suggests that
processing of salience of graphical change occurs prior to interpretation of the change. Study
6 showed that pupils using a non-parsed animation (information not in smaller sections, no
guidance to focus of attention, more dynamic information load) performed similarly to those
using an additive parsed animation when integrating information from the animation. This
facilitation in understanding from the control animation may also be explained by level of
prior domain knowledge.
Research has shown that differences are apparent in the way that experts and novices use
external representations, for example, in the way they perceive and understand information,
particularly in terms of meaningful chunking of information (e.g. De Groot 1965, Hinsle et
al. 1977, Egan and Schwartz 1979, Ehrlich and Soloway 1984) and in their level of
dependence on domain relevant information rather than visuo-spatial features of the diagram
(Lowe 1994). The level of prior knowledge may have enabled pupils to focus on domain
relevant information rather than visuo-spatial aspects of the representation, facilitating
interpretation of graphical change. The parsed animations in study 6 also directed pupils to
domain relevant chunking of information. A higher prior domain knowledge may have
enabled pupils to achieve similar chunking themselves when using the non-parsed animation.

However, although level of prior knowledge may have had some effect on interaction with
the animations, the pupils had not reached a level where they could reasonably be termed
‘experts’, thus, the information gained from these participants was not considered to
compromise the findings in relation understanding the cognitive basis for using animation. In
fact despite potential differences in level of prior knowledge, pupils showed similar cognitive
progressions in terms of understanding graphical change and making links from animated
representations. Aspects that seem more pertinent in facilitating processing using animation
are the proposed cognitive dimensions of the representation presented and discussed in 9.9.
9.7. Other research findings
9.7.1. Training / expertise
No assessment was made in this thesis of the amount of expertise or interaction pupils had
working with animation and /or animated diagrams generally. Previous research has cited the
possible need for training in processing graphics (e.g. Peek 1993, cited Betrnacourt &
Tversky 2000). Therefore, difficulties of noticing and identifying the dynamics on this kind
of representation may be partly a function of familiarity or expertise in terms of reading this
kind of representational format. Limited expertise with animated representational format may
hamper processing aspects such as tracking moving items, interpreting graphical change.
Inexperience and, therefore, unawareness of the required processing may lead to less
cognitive attention and effort being applied to these kinds of tasks. Research using differing
levels of training with animated representations may inform further about the relevance of
animation ‘reading expertise’ in learning contexts. For example, pupils could participate in
clearly guided instruction when using an animation, including such aspects as tracking
translation change, practising interpreting different kinds of graphical change and relating
these to the diagram as a whole, prior to participating in learning with alternative domain
animations.
9.7.2. Self explanation effects
Although self explanation was not used specifically as a tool for eliciting cognitive
processing or for assessing learning in this thesis, it is interesting to note that verbal
explanation, be it specifically ‘self explanation’ or ‘to another’ explanation, appears to have
some effect on pupil understanding. More specifically verbal explanation appears to facilitate
awareness and understanding of functional aspects of the process that is less apparent in
learners who did not externally verbalise their processing. Chi (1997) suggests that
explaining brings awareness to the learner of discrepancies in their understanding, which
prompts them to revise their understanding more appropriately. It would be interesting in
further research to explore the effects of externalising through different kinds of physical
interaction with animation, perhaps exploring different outcomes as a result of manipulating
the diagram (also see 9.10).
9.7.3. Multiple representations
Although definitions of multiple representation differ, in this research multiple
representations refer to the equivalent of multiple diagrams of the same domain, such that
each frame constitutes one representation. Consequently, an animation consists of multiple
representations to depict the different dynamic changes being depicted. Therefore, learners
are having to integrate information from several diagrams or representations rather than one
single diagram. Not only do they need to integrate across several representations, but they
also need to remember the information to integrate as each representation is not concurrently
available with another, and comparisons of differences cannot be made. The studies using the
parsed animations took this issue into account and the animations were designed in such a
way that any parsed sections not yet clearly visible were merely masked, allowing the rest of
the animation to be discernible. This design should have facilitated the making of links
between pieces of information displayed in differing explicitness on the diagram. However,
it was apparent from the results that these kinds of links were not necessarily made, unless
there was visual explicit depiction of appropriately ‘linked’ components. This suggests that
integration of information across different frames may not in itself be problematic, as
integration of information appears to take place on different levels. Integration of information
across animation frames is taking place on one level when particular graphical changes are
identified and understood. Studies three and four showed evidence of this kind of integration.
Integration of information takes place on another level when ‘parsed’ or ‘chunked’ pieces of
the diagram are linked. These two aspects of information integration begin to inform a little
about understanding cognitive processing of animation.

9.8. The issue of defining complexity.
Overall the research in this thesis suggests that complexity as defined prior to these
experiments is not sufficient. Although multidimensionality and transience may remain
features of animation that contribute to a complex representation and impede cognitive
processing, in terms of dynamic information overload and memory load, they are not the only
dimensions of complexity to be taken into account when processing animated diagrams or
indeed any diagram.
The form of graphical change itself may be cognitively complex, in that each type of
graphical change demands different kinds of processing. For example, translation change
requires consistent tracking over time, transformational change requires mapping of meaning
of, for example, colour changes or changes in size onto real world events, feature presence
demands noticing whether or not a particular item is present at any one time. The cognitive
demands of understanding graphical change may be further enhanced by the level of dynamic
information load (multidimensionality of the particular animated representation), which may
prematurely distract attention, and transience, which may facilitate potential attention
distraction.
Complexity may also be defined in terms of expertise, referring to both prior knowledge and
experience with the representational format. The knowledge or perception already present
cognitively influences the way the external representation is perceived and interpreted. The
level or even type (general or domain specific) of ‘internal’ cognitive resources available to
pupils when interacting with the external representation, may serve to reduce the effect of the
complexity of animated diagrams in various ways, for example, helping to direct attention to
relevant aspects of the diagram, aiding accurate interpretation. However, it may also be the
case that inaccurate prior knowledge results in misidentification of graphical change and
misinterpretation. This emphasises the importance of clarity of the representation in terms of
cognitive dimensions of the representation as defined below (see 9.9).
Expertise with animated diagrammatic format may also serve to reduce some of the cognitive
complexities inherent in animation. Practice or training with reading this kind of
representation may facilitate focus of attention, aiding differentiation, identification and
interpretation of graphical changes, direction to relevant aspects, making links between
different pieces of information.

9.8.1. Summary
Although potential cognitive complexities from inherent features of animation are apparent,
there may also be factors that serve to counterbalance these effects facilitating benefits from
the advantages of explicit dynamic depiction in learning about dynamic processes, such as
parsing animation, directing learner attention, providing explicit information links.
9.9. Cognitive dimensions of representation
Cognitive dimensions of representation were described in chapter three as properties specific
to animated representations that affect the way that information is processed. This term was
adopted for this thesis from Green’s (1989) cognitive dimensions of notation on the basis that
it provided an appropriate conceptual framework from which to explore the cognitive
benefits and disadvantages of animation. The findings from the studies in this thesis point to
certain features that could be termed cognitive dimensions of the representation, that are not
only features related to the representation itself, but also features related to cognition (where
the features of the representation interrelate with relevant cognitive features).
Proposed cognitive dimensions of representation:
(i) Visibility; which refers to the degree to which the representation facilitates noticing of all
graphical changes (translation, transformation, feature presence).
(ii) Identifiability; which refers to the degree to which the representation enables
differentiation between types of graphical change, i.e. facilitates the distinction between
translation, transformation and feature presence.
(iii) Trackability; which refers to the degree to which the representation facilitates tracking of
changes over time.
(iv) Interpretability; refers to the degree to which the representation facilitates the placing of
appropriate meaning on graphical changes.
(v) Parsability; refers to the degree to which the representation facilitates segregation of
information into smaller coherent components, be they a dynamic change, or a domain
relevant section of the diagram.
(vi) Linkability; refers to the degree to which the representation makes explicit the links
between appropriate sections of information.

These dimensions have been identified as important dimensions of animation for learner
interaction, but several (if not all) will, no doubt, be determined by other factors, such as; the
dimensionality or the amount of simultaneous graphical changes taking place contributing to
dynamic information load; the transience of the representation in terms of the speed at which
graphical changes unfold and pass by, contributing to memory load; and the degree to which
the representation facilitates focus of attention.
9.10. Cognitive model of processing animation (see fig. 9.1.)
In summary of the findings from this research on processing animation, the cognitive
demands may differ according to the level of dynamic information load, transience and the
explicitness of graphical changes, smaller domain divisions and links between these
information sections. Noticing, identifying and interpreting graphical change appear to have
different cognitive demands according to the type of graphical change. For example,
identifying transformational change seems less cognitively demanding than translation
change, whereas interpreting transformational change seems more cognitively demanding
than translation change. Smaller domain divisions within the representation may be
cognitively beneficial not only for making interpretations of graphical changes but also for
making links between different pieces of information, if those links are made explicit. On the
basis of findings in this thesis the following stages in processing animated diagrams of
dynamic processes are proposed:
9.10.1. Visibility demands
a) Parsing of dynamic change.
The processing of graphical change consists not only of noticing dynamic changes taking
place on the diagram, but also the identifying of the kinds of graphical changes taking place.
(i) Noticing graphical change basically refers to an awareness of the learner that a dynamic
change or event has taken place. This is a general observation about each change that is no
more specific than knowing it has happened. However, the likelihood of the change being
noticed may be a function of (amongst other things) the type of change. Detailed noticing of
graphical changes may be affected by the dynamic information load within the animation (the
more changes occurring the more difficult it is to notice accurately) and by the transient
nature of the representation, which potentially contributes to loss of information from the
start to the end of a change.
(ii) Identifying graphical change refers to distinguishing the particular type of graphical
change (transformation, translation or feature presence) as this is essential for accurate
interpretation of the representation. Accurate identification may also be affected by
transience and dynamic information load.
b) Parsing domain sections
Processing animated information comprises collecting information from smaller domain
relevant sections of the diagram, which includes integration of both animated (graphical
Fig. 9.1. Example cognitive model of processing animation
change) and static components of the diagram. Facilitating this process for learners (generally
novices to the domain) will be a function of the diagram design itself (e.g. explicit parsing of
the diagram) or learner guidance provided.
Visibility demands
Noticing graphical change
Identifying graphical change
Interpretative demands
Identifying domain relevant sections
placing meaning on graphical change
Interpreting small domain sections of animation
Integration demands
Iterative process
Making linksdomain sections
Integrating graphical change events with the
Prior knowledge
Prior knowledg
Diagram design

9.10.2. Interpretative demands
Accurate interpretation is necessary for a coherent understanding of the system or process
depicted. The interpretation that is placed on the graphical change is dependent on the type of
change that is perceived and identified, and on the amount of detail of the change that is
observed. For example, understanding may be incomplete if only part of a translation change
is viewed. The research in this thesis suggest that the interpretive demands differ with type of
graphical change. Making interpretation of transformation changes requires identification of
the change (e.g. change in colour, change in size, change in shape) and placing some coherent
meaning on the change depicted, recognising the meanings between the differing states,
whereas the meaning of translation change is integral to the dynamics themselves.
9.10.3. Assimilation demands
Assimilating information and/or making links incorporates the linking of information across
smaller relevant domain sections of the diagram, as well as linking the dynamic events with
the static features of the representation, and is important to building a coherent model of the
process being depicted. Research here suggests that integration of information may be
facilitated by provision of explicit links within the representation.
Above several particular stages that the learner might go through to process animated
information have been proposed, but these stages are unlikely to be as distinct as the proposal
of stages appears to indicate. It is likely that much more parallel processing is going on, such
that a graphical change is noticed and interpreted at a similar time and possibly integrated
into previous knowledge or another piece of information from the diagram. It is likely that a
complete model is built in this way rather than in distinct separate stages of noticing,
identifying, interpreting, parsing, and making links. Evidence from the studies in this thesis
support this since not all dynamics were noticed or interpreted, but some understanding and
integration still occurred (cf Beaugrande 1987). The model also includes proposed effects of
other variables according to findings in studies in this research. These variables are shown in
a different colour (violet) and surrounded by a dashed box. Although significantly more
research is necessary to confirm, expand and develop any proposed cognitive model of
processing animation, the research in this thesis has made a small step in attempting to
pinpoint more specifically the ways in which learners cognitively interact with animated
representations.
9.11. Generalisation of research
One of the problems cited in chapter two regarding research into the benefits of animation
was the lack of continuity underlying the varying research studies in terms of theoretical
frameworks. This makes generalisation of results and findings outside the individual studies
problematic. This research attempts to use a framework for analysing animation that focused
on representational properties and their cognitive effects. This means that these same
representational properties in other domains are likely to have similar cognitive effects. This
may not apply only to animations of dynamic processes, but could also apply to animations
showing steps in, for example, solving a problem. Suppose that animation was being used to
show the progression of solving a problem this would require learners to understand various
appropriate steps to be taken to reach a conclusion or solution. Although there might be
differences here in terms of whether the learner has to understand a dynamic system or just
learn/understand the steps to solving a problem, there are no differences in terms of the
processing required when using the animated form of a representation. When steps to solving
a problem are depicted using animation the learner is still required to notice and identify
changes in the representation and infer some meaning from the changes in order to
understand how the problem is being solved. Thus, a more abstract analysis of how the
representational properties of animation affect cognition should facilitate generalisation of
findings to other domains using animation.
9.11.1. Implications for cognitive processing model
The cognitive processing model proposed here is merely a beginning in identifying cognitive
components of a model and ways in which these components may be affected by
representational properties and learner properties. This research may serve as a basis on
which to build a more comprehensive picture of cognition with animation through further
analysis using similar frameworks. The use of similar frameworks would facilitate the
integration of findings from other domains or instances where processing animation takes
place.
9.11.2. Implications for designers and teachers
The findings in this thesis point to particular aspects of animation primarily in terms of its
visibility, interpretability, and linkability that are important for the learner. This can inform
designers on particular ways in which this representational format may be designed to
facilitate understanding of dynamics by being aware of the importance of the dynamic

components and movements being ‘cognitively available’ to the learner, the effects of
multidimensional dynamics and transience. It may also inform teachers in similar ways, in
addition to enabling them to be aware of the importance of focusing pupil attention
appropriately in relation to the particular learning task at the time.
9.12. Future research
The studies in this thesis have investigated specific aspects of processing animation, and
therefore covered a limited area within a large problem space. The work has also uncovered
aspects of design and methodology that may have had an impact on some of the conclusions
that may be drawn from the studies, as well as bringing to light areas of research that deserve
further exploration and examination.
9.12.1. Limitations of methods
Exploring cognitive processing of animation is not a straight forward process. Different kinds
of data and study conditions will elicit different kinds of information. Therefore the research
in this thesis has used both qualitative and quantitative data, requiring both descriptive and
experimental methodologies, in an attempt to achieve the most comprehensive information
regarding processing. However, it is also important to work within the environment relevant
to the research, thus studies were carried out in schools willing to participate. Needless to say
this in itself can create drawbacks, such as time limitations for visiting school, time
limitations working with each pupil, uniformity in terms of teaching across the several weeks
needed for data collection, thus resulting in unexpected confounding variables as found in
studies three and four (teaching of one research domain but not the other). Time limitations
also have an impact on the assessments that can be undertaken. Assessments needed to be
tailored to time limitations and therefore may not have been as comprehensive as would be
ideal. Question sets targeted primarily aspects investigated in each study, therefore were not
broad enough to make any comprehensive conclusions about overall conceptual learning
from animation. Another issue may be that the type of assessment may affect the learning
outcomes obtained, as in these studies pupils were having to transfer knowledge learned from
animated representations but elicited through written or static diagram assessment. Although
comparison of diagram versus written in study 6 showed no differences in performance, the
use of animation to elicit knowledge may have produced some different results. Aspects such
as these may be modified in future research samples.
9.12.2. Future directions
As a beginning to describing a cognitive model of processing the research here aimed to
provide a basis for further research that would build a more comprehensive picture of
cognitive processing of animation. However, a few particular areas of future research are
outlined here.
(i) Temporal depiction
One main feature of animation is that depiction of changes through sequences of still images
inevitably depicts an order of events within the representation. Not only does animation mean
that motion is depicted visually more explicitly, but also that the temporal aspects of the
process become overt. Thus, temporal sequences are displayed, not only showing time for
each dynamic event, but also relational temporal aspects. In addition, different tempos can be
used to depict the dynamics and may elicit different kinds of comprehension. Thus, explicit
depiction of any differences in relational rate of change or motion can be displayed. Although
this feature is important in the use of animation it is not specifically addressed in this
research, as several aspects of temporal depiction, such as, understanding of time sequences,
relational timing of events, the effect of different speeds or tempo, including frame quantity
and frame rates, would provide more information for a cognitive model of processing.
(ii) Additional cognitive dimensions
In Green’s (1991) research into cognitive dimensions of notation several dimensions have
been defined and additional dimensions continue to be explored in relation to that research
(e.g. Blackwell et. al. 2001). Some of these may be identified as having similar properties to
potential dimensions of animated representations, as well as new dimensions that may
emerge through further research. Other dimensions may emerge with differing learner tasks,
or learner interactions, particularly if interactivity (physical) was available with the
animation. For example, certain dimensions may facilitate or encourage user control over the
information in terms of choice of order of depiction.
(iii) Interactivity
In the studies used in this research learners had no guidance from the programme to other
associated pieces of information, nor were they able to manipulate anything that happened on

screen. This kind of manipulation level could vary from basic stop/ start, alter speed to
putting in valves, altering the blood flow to see what would happen, or building their own
circulation system (e.g. as interactivity on the cardiac tutor, Woolf and Hall 1995). Different
interactivity levels may have resulted in different understanding. Thus investigation into the
value of different kinds of interaction with the animation for learning and understanding
dynamic processes would be useful. Kirsch (1997) has proposed a “decision model of
interaction”. This model incorporates much more clearly the idea that interaction is an
ongoing dynamic and changing activity that is moulded and defined by the users’ previous
actions, steps and outcomes. In practical terms this means that information be designed in
such a way that affordances are created for the learner giving coherent direction on what
actions to take at particular points in the learning environment, such that somehow salient
pathways of learning or searching or interacting in relation to the learners’ previous actions,
are made evident. In addition Kirsch (1997) proposes additional ways of interacting which he
terms ‘reshaping the cognitive congenialist of the environment’. This means that effective
ways of providing information are implemented that, for example, help the learner to decide
what to do next, or that demonstrate salient links between related concepts by highlighting
those aspects together perhaps through colour or through fading and highlighting related
pertinent areas of the animation. Functionality links may also be identified in this way. This
concept may also tie in with the concept of cognitive dimensions or properties of animated
diagrams, by exploring whether there are cognitive dimensions that could be classed as
‘cognitively congenial’. Are there dimensions that provide effective ways for making
information salient, or helping learners to make appropriate links?
Another dimension of interactivity is that of construction by the learner. Previous research
has shown that interpretation of representational displays may be aided by learners
constructing external representations, as the process of construction forces the learner to be
more aware of their interpretations (e.g. Cox and Brna 1995, Brna 1996). This effect may be
similar to the effect of externalisation that occurs with the self explanation phenomena (Chi
1997). The act of self explanation itself may not be practical within a school system, nor
necessarily in the context of using computers for learning, but it might be interesting to
explore further the ways of gaining similar effects using other cognitive methods, such as
constructing dynamic processes using animation, with facilities to run simulations of the
process from the constructed animation.
(iv)Expertise has been shown to affect processing in problem solving situations and when
using external representations to support learning or understanding (e.g. De Groot 1965,
Lowe 1996, Brna et. al. 1997). Expertise may be in terms of prior knowledge or expertise
with using the particular representational format, both of which will influence the ways in
which learners interact with animated diagrams. It would therefore be interesting to explore
ways in which these variables affect the processing of animated information as found in these
studies, showing in what ways each aspect influences cognitive interaction with animation.
(v)Cognitive style
Using animated diagrams as a learning tool is a highly visual medium, and may therefore be
used in differing ways by students with different learning styles or different cognitive styles.
For example, cognitive styles have been shown to affect learning with different
representational formats and different tasks (e.g. Riding and Cheema 1991, Riding and
Douglas 1993, Riding and Rayner 1995), spatial ability has been shown to influence
understanding involving inference of dynamics (e.g. Hegarty 1992). Thus, other research
findings suggest that the value of using such representations as animation to depict dynamic
processes may be affected by individual differences in learning or cognitive style and
learning strategies.
(vi) Design issues
Finally, worthy of mention is the effect of various design issues. Ways of depicting particular
kinds of information can be achieved through different graphical representations, for
example, representing flow of fluid may be depicted by use of arrows or dots or colour
change. The effectiveness of each manner of expression for understanding may differ.
However, the particular graphical design may also affect salience of graphical change and
subsequent interpretation of graphical change. Again these issues were not specifically
explored in this thesis although some design issues regarding salience an interpretation of
graphical change were found (e.g. see 7.5.). It is apparent that research uncovering some
design issues result in conflicting design ideas. For example, Stenning (1998) proposes that in
animation all fields should be determined simultaneously, whereas Milheim’s (1993)
guidelines suggest animation should be simple, but sufficiently complex to convey the
important information within it. However, neither the terms ‘simple’ nor ‘complex’ are
defined, and the concept of definitive ‘important information’ is somewhat misleading. What
is important to one learner may not be to another, and if an animation is simplified by
reducing some of the information, how do we know the effect of this on the kinds of
inferences learners make? It seems that some of the design issues are intricately tied with
several other issues, such as, interaction, learner knowledge, learner diagram expertise, and
future research in this area must work to build on findings in a systematic kind of way.
9.13. Conclusion
In order to carry out the research in this thesis a conceptual framework was developed for
evaluating the cognitive value of animated diagrams. The framework was developed with the
concept of abstraction and generalisation in mind, to overcome the problems of the
integration of findings from previous studies investigating the use of animation for learning.
It was successful in enabling identification of particular features or properties of the
representation, as well as particular features or stages pertinent for learning. This meant that
particular aspects of this kind of representation (animation) could be examined and evaluated
such that they could provide information for a cognitive model of processing as well as
inform both design and education in terms of both teaching and pupil learning.
A main benefit of this kind of conceptual framework is that it can be used to generalise to
other animated diagrams in other domains, as well as to other user populations. Furthermore,
the application of this framework for further research may uncover additional properties or
features of animation (or features that may emerge in different domains) and learning
enabling further analysis that would give added information about the effectiveness of
animation and the design of such representations in the future.
This framework is also valuable as a basis for more extensive research on animated diagrams,
as the abstract level from which it works will enable analysis of more diverse aspects of
animated diagrams, such as, investigating the effectiveness different types or levels of
interactivity with animated diagrams for learning. In this context new properties or features
of the representation and/or the learners interaction with the representation may emerge,
which in turn may generate new cognitive dimensions of animated representations.
In summary, the conceptual framework developed here has many uses and benefits. Firstly, it
lends itself to generalisation at a level that previous research on animation does not.
Secondly, it is potentially valid in other domains and in other user populations. Thirdly, it is

valuable for researching and evaluating other aspects of using of animated diagrams, such as
the effectiveness of interactivity with animation, as well as learner aspects, such as
individual differences. Finally, it provides a generalised framework for further research,
enabling more valid comparisons across studies, more cohesiveness in their findings resulting
in a more comprehensive understanding about the effectiveness of animation for learning and
informing, as well as a clearer picture on how best to design and implement the use of this
particular form of representation.

References
Ainsworth, S.E. (1999) Designing Effective Multi-representational Learning Environments,
ESRC Centre for Research in Development, Instruction and Training, University of
Nottingham, technical report number 58.
Aldrich, F., Scaife, M. and Rogers, Y. (1998) Getting to grips with interactivity: helping
teachers assess the educational value of CD ROMs. British Journal of Educational
Technology. 29, 321-333.
Anderson, T., Tolmie, A., Howe, C., Mayes, T. and Mackenzie, M. (1992) Mental models of
Motion. In (eds) Y. Rogers, A. Rutherford, P. Bibby, Models in the Mind :Theory,
Perspective and Application. Academic Press.
Anderson, R. (1993). Visual discovery in mind and on paper. Memory and Cognition, 21 (3),
283-293.
Anderson, J. (1995) Cognitive Psychology and its Implications. 4th edition. Freeman, New
York.
Anderson and McMartney (1997) Learning from diagrams. International Journal of Machine
Graphics and Vision. Vol. 6 , No.1, pp. 57-76.
Anzai, Y. (1991) Learning and use of representations for physics expertise. In (eds) Ericsson,
K. and Smith, J. Toward a General Theory of Expertise. Cambridge University Press.
Baek and Lane (1988) Colour, Graphics and Animation in a computer assisted learning
tutorial lesson. Journal of Computer-Based Instruction.15 (4), p. 131-135.
Ballard, D. H. (1991). Animate vision. Artificial Intelligence. 48, 57-86.

Bauer, M. and Johnson-Laird, P. (1993) How diagrams can improve reasoning?
Psychological Science. 4, (6), 372-378.
Betrancourt, M. and Tversky, B. (2000) Effect of computer animation on users’ performance:
A review. Le Travail Humain, 63 (4), 311-330.
Blackwell, A. and Engelhardt, Y. (1998) A taxonomy of diagram taxonomies In Proceedings
of Thinking with Diagrams 98: Is there a science of diagrams? P. 60-70.
Blackwell, A.F, Britton, C., Cox, A., Green. T.R.G., Gurr, C. A., Kadoda, G.F., Kutar, M.,
Loomes, M., Nehaniv, C.L., Petre, M., Roast, C., and Young, R.M. (2001) Cognitive
Dimensions of Notation: Design tools for cognitive technology. In M. Beynon, C.L. Nehaniv,
and K. Dautenhahn (eds.) Cognitive Technology 2001 (LNAI 2117). Springer-Verlag, p. 325-
341.
Brna, P. (1996). Can't See the Words for the Tree: Interpretation and Graphical
Representations. Proceedings of the Colloquium on Thinking with Diagrams, Digest No:
96/010, IEE, London.
Brna, P., Cox, R. and Good, J. (1997) Thinking with Diagrams discussion paper: Education.
Thinking with Diagrams Workshop, Portsmouth 1997.
Cheng, P., Lowe, R. and Scaife, M. (2001) Cognitive Science Approaches To Diagram Use.
Artificial Intelligence Review. 15, Issue 1, March 2001 79-94.
Chi, M. (1997) Why is self explaining an effective domain general learning activity. In (ed)
Glaser, R. Advances in Instructional Psychology. Lawrence Erlbaum Associates.
Cox, R. and Brna, P. (1995) Supporting the Use of External Representations in Problem
Solving: The Need for Flexible Learning Environments. Journal of Artificial Intelligence in
Education, 6 (2/3), 239-302.
Cox, R. (1996) Analytical reasoning with external representations. PhD Thesis.

Dahlqvist, P. & Ramburg, R. (1998) Using Animations in Educational Software. A Pilot
Study of 7th Grade Students. Second Swedish Symposium on Multimodal Communication
(LUCS) October 1998.
Dahlqvist, P. (2000) Animations in Physics Learning. In Robson, R. (ed), Proceedings of
MSET, Mathematics/Science, Education and Technology, San Diego, California. February
2000.
Denham, P. (1993) Nine to fourteen year old children’s conception of computers using
drawings. Behaviour and Information Technology 12, 346-358
Futrelle, R. P.(1998) The Diagram Understanding System Demonstration Site. Northeastern
University, October 1998 http://www.ccs.neu.edu/home/futrelle/diagrams/demo-10-98/
Gobet, F., Lane P. C. R., Croker, S., Cheng P. C-H., Jones, G., Oliver, I., and Pine, J.M.
(2001). Chunking mechanisms in human learning. Trends in Cognitive Science, 5, 236-243.
Goolkasian, P. (1996) Symposium: multimedia in instruction. Getting started with
multimedia. Behaviour Research Methods, Instruments and Computers. 28, (2), 279-281.
Green, T. R.G. (1989) Cognitive Dimensions of Notation. In A. Sutcliffe and L. Macaulay
(eds) People and Computers V . Cambridge University Press.
Green, T.R.G. (1991) Describing information artefacts with cognitive dimensions and
structure maps. In D. Diaper and N.V. Hammond (eds) Proceedings of “HCI’91: Usability
Now” Annual Conference of BCS Human-Computer Interaction Group. Cambridge.
Cambridge University Press.
Green, T. R. G. and Petre, M. (1996) Usability analysis of visual programming environments:
a 'cognitive dimensions' framework. Journal of Visual Languages and Computing, 7, 131-
174.
Green T. R. G. and Blackwell, A. F. (1998) A tutorial on cognitive dimensions.
http://www.cl.cam.ac.uk/users/afb21/publications/CdtutSep98.pdf
Grimes and Willey (1990) The effectiveness of micro computer simulations in the principles
of economics course. Computer Education 14, (1) 81-86.
Guttormsen Schär, S., Krueger, H. (2001). Empirical research on the Effect of Dynamic
Media for Information Presentation. Proceedings of the 4th International Workshop
ICL2001, Interactive Computer aided Learning - Experiences and Visions . Villach Austria
26-28 September 2001.
Halberstadt, N. and Kareev, Y. (1995) Transitions between modes of enquiry in a rule
discovery task.
Hays (1996) Spatial abilities and the effects of computer animation on short-term and long
term comprehension. Journal of Educational Computing Research.
Hegarty, M., Carpenter, P. A., and Just, M. A. (1991). Diagrams in the comprehension of
scientific texts. In R. Barr, M. L. Kamil, P. Mosenthal, & P. D. Pearson (Eds.), Handbook of
reading research Vol. 2, pp. 641-668. NY: Longman.
Hegarty, M. (1992). Mental animation: Inferring motion from static diagrams of mechanical
systems. Journal of Experimental Psychology: Learning, Memory and Cognition, 18(5),
1084-1102.
Hegarty, M. and Kozhevnikov (1999) Types of visual-spatial representations and
mathematical problem solving. Journal of Educational Psychology vol. 91, No. 4, p.684-689.
Hegarty, M. and Kozhevnikov, M. (1999) Spatial Abilities, Working Memory, and
Mechanical Reasoning. University of California, Santa Barbara,
http://www.arch.usyd.edu.au/kcdc/books/VR99/
Hong, E., and O’Neil, H. (1992) Instructional Strategies to help learners build relevant
mental models in inferential statistics. Journal of Educational Psychology. Vol, 84, 2, 150-
159.
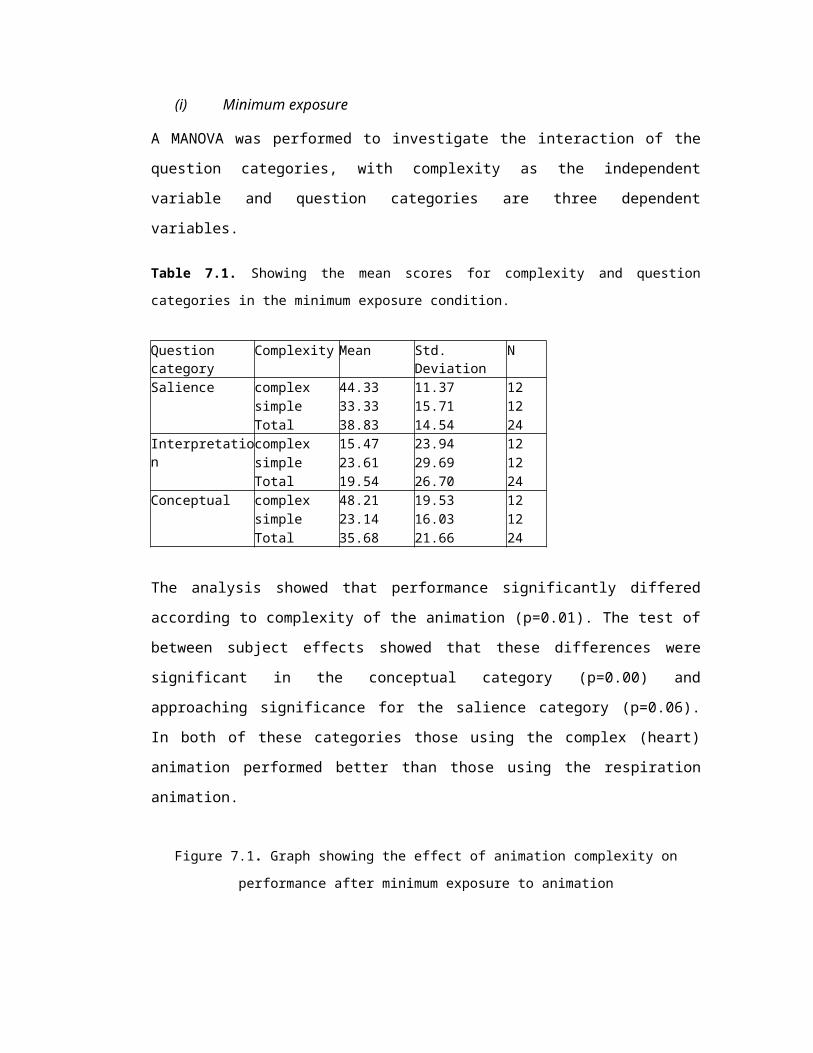
Hoogeveen (1997) Towards a theory of effectiveness of multimedia systems. International
Journal of Human-Computer Interaction. 9 (2),151-168.
Johnson, A (1999) The computer display as a support of collaborative development of
scientific models of magnetism In Proceedings of the Computer Support for Collaborative
Learning (CSCL) 1999 Conference, C. Hoadley and J. Roschelle (eds) Lawrence Erlbaum
Associates.
Jones, S. and Scaife, M. (1999) Diagram Representation: A Comparison of animated and
static formats. Proceedings of AAEC Ed- Media 99.
Jones, S. and Scaife, M. (2000) Animated Diagrams: An Investigation into the Cognitive
Effects of using Animation to Illustrate Dynamic Processes. In M. Anderson & P. Cheng
(eds) Theory and Applications of Diagrams. Lecture Notes in Artificial Intelligence, no.
1889, Berlin, Springer-Verlag. p. 231-244.
Kaiser, M., Proffitt, D., Whelan, S. and Hecht, H. (1992) Influence of animation on
dynamical judgements. Journal of Experimental Psychology: Human Perception and
Performance. 18, 669-690
Kieras, D. (1992) Diagrammatic display for engineered systems: effects on human
performance in interacting with malfunctioning systems. International Journal of Man-
Machine Studies 36, 861-895.
Kim, J. and Hahn, J. (1997) Reasoning with Multiple Diagrams: Focusing on the Cognitive
Integration Process. Proceedings of The Nineteenth Annual Conference of Cognitive Science
Society 376-381.
Kirsch, D. (1997) Interactivity and Multimedia Interfaces. Instructional Science, No. 25, 79-
96.
De Kleer, J. and Brown, J. (1983) Assumptions and Ambiguities in Mechanistic Mental
Models. In (Eds.), D. Gentner and A. L. Stevens. Mental Models, Lawrence Erlbaum
Associates, New Jersey, 1983, pp. 155-190. 18

Koedinger, K. (1992) Emergent properties and structural constraints: Advantages of
diagrammatic representations for reasoning and learning. In the working notes of the 1992
AAAI Spring Symposia on Reasoning with Diagrammatic Representations, Stanford
University, March 27-29.
Lazarowitz, R. and Huppert, J. (1993) Science process skills of 10 th grade biology students in
a computer-assisted learning setting. Journal of Research in Computing Education. 25 (3)
366-382.
Large, A., Beheshti, J., Breuleux, A. and Renaud, A. (1994) Multimedia and Comprehension:
A Cognitive Study. Journal of the American Society for Information Science. 45, 7, 515-528.
Large, A., Beheshti, J., Breuleux, A. and Renaud, A. (1995) Multimedia and Comprehension:
The relationship among text and animation. Journal of American Society for Information
Science. 46 (5), 340-347.
Large, A (1996) Computer Animation in an Instructional Environment. Library and
Information Science Research, 18, 3, 23.
Larkin, J. and Simon, H. (1987) Why a diagram is (sometimes) worth ten thousand words.
Cognitive Science 11, 69-100.
Laurillard, D. (1993) Rethinking University Teaching. Routledge.
Lowe, R. (1994) Selectivity in diagrams: reading beyond the lines. Educational Psychology,
Vol.14, 4, 467-491.
Lowe, R. (1996) Interactive Animated diagrams: what information is extracted. Proceedings,
Using Complex Information Systems Seminar. Poitiers, France: University of Poitiers.
France: September, 40-45.

Lowe, R. (1999) Extracting information from an animation during complex visual learning.
European Journal of Psychology of Education Vol. XIV, 2, 225-244.
Mayer, R. (1982). Different problem-solving strategies for algebra word and equation
problems, Journal of Experimental Psychology: Learning, Memory and Cognition, 8, 448-
462.
Mayer, R., and Cook, L. (1984) Techniques that help readers build mental models from
scientific text: Definitions pretraining and signaling. Journal of Educational Psychology. Vol.
76, 6, 1089-1105.
Mayer, R. and Anderson, R. (1991) Animations need narrations: An Experimental Test of a
Dual-Coding Hypothesis. Journal of Educational Psychology. 83, 4, 484-490.
Mayer, R. and Anderson, R. (1992) The instructive animation: helping students build
connections between words and pictures in multimedia learning. Journal of Educational
Psychology, 84, 444-452.
Mayer, R. and Sims (1994) For whom is a picture worth a thousand words. Extensions of a
dual-coding theory of multimedia learning. Journal of Educational Psychology. 86, 389 –
401.
Mayer, R. (1997) Multimedia Learning: Are we asking the right questions? Educational
Psychologist. 32, 1-19.
Milheim, W. D. (1993) How to use animation in computer assisted learning. British Journal
of Educational Technology, 24, (3), 171-178.
Mintzes, J., Wandersee, J. and Novak, J. (1999) (eds) Assessing Science Understanding.
Academic Press.
Morrison, J.B., Betrancourt, M. and Tverksy, B. (2000). Animation: Does it facilitate
learning? (pp. 53-60), Stanford, CA: AAAI. Papers from the 2000 AAAI, Spring Symposium,
Smart Graphics

Narayanan, N. H., Suwa, M. and Motoda, H. (1994). A study of diagrammatic reasoning
from verbal and gestural data. Proceedings of the 16th Annual Conference of the Cognitive
Science Society, (p. 652-657) Lawrence Erlbaum Associates.
Narayanan, N. and Hegarty, M. (1998) On designing comprehensible interactive hypermedia
manuals. International Journal of Human-Computer Studies. 48, 267-301.
Narayanan, N. H. and Hegarty, M. (2000). Intelligible multimedia. Proceedings of Smart
Graphics: Papers from the AAAI 2000 Spring Symposium, American Association for
Artificial Intelligence (AAAI) Press Technical Report SS-00-04, pp. 117-122.
National Research Council (2000) How people learn: Brain, Mind, Experience and School:
Expanded Edition. National Academy Press
Nicholls, C., Merkel, S. and Cordts, M. (1996) The Effect of Computer Animation on
Students’ Understanding of Microbiology. Journal of Research on Technology in Education.
28, 3,
Park, O. (1998) Visual Displays and Contextual Presentations in Computer Based Instruction.
Educational Technology Research and Development. 46(3), 37-50.
Park, O. and Gittelman, S. (1995) Dynamic Characteristics of mental models and dynamic
visual displays. Journal of Instructional Science. 23, 303-320.
Palmiter, Elkerton and Baggett (1991) Animated demonstrations vs. written instructions for
learning procedural tasks: a preliminary investigation. International Journal of Man-Machine
Studies 34, 687-701
Palmiter and Elkerton (1993) Animated demonstrations for procedural computer-based tasks.
Human Computer Interaction. 8, 193-216

Pane, J.F., Corbett, A.T. and John, B.E. (1996) Assessing Dynamics in Computer-Based
Instruction. Proceedings of ACM CHI'96 Conference on Human Factors in Computing
Systems. Vancouver, April 1996, pp. 197-204.
Pillay, H. (1999) An analysis of knowledge representation of students in electronic problem
tasks. European Journal of Psychology of Education Vol. XIV, 3, 325-338.
Riding, R. and Cheema, I. (1991) Cognitive Styles - An Overview and Integration.
Educational Psychology. 11, 3-4 193-215.
Riding, R. and Douglas, G. (1993) The effect of cognitive style and mode of presentation on
learning performance. British Journal of Educational Psychology. 63, 297-307.
Riding, R. and Rayner, S. (1995) The information superhighway and individualised learning.
Educational Psychology. Vol.15, 4, 365-378.
Rieber, L.P. (1990a) Animation in computer based instruction. Educational Technology
Research and Development. 38 (1), 18 (3), 77-86.
Rieber, L.P. (1990b) Using computer animated graphics in science instruction with children.
Journal of Educational Psychology. 82 (1), 135-140.
Rieber L.P (1991) Animation incidental learning and continuing motivation. Journal of
Educational Psychology 83 (3) 318-328.
Rieber, L. P., Boyce, and Assad (1990) The effect of computer animation on adult learning
and retrieval tasks. Journal of Computer-based Instruction. 17 (2) 46-52.
Rogers, Y. and Scaife, M. (1998) How Can Interactive Multimedia Facilitate Learning? In
Lee, J. (ed.) Intelligence and Multimodality in Multimedia Interfaces: Research and
Applications. AAAI. Press: Menlo Park, CA.
Rogers, Y. (1999) What is different about interactive graphical representations? Learning and
Instruction, 9, 419-425

Roncarrelli, R. (1989) The Computer Animation Dictionary. Springer-Verlag new York.
Rumelhart, D. and Norman, D. (1987) Representation of Knowledge in (eds) Aitkenhead and
Slack Issues in Cognitive Modeling Lawrence Erlbaum Associates.
Satchwell, R. E. (1996) Using functional flow diagrams to enhance technical systems
understanding. Journal of Industrial Teacher Education, 34 (2), 50-81.
Scaife, M and Rogers, Y. (1996) External Cognition: how do graphical representations work?
International Journal of Human-Computer Studies. 45, 185-213.
Scanlon, E., Jones, A., Butcher, P., Greenberg, J., Ross, S., Taylor, J., Murphy, P. and
Tosunoglu, C. (1998) Learning with computers: experiences of evaluation, Computers and
Education, Vol. 30, 1/2 pp 9-14.
Schnotz, W., Bockheler, J., and Grzondziel, H (1999) Individual and co-operative learning
with interactive animated pictures. European Journal of Psychology of Education Vol. XIV,
2, 245-265
Schwier and Misanchuk (1993) Interactive Multimedia Instruction. Englewood Cliffs:
Educational Technology Pub.
Seeger, F. (1999) Graphical representations and learning.
http://lilt.ics.hawaii.edu/CSCL99/CollaborativeReps/Seeger/Seeger
Sivasubramaniam, P. (1999) Computers and Graphing Skills in the Light of Learning
Theories. Proceedings of British congress of mathematics Education
Stenning, K. (1998) Distinguishing Semantic from Processing Explanations of Usability of
Representations: Applying Expressiveness Analysis to Animation. In (eds.) J. Lee,
Intelligence and Multimodality in Multimedia Interfaces: Research and Applications, AAAI
Press.

Stenning, K. and Oberlander, J. (1995) A cognitive theory of graphical and linguistic
reasoning: logic and implementation. Cognitive Science. 19, 97-140.
Sundberg P. A. (1998) "Animation in CALL: Learning to think in the fourth dimension"
Paper Presentation CALICO ’98 Symposium San Diego, California.
Szabo, M (1997) A survey of research on selected components of interactive multimedia
learning, efficiency and attitude.
http://www.quasar.ualberta.ca/edmedia/TIES/readings/Nrefsza.html
Thompson, S. V. and Riding, R. J. (1990) The effect of animated diagrams on the
understanding of a mathematical demonstration in 11 to 14 year old pupils. British Journal of
Educational Psychology, 60, 93-98.
Thornton, R.K. and Sokoloff, D.R. (1998) Assessing student learning of Newtonian's laws:
The force and motion conceptual evaluation and the evaluation of active learning laboratory
and lecture curricula. American Journal of Physics, Vol. 66, 4, 338 - 352.
Tinajero, C. and Fernanda Paramo, M. (1997) Field dependence-independence and academic
achievement: a re-examination of their relationship. British Journal of Educational
Psychology 67, 199-212.
Tuovinen, J. E. (1997) Tuovinen, J. E. (1997). Cognitive Load and Discovery Learning.
AARE97 Conference Paper. Brisbane: Australian Association for Research in Education.
Van Labeke, N. (2001) Multiple External Representations in Dynamic Geometry: a Domain-
Informed Design. AI-ED 2001 Workshop External Representations in AI-ED Multiple-Forms
and Multiple Roles, San Antonio, Texas.
Waterworth J. (1992) Multimedia Interaction with Computers: Human factors issues.
Chichester Sussex. Ellis Horwood.

Williamson and Abraham (1995) The Effects of Computer Animation on the Particulate
Mental Models of College Chemistry Students. Journal of Research in Science Teaching. 32,
5, 521-534.
Winn, W (1987) Charts, graphs, and diagrams in educational materials. In D. M. Willows and
H. A. Houghton (eds) The Psychlogy of Illustration. Volume 1 Basic Research. New York,
NY; Springer-Verlag.
Woolf, B.P. and Hall, W. (1995) Multimedia Pedagogues: Interactive systems for teaching
and learning. Computer, May 74-80.
Young, R., Howes, A. and Wittington, J. (1990) A Knowledge Analysis of Interactivity. In
(eds) Diaper, D et. al. Human-Computer Interaction - INTERACT ‘90. Elsevier Science
Publishers.
Zhang, J. and Norman, D. (1994) Representations in distributed cognitive tasks. Cognitive
Science 18, 87-122.
Zhang, J. (1997) The nature of external representations in problem solving. Cognitive Science
vol. 21 (2) 179-217.

Appendices
Appendix 1
(study 1)
Animated information (example page with video showing blood flow)
see “What’s the Secret” CD ROM from 3M learning software for full animation.

Appendix 2
Static paper information (two pages)
(Study 1)
page 1

page 2

Appendix 3
Tasks
(Study 1)
(i) Open task
For static paper condition.
Blood flow through the heart
You have a friend Iona Heart, who is taking a first aid exam. Iona needs to know how the
blood flows through her heart. In fifteen minutes use the diagram and information provided
so that you can explain to Iona;
how the blood flows in through and out of the heart.
about blood that is rich in oxygen, and blood that has less oxygen.
about the different chambers of the heart.
For animated CD ROM condition
Blood flow through the heart
You have a friend Iona Heart, who is taking a first aid exam. Iona needs to know how the
blood flows through her heart. In fifteen minutes use the CD ROM provided so that you can
explain to Iona;
how the blood flows in through and out of the heart.
about blood that is rich in oxygen, and blood that has less oxygen.
about the different chambers of the heart.

(ii) Structured worksheet for static and animated conditions.
Heart Worksheet
Using the information provided, find out about the following, and complete all sections.
1. Your heart is divided into left and right sides.
a) Which side has blood that is less in oxygen?..............................................
b) Which side has blood that is rich in oxygen?...............................................
2. Answer the following about the heart’s chambers.
a) How many chambers are there in the heart?...............................................
b) Which chambers receive blood?..........................................................
c) Which chambers pump blood?..................................................................
3. Your heart receives and pumps out both blood that is rich in oxygen and blood that has less
oxygen.
Answer the following about blood that has less oxygen.
a) Where does blood that is less in oxygen come from?..................................
b) Which chamber of the heart does this blood enter?.....................................
c) Which chamber does it flow to next?.........................................................
d) Where is blood that has less oxygen pumped to?...................................
Answer the following about blood that is rich in oxygen.
a) Where does blood that is rich in oxygen come from?...................................
b) Which chamber of the heart does it enter?.................................................
c) Which chamber does it flow to next?..........................................................
d) Where is blood that is rich in oxygen pumped to?......................................
4. The blood flows around your body, heart and lungs in a continuous circular pattern. Show
that you understand the order of blood flow by filling in the empty brackets using numbers 1
to 8, starting with ....( 1) from body;
( ) to body ( ) to right ventricle
( 1 ) from body ( ) to left ventricle
( ) to lungs ( ) to right atrium
( ) from lungs ( ) to left atrium

5. Draw your own simplified diagram of how the blood flows through your heart, a diagram
that would help you to remember the sequence and direction of flow.

Appendix 4
Test
(Study 1)
Example of test diagram.

Appendix 5
Animated information – example frame from CD ROM
(Study 2)

Appendix 6
Static paper diagram
(Study 2)

Appendix 7
Tests
(Study 2)
(i) written
Please try to answer the following questions;
1. What do you think is the main function of the heart?
2. a) How many chambers does the heart have?
b) can you name any of them?
For the following three questions please tick the appropriate answer.
3. a) where does oxygenated (rich in oxygen) blood flow from?
LUNGS............. BODY.................
b) Where does it flow to?
LUNGS.............. BODY..................
4. a) Where does deoxygenated blood (less in oxygen) flow from?
LUNGS................ BODY................
b) Where does it flow to?
LUNGS................. BODY................

5. a) Through which chambers does the blood enter the heart?
UPPER.............. LOWER..............
b) From which chambers does the blood leave the heart?
UPPER............. LOWER................
6. What do you think is the function of the valves?
7. How does the heart deal with the two types of blood (oxygenated & deoxygenated)?
8. The blood flows around your body, heart and lungs in a continuous circular pattern. Show that you understand the order of blood flow by filling the empty brackets using numbers 1 to 8, starting with....... (1) from body;
( ) to body ( ) to right ventricle
( 1 ) from body ( ) to left ventricle
( ) to lungs ( ) to right atrium
( ) from lungs ( ) to left atrium

(ii) diagram
a. Examples of open ended questions used
1. What do you think is the main function of the heart?
2. Can you tell me anything about how the heart is divided?
3. Can you tell me anything about the valves?
3. Can you tell me anything about HOW the heart works?
4. Can you tell me anything about the blood that the heart has to deal with?
5. Can you show me the pathway that the blood takes through the heart, where does it come from and where does it go to?

Appendix 8
Animations
(Study 3 and study 4)
see CD ROM “Animations studies 3 and 4”“Heart one run” and “Respiration one run”
Example frames:
(i) heart animation

(ii) respiration animation

Appendix 9a
Written tests
Study 3
(i) Heart Questionnaire 1. The following statements refer to movements or changes that happened in the animation?
Tick as many of the following statements that you think are true of the red dots? they change into blue dots they enter the heart from the body they leave the heart and go to the upper body they enter the heart from the lungs they mix with the blue dots in the heart when they leave the heart they go to the lungs
Tick as many of the following statements that you think are true of the blue dots?1. They changed into red dots in the body2. They changed into red dots in the lungs3. They enter the heart from the lungs4. They enter the heart from the body5. They go from the heart to the lungs6. They change into blue arrows
Did the ventricles change? If so, in what way?
Did the valves in the heart change? If so in what way?
Did the heart muscle change? If so in what way?
Did the blood always flow at the same speed?
2. Where does the oxygenated (red) blood come from before it enters the heart?
3. Where does the deoxygenated (blue) blood come from before it enters the heart?
4. Where does the oxygenated (red) blood go to when it leaves the heart?

5. Where does the deoxygenated (blue) blood go to when it leaves the heart
6. In the animation what is the meaning of the following events/ changes:
The red dots turn into red arrows
The blue dots change to red dots
The red dots change to blue dots
The ventricles get larger and smaller
The heart muscle gets thinner and thicker
The heart valves separate and join together
The blue and red arrows alter speed
7. What is the main function of the heart?

(ii) Respiration Questionnaire
1. Put a circle around the statement you think is true?
Which statement is true about the blue circle in the animation it stays inside the grey circle throughout the animation it changes to a red circle it disappears within the alveolar sac it appears in the alveolar sac
Which statement is true about the red circle in the animationa) it changes to a grey circleb) it appears in the alveolar sacc) it disappears in the alveolar sacd) it changes to a blue circle
Which statement is true of the grey circle in the animationa) It does not change throughout the animationb) It loses a red circle and gains a blue circlec) It loses a blue circle and gains a red circled) It disappears in the alveolar sac
Which of the following statements are true? The blue circle moves from the capillary to the alveolar sac There are more blue than red circles in the alveolar sac The thickness of the wall of the alveolar sac is the same all around it The red circle moves from the capillary to the alveolar sac The thickness of the wall of the alveolar sac differs in some places There are more red than blue circles in the alveolar sac.
2. What kind of blood enters the capillary?
3. Why does this blood pass by the alveolar sac?
4. Where does the blood then go to when it leaves the capillary?
5. In the animation what do the following events/ changes show: (what do they mean)?
The grey circle moving along a pathway
The blue circle leaving the grey circle
The blue circles disappearing in the alveolar sac
The red circles appearing in the alveolar sac

The red circle entering the grey circle
A larger number of red circles than blue circles in the alveolar sac
6. Why are the following important for gas exchange in the lungs?
There is more oxygen than carbon dioxide in the alveolar sac
The wall (membrane) between the alveolar sac and the capillary is thinner than the rest of its walls.
7. What is the main purpose of respiration.

Appendix 9b
Categorisation of test questions
(Study 3)
Heart animationSalience category consisted of all of question 1 (total possible score = 19)Interpretation category consisted of all of question 6 (total possible score = 7)Conceptual category consisted of questions 2 to 5 and 7 (total possible score = 6)
Respiration animationSalience category consisted of all of question 1 (total possible score = 9)Interpretation category consisted of question 5 (total possible score = 6)Conceptual category consisted of 2,3,6 and 7 (total possible score = 7)
Question 4 was removed from the analysis as it turned out to be ambiguous.
Appendix 10
Tests (Study 4)
(i) Questionnaire heart animation
The following statements refer to movements or changes in blood flow. Tick to indicate whether each statement is true or false or tick ‘unsure’ if you really don’t know.
1. Which of the following statements about the red dots are true or false true false unsureA they change into blue dots B they enter the heart from the bodyC they leave the heart and go to the upper bodyD they enter the heart from the lungsE they mix with the blue dots in the heartF when they leave the heart they go to the lungs
Which of the following statements about the blue dots are true or false
true false unsure
G They changed into red dots in the bodyH They changed into red dots in the lungsI They enter the heart from the lungsJ They enter the heart from the bodyK They go from the heart to the lungsL They change into blue arrows
2. Which of the following statements about the animation are true or false
true false unsure
A The ventricles do not change throughout the animation B The ventricles get bigger and smaller at the same timeC The ventricles get bigger and smaller at alternate timesD the ventricle gets bigger when the atrium got smallerE the heart muscle surrounds only the ventricleF the heart muscle contracts around the atriumG the heart muscle gets thinner and thickerH there are 4 valves in the heartI the valves do not moveJ there are 2 valves in the heartK the valves open and close at different timesL the valves all open and close at the same timeM when the dots leave the heart they go faster

3. a) Where does the oxygenated (red) blood come from before it enters the heart?
2. Where does the deoxygenated (blue) blood come from before it enters the heart?
3. Where does the oxygenated (red) blood go to when it leaves the heart?
4. Where does the deoxygenated (blue) blood go to when it leaves the heart
4. In the animation what is the meaning of the following events/ changes:
The red dots turn into red arrows
The blue dots change to red dots
The red dots change to blue dots

5. Tick which of the following statements are true or false.
The ventricles get bigger and smaller because… true false unsureThey allow air in and outThey fill with blood They empty of bloodThey do not change throughout the animation
The heart muscle gets thinner and thicker because….It is contracting to pump bloodit is contracting to breathe outit is expanding as blood flows init is expanding to breathe in
The heart valves separate and join together..To pump blood through the heart
To let blood flow throughTo stop backflow of bloodThey do not open and close
6. What is the main function of the heart?

(ii) Test respiration animation
(Study 4)
Questionnaire respiration
1. Put a circle around the statement you think is true?
Which one statement is true about the blue circle in the animation it stays inside the grey circle throughout the animation it changes to a red circle it disappears within the alveolar sac it appears in the alveolar sac
Which one statement is true about the red circle in the animatione) it changes to a grey circlef) it appears in the alveolar sacg) it disappears in the alveolar sach) it changes to a blue circle
Which one statement is true of the grey circle in the animatione) It does not change throughout the animationf) It loses a red circle and gains a blue circleg) It loses a blue circle and gains a red circleh) It disappears in the alveolar sac
2. Indicate which of the following statements are true or false or tick ‘unsure’ if you don’t know
true false unsure
The blue circle moves from the capillary to the alveolar sacThere are more blue than red circles in the alveolar sac
The thickness of the wall of the alveolar sac is the same all around it.The red circle moves from the capillary to the alveolar sacThe thickness of the wall of the alveolar sac differs in some places.There are more red than blue circles in the alveolar sac

3. a) What kind of blood is flowing into the capillary?
b) Why does this blood pass by the alveolar sac?
4. In the animation what do the following events/ changes show?
The grey circle moving along a pathway
The blue circle leaving the grey circle
The blue circles disappearing in the alveolar sac
The red circles appearing in the alveolar sac
The red circle entering the grey circle
A larger number of red circles than blue circles in the alveolar sac
5. Which of the following help diffusion (the process by which gases are exchanged in the lungs) to take place.
true false unsure
A higher concentration of oxygen than carbon dioxide in the alveolar sacA higher concentration of carbon dioxide than oxygen in alveolar sacA thinner wall (membrane) between the alveolar sac and the capillary The carbon dioxide changes into oxygen in the alveolar sac
6.What is the main role of respiration?

Appendix 10b
Categorisation of questions
(Study 4)
Heart animation
Salience category consisted of questions 1 and 2 (total possible score = 25)
Interpretation category consisted of questions 3 and 4 (total possible score = 7)
Conceptual category consisted of questions 5 and 6 (total possible score = 14)
Respiration animation
Salience category consisted of questions 1 and 2 (total possible score = 9)
Interpretation category consisted of question 4 (total possible score = 6)
Conceptual category consisted of questions 3, 5 and 6 (total possible score = 9)

Appendix 11
Diagrams to accompany test questions
(Study 3 and 4)
(i) Diagram heart (black and white) accompanying questionnaire
(ii) Diagram respiration (black and white) accompanying questionnaire

Appendix 12a
Pre tests A and B
(Studies 5 and 6)
(i) Question set A – pre-test
NAME ………………………………………………… CLASS…………………
Please answer all of the following questions in the spaces below each question. Try to give short answers only.
1. What kinds of blood flow through the heart?
2. Where does the blood come from before it enters the lungs?
3. Where does blood go to after it leaves the lungs?
4. How does the blood get to the lungs?
5. Oxygenated blood flows out of the heart – where does this blood go to?
6. Why is blood pumped around the body?

(ii) Question set B (pre-test)
NAME……………………………………………… CLASS …………………..
Please answer all of the following questions in the spaces below each question. Try to give short answers only.
1. Why is the heart separated into two main compartments?
2. Where does the blood come from before it enters the body?
3. Where does blood flow to after going round the body?
4. How does the blood get to the body?
5. Deoxygenated blood flows out of the heart – where does this blood go to?
6. Why is blood pumped to the lungs?
1

Appendix 12b
Post tests A and B
(Studies 5 and 6)
(i) Question set A
NAME ………………………………………………… CLASS…………………
The following Questions ALL refer to the heart and circulatory system.Please answer all questions in the spaces below each question. Try to give short answers
only.
1. What kinds of blood flow through the heart?
2. Where does the blood come from before it enters the lungs?
3. Where does blood go to after it leaves the lungs?
4. How does the blood get to the lungs?
5. Oxygenated blood flows out of the heart – where does this blood go to?
6. Why is blood pumped around the body?

7. Tick which of the following are true. The main functions of the heart are ………
a) To pump oxygenated blood to the bodyb) To pump deoxygenated blood to the bodyc) To pump oxygenated blood to the lungsd) To pump deoxygenated blood to the lungs e) To oxygenate the bloodf) To remove carbon dioxide from the blood
8. What changes occur to the blood during the blood flow cycle? Where does each change take place? Why?
change where why
(ii) Question set B
NAME……………………………………………… CLASS …………………..
The following Questions ALL refer to the heart and circulatory system.Please answer all of the following questions in the spaces below each question. Try to
give short answers only.
1. Why is the heart separated into two main compartments?
2. Where does the blood come from before it flows around the body?

3. Where does blood flow to after going round the body?
4. How does the blood get to the body?
5. Deoxygenated blood flows out of the heart – where does this blood go to?
6. Why is blood pumped to the lungs?
27. Tick which of the following are true. The main functions of the heart are ………
a) To pump oxygenated blood to the bodyb) To pump deoxygenated blood to the bodyc) To pump oxygenated blood to the lungsd) To pump deoxygenated blood to the lungs e) To oxygenate the bloodf) To remove carbon dioxide from the blood
8. What changes occur to the blood during the blood flow cycle? Where does each change take place? Why?
change where why
Appendix 13
Diagram test (screen dump)
(Study 6)