Diagnostics of the origin of X- ray emission in Cygnus Loop Xin Zhou, INAF – Osservatorio...
12
Diagnostics of the origin of X-ray emission in Cygnus Loop Xin Zhou, INAF – Osservatorio Astronomico di Palermo, Italy & Nanjing University, China Collaborators: Collaborators: Fabrizio Bocchino, INAF – Osservatorio Astronomico di Palermo, Italy Marco Miceli, Università di Palermo, Italy & INAF – Osservatorio Astronomico di Palermo, Italy Salvatore Orlando, INAF – Osservatorio Astronomico di Palermo, Italy Yang Chen, Nanjing University, China
-
Upload
joanna-reeves -
Category
Documents
-
view
213 -
download
0
Transcript of Diagnostics of the origin of X- ray emission in Cygnus Loop Xin Zhou, INAF – Osservatorio...

Diagnostics of the origin of X-ray emission in Cygnus Loop
Xin Zhou, INAF – Osservatorio Astronomico di Palermo, Italy & Nanjing University, China
Collaborators: Collaborators:
Fabrizio Bocchino, INAF – Osservatorio Astronomico di Palermo, Italy Marco Miceli, Università di Palermo, Italy & INAF – Osservatorio
Astronomico di Palermo, Italy Salvatore Orlando, INAF – Osservatorio Astronomico di Palermo, Italy
Yang Chen, Nanjing University, China
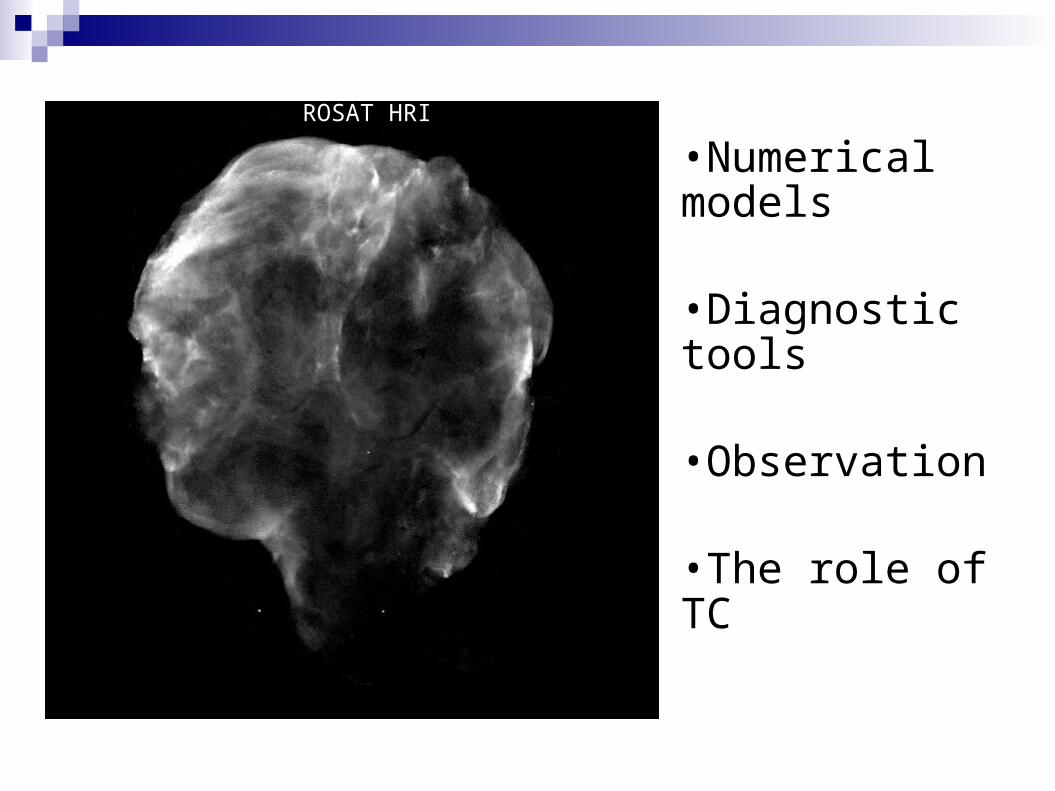
ROSAT HRI
•Numerical models
•Diagnostic tools
•Observation
•The role of TC

Numerical Models:
Orlando et al, 2005, A&A, 444, 505; Orlando et al. 2010, A&A, 514, 29
Case table
nISM=0.1 cm-3
TISM=104 K

Results of models — fluid structure:
Orlando et al. 2005
Stronger transmitted shock;
Weaker reflected shock;
Depress the HY instabilities;
Reducing the mixing of the cloud;
Evaporating the cloud material.
Without TC With TC

Results of models — X-ray emission:
Orlando et al. 2006, A&A, 457, 545
Two seperate high-emission regions in pure HY model;
HY instabilities are not clearly visible from X-ray emission.
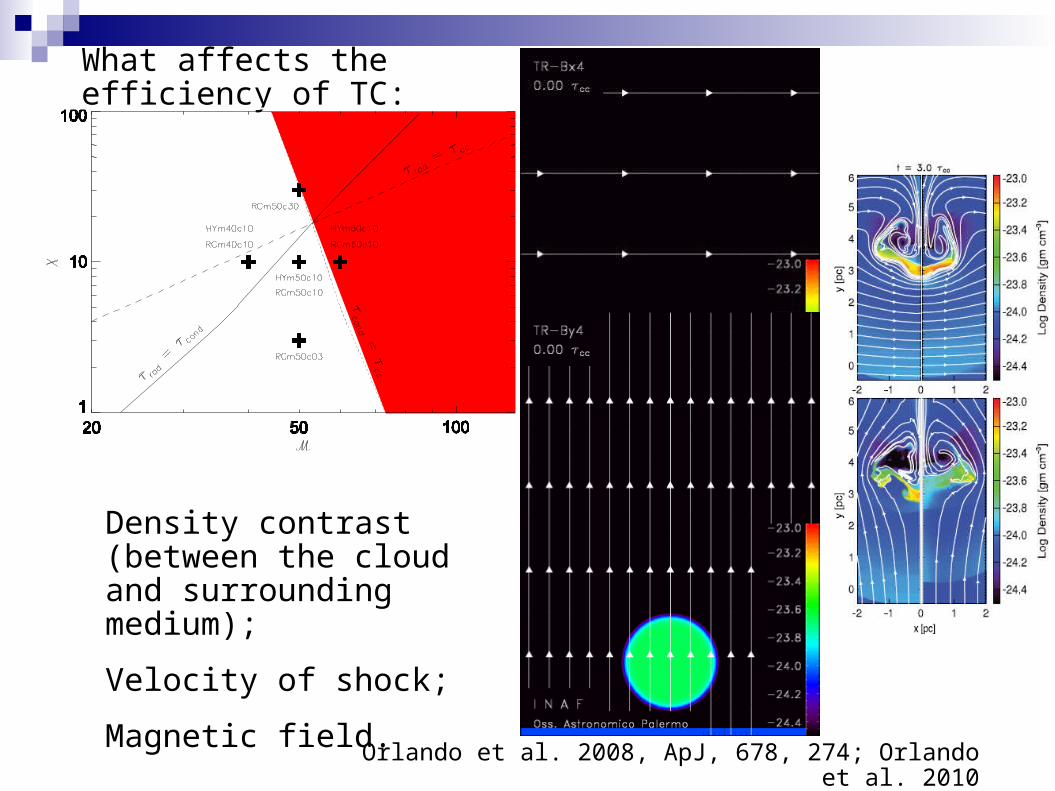
What affects the efficiency of TC:
Orlando et al. 2008, ApJ, 678, 274; Orlando et al. 2010
Density contrast (between the cloud and surrounding medium);
Velocity of shock;
Magnetic field.

Analytic tools to know when TC is efficient:
Orlando et al. 2010; Miceli et al. 2006, A&A, 458, 213
When TC is efficient:
Tlow[DR]/Tlow[knot] > 1; emlow[DR]/emlow[knot] < 0.5.
the MPE vs CR plot is flatter.

ROSAT HRI
XA region, observed by XMM
the Cygnus Loop:
Zhou et al. 2010
Hard band emission gives the information of the distribution of ejecta;
The shock front is curved;
Central low MPE region indicates a “dense finger”;
The long strip indicates a large extension of the central “dense finger”;
Clumpy features in soft band map and the diffuse emission behind them in the medium band map;
Zhou et al. 2010
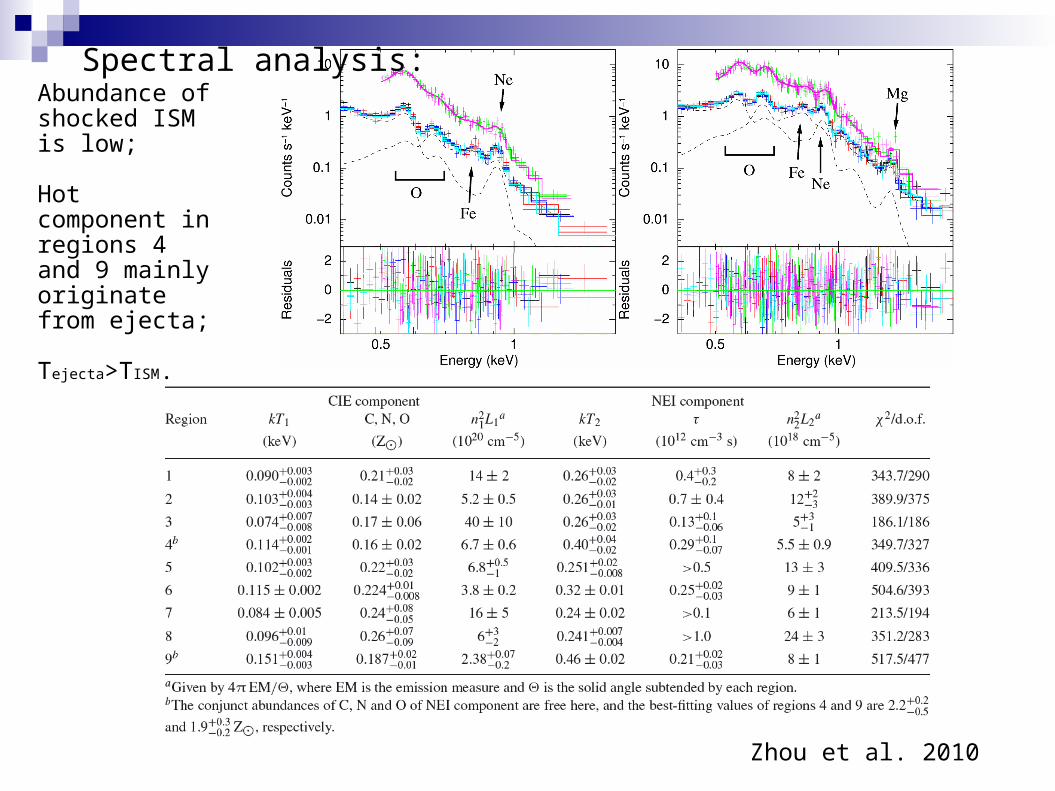
Spectral analysis:Abundance of shocked ISM is low;
Hot component in regions 4 and 9 mainly originate from ejecta;
Tejecta>TISM.

Fig.3
Zhou et al. 2010
The slope is flatter then the model without TC (~-0.45);
TC is less efficient in region 7&8;
The ascending trend in region 3&4 may caused by the presence of ejecta.
TC is predominant in all of the shock-cloud interaction regions.

Summary:
TC is important to understand the evolution of shock-cloud interaction;
In the XA region:
• The surrounding ISM is dense and clumpy;
• TC is prominent in all the shock-cloud interaction regions;
In addition:
• The abundances of the surrounding ISM are found to be lower than the solar value;
• A long bent “finger” protruding from the cavity wall is present in this region, which was not known before.

The End.
Thanks for your attention!!