Diagnostic Waiting Times and Activity Report
17
1 NHS Diagnostic Waiting Times and Activity Data NHS England and NHS Improvement
Transcript of Diagnostic Waiting Times and Activity Report
1
NHS Diagnostic Waiting Times and Activity Data
NHS England and NHS Improvement
2
NHS Diagnostic Waiting Times and Activity Data
January 2021 Monthly Report Version number: 1.0 First published: 11 March 2021 Prepared by: Performance Analysis Team (Central)
NHS England and NHS Improvement
3
Contents Contents ..................................................................................................................... 3
1 Executive summary ............................................................................................. 4
1.1 National Statistics .......................................................................................... 5 2 January 2021 Key Findings ................................................................................. 6
3 National Trends ................................................................................................... 7
3.1 6+ Week Waits .............................................................................................. 7 3.2 Total Waiting List ........................................................................................... 8 3.3 Median Waiting Time ..................................................................................... 9 3.4 Total Activity .................................................................................................. 9
4 January 2021 Data ............................................................................................ 11
4.1 6+ Week Waits ............................................................................................ 11 4.2 Total Waiting List ......................................................................................... 13 4.3 Median Waiting Times ................................................................................. 14 4.4 Total Activity ................................................................................................ 14
5 Annex ................................................................................................................ 16
5.1 Methodology ................................................................................................ 16 5.2 Data Revisions ............................................................................................ 16
5.3 Data Availability ........................................................................................... 16 5.4 Glossary ...................................................................................................... 16
5.5 Feedback Welcomed ................................................................................... 17 5.6 Consultation ................................................................................................ 17 5.7 Additional Information .................................................................................. 17

4
1 Executive summary This report presents a monthly summary of diagnostic waiting times and activity across the NHS in England. This monthly report is part of a routine series of publications produced by NHS England and NHS Improvement. The data presented in this report measures the current waiting times of patients still waiting for any of 15 key diagnostic tests or procedures at the month end. This data is split by number of weeks waiting and by test. The waiting times reported are for those patients who have been referred for a test, but whose test had not taken place by the end of the reporting period. Referrals may be from a variety of sources including GPs. One of the main measurements covered in this report is the number and proportion of patients waiting six weeks or more for a diagnostic test, from time of referral. This six-week diagnostic wait was initially introduced as a ‘milestone’ from March 2008 towards achieving the standard Referral to Treatment wait of 18 weeks by December 2008, but diagnostic waiting times now form part of the NHS Constitution. This gives patients the legal right to treatment within 18 weeks of referral (18 week RTT) and as part of this, pledges that patients should not be required to wait six weeks or more for a diagnostic test. NHS England and NHS Improvement’s planning guidance states that there is a threshold of 1% for this pledge. The financial penalty for non-delivery of the standard is set out in the NHS Standard Contract 2020/21. The 15 key diagnostic tests included in this report are: Imaging
• Magnetic Resonance Imaging (MRI) • Computerised Tomography (CT) • Non-obstetric Ultrasound • Barium Enema • Dual-Energy X-Ray Absorptiometry (DEXA) Scan
Physiological Measurements
• Audiology Assessments • Echocardiography • Electrophysiology • Neurophysiology – Peripheral Neurophysiology • Respiratory Physiology – Sleep Studies • Urodynamics – Pressures & Flows
Endoscopy
• Gastroscopy • Colonoscopy • Flexible Sigmoidoscopy • Cystoscopy
5
For detailed descriptions of each diagnostic test please see the collection guidance documentation. Some of the key terms used throughout this report are outlined below:
• 6+ Waits A count of the number of patients waiting six weeks or more for a diagnostic test at month end from referral.
• Activity A count of the number of diagnostic tests undertaken during the month.
• Diagnostic Test A test or procedure of which the primary function is to identify a patient’s disease or condition to allow a medical diagnosis to be made.
• Waiting List A count of the number of patients that are waiting for a diagnostic test at the end of the month.
A more comprehensive glossary is available in the Annex. All England figures quoted are commissioner based. Commissioner based returns reflect data for patients for whom English commissioners are responsible.
1.1 National Statistics
The UK Statistics Authority has designated these statistics as National Statistics, in accordance with the Statistics and Registration Service Act 2007 and signifying compliance with the Code of Practice for Official Statistics. Designation can be broadly interpreted to mean that the statistics:
• meet identified user needs; • are well explained and readily accessible; • are produced according to sound methods; and • are managed impartially and objectively in the public interest.
Once statistics have been designated as National Statistics it is a statutory requirement that the Code of Practice shall continue to be observed.
6
2 January 2021 Key Findings
• Diagnostic test activity and waiting times have been impacted by the COVID-19 crisis, and data for the current reporting period may therefore not be comparable to previous periods.
• The total number of patients waiting six weeks or more from referral for one of the 15 key diagnostic tests at the end of January 2021 was 377,700. This was 33.3% of the total number of patients waiting at the end of the month.
• Nationally, the operational standard of less than 1% of patients waiting six weeks or more was not met this month.
• Compared with January 2020 the total number of patients waiting six weeks or more increased by 331,500, while the proportion of patients waiting six weeks or more increased by 28.9 percentage points.
• In the last 12 months, the proportion of patients waiting six weeks or more at the end of a month has varied between 2.8% (February 2020) and 58.5% (May 2020).
• At the end of January 2021, the test with the smallest proportion of patients waiting six weeks or more was Electrophysiology with 11.3%. The test with the highest proportion was Urodynamics, with 57.0% of patients waiting six weeks or more.
• An alternative measure of diagnostic waiting times is the average (median) waiting time. The estimated average time that a patient had been waiting for a diagnostic test was 3.2 weeks at the end of January 2021.
• There were 1,132,800 patients waiting for a key diagnostic test at the end of January 2021. This is an increase of 87,300 from January 2020. In the last 12 months the total number of patients waiting for a diagnostic test has increased, with a reduction in March as a result of the COVID-19 crisis followed by growth in the waiting list and some subsequent reductions.
• A total of 1,609,200 diagnostic tests were undertaken in January 2021. This is a decrease of 470,800 from January 2020. Monthly activity was increasing slightly until it fell sharply from March 2020 before services started to resume from May 2020 onwards.
7
3 National Trends This section analyses trends in monthly diagnostic waiting times and activity data that has been collected since January 2006.
3.1 6+ Week Waits
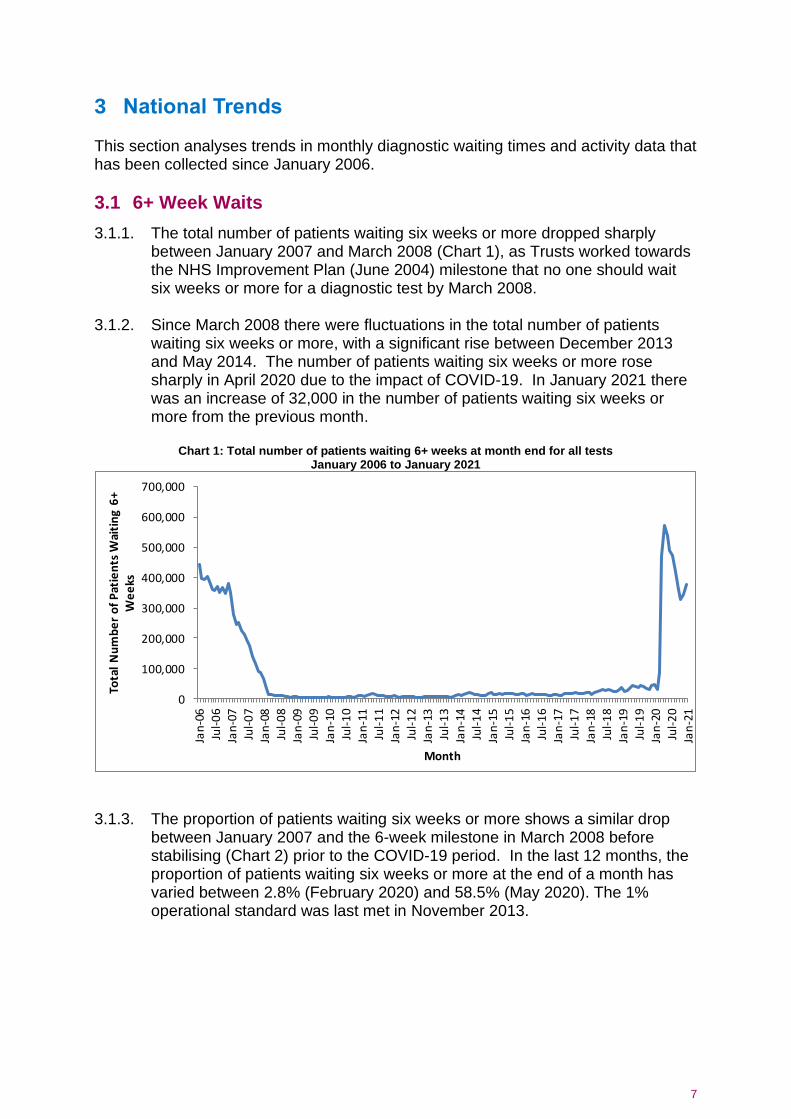
3.1.1. The total number of patients waiting six weeks or more dropped sharply between January 2007 and March 2008 (Chart 1), as Trusts worked towards the NHS Improvement Plan (June 2004) milestone that no one should wait six weeks or more for a diagnostic test by March 2008.
3.1.2. Since March 2008 there were fluctuations in the total number of patients
waiting six weeks or more, with a significant rise between December 2013 and May 2014. The number of patients waiting six weeks or more rose sharply in April 2020 due to the impact of COVID-19. In January 2021 there was an increase of 32,000 in the number of patients waiting six weeks or more from the previous month.
Chart 1: Total number of patients waiting 6+ weeks at month end for all tests
January 2006 to January 2021
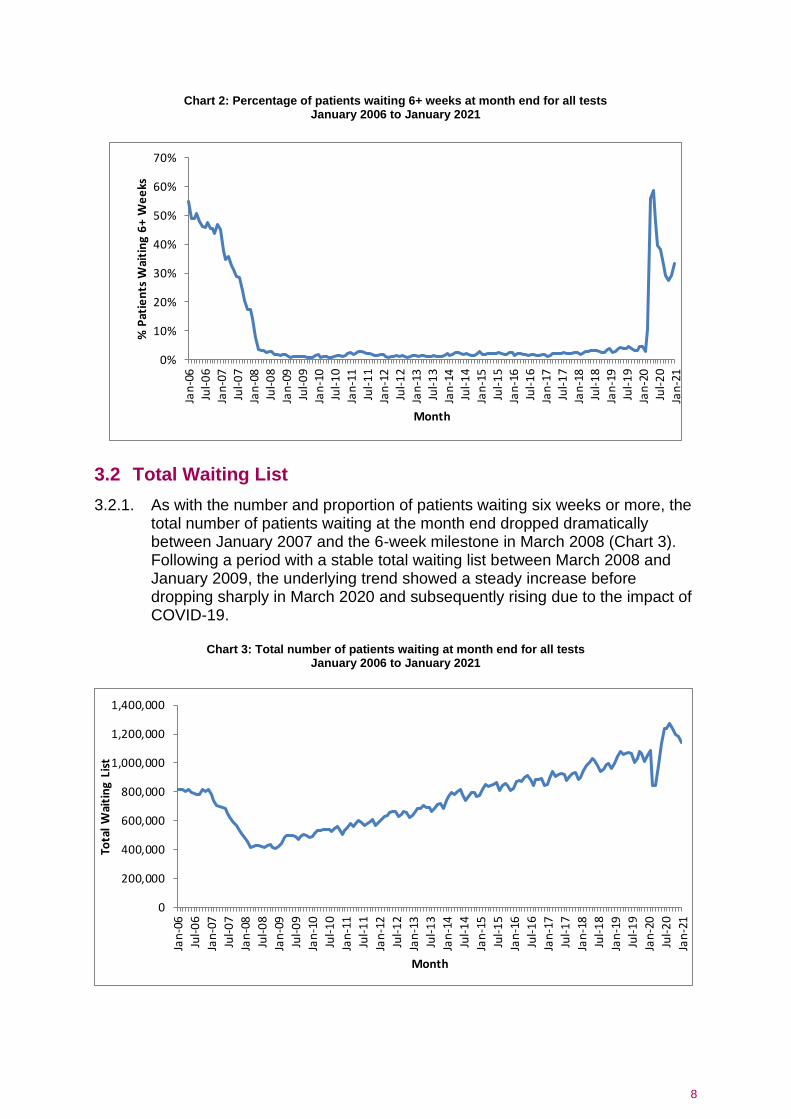
3.1.3. The proportion of patients waiting six weeks or more shows a similar drop
between January 2007 and the 6-week milestone in March 2008 before stabilising (Chart 2) prior to the COVID-19 period. In the last 12 months, the proportion of patients waiting six weeks or more at the end of a month has varied between 2.8% (February 2020) and 58.5% (May 2020). The 1% operational standard was last met in November 2013.
0
100,000
200,000
300,000
400,000
500,000
600,000
700,000
Jan
-06
Jul-
06
Jan
-07
Jul-
07
Jan
-08
Jul-
08
Jan
-09
Jul-
09
Jan
-10
Jul-
10
Jan
-11
Jul-
11
Jan
-12
Jul-
12
Jan
-13
Jul-
13
Jan
-14
Jul-
14
Jan
-15
Jul-
15
Jan
-16
Jul-
16
Jan
-17
Jul-
17
Jan
-18
Jul-
18
Jan
-19
Jul-
19
Jan
-20
Jul-
20
Jan
-21
Tota
l N
um
be
r o
f P
atie
nts
Wai
tin
g 6
+ W
ee
ks
Month
8
Chart 2: Percentage of patients waiting 6+ weeks at month end for all tests January 2006 to January 2021
3.2 Total Waiting List
3.2.1. As with the number and proportion of patients waiting six weeks or more, the total number of patients waiting at the month end dropped dramatically between January 2007 and the 6-week milestone in March 2008 (Chart 3). Following a period with a stable total waiting list between March 2008 and January 2009, the underlying trend showed a steady increase before dropping sharply in March 2020 and subsequently rising due to the impact of COVID-19.
Chart 3: Total number of patients waiting at month end for all tests
January 2006 to January 2021
0%
10%
20%
30%
40%
50%
60%
70%
Jan
-06
Jul-
06
Jan
-07
Jul-
07
Jan
-08
Jul-
08
Jan
-09
Jul-
09
Jan
-10
Jul-
10
Jan
-11
Jul-
11
Jan
-12
Jul-
12
Jan
-13
Jul-
13
Jan
-14
Jul-
14
Jan
-15
Jul-
15
Jan
-16
Jul-
16
Jan
-17
Jul-
17
Jan
-18
Jul-
18
Jan
-19
Jul-
19
Jan
-20
Jul-
20
Jan
-21
% P
atie
nts
Wai
tin
g 6
+ W
ee
ks
Month
0
200,000
400,000
600,000
800,000
1,000,000
1,200,000
1,400,000
Jan
-06
Jul-
06
Jan
-07
Jul-
07
Jan
-08
Jul-
08
Jan
-09
Jul-
09
Jan
-10
Jul-
10
Jan
-11
Jul-
11
Jan
-12
Jul-
12
Jan
-13
Jul-
13
Jan
-14
Jul-
14
Jan
-15
Jul-
15
Jan
-16
Jul-
16
Jan
-17
Jul-
17
Jan
-18
Jul-
18
Jan
-19
Jul-
19
Jan
-20
Jul-
20
Jan
-21
Tota
l W
aiti
ng
List
Month
9
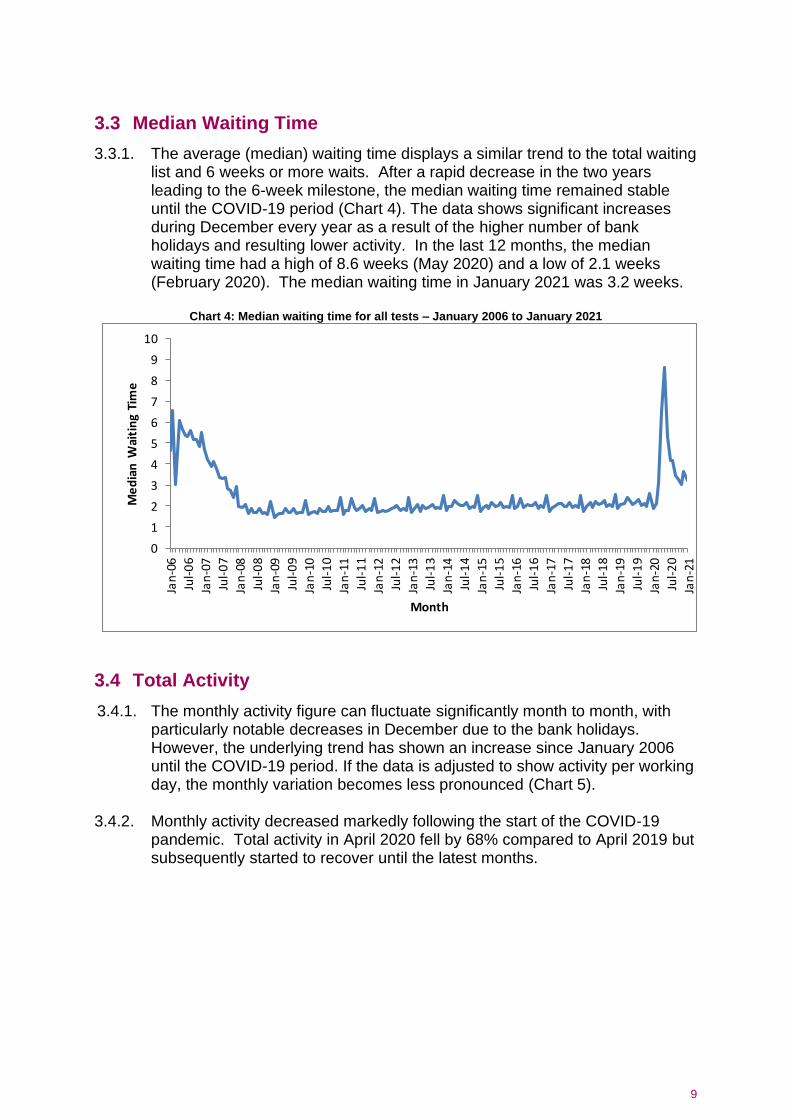
3.3 Median Waiting Time
3.3.1. The average (median) waiting time displays a similar trend to the total waiting list and 6 weeks or more waits. After a rapid decrease in the two years leading to the 6-week milestone, the median waiting time remained stable until the COVID-19 period (Chart 4). The data shows significant increases during December every year as a result of the higher number of bank holidays and resulting lower activity. In the last 12 months, the median waiting time had a high of 8.6 weeks (May 2020) and a low of 2.1 weeks (February 2020). The median waiting time in January 2021 was 3.2 weeks.
Chart 4: Median waiting time for all tests – January 2006 to January 2021
3.4 Total Activity
3.4.1. The monthly activity figure can fluctuate significantly month to month, with particularly notable decreases in December due to the bank holidays. However, the underlying trend has shown an increase since January 2006 until the COVID-19 period. If the data is adjusted to show activity per working day, the monthly variation becomes less pronounced (Chart 5).
3.4.2. Monthly activity decreased markedly following the start of the COVID-19
pandemic. Total activity in April 2020 fell by 68% compared to April 2019 but subsequently started to recover until the latest months.
0
1
2
3
4
5
6
7
8
9
10
Jan
-06
Jul-
06
Jan
-07
Jul-
07
Jan
-08
Jul-
08
Jan
-09
Jul-
09
Jan
-10
Jul-
10
Jan
-11
Jul-
11
Jan
-12
Jul-
12
Jan
-13
Jul-
13
Jan
-14
Jul-
14
Jan
-15
Jul-
15
Jan
-16
Jul-
16
Jan
-17
Jul-
17
Jan
-18
Jul-
18
Jan
-19
Jul-
19
Jan
-20
Jul-
20
Jan
-21
Me
dia
n W
aiti
ng
Tim
e
Month
10
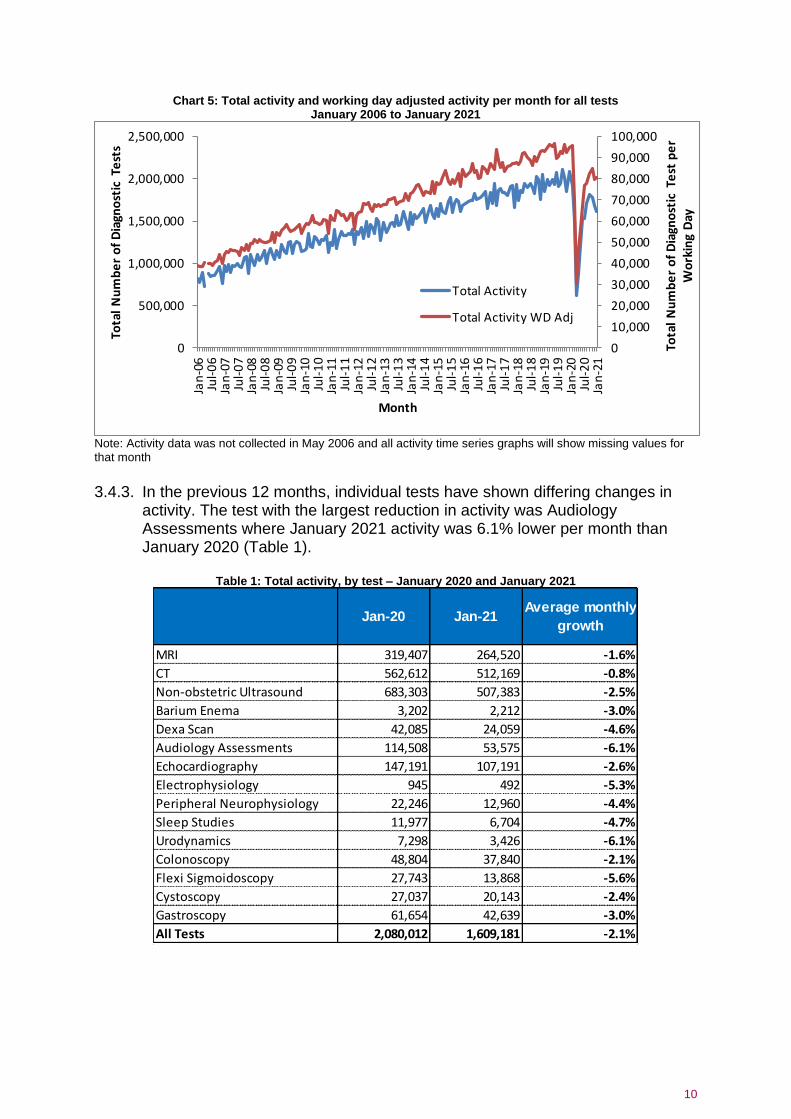
Chart 5: Total activity and working day adjusted activity per month for all tests January 2006 to January 2021
Note: Activity data was not collected in May 2006 and all activity time series graphs will show missing values for that month 3.4.3. In the previous 12 months, individual tests have shown differing changes in
activity. The test with the largest reduction in activity was Audiology Assessments where January 2021 activity was 6.1% lower per month than January 2020 (Table 1).
Table 1: Total activity, by test – January 2020 and January 2021
0
10,000
20,000
30,000
40,000
50,000
60,000
70,000
80,000
90,000
100,000
0
500,000
1,000,000
1,500,000
2,000,000
2,500,000
Jan
-06
Jul-
06
Jan
-07
Jul-
07
Jan
-08
Jul-
08
Jan
-09
Jul-
09
Jan
-10
Jul-
10
Jan
-11
Jul-
11
Jan
-12
Jul-
12
Jan
-13
Jul-
13
Jan
-14
Jul-
14
Jan
-15
Jul-
15
Jan
-16
Jul-
16
Jan
-17
Jul-
17
Jan
-18
Jul-
18
Jan
-19
Jul-
19
Jan
-20
Jul-
20
Jan
-21
Tota
l N
um
be
r o
f D
iagn
ost
ic T
est
pe
r W
ork
ing
Day
Tota
l N
um
be
r o
f D
iagn
ost
ic T
est
s
Month
Total Activity
Total Activity WD Adj
Jan-20 Jan-21Average monthly
growth
MRI 319,407 264,520 -1.6%
CT 562,612 512,169 -0.8%
Non-obstetric Ultrasound 683,303 507,383 -2.5%
Barium Enema 3,202 2,212 -3.0%
Dexa Scan 42,085 24,059 -4.6%
Audiology Assessments 114,508 53,575 -6.1%
Echocardiography 147,191 107,191 -2.6%
Electrophysiology 945 492 -5.3%
Peripheral Neurophysiology 22,246 12,960 -4.4%
Sleep Studies 11,977 6,704 -4.7%
Urodynamics 7,298 3,426 -6.1%
Colonoscopy 48,804 37,840 -2.1%
Flexi Sigmoidoscopy 27,743 13,868 -5.6%
Cystoscopy 27,037 20,143 -2.4%
Gastroscopy 61,654 42,639 -3.0%
All Tests 2,080,012 1,609,181 -2.1%

11
4 January 2021 Data This section analyses the January 2021 diagnostic waiting times and activity data and includes comparisons between tests, regions, providers and commissioners. 6+ week waits performance became significantly worse from March to May 2020 due to the impact of the COVID-19 crisis but started to improve from June.
4.1 6+ Week Waits
4.1.1. At the end of January 2021, there were a total of 377,700 patients waiting six weeks or more from referral for one of the 15 key diagnostic tests. This was 33.3% of the total number of patients waiting at the end of the month.
4.1.2. Compared with January 2020, the number of patients waiting six weeks or more increased by 331,500, while the proportion of patients waiting six weeks or more increased by 28.9 percentage points.
4.1.3. Compared with January 2020, the test with the largest increase in the
proportion of patients waiting six weeks or more was Gastroscopy, which increased by 44.5 percentage points. The test with the smallest increase was Electrophysiology, which increased by 7.6 percentage points (Table 2).
Table 2: Proportion of patients waiting 6+ weeks, by test – January 2020 and January 2021
Note: Figures may differ due to rounding.
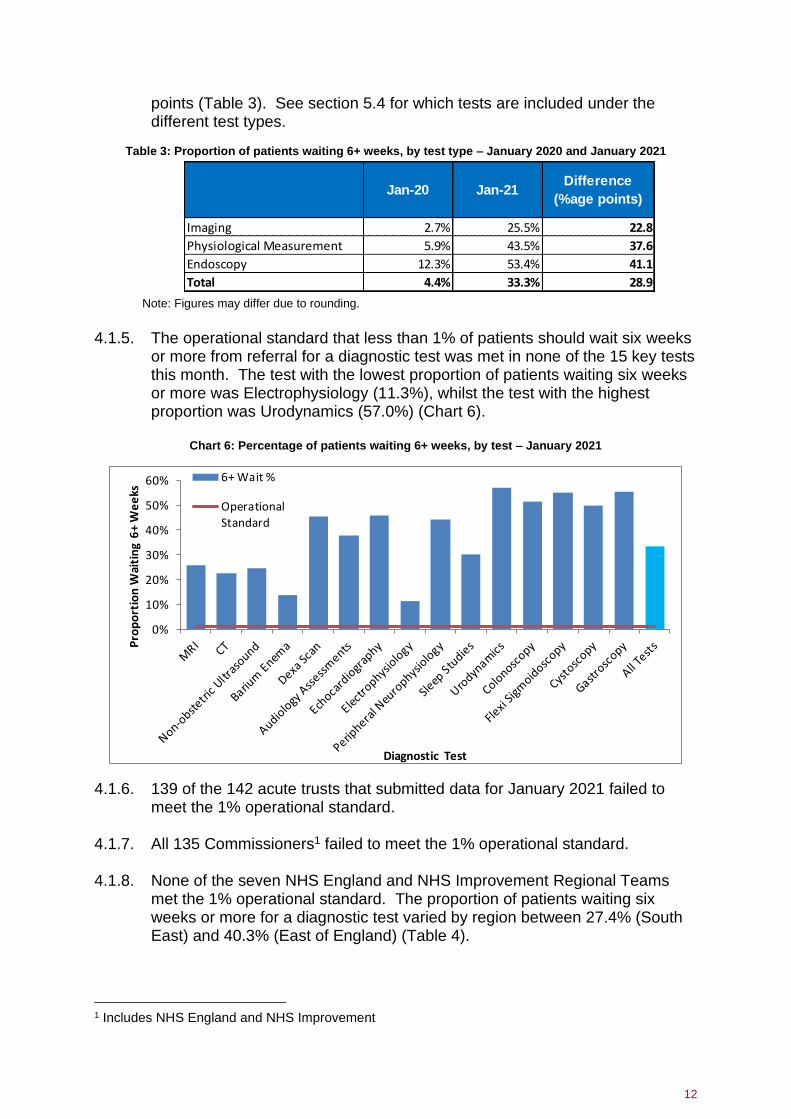
4.1.4. Compared with January 2020, the test type with the largest increase in the
proportion of patients waiting six weeks or more was Endoscopy with an increase of 41.1 percentage points. Physiological Measurement increased by 37.6 percentage points, while Imaging increased by 22.8 percentage
Jan-20 Jan-21Difference
(%age points)
MRI 4.3% 25.8% 21.5
CT 3.1% 22.5% 19.4
Non-obstetric Ultrasound 1.7% 24.4% 22.8
Barium Enema 1.4% 13.5% 12.1
Dexa Scan 1.2% 45.3% 44.2
Audiology Assessments 1.7% 37.8% 36.1
Echocardiography 6.9% 45.7% 38.8
Electrophysiology 3.6% 11.3% 7.6
Peripheral Neurophysiology 7.8% 44.0% 36.3
Sleep Studies 6.2% 30.0% 23.8
Urodynamics 16.9% 57.0% 40.1
Colonoscopy 15.0% 51.5% 36.5
Flexi Sigmoidoscopy 11.1% 55.0% 43.9
Cystoscopy 10.4% 49.9% 39.5
Gastroscopy 10.8% 55.4% 44.5
All Tests 4.4% 33.3% 28.9
12
points (Table 3). See section 5.4 for which tests are included under the different test types.
Table 3: Proportion of patients waiting 6+ weeks, by test type – January 2020 and January 2021
Note: Figures may differ due to rounding.
4.1.5. The operational standard that less than 1% of patients should wait six weeks
or more from referral for a diagnostic test was met in none of the 15 key tests this month. The test with the lowest proportion of patients waiting six weeks or more was Electrophysiology (11.3%), whilst the test with the highest proportion was Urodynamics (57.0%) (Chart 6).
Chart 6: Percentage of patients waiting 6+ weeks, by test – January 2021
4.1.6. 139 of the 142 acute trusts that submitted data for January 2021 failed to meet the 1% operational standard.
4.1.7. All 135 Commissioners1 failed to meet the 1% operational standard. 4.1.8. None of the seven NHS England and NHS Improvement Regional Teams
met the 1% operational standard. The proportion of patients waiting six weeks or more for a diagnostic test varied by region between 27.4% (South East) and 40.3% (East of England) (Table 4).
1 Includes NHS England and NHS Improvement
Jan-20 Jan-21Difference
(%age points)
Imaging 2.7% 25.5% 22.8
Physiological Measurement 5.9% 43.5% 37.6
Endoscopy 12.3% 53.4% 41.1
Total 4.4% 33.3% 28.9
0%
10%
20%
30%
40%
50%
60%
Pro
po
rtio
n W
aiti
ng
6+
We
eks
Diagnostic Test
6+ Wait %
Operational
Standard
13
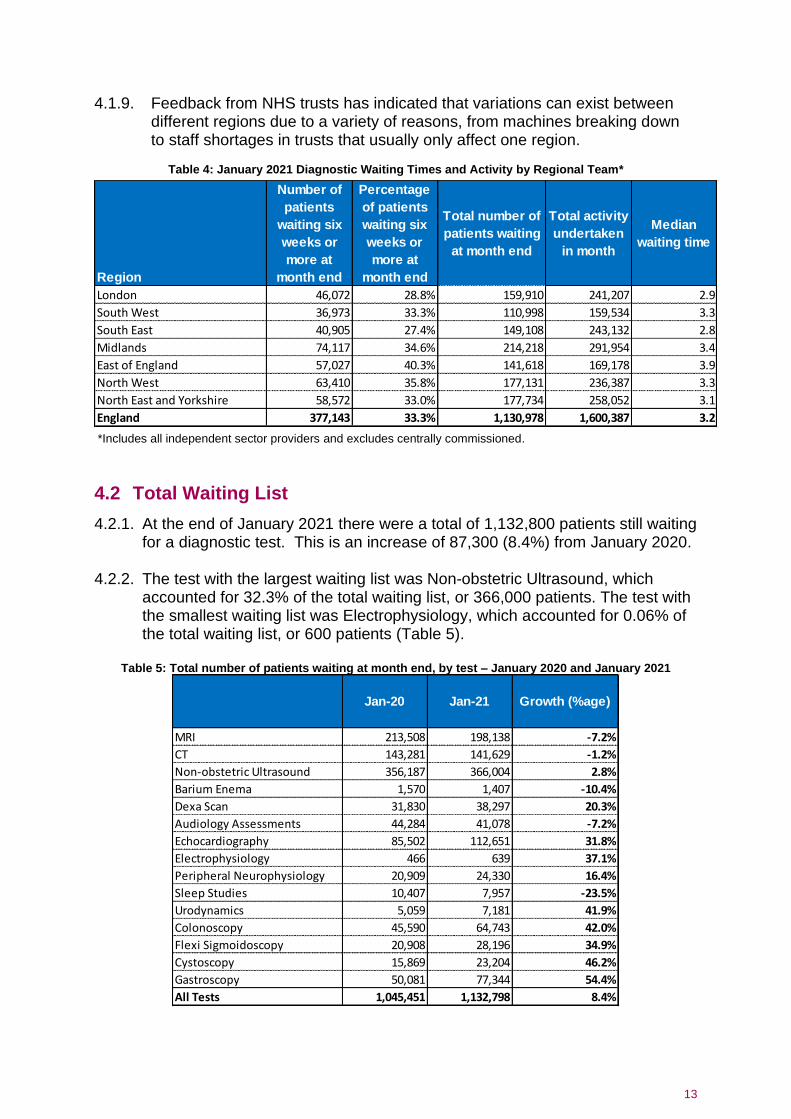
4.1.9. Feedback from NHS trusts has indicated that variations can exist between different regions due to a variety of reasons, from machines breaking down to staff shortages in trusts that usually only affect one region.
Table 4: January 2021 Diagnostic Waiting Times and Activity by Regional Team*
*Includes all independent sector providers and excludes centrally commissioned.
4.2 Total Waiting List
4.2.1. At the end of January 2021 there were a total of 1,132,800 patients still waiting for a diagnostic test. This is an increase of 87,300 (8.4%) from January 2020.
4.2.2. The test with the largest waiting list was Non-obstetric Ultrasound, which
accounted for 32.3% of the total waiting list, or 366,000 patients. The test with the smallest waiting list was Electrophysiology, which accounted for 0.06% of the total waiting list, or 600 patients (Table 5).
Table 5: Total number of patients waiting at month end, by test – January 2020 and January 2021
Region
Number of
patients
waiting six
weeks or
more at
month end
Percentage
of patients
waiting six
weeks or
more at
month end
Total number of
patients waiting
at month end
Total activity
undertaken
in month
Median
waiting time
London 46,072 28.8% 159,910 241,207 2.9
South West 36,973 33.3% 110,998 159,534 3.3
South East 40,905 27.4% 149,108 243,132 2.8
Midlands 74,117 34.6% 214,218 291,954 3.4
East of England 57,027 40.3% 141,618 169,178 3.9
North West 63,410 35.8% 177,131 236,387 3.3
North East and Yorkshire 58,572 33.0% 177,734 258,052 3.1
England 377,143 33.3% 1,130,978 1,600,387 3.2
Jan-20 Jan-21 Growth (%age)
MRI 213,508 198,138 -7.2%
CT 143,281 141,629 -1.2%
Non-obstetric Ultrasound 356,187 366,004 2.8%
Barium Enema 1,570 1,407 -10.4%
Dexa Scan 31,830 38,297 20.3%
Audiology Assessments 44,284 41,078 -7.2%
Echocardiography 85,502 112,651 31.8%
Electrophysiology 466 639 37.1%
Peripheral Neurophysiology 20,909 24,330 16.4%
Sleep Studies 10,407 7,957 -23.5%
Urodynamics 5,059 7,181 41.9%
Colonoscopy 45,590 64,743 42.0%
Flexi Sigmoidoscopy 20,908 28,196 34.9%
Cystoscopy 15,869 23,204 46.2%
Gastroscopy 50,081 77,344 54.4%
All Tests 1,045,451 1,132,798 8.4%

14
Note: Barium Enema is a test that should be replaced by Colonoscopy or CT Colonography, so the number of tests undertaken should be reducing.
4.2.3. The largest increase in the number of patients waiting by test has been for Gastroscopy, where the waiting list grew by 54.4% compared with January 2020.
4.3 Median Waiting Times
4.3.1. At the end of January 2021, the estimated median waiting time for all 15 diagnostic tests was 3.2 weeks from the time of referral, down from 3.6 weeks in the previous month. The test with the shortest median waiting time was Barium Enema at 1.9 weeks. The test with the longest median waiting time was Urodynamics at 7.3 weeks (Chart 7).
Chart 7: Median waiting time by test – January 2021
4.4 Total Activity
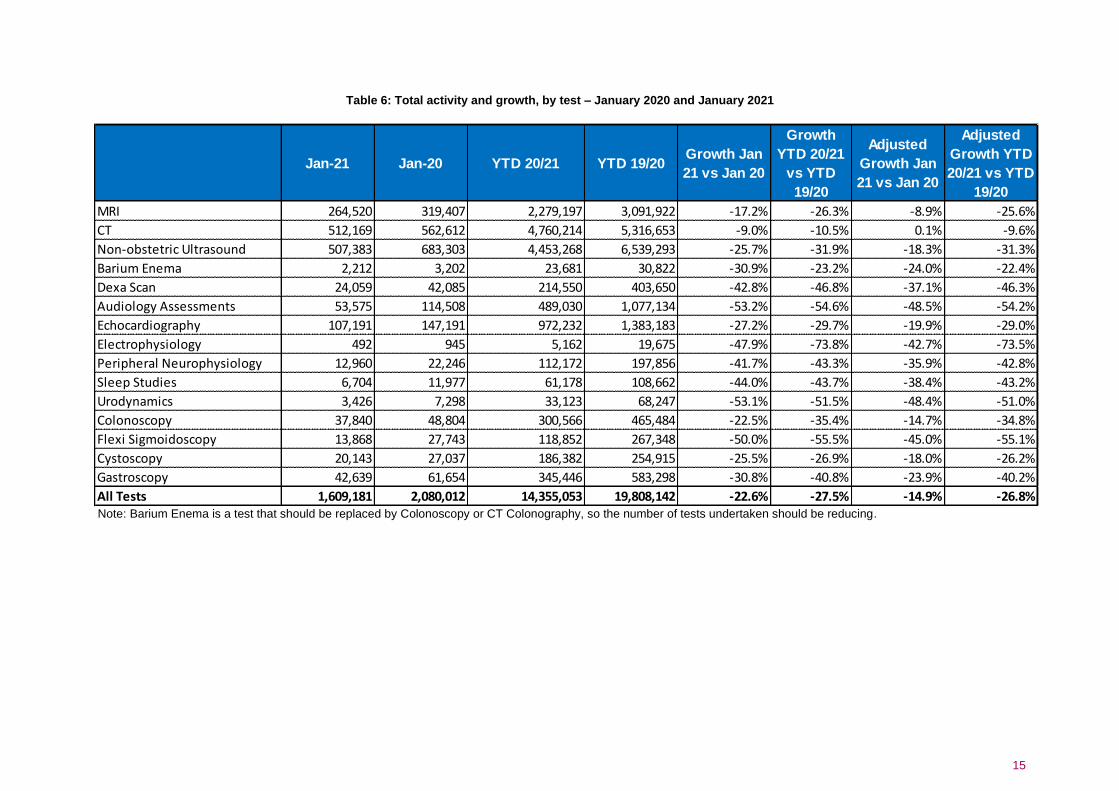
4.4.1. In total 1,609,200 of the 15 key diagnostic tests were performed during
January 2021. This is a decrease of 470,800 (14.9%) from January 2020 (Table 6).
4.4.2. The test with the highest activity was CT with 512,200 tests taking place. This accounted for 31.8% of all activity in January 2021. The test with the lowest activity was Electrophysiology with 500 tests taking place. This accounted for 0.03% of all activity this month.
4.4.3. The number of tests conducted over the last 12 months has decreased by 24.5% from the same period last year.
0.00
1.00
2.00
3.00
4.00
5.00
6.00
7.00
8.00
Me
dia
n W
aiti
ng
Tim
e (
We
eks
)
Diagnostic Test
15
Table 6: Total activity and growth, by test – January 2020 and January 2021
Note: Barium Enema is a test that should be replaced by Colonoscopy or CT Colonography, so the number of tests undertaken should be reducing.
Jan-21 Jan-20 YTD 20/21 YTD 19/20Growth Jan
21 vs Jan 20
Growth
YTD 20/21
vs YTD
19/20
Adjusted
Growth Jan
21 vs Jan 20
Adjusted
Growth YTD
20/21 vs YTD
19/20
MRI 264,520 319,407 2,279,197 3,091,922 -17.2% -26.3% -8.9% -25.6%
CT 512,169 562,612 4,760,214 5,316,653 -9.0% -10.5% 0.1% -9.6%
Non-obstetric Ultrasound 507,383 683,303 4,453,268 6,539,293 -25.7% -31.9% -18.3% -31.3%
Barium Enema 2,212 3,202 23,681 30,822 -30.9% -23.2% -24.0% -22.4%
Dexa Scan 24,059 42,085 214,550 403,650 -42.8% -46.8% -37.1% -46.3%
Audiology Assessments 53,575 114,508 489,030 1,077,134 -53.2% -54.6% -48.5% -54.2%
Echocardiography 107,191 147,191 972,232 1,383,183 -27.2% -29.7% -19.9% -29.0%
Electrophysiology 492 945 5,162 19,675 -47.9% -73.8% -42.7% -73.5%
Peripheral Neurophysiology 12,960 22,246 112,172 197,856 -41.7% -43.3% -35.9% -42.8%
Sleep Studies 6,704 11,977 61,178 108,662 -44.0% -43.7% -38.4% -43.2%
Urodynamics 3,426 7,298 33,123 68,247 -53.1% -51.5% -48.4% -51.0%
Colonoscopy 37,840 48,804 300,566 465,484 -22.5% -35.4% -14.7% -34.8%
Flexi Sigmoidoscopy 13,868 27,743 118,852 267,348 -50.0% -55.5% -45.0% -55.1%
Cystoscopy 20,143 27,037 186,382 254,915 -25.5% -26.9% -18.0% -26.2%
Gastroscopy 42,639 61,654 345,446 583,298 -30.8% -40.8% -23.9% -40.2%
All Tests 1,609,181 2,080,012 14,355,053 19,808,142 -22.6% -27.5% -14.9% -26.8%

16
5 Annex
5.1 Methodology
5.1.1. NHS England and NHS Improvement compiles diagnostic waiting time and activity data through a central return. Data collected includes:
• The number of patients waiting at the month end, split by test and week.
• Total activity classified as either Waiting List tests (excluding planned), Planned tests, or Unscheduled tests.
5.1.2. Providers submit data to NHS England and NHS Improvement via SDCS
where it is checked and signed off by commissioners. For further details on how the data is collected and the SDCS system, please refer to the NHSE Collection Guidance.
5.2 Data Revisions
5.2.1. Revisions to published figures are released on a six-monthly basis and in accordance with the NHS England’s revision policy. For more information on the revision policy please refer to the SDCS Revisions Policy Document. Revisions were last published in April 2020 for the months July 2019 through to January 2020.
5.3 Data Availability
5.3.1. Monthly diagnostic waiting time and activity data is published on a monthly timetable. A full calendar of all statistical publications can be found here.
5.4 Glossary
Clinical Commissioning Group (CCG) A group of GP practices, which working with other healthcare professionals and in partnership with local communities and local authorities, commission NHS services for patients within their local communities. Endoscopy A categorisation of diagnostic tests that include: Colonoscopy; Flexi Sigmoidoscopy; Cystoscopy and Gastroscopy. Imaging A categorisation of diagnostic tests that include: Magnetic Resonance Imaging (MRI); Computed Tomography (CT); Non-obstetric Ultrasound; Barium Enema and DEXA Scan. Median Waiting Time A measurement of the average time patients have been waiting for a diagnostic test. The median is the middle value when waiting times are put in numerical order. 50% of patients have been waiting less than the median. The median is the preferred measurement of average waiting time as it is less susceptible to extreme values than the mean.
17
Physiological Measurement A categorisation of diagnostic tests that include: Audiology Assessments; Echocardiology; Electrophysiology: Peripheral Neurophysiology; Sleep Studies and Urodynamics. Provider An organisation that provides NHS treatment or care, for example, an NHS Acute Trust, Mental Health Trust, Community provider, or an Independent Sector organisation. Region One of seven geographical areas of NHS England and NHS Improvement responsible for the quality, financial and operational performance of all NHS organisations in their region.
5.5 Feedback Welcomed
We welcome feedback on the content and presentation of statistics within this report and those published on the NHS England website. If you have any comments on this, or any other issues regarding these statistics, then please email [email protected] Alternatively, we welcome your comments via our user feedback form here. Feedback about the user’s experiences of using these statistics is available here.
5.6 Consultation
Between 8 February 2018 and 5 April 2018, NHS England and NHS Improvement consulted on the future of the Quarterly Diagnostics Census and Monthly Diagnostics Waiting Times and Activity Returns. The outcome document for the consultation was published 30 January 2020 and confirmed the decision to stop collecting the Quarterly Diagnostics Census on a permanent basis and to continue the monthly diagnostics waiting times and activity return (DM01) in its current form. Find out more at: https://www.engage.england.nhs.uk/consultation/diagnostics-census-waiting-times-activity-return
5.7 Additional Information
Full details of diagnostics data for individual organisations are available here. For press enquiries please contact the NHS England media team on 0113 825 0958 or 0113 825 0959. Email enquiries should be directed to [email protected] The Government Statistical Service (GSS) statistician responsible for producing these data is: Sheila Dixon Email: [email protected] Performance Analysis Team (Central), NHS England and NHS Improvement Room 5E15, Quarry House, Quarry Hill, Leeds LS2 7UE