Diagnostic and analytical techniques for advanced ... · Diagnostic and analytical techniques for...
19
Diagnostic and analytical techniques for advanced materials and nanostructures Michele Muccini Istitute for Nanostructure Materials CNR Research Area Roma 1, Montelibretti [email protected]
Transcript of Diagnostic and analytical techniques for advanced ... · Diagnostic and analytical techniques for...

Diagnostic and analytical techniques for advanced materials and nanostructures
Michele Muccini Istitute for Nanostructure Materials
CNR Research Area Roma 1, Montelibretti

2
q GlimpseonCNRResearchArea-Roma1researchinfrastructure
Outline
q Exsitucharacteriza<on&diagnos<ctechniquesØ SEM-EDSØ Auger&X-rayPhotoelectronSpectroscopyØ CombineduseofSEM,EDS,XPSØ RamanandIRSpectroscopyØ SPMØ LaserScanningSpectroscopy
q Poten<alandperspec<ves

3

4
www.mlib.cnr.it
700employees37,000sqmtechnologicalinfrastructure’sarea.
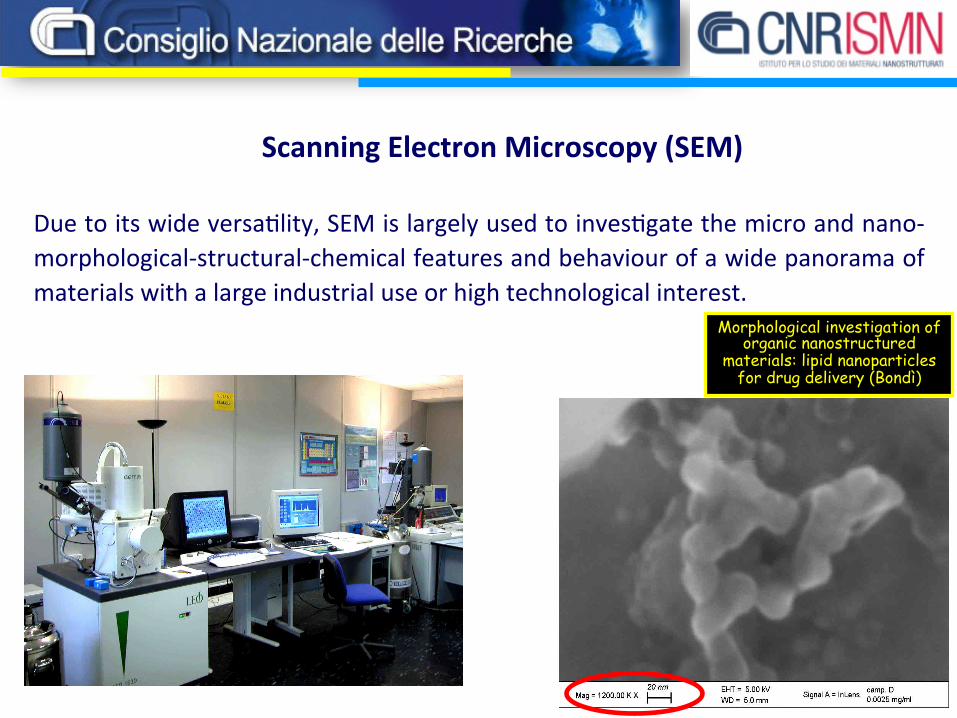
Duetoitswideversa<lity,SEMislargelyusedtoinves<gatethemicroandnano-morphological-structural-chemicalfeaturesandbehaviourofawidepanoramaofmaterialswithalargeindustrialuseorhightechnologicalinterest.
Morphological investigation of organic nanostructured
materials: lipid nanoparticles for drug delivery (Bondì)
ScanningElectronMicroscopy(SEM)

Processevalua>onofmicroelectroniccomponentsproduc>on
Structural and morphological study of thin films multi-layered structures for electronic devices
Micro-patterning: study of ablation defects
Investigation of the deposition processes of TiN protective films
TiN 240 nm
SiO2
Si
Optimisation of the ITO deposition
parameters

Produc>onandanalysisofepoxyresinsforthepackagingofavionicsystemcomponents
Dispersion of graphene platelets
The morphological investigation has guided the synthesis and the dispersion procedures of nanostructures improving: • the electrical conductivity of 1100 %; • the thermal conductivity of 470 %.
Dispersion of CNTs e AuNPs
Dispersion of CNTs

Cross sections of Ni-based superalloys (Nimonic 80 A, MM002).
SEM images and EDS spectra describe the protective oxide
multilayered structure.
FailureanalysisofjetengineturbinebladesDegrada<onmechanismsiden<fied
SEM-EDSmorphologicalandchemicalanalysis

Auger & X-ray Photoelectron Spectroscopy
B.E. Ef K.E. E3 E2 E1
hν
e-
BE = hν – KE – φspec
e-
KE123 = KE1 – KE2 – KE*3
VB SPECTRUM
CORE LEVEL SPECTRUM (XPS)
AUGER SPECTRUM (AES) Ø SURFACE CHEMICAL COMPOSITION (1-10 nm)
Ø CHEMICAL IMAGING

Ø SURFACE CHEMICAL COMPOSITION (1-10 nm)
Ø CHEMICAL IMAGING
Ag MNN image
Au NOO image
Ar+ Ø ION SPUTTERING
Electron-gun
C 1s GRAPH.
C 1s CARB.
Si 2p

TBC deposited on a jet engine turbine blade (25.5 wt% CeO2–2.5 Y2O3 – ZrO2) after a thermal cycling test. The coating fracture has been caused by impurities (Si, Al, Na) segregation phenomena inducing also a columnar growth.
Combined XPS and SEM analysis allows: • to optimise the production processes; • to evaluate the durability and reliability • to prevent catastrophic failure
Si 2p
70 80 90 100 110 120 1300
1x10⁵
TBC 1 TBC 2 TBC 3 TBC 4
Phot
oem
issi
on in
tens
ity (a
u)
Binding energy (BE)
2
4
3
1
XPSspectraofTBCsproducedbyadop>ngdifferentdeposi>onparameters(energyregionAl2p,Si2p,Fe3s,Ce4d)
Al2p
Fe3sSi2p
Ce4d
Coa>ngsofturbinebladesandcombus>onchamberinjetengines

Renishaw2000µ-Ramanwith a Pel<er cooledCCD camera inconjunc<onwithaLeicaop>calmicroscopeandlaserexcita<on
Raman spectroscopy is a scaTering technique based on theinelas<cscaTeringofincidentradia<onthroughitsinterac<onwithvibra<ngmolecules(Ramaneffect).
The vibra<on modes of a substancedependon:Ø massoftheatomsØ bondingforcesØ symmetriesofthemoleculesTherefore, the Raman spectrum of amolecule corresponds to a "fingerprint"withwhichtoiden<fyit.
µ-Ramanspectroscopy

500 1000 1500
100 120 140 160 180 200
R
aman
Inte
nsity
(a.u
.)
Raman Shift (cm-1)
0 1 2 3 4 5151.1
151.2
151.3
151.4
151.5
151.6
151.7
151.8
% Eu
FWHM
Eg p
ositio
n (c
m-1)
Eg FWHM
23
24
25
26
27
28
R
aman
Inte
nsity
(a.u
.)
Raman Shift (cm-1)
TiO2 0.5% Eu 1.0% Eu 2.0% Eu 3.0% Eu 5.0% Eu
G/DandG-/G+ra<osareindicatorsofsamplequalityandconduc<vityofthesample
RadialBreathingMode(RBM)isdirectlyrelatedtothediameterofnanotubes
1800 1600 1400 1200 300 200 1000
5000
10000
15000
20000
25000
D
G-
ChT60 ChT90 ChT99
Ram
an In
tens
ity
Wavenumber/cm-1
G+
RBM
stretching mode in the graphite plane
disorder band
⎟⎟⎠
⎞⎜⎜⎝
⎛ Δ⋅⎟⎠
⎞⎜⎝
⎛−
+=
0112
ωω
υυ
σ G
Molecular self assembly
diamondlikecarbonDLC
Evalua<onofinternalstressofaDLCfilmonaSisubstrate:
Eu-TiO2NCsfunc:onalizedco<on
carbonnanotubes

ATR-FTIRspectroscopyforCulturalHeritage
Inves<ga<onofthecomposi<onofdegrada<onproductsoncopper-basedworksofart.
Analysisofpa<nacomposi<on:ü Iden<fica<on of degrada<on products on
c o p p e r - b a s e d a l l o y s , a s c o p p e rhydroxyclhoridesandhydroxysulphates
ü D i s<ngu i s h d eg r ada<on p r odu c t spolymorphs with different chemicalreac<vity(asclinoatacamiteandatacamite)
3600 3400 3200 3000 1000 900 800 700 600
0,00
0,05
0,10
0,15
0,20
+
C uprite+
C linoa tacamite
*
°**
*
*
*
P A -C lig htg reena reaP A -C g reena reaP A -C reda rea
Abs
orba
nce(a.u.)
W avenumber(cm -1)
*
°
°
*A tacamite
° **
*
* °
*
*
3600 3400 3200 3000 1200 1000 800 600
P A -D g reen-blue a reaP A -D reda rea
Abs
orba
nce(a.u.)
W avenumber(cm -1)
Copperhydroxyclhoridedegrada>onproducts
Copperhydroxysulphatedegrada>onproducts
G. Di Carlo et al., Applied Surface Science 421 (2017) 120–127
Adolfo Wildt

SPM
Surface potential
Mechanical properties
Mechanical properties
Electrical properties
Electrical properties
Magnetic properties
Single molecules properties
Topography
Surface Friction
Mechanical properties of soft matter

Time-resolved micro-spectroscopy laboratory
Confocal laser scanning microscope image
PL spectrum PL temporal decay
q Spatially resolved (<300 nm) q Energy resolved q Time resolved (2 ps) q Temperature 450 – 4,2 K

20 µm
500 525 550 575 600 625 650 675 700
PL in
tens
ity [a
.u.]
Wavelength [nm]
Molecular orientation
Correlation morphology-structure-function in composite systems AFM CLSM Localized PL spectrum
Nature Materials, 4 (2005) 81
18
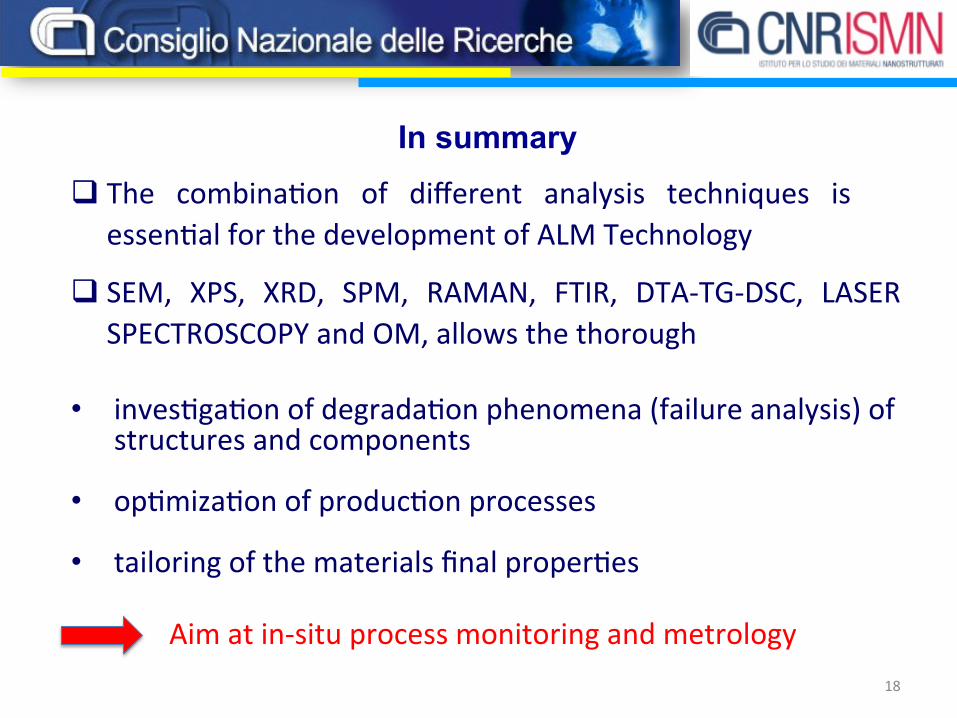
q SEM, XPS, XRD, SPM, RAMAN, FTIR, DTA-TG-DSC, LASERSPECTROSCOPYandOM,allowsthethorough
• inves<ga<onofdegrada<onphenomena(failureanalysis)ofstructuresandcomponents• op<miza<onofproduc<onprocesses• tailoringofthematerialsfinalproper<es
In summaryq The combina<on of different analysis techniques is
essen<alforthedevelopmentofALMTechnology
Aimatin-situprocessmonitoringandmetrology

19
AcknowledgmentsElectron&Op>calMiscroscopyLabIngoRiccucciMessinaPascucci
RamanSpectrocopyLabDeCaroRuani
FTIRSpectrocopyLabDiCarloGiulianiIngo
SPMLabLeoCerriPadele`ValleBrucaleAlbone`
LaserScanningMicro-SpectrocopyLabToffaninBolognesi
SurfaceAnalysisLabKaciulisMezzi
Thankyou!
PECVD–MOCVDLabCascheraToroFederici
XRDLabVeroli
Someoftheprojects@ISMNMlibMIUR-PONPANREXEU-NANORESTARTEU-HERACLESEU-MOSTOPHOSMinDifesa–FABRICSAFEEU-INNOVACONCRETE


![Problems and deficiencies of UML as a requirements ...csis.pace.edu/~marchese/CS775/Papers/glinz_prob_defc_uml.pdf · Inverardi and Muccini for this workshop [7]. As this case study](https://static.fdocuments.us/doc/165x107/5fb3eb7f98b22e1ddb42d319/problems-and-deficiencies-of-uml-as-a-requirements-csispaceedumarchesecs775papersglinzprobdefcumlpdf.jpg)