DIAGNOSIS OF ELEVENTH GRADE STUDENTS’ …etd.lib.metu.edu.tr/upload/12606660/index.pdf ·...
141
DIAGNOSIS OF ELEVENTH GRADE STUDENTS’ MISCONCEPTIONS ABOUT GEOMETRIC OPTIC BY A THREE-TIER TEST A THESIS SUBMITTED TO THE GRADUATE SCHOOL OF NATURAL AND APPLIED SCIENCES OF MIDDLE EAST TECHNICAL UNIVERSITY BY YASIN KUTLUAY IN PARTIAL FULFILLMENT OF THE REQUIREMENTS FOR THE DEGREE OF MASTER OF SCIENCE IN SECONDARY SCIENCE AND MATHEMATICS EDUCATION SEPTEMBER 2005
Transcript of DIAGNOSIS OF ELEVENTH GRADE STUDENTS’ …etd.lib.metu.edu.tr/upload/12606660/index.pdf ·...

DIAGNOSIS OF ELEVENTH GRADE STUDENTS’ MISCONCEPTIONS ABOUT GEOMETRIC OPTIC BY A THREE-TIER TEST
A THESIS SUBMITTED TO THE GRADUATE SCHOOL OF NATURAL AND APPLIED SCIENCES
OF MIDDLE EAST TECHNICAL UNIVERSITY
BY
YASIN KUTLUAY
IN PARTIAL FULFILLMENT OF THE REQUIREMENTS FOR
THE DEGREE OF MASTER OF SCIENCE IN
SECONDARY SCIENCE AND MATHEMATICS EDUCATION
SEPTEMBER 2005

Approval of the Graduate School of Natural and Applied Sciences. __________________________ Prof. Dr. Canan ÖZGEN Director I certify that this thesis satisfies all the requirements as a thesis for the degree of Master of Science. __________________________ Prof. Dr. Ömer GEBAN Head of Department This is to certify that we have read this thesis and that in our opinion it is fully adequate, in scope and quality, as a thesis for the degree of Master of Science. __________________________ Assist. Prof. Dr. Ali ERYILMAZ Supervisor Examining Committee Members Assoc. Prof. Dr. Bilal GÜNEŞ (Gazi Univ., SSME) _____________ Assist. Prof. Dr. Ali ERYILMAZ (METU, SSME) _____________ Assoc. Prof. Dr. Safure BULUT (METU, SSME) _____________ Assist. Prof. Dr. Jale ÇAKIROĞLU (METU, ELE) _____________ Dr. Mehmet SANCAR (METU, SSME) _____________

iii
I hereby declare that all information in this document has been obtained and presented in accordance with academic rules ethical conduct. I also declare that, as required by these rules and conduct, I have fully cited and referenced all material and results that are not original to this work.
Name, Last name : Yasin KUTLUAY Signature :

iv
ABSTRACT
DIAGNOSIS OF ELEVENTH GRADE STUDENTS’ MISCONCEPTIONS ABOUT GEOMETRIC OPTIC BY A THREE-TIER TEST
Kutluay, Yasin
M.S., Department of Secondary Science and Mathematics Education
Supervisor: Assist. Prof. Dr. Ali ERYILMAZ
September 2005, 127 pages
The main purpose of this study was developing a three-tier test for
assessing 11th grade students’ misconceptions about geometric optic. The
accessible population was all 11th grade science students in Bayrampaşa,
Istanbul. While developing the test, interviews and open-ended tests were
used to collect data to create the three-tier test. An interview questionnaire
was developed based on the literature review. 15 11th grade students were
interviewed by this questionnaire. Then, an open-ended test was created
based on the interview results and also the literature review. It was applied
to 114 11th grade science students. The responses of the students for each
item were categorized considering the frequencies. Then, these categories
were used in the development of the Three-tier Geometric Optic
Misconception Test (TTGOMT). The categories were used as the distracters
of the items in the TTGOMT. Besides, some of the distracters were
extracted from the interview results and the literature review even if they
had no frequencies in open-ended test results. The test was applied to the
141 11th grade high school students. A factor analysis was conducted to
establish the content validity of the TTGOMT and five categories were
found. Also, the proportions of the false positives and false negatives were
v
estimated to establish the content validity and found 28.2 % for the false
positives and 3.4 % for false negatives. The construct validity was
established by estimating a correlation between the scores of the students for
the first two tiers and confidence levels for the third tier. Two reliability
analyses were conducted by using Cronbach alpha. One of the reliability
analyses was estimated based on the correct answers of the students for all
the three tiers together and found 0.55. The other one was estimated based
on the misconceptions of the students and found 0.28. Moreover, item
analysis was done for each item by using Iteman program.
Keywords: Physics Education, Misconceptions, Geometric Optic,
Misconception Test, Three-tier Misconception test
vi
ÖZ
11. SINIF ÖĞRENCİLERİNİN GEOMETRİK OPTİK HAKKINDAKİ KAVRAM YANILGILARINI ÖLÇEN ÜÇ-AŞAMALI TEST
GELİŞTİRME
Kutluay, Yasin
Yüksek Lisans, Ortaöğretim Fen ve Matematik Alanları Eğitimi Bölümü
Tez Yöneticisi: Yrd. Doç. Dr. Ali ERYILMAZ
Eylül 2005, 127 sayfa
Bu çalışmanın asıl amacı 11. sınıf öğrencilerinin geometrik optik
hakkındaki kavram yanılgılarını ölçen üç-aşamalı test geliştirmektir.
Çalışılabilir populasyonu İstanbul’un Bayrampaşa ilçesindeki tüm 11. sınıf
fen grubu öğrencileridir. Testin oluşum aşamasında gerekli olan veriyi
toplamak için bire-bir mülakatlar ve açık-uçlu sorular kullanıldı. Literatür
sonuçlarına dayanarak bir mülakat formu geliştirildi ve 15 onbirinci sınıf
fen öğrencisi mülakat edildi. Sonra, mülakat sonuçları ve aynı zamanda
literatür sonuçları da göz önünde tutularak açık-uçlu bir test geliştirildi. Bu
test 141 onbirinci sınıf öğrencisine uygulandı. Öğrencilerin her bir soru için
verdiği cevaplar frekanslarına göre kategorize edildi. Bu kategoriler Üç-
aşamalı Geometrik Optik Kavram Yanılgısı Testinin (ÜAGOKYT)
çeldiricilerini oluşturmak için kullanıldı. Bazı çeldiriciler açık-uçlu test
sonuçlarında frekansları olmasa bile mülakat ve literatür sonuçlarından

vii
oluşturuldular. Test 141 onbirinci sınıf fen öğrencisine uygulandı.
ÜAGOKYT’ nin içerik geçerliliğini oluşturmak için faktör analiz yapıldı ve
5 faktör bulundu. Faktör analizden başka, içerik güvenirliği için yanlış
sebepli doğruların ve doğru sebepli yanlışların oranları hesaplandı. Yanlış
sebepli doğruların oranı % 28.2 ve doğru sebepli yanlışların oranı % 3,4
bulundu. Yapısal geçerlilik için, öğrencilerin ilk iki basamağa verdikleri
cevaplardan aldıkları puanlarla üçüncü basamakta belirttikleri özgüvenleri
arasındaki korelasyon hesaplandı. Testin güvenirliği için iki güvenirlik
analizi Cronbach alpha katsayısıyla hesaplandı. İlk olarak, öğrencilerin
testte üç aşamaya birden verdiği doğru cevaplar üzerinden güvenirlik analizi
yapıldı ve Cronbach alpha 0,55 bulundu. Diğer güvenirlik analizi
öğrencilerin 3 aşamaya birden verdikleri cevaplarla ortaya çıkan kavram
yanılgıları üzerinden yapıldı ve Cronbach alpha 0,28 bulundu. Bunlardan
başka, testteki her bir soru için Iteman programını kullanarak soru analizi
yapıldı.
Anahtar Kelimeler: Fizik Eğitimi, Kavram yanılgıları, Geometrik Optik,
Kavram Yanılgısı Testi, Üç-aşamalı Kavram Yanılgısı Testi

viii
To My Parents
ix
ACKNOWLEDGMENTS
I would like to thank my supervisor Assist. Prof. Dr. Ali ERYILMAZ for
his valuable guidance and help throughout the study.
I am grateful to my parents who provided valuable support throughout
my life and this study. Thank you for your encouragement and patience.
I want to thank my friends; Ertuğrul, Vedat and Gökhan for their valuable
contributions and supports to the study.
My special thanks go to Haki Peşman for his valuable support and
contributions.
I also wish to express my deep appreciation to the administrators and
teachers who helped to enable this study. I also want to thank to the students
who participated in the study and gave time.
x
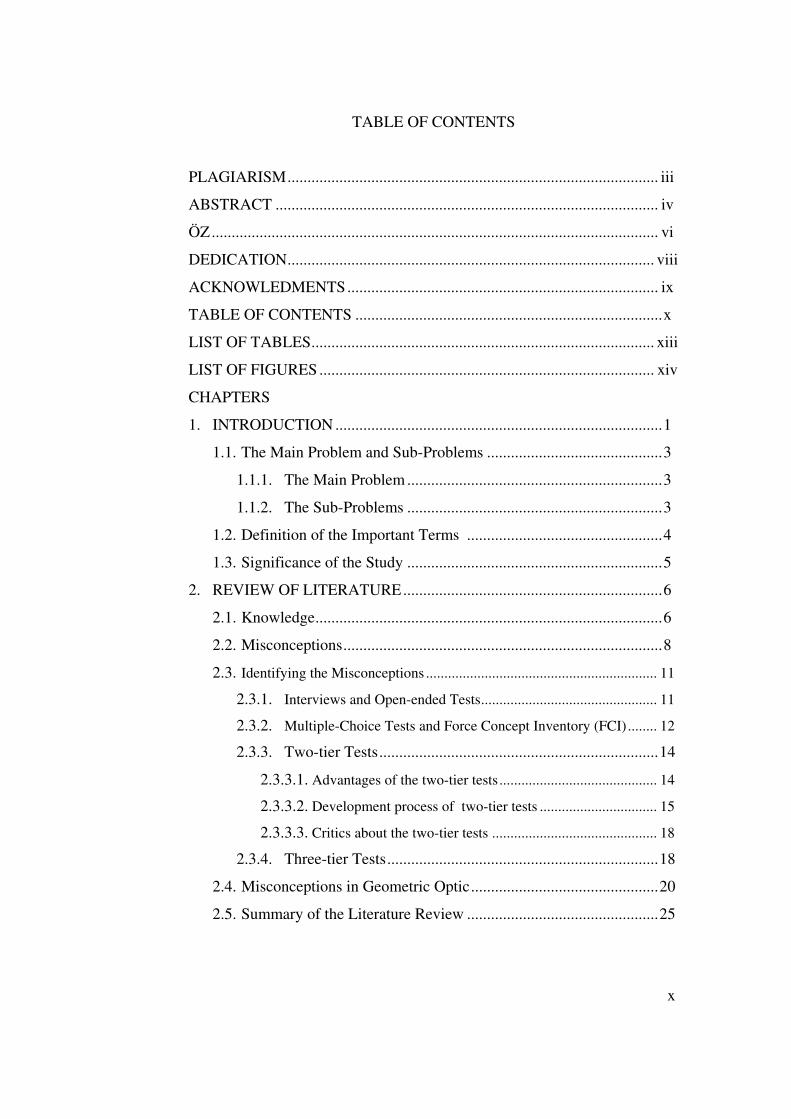
TABLE OF CONTENTS
PLAGIARISM............................................................................................. iii
ABSTRACT ................................................................................................ iv
ÖZ................................................................................................................ vi
DEDICATION............................................................................................ viii
ACKNOWLEDMENTS.............................................................................. ix
TABLE OF CONTENTS .............................................................................x
LIST OF TABLES...................................................................................... xiii
LIST OF FIGURES .................................................................................... xiv
CHAPTERS
1. INTRODUCTION ..................................................................................1
1.1. The Main Problem and Sub-Problems ............................................3
1.1.1. The Main Problem ................................................................3
1.1.2. The Sub-Problems ................................................................3
1.2. Definition of the Important Terms .................................................4
1.3. Significance of the Study ................................................................5
2. REVIEW OF LITERATURE.................................................................6
2.1. Knowledge.......................................................................................6
2.2. Misconceptions................................................................................8
2.3. Identifying the Misconceptions ............................................................... 11
2.3.1. Interviews and Open-ended Tests................................................ 11
2.3.2. Multiple-Choice Tests and Force Concept Inventory (FCI)........ 12
2.3.3. Two-tier Tests......................................................................14
2.3.3.1. Advantages of the two-tier tests........................................... 14
2.3.3.2. Development process of two-tier tests ................................ 15
2.3.3.3. Critics about the two-tier tests ............................................. 18
2.3.4. Three-tier Tests....................................................................18
2.4. Misconceptions in Geometric Optic...............................................20
2.5. Summary of the Literature Review ................................................25

xi
3. METHODOLOGY ................................................................................29
3.1. Research Design .............................................................................29
3.2. Population and Sample ...................................................................29
3.2.1. Interview Group...................................................................30
3.2.2. Open-ended Group ..............................................................30
3.2.3. Three-tier Test Group ..........................................................31
3.3. Variables.........................................................................................32
3.4. Instruments .....................................................................................33
3.5. Procedure........................................................................................34
3.5.1. Interviews ............................................................................34
3.5.2. Open-ended Test..................................................................35
3.5.3. Three-tier Geometric Optic Misconception Test.................36
3.6. Analysis of Data .............................................................................37
3.6.1. Validity ................................................................................37
3.6.2. Reliability ............................................................................39
3.6.3. Item Difficulty .....................................................................39
3.6.4. Item Discrimination Index...................................................40
3.6.5. Descriptive Statistics ...........................................................40
4. RESULTS..............................................................................................42
4.1. Interview Results ............................................................................42
4.2. Open-ended Test Results................................................................49
4.3. Analyzing the Results of the TTGOMT.........................................55
4.3.1. Validity ................................................................................55
4.3.1.1. Construct validity .........................................................56
4.3.1.2. Factor analysis ..............................................................57
4.3.1.3. Proportions of false positives and false negatives ........62
4.3.2. Reliability ............................................................................63
4.3.3. Item Analysis .......................................................................64
4.3.4. Descriptive Statistics ...........................................................66
4.3.5. Other Test Results ...............................................................68
4.3.6. Summary of the results ........................................................73

xii
5. CONCLUSIONS, DISCUSSIONS and IMPLICATIONS ...................75
5.1. Summary of the Research Study ....................................................75
5.2. Conclusions ....................................................................................75
5.3. Discussion of the Results ...............................................................80
5.4. Internal Validity..............................................................................83
5.5. External Validity ............................................................................84
5.6. Implications of the Study ...............................................................85
5.7. Recommendations for Further Research ........................................86
REFERENCES ............................................................................................87
APPENDICES
A. INTERVIEW GUIDE.............................................................................90
B. OPEN-ENDED TEST.............................................................................95
C. THIRD-TIER GEOMETRIC OPTIC MISCONCEPTION TEST .......100
D. ANSWER KEY OF THE THREE-TIER GEOMETRIC OPTIC
MISCONCEPTION TEST .........................................................................116
E. ITEM CHOICES INDICATING THE MISCONCEPTIONS...............117
F. RAW DATA...........................................................................................122

xiii
LIST OF TABLES
Table 3.1 Students Having Been Interviewed .............................................30
Table 3.2 Students Having Taken the Open-ended Test .............................31
Table 3.3 Students Having Taken the TTGOMT ........................................32
Table 4.1 Categories of the Open-ended Test Results for Each Item..........49
Table 4.2 Correlations between Students Scores and Confidence Level ....56
Table 4.3 SPSS Output Showing KMO and Bartlett’s Test for the Score-3 .
.....................................................................................................................58
Table 4.4 SPSS Output Showing Communalities .......................................59
Table 4.5 SPSS Output Showing Rotated Component Matrix for the Score-3
.....................................................................................................................59
Table 4.6 Interpretation of the Factors ........................................................60
Table 4.7 SPSS Output Showing KMO and Bartlett’s Test for the
Misconception-3 ..........................................................................................61
Table 4.8 SPSS Output Showing Rotated Component Matrix for the
Misconception-3 ..........................................................................................62
Table 4.9 Output of the ITEMAN Based on the Score-3 ............................64
Table 4.10 Descriptive Statistics .................................................................67
Table 4.11 Proportions of the Misconceptions Considering the Tiers of the
Test ..............................................................................................................69
Table 4.12 Proportions of the Correct Answers Considering the Tiers of the
Test ..............................................................................................................72

xiv
LIST OF FIGURES Figure 4.1 Scatter Plot of the Students’ Scores for the First Two Tiers vs.
Confidence Levels ......................................................................57
Figure 4.2 Histogram for the Score-3.........................................................68
Figure 4.3 Proportions of the Misconceptions in terms of Type of the
Tests............................................................................................69
Figure 4.4 Proportions of the Correct Answers in terms of Type of the
Test ..............................................................................................71

1
CHAPTER 1
INTRODUCTION
One focus of research studies in the literature in education and psychology
has been the nature of learning and learning environment. Moreover, these research
studies have concentrated on factors external to the learner that influence learning,
such as teaching methods and strategies, teacher variables, books, contents, and
classroom environments Wittrock (as cited in Al-Rubayea, 1996). However,
learners can not be excluded from learning process. Students’ minds are not empty
entities that teachers fill up. Students come to the classes with a set of assumptions
of how the world operates. Their prior assumptions before instruction are called
prior knowledge or preconceptions Lucido (as cited in Al-Rubayea, 1996).
Although, these preconceptions help students to understand the world around them,
sometimes these preconceptions are not true in scientific view. Education
researchers call these wrong conceptions as misconceptions (Al-Rubayea, 1996).
Moreover, since these misconceptions help the students to understand the world,
they are resistant to change and obstructing the learning process (Klammer, 1998).
It might therefore be reasonably argued that the more teachers know about
theirs students’ misconceptions, the more they will be able to provide them to
learn. From this perspective science learning should involve modifying a student’s
cognitive structure in such a way that the student can explain things both better and
more scientifically (Osborne & Gilbert, 1980).
Identifying the students’ misconceptions in any field of the science
requires great effort. Researchers have developed many methods to explore
students’ misconceptions, such as interviews, concept maps and diagnostic tests
(Tsai & Chou, 2002). Although, researchers gain more information by depth of
probing and flexibility of questioning by interviews (Beichner, 1994), they require
a large amount of time to interview with a large number of students (Chen et al.,
2002) to get greater generalizability (Beichner, 1994). On the other hand, multiple-
choice tests can be administered to a large number of students for generalization

2
and easily be analyzed. However, the disadvantage of the multiple-choice tests was
their effectiveness. According to Rollnick and Mahooana (1999) the disadvantage
of multiple-choice tests is that questions do not provide deep enough inside into the
students’ ideas on the topic and students very often give correct answers for wrong
reasons. To overcome this problem, Staver and Gebal; Lavson; Lavson, Adi, and
Karplus; Tobin and Capie (as cited in Al-Rubayea, 1996) recommended that
students should justify their answers. As a result, researchers extended the
multiple-choice tests into several tiers, two or three tiers. In a two-tier test, the first
tier presents a multiple choice content question and the second tier presents a set of
reasons for the given answer in the first tier Treagust (as cited in Odom & Barrow,
1995).
Nonetheless, Griffard and Wandersee (2001) asserted that two-tier tests
have some deficiencies. They used a two-tier test that had been developed by
Haslam and Treagust (as cited in Griffard & Wandersee, 2001) in their study and
criticized it. They said that the test was not developed by considering the students’
minds. Therefore, they asserted that since the test items are based on scientifically
correct propositions from the concept map which had been used in the design of the
test, the test items actually diagnose isolated errors in a conceptual framework
rather than robust naïve theories. They also emphasized that the test results
overestimate the percentage of misconceptions because gap in knowledge cannot
be discriminated from misconceptions.
Three-tier tests remove this problem. Because of the some mentioned
concerns for the two-tier tests, Eryılmaz and Sürmeli (2002) developed a three-tier
test to assess students’ misconceptions concerning heat and temperature. As a
result of the study, it can be absolutely said that three-tier tests have the advantage
over the two-tier tests in term of discriminating students’ lack of knowledge from
their misconceptions by means of the third tier items which assess how confident
the students are about their responses for the first and second tiers.

3
1.1 The Main Problem and Sub-problems
The research questions investigated in this study can be classified as the
main problem and the sub-problems.
1.1.1 Main Problem
The researcher’s main purpose in this study was to develop a Three- tier
Geometric Optic Misconception Test (TTGOMT). The second purpose was
assessing 11th grade Turkish students’ misconceptions in geometrical optic by the
test. And the third purpose of the study was to compare the results with respect to
the type of the test by assuming that the first tier items of the test present a multiple
choice test and both the first and second tier items of the test present a two-tier
test.
1.1.2 Sub-Problems
1. Is the TTGOMT test valid and reliable?
2. What are the difficulty level and the index of discrimination of each item
in the test?
3. What are the misconceptions which eleventh grade students hold about
geometric optic?
4. Are there any new misconceptions which have not been mentioned in the
literature?
5. What is the percentage of lack of knowledge for each item and in average?
6. How does the fraction of the students having a misconception change with
respect to the type of the test?
7. How does the fraction of the students giving the correct answer(s) change
with respect to the type of the test?
8. Can the misconceptions be grouped meaningfully as a result of the factor
analysis?
9. Can the test items be grouped meaningfully as a result of the factor
analysis?
10. What are the percentages of false positives and false negatives?
4
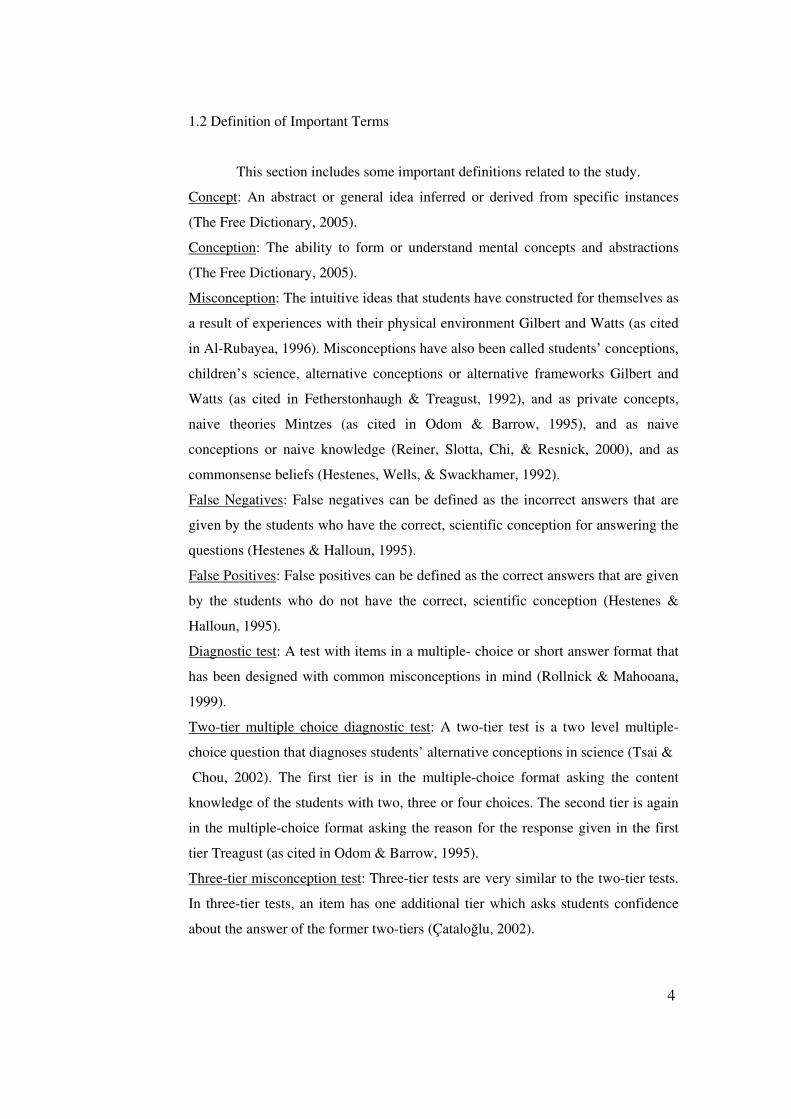
1.2 Definition of Important Terms
This section includes some important definitions related to the study.
Concept: An abstract or general idea inferred or derived from specific instances
(The Free Dictionary, 2005).
Conception: The ability to form or understand mental concepts and abstractions
(The Free Dictionary, 2005).
Misconception: The intuitive ideas that students have constructed for themselves as
a result of experiences with their physical environment Gilbert and Watts (as cited
in Al-Rubayea, 1996). Misconceptions have also been called students’ conceptions,
children’s science, alternative conceptions or alternative frameworks Gilbert and
Watts (as cited in Fetherstonhaugh & Treagust, 1992), and as private concepts,
naive theories Mintzes (as cited in Odom & Barrow, 1995), and as naive
conceptions or naive knowledge (Reiner, Slotta, Chi, & Resnick, 2000), and as
commonsense beliefs (Hestenes, Wells, & Swackhamer, 1992).
False Negatives: False negatives can be defined as the incorrect answers that are
given by the students who have the correct, scientific conception for answering the
questions (Hestenes & Halloun, 1995).
False Positives: False positives can be defined as the correct answers that are given
by the students who do not have the correct, scientific conception (Hestenes &
Halloun, 1995).
Diagnostic test: A test with items in a multiple- choice or short answer format that
has been designed with common misconceptions in mind (Rollnick & Mahooana,
1999).
Two-tier multiple choice diagnostic test: A two-tier test is a two level multiple-
choice question that diagnoses students’ alternative conceptions in science (Tsai &
Chou, 2002). The first tier is in the multiple-choice format asking the content
knowledge of the students with two, three or four choices. The second tier is again
in the multiple-choice format asking the reason for the response given in the first
tier Treagust (as cited in Odom & Barrow, 1995).
Three-tier misconception test: Three-tier tests are very similar to the two-tier tests.
In three-tier tests, an item has one additional tier which asks students confidence
about the answer of the former two-tiers (Çataloğlu, 2002).

5
1.2 Significance of the study
In this study, the researcher will develop a three-tier test and assess the
misconceptions of the 11th grade Turkish students’ misconceptions in geometrical
optic. This study’s product and results are important for five reasons. First, it gives
a diagnostic instrument to teachers to measure their students’ geometrical optic
misconceptions. Second, in the literature for physics education there was great
number of studies have been in the area of mechanics, particularly students’
conceptions of force and motion. Studies for students’ understanding of
geometrical optics, however, are relatively rare (Watts, 1985). Moreover, there
were no previous studies that investigate the students’ misconceptions in optics and
developing a three-tier multiple choice diagnostic tests to evaluate these
misconceptions in Turkish Literature. Third, the results and conclusions provide
information to help teachers take students’ misconceptions into account in their
teaching, thereby improving physics education in Turkey. Fourth, identifying
students’ misconceptions in optics can give some feedback to the textbook editors,
thereby enhancing the quality of Turkish textbooks. Finally, this study can lead to
development of new diagnostic multiple-choice tests for the other physics subjects
and the other science lessons, thereby improving science education in Turkey.
6
CHAPTER 2
REVIEW OF LITERATURE
This chapter is a review of literature related to this study. In this study,
review of literature can be divided into four main parts. (1) Information about the
knowledge. (2) General knowledge about misconceptions of the students. (3)
Methods used for identifying the misconceptions of the students especially
focusing the development process of two-tier diagnostic tests. (4) Students’
misconceptions in geometrical optic.
2.1 Knowledge
The field of psychology started to influence education and was used to
explain learning process. The spectrum of learning theories consists of many
approaches or ways of explaining how humans learn. Behaviorism, cognitivism
and constructivism are three fundamental theories. Theorists of behaviorism are J.B
Watson, E. L Thorndike and B. F. Skinner. They focused on behavior rather than
internal thought process. According to them, learning is manifested by a change in
behavior. They thought environment shapes what one learns, not by the individual
learner. Skinner (as cited in Mcleod, n.d.) studied operant conditioning and
explained learning principle like that learning occurs through positive
reinforcement and old patterns are abandoned by negative reinforcement.
Behaviorists were unable to explain certain social behaviors. For example, children
do not imitate all behavior that has been reinforced. Furthermore, they may model
new behavior days or weeks after their first initial observation without having been
reinforced for the behavior (Mergel, 1998).
A constructing view of learning was developed by the cognivistic theorists
to behaviorism. They refused learning as response to stimuli from the environment.
They thought learning process should be much more than this. Thus, they thought

7
learning process as an internal and active process, which develops within a learner.
They included learner in the learning process. One assumption of cognitivism is
that an existing knowledge structure must exist to learn. These structures are called
as schema (Mcleod, n.d.). In cognitivism, human brain and nervous system and
their development are very important. Jean Piaget studied human cognitive
development process. According to him, there are four stages in cognitive
development process:
1. Sensorimotor period (0-2)
2. Preoperational Period (3-7)
3. Concrete operational period (8-11)
4. Formal operational period (12-15)
In the sensorimotor stage, intelligence takes the form motor actions
(reaching-grasping-pulling). In preoperational stage, intelligence is intuitive in
nature and partially logical thought begins. In concrete operational stage, cognitive
structure is logical but it is concrete. In formal operational stage, cognitive
structure is logical and also abstractions can be made in this stage. He stated that
cognitive development is effected by three processes. Assimilation,
accommodation and equilibration. Assimilation is integration of new information
with existing schemas. Accommodation is the adjustment of schemas to the new
situation or constructing new schemas. Equilibrium is the continuing readjustment
between assimilation and accommodation (Gredler, n.d.). Piaget’s this study can be
called as genetic epistemology. Because, he described in his study nature and
origin of knowledge. Piaget’s assumptions about knowledge and learning process
are similar to constructivist theory. Constructivism is a theory of knowledge that
describes the nature of knowledge and how an individual acquires it. In
constructivism, knowledge is created in the mind of the learner i.e. the student
attempts to make sense of his or her world using previously acquired knowledge
through everyday experiences or formal learning. According to Merril (as cited in
Mergel, 1998) there are six assumptions of constructivism:
• Knowledge is constructed from experience.
• Learning is a personal interpretation of the world.
• Learning is an active process in which meaning is developed on the basis
of experience.

8
• Conceptual growth comes from the negotiation of meaning, the sharing of
multiple perspectives and changing of our internal representations through
collaborative learning.
• Learning should be situated in realistic settings; testing should be
integrated with the task and not a separate activity.
According to Von Glasesferld (as cited in Al-Rubayea, 1996),
‘Constructivism assumes that knowledge is actively built up by the learner through
a process of construction or interpretation in a way that fits his or her own world.
So students learn by trying to fit what they are taught to their own worlds; learning
from constructivist perspective is the production of self-organization.
2.2 Misconceptions
There have been a lot of studies conducted in science education. Many of
these studies were interested in students’ ideas concerning phenomena taught in
science. These studies’ results show that students come to class with their existing
knowledge that they construct with their experiences or formal learning
(Fetherstonhaugh & Treagust, 1992). Students’ this prior knowledge is called as
preconceptions. Some of these preconceptions are in conflict with the scientific
view. Preconceptions which are in conflict with the scientific view are called as
misconceptions. In the literature misconceptions have also been called as students’
conceptions, children’s science, alternative conceptions or alternative frameworks
Gilbert and Watts (as cited in Fetherstonhaugh & Treagust, 1992), and as mistakes,
errors, misunderstandings, misleading ideas, misinterpretation of facts Barras (as
cited in Odom & Barrow, 1995), and as private concepts, naive theories Mintzes
(as cited in Odom & Barrow, 1995), and as naive conceptions or naive knowledge
(Reiner, et al., 2000), and as commonsense beliefs (Hestenes, et al., 1992). It is
important to understand that not all preconceptions are misconceptions (Klammer,
1998). It is also necessary to say that a misconception is not a mistake and it does
not stem from lack of knowledge. Misconception is understanding of a conception
in a wrong or missing way. If a student has a misconception, his/her conception is

9
not true or missing whereas it is true for himself/herself. Although it is wrong, it
works for the student (Eryılmaz & Sürmeli, 2002).
In the past students were thought as empty entities when they came to the
classes. The role of the teachers was to fill these empty entities with knowledge. If
the students’ minds are filled with misconceptions, where do they originate? What
are the sources of misconceptions? According to Klammer (1998) the sources of
the misconceptions are
• Experiences
• Language
• A curriculum of “truths”
For example, students experience that feathers fall down more slowly to
the ground than do stones. However, when the students in secondary schools are
confronted with the experiment that stones and feathers fall at the same rate in a
vacuum, they are confused and surprised with this situation. Because, their
experiences and the experiment are in conflict. Similarly, there are many
metaphors ingrained in language. Although these metaphors help the students
understand the world they do not function in scientific fields every time. The
researcher also stated that teachers and textbooks are always dealt with truths.
Students never experience with proofs. So, always dealing with truths can lead to
students to see nice-looking but wrong equations or relationships as true. For
example, some students think the equation √a2+b2 = (a+b)2. Moreover, in the
lectures teachers teach the subjects with their simplest forms. Students do not
explore the full logical development of an idea or theory.
Reiner et all. (2000) stated that students’ misconceptions can stem from
their substance-based knowledge. Students come to classes with their existing
knowledge that are constructed with their everyday experiences in substance-based
environment. Therefore, students try to assimilate new physics knowledge with
their substance-based knowledge. For example, they consider force as a property of
moving objects. They tend to understand abstract physics concepts with properties
of material substances such as force, heat, electricity and light. In the absence of
relevant knowledge, students explain some of these concepts with the materialistic
language that is used in everyday language as well as in the science classroom. For
example, “close the door, you are letting all the heat out,” “throw some more light
on things,” etc. These concepts are difficult to learn for them. Therefore, students
have too many robust misconceptions in these concepts.

10
Ivovi (as cited in Al-Rubayea, 1996) interestingly stated that the sources of
misconceptions of the students were teachers and textbooks. He investigated the
secondary school students’ physics misconceptions in Nigeria and administered a
20 item multiple-choice test to the students from eight schools. He also gave the
test to the teachers in these schools. He found some misconceptions among the
Nigerian students. The results also showed that teachers had similar
misconceptions in the same area of physics that the students had.
Researches on the misconceptions show us that misconceptions are
resistant to change. Because, these misconceptions help students to understand the
world around them. Dupin and Johsua investigated the students’ misconceptions
about direct-current electricity. They concluded that some of the misconceptions
can be overcome by teaching; however, some are resistant to change. Meyer (as
cited in Al-Rubayea, 1996) stated that misconceptions may stay for a long time
because they serve many different functions for the people who hold them, and
give them explanations for their problems.
Moreover, misconceptions are resistant to change; they interfere with
learning process and inhibit students’ learning. Nussbaum and Novick (as cited in
Al-Rubayea, 1996) stated that students’ misconceptions can interfere with learning
process and cause a great of difficulty when students learn new information
because their misconceptions give inaccurate interpretations for new concepts.
According to Perkins (as cited in Klammer, 1998), the term naive knowledge refers
the misconceptions which retain after instruction. He believed that to incorporate
some new knowledge, learners must change the connections among the things they
already know. The alternatives to the necessary restructuring are to distort the new
information to fit their old ideas or to reject the new information entirely.
According to him, students do not understand the physical science with deep
understanding. Although, they are able to pass almost any exam through the
memorization of basic problem skills, they do not understand the principles
involved in the problems. For example, in a private university, Harward university
graduates were given a battery, a light bulb, and a piece of wire and were asked to
make the light bulb light. Although, these students were exposed the concept of
electrical circuits with very complex problems in their education program, only a
few students were able to be successful. They had either forgotten the topic or
11
compartmentalized the knowledge without making connections to real life
situations.
To sum up, misconceptions have become a part of science education.
Researchers have done lots of studies to investigate the students’ misconceptions.
Teachers should take care of them seriously to teach their students in a reliable
way.
2.3 Identifying the misconceptions
It is important to know what prior knowledge students bring to learning
environment in order to help them to construct new knowledge. In the past,
students’ prior knowledge was not considered seriously. When the misconception
studies started to appear in the literature, science educators have focused on
developing valid and reliable methods to identify them. Therefore, they proposed
variety of methods to identify students’ misconceptions such as various types of
interviews, word associations, open-ended questions, multiple-choice tests,
multiple-choice tests with explanation, and two-tiered multiple choice tests (Al-
Rubayea, 1996).
2.3.1 Interviews and Open-ended Tests
Interview methods used by Osborne and Gilbert (as cited in Chen, et al.,
2002), Posner and Gertzog; Bell (as cited in Tsai & Chou, 2002) and open-ended
questionnaires have some advantages and disadvantages. Although, researchers
gain more information by depth of probing and flexibility of questioning by
interviews (Beichner, 1994), they require a large amount of time to interview with
a large number of students (Chen et al., 2002) to get greater generalizability
(Beichner, 1994). Moreover, these methods also require additional training of
researchers (Treagust and Haslam, as cited in Chen et al., 2002). Also, although
open-ended questionnaires give students more time to think and write about their
ideas, interpretation and analyzing the results of the open-ended questionnaires are
difficult and time consuming (Al-Rubayea, 1996).

12
2.3.2 Multiple-Choice Tests and Force Concept Inventory (FCI)
Multiple-choice tests have been found an effective way of identifying the
misconceptions of the students by researchers. Bar (as cited in Al-Rubayea, 1996)
stated that multiple-choice tests are more effective than oral or written open-ended
essays in detecting students’ misconceptions.
Force Concept Inventory (FCI) is the one of the most popular multiple-
choice test in physics education to monitor understanding of students’ conception
of force and kinematics. The first version of FCI, Mechanics Diagnostic Test
(MDT), was published in 1985 by Halloun and Hestenes (Savinainen & Scot,
2002). It consisted 34 items designed to identify students’ misconceptions (Chapter
2 Review of the Literature, n.d.).
Initially, it was implemented to the college students in written and open-
answer form. Then, students’ misconceptions were identified from their responses
and multiple-choice version of the test was constructed based on these
misconceptions (Savinainen & Scot, 2002). In 1992, an improved version of MDT
was published by Halloun and Hestenes with 29 multiple-choice items (Chapter 4.
Multiple-Choice Concept Tests, n.d.). The questions of the FCI were categorized
into six dimensions: kinematics, first law, second law, third law, superposition
principle, and kinds of force. They also provided a list of 30 misconceptions the
test probed and which questions addressed each misconception (Chapter 2 Review
of the Literature, n.d.).
Steinberg and Sabella (1997) investigated the how student performance on
the FCI correlates with their understanding of the subject matter. They found that
sometimes students’ performances on the FCI do not correlate. They do not
attribute it to the test and claimed that it may due to the inconsistency in student
thinking about the physics. Palmer (as cited in Tan et al., 2002) described this
situation as students may have more than one conception for a particular concept.
The researchers also found that items of the FCI are given from real life
experiences. However, in formal exams there are no or a few items include real life
situations. Therefore, students find the items of the FCI very strange which can
confound the data. Finally, they found that since the students knew that the results
of the test would not be counted towards their grades, some students did not take
the test seriously.

13
Multiple-choice tests have many advantages. They can be scored
immediately and objectively. Teacher can administer them easily and they are
applicable to large number of students (Al-Rubayea, 1996). Moreover, Ooesterhof
(as cited in Çataloğlu, 2002) expressed that multiple-choice tests are better liked by
the students than other measures and can give diagnostic information. Scott (as
cited in Marx, 1988) expressed nine appropriate reasons for using of multiple-
choice tests: (1) They provide greater variety of questions. (2) They can be
qualitative questions regarding physics principles. (3) Choosing between
alternatives and having a general understanding are much more like real life. (4)
Options act like hints. (5) The teachers can ask subtle points with them. (6)
Multiple-choice items are next best thing to essay type questions. (7) The teachers
can ask for a quick numerical calculation and make them worth a point. (8) More
material can be covered. (9) They are good for review.
There are also some criticisms to the multiple-choice tests. According to
Rollnick and Mahooana (1999) the disadvantage of multiple-choice tests is that
questions do not provide deep enough inside into the students’ ideas on the topic
and students very often give correct answers for wrong reasons. According to
Stiggins (as cited in Çataloğlu, 2002) multiple-choice tests direct the students’
attention on information in isolation by testing one element at a time. Therefore,
the larger context and structure of relationships between and among the elements
get lost. According to Bork (as cited in Marx, 1988) multiple-choice tests should
never be used. He expressed five reasons to support his assertion. First, multiple-
choice items encourage guessing. Second, the items are not from real life
situations. Third, they are not friendly for students. Because, students see them in
somewhat a derogatory fashion, connected with the fact that guessing is involved.
Fourth, he stated that ‘There is no real use for them. For example, we hardly ever
use multiple-choice in the computer based quizzes’. And the last, writing good
items is too difficult. He had seen A-grade students do B-grade in the multiple-
choice exams and vice-versa. He attributed this to careless wording of stems and
questions based on weak examples. Sandin (as cited in Marx, 1988) added two
more reasons for why multiple-choice tests are not effective: First, students may
have extracted the right answer by a fortuitous combination of errors. Second,
multiple-choice tests heavily depend on reading comprehension skills. According

14
to Al-Rubeyya (1996) when researchers used them to identify the students’
misconceptions, researchers became worried about memorization of the students to
select the correct answer.
As it is seen, multiple-choice tests are easily applicable and their results
can be analyzed quickly and easily. The problem is their effectiveness. To
overcome this problem, Staver and Gebal; Lavson; Lavson, Adi, and Karplus;
Tobin and Capie (as cited in Al-Rubayea, 1996) recommended that students should
justify their answers. As a result, researchers extended the multiple-choice tests
into several tiers, two or three tiers.
2.3.3 Two-tier Tests
Two-tier tests include, in addition to selecting correct answer among the
distracters, multiple reasons or justifications from which the students choose their
reason for their response is required in the second tiers. Treagust (as cited in Odom
& Barrow, 1995) described the item format of the two-tier multiple choice tests as
the first tier consisting of a content question with two, three, or four choices. The
second tier consists of four possible reasons for the first part with three of them
alternative reasons and one desired reason. The second tier can also include a blank
that students can write a reason for the first tier when they can not see their reasons
among the alternatives of the second tier (Griffard & Wandersee, 2001).
2.3.3.1 Advantages of the two-tier tests
Tsai and Chou (2002) stated that ‘since, two-tier test is in multiple-choice
format, it is much easier for teachers to score or interpret students’ responses. In
this way, even with numerous students, a teacher can efficiently diagnose their
alternative conceptions.’ According to Zeilik (n.d.) teachers can use these
diagnostic tests for formative and summative assessments over semesters. If
teachers use them as a formative test, they will understand their students’ cognitive
states, preconceptions and misconceptions prior to instruction. Therefore, they can
take some precautions for misconceptions which can possibly obstruct the lecture.
15
For example, they can tutor the students in their weak areas individually or assign
the students into heterogeneous cooperative learning teams. If teachers use the
diagnostic tests for summative assessment, they will see impact of their instruction
method positive or negative which can serve feedback for later on instructions.
However, it is important to say that results of the diagnostic tests cannot be used
for assigning the grades of the students. Because, the main purpose of the tests is to
diagnose not to assess achievement of the students.
2.3.3.2 Development process of two-tier tests
Developing reliable and valid conceptual diagnostic tests is a struggling
process and requires great efforts (Zeilik, n.d.). The development process of a two-
tier test was defined by Treagust in three main phases (as cited in Odom & Barrow,
1995):
Phase 1:
1. The content boundaries were defined with a list of prepositional knowledge
statements.
2. Content validity of prepositional knowledge statements was determined.
Phase 2:
3. Students’ misconceptions were identified by interviews.
4. Multiple-choice questions with free response reasons were constructed and
administered.
Phase 3:
5. Final test questions were constructed based on multiple-choice questions with
free response reasons.
6. The final test questions were revised and a pilot study was conducted.
7. Final content and face validity of each test item were determined with the
assistance of a specification grid.
8. The final version of the test was administered.
16
Some two-tier diagnostic tests were developed based on this process in
different fields of science education. Most of the development of two-tier
diagnostic tests include both interviews and open-ended questionnaires or multiple-
choice tests to identify the misconceptions of the students which will be used for
distracters of the two-tier test. Including interview method gives a chance to
researcher to probe the students’ mind deeper and ask the questions more
flexibility. On the other hand, including open-ended or multiple-choice tests gives
a chance to the researcher to deal with more subjects to generalize the results
(Beichner, 1994). In the following part, some studies including development
process of two-tier tests are told.
Odom and Barrow (1995) developed and applied a two-tier diagnostic test
to identify college students’ misconceptions in diffusion and osmosis. They
followed a procedure that is similar to the Treagust model. First, they defined the
content boundaries of the topic and listed propositional knowledge statements
about the topic by using two college biology texts books and a college biology
laboratory manual. The content validity of the propositional statements was
established by a panel of two science education professors and one biology
professor. Second, 20 volunteer introductory college biology students were
interviewed. The interview questions were-open ended questions. The interviews
were audiotape recorded and were used to develop a list of student misconceptions
about diffusion and osmosis concepts. Third, 15-item multiple-choice format test
with free response was developed based on the propositional knowledge statements
and the findings of the interviews. The first tier of this test was in multiple-choice
format with two, three or four choices. In the second tier students were asked to
give their reasons for their multiple-choice selection in the first tier. This test was
administered 171 non-science major introductory college biology students who had
previously been taught diffusion and osmosis concepts. Fourth, two-tier multiple
choice test including 12 items was constructed based on multiple-choice questions
with free response reasons. Fifth, face validity of the test was checked. Two major
questions were addressed while determining the face validity: Does the question
assess the content as defined by the validated propositional statements? And is the
question at a level of sophistification appropriate for college freshman biology
students? If these criteria were not met, the item was dropped. Finally, the test was

17
applied to 240 students enrolled in a freshman biology laboratory course. In
analyzing the results of the test, the researchers estimated discrimination indexes
and difficulty levels for each item and they estimated the reliability of the test by
using the Spearman-Brown formula.
Tan, Goh, Chia, and Treagust (2002) developed and applied a two-tier
multiple-choice diagnostic instrument to assess high school students’
understanding of inorganic chemistry. Their methodology was very similar to
Odom and Barrow’s study (1995) in which they used Treagust model (as cited in
Odom & Barrow, 1995). So, it is needless to explain their methodology step by
step. Differences of this study from Odom and Barrow’s study were a concept map
was created in addition to the propositional knowledge statements while defining
content boundaries.
Chen et al. (2002) investigated the high school students’ misconceptions
about image formation by a plane mirror. They developed a two-tier diagnostic test
based on Treagust model. There are two differences in this study from the previous
study described above. First, an open-ended questionnaire, not a multiple-choice
test with free response, was used to identify students’ misconceptions which could
serve as distracters for the later construction of the multiple choice instrument.
Second, interviews were conducted after open-ended questionnaire was
administered, not before. In analyzing the results, they estimated the reliability by
using Cronbach alpha and they also calculated discrimination index and difficulty
level for each item. They gave attention to the misconceptions which existed in at
least 10% of the student sample.
Beichner (1994) developed a diagnostic multiple-choice test to identify the
misconceptions of the students in kinematics graphs. The construction process of
the test was very similar to the Treagust Model (as cited in Odom & Barrow,
1995). The difference was that in defining content boundaries of the study, he
wrote specific objectives instead of concept map or propositional statements.
18
2.3.3.3 Critics about the two-tier tests
Although, diagnostic tests are very helpful for teachers to identify the
misconceptions of the students, some researchers criticize them. According to
Yarroch (as cited in Griffard & Wandersee, 2001), forced choice instruments like
two-tier tests give clues to the students to select correct answers that they would
not have had in interviews and open-ended questions.
Griffard and Wandersee (2001) investigated the effectiveness of a two-tier
instrument developed by Haslam and Treagust in 1987 about photosynthesis. The
test was given to the students and wanted them to think aloud while they were
answering the items. They found that, using unnecessarily wording to distract
students caused them to make mistakes. It is not certain that whether these mistakes
were due to misconceptions that students had or unnecessarily wording of the test.
Moreover, these unnecessarily wording can cause create a new misconception in
students’ mind. They also stated that ‘students consider the second tier as a distinct
multiple-choice item and finalized their choice on the basis of whether it logically
follows from their response to the first tier. Therefore, two-tier test seemed to
measure the students’ test-taking skills rather than the extant knowledge’.
Moreover, the feelings of the students are very important. Students bring these
types of tests different amounts of sincerity, anxiety, persistence and
meticulousness which can confound the test results. They also criticized the two-
tier test about the estimating the proportions of the misconceptions. According to
them, two-tier tests overestimate the proportions of the misconceptions because
gab in knowledge can not be discriminated by two-tier tests. Therefore a third tier
is necessary to be sure that whether a wrong answer for the first two-tiers is a
misconception or a mistake due to lack of knowledge.
2.3.4 Three-tier Tests
Three-tier tests are very similar to the two-tier tests. In three-tier tests, an
item has one additional tier which asks students confidence about the answer of the
former two-tiers (Çataloğlu, 2002). Eryılmaz and Sürmeli (2002) developed a
three-tier test to assess the misconceptions of the 9th grade students about heat and

19
temperature. According to them all misconceptions are errors but not all errors are
misconceptions. Some errors may stem from lack of knowledge. If a student
explains his/her error as a true with reasons and says his/her confidence, it is
acceptable that this student has misconception. In two-tier tests and multiple-choice
tests it is not asked to the students for their confidence about their answers. Three-
tier tests are required to remove this problem. These types of tests have one more
tier in which it is asked to the students their confidence about the first two tiers. In
their study, they compared the proportions of the misconceptions that the students
had with respect to the tiers of the items. They found the students had
misconceptions with an average 46 % for the first tiers of the items, with an
average 27 % for the first two tiers of the items and with an average 18 % for all
three tiers of the items. From these results the researchers concluded that one tier
and two-tier tests overestimate the proportions of the misconceptions. For the one
tier tests it is accepted all wrong answers are misconceptions. However, some of
the wrong answers may be false negatives which are incorrect answers by mistake
in spite of correct reasons in the second tier and some may be due to randomly
given answers by chance because related reasons of the incorrect answers were not
chosen on the second tiers. Therefore, 19 % (subtracting 27 % from 46 %)
indicated incorrect answers by mistake or chance. The researchers also found that
two tiers tests also overestimate the proportions of the misconceptions. Because as
mentioned above, it is required if a student has a misconception he/she should say
his/her confidence. In two-tier tests it is not asked to the students whether they are
confident about for their responses. The researchers found that 9 % of the students
were not confident for the answers of the first two-tiers even if their answers
indicated the misconceptions. They explained that those students gave incorrect
answers due to lack of knowledge. To sum up, the researchers concluded that
three-tier tests assess the misconceptions of the students more validly than one-tier
and two tier tests.

20
2.4 Misconceptions in Geometric Optic
Although, there have been great number of studies done to investigate the
students’ misconceptions in mechanics, there have been relatively rare studies done
to investigate the students’ misconceptions in geometrical optics. Misconception
studies in geometrical optics show that students have difficulties in understanding
vision and the nature and propagation of light.
Langley, Ronen, and Eylon (1997) investigated pre-instruction students’
conceptions and representations of optical systems, light propagation, illumination
patterns and visual patterns. Langley et al. found that students did not indicate light
emanating from the light source in even single diagram. They showed something
existing around the light source, without an explicit connection with it. Light was
not shown emanating from the specific points of the light source. Moreover, the
path of emanation and propagation of the light was influenced by barriers around
the source or by remote optical components. The students rarely indicated
directionality in their representation of light. They used variety of graphic objects
to represent light: straight lines, dashes, curves and filled-in areas. In the study
students also showed little understanding how to see luminous and nonluminous
objects. The understanding that there is no sight without light was shared by about
50% of the sample. The students who involved the light in the sight process:
• Showed the light emanating from the object and being
received by the eye.
• Saw the object because it was contained within the geometrical
sector spanned by the eyes.
• Saw the object because the observer directs sight lines toward
it, with light possibly emitted from the eyes.
Fetherstonhaugh and Treagust (1992) investigated the 8-10 grades
students’ (age 13-15 years) understanding of light and its properties. In their
findings students’ conceptions were:
• Light travels a different distance depending upon whether it is
day or night.
• Light does not travel during the day.
• Light does not travel at all during the night.
21
As given above students had some conceptions about traveling of the light.
In the interviews some students thought that light does not hit anything, light can
travel a variable distance. Some of the students thought light does not travel and
the distance light travels depends on its energy.
Students also had some misconceptions about sight process:
• People see by looking, not by light being reflected to their
eyes.
• People can just see in the dark.
• Cats can see in the dark.
In the interviews students were asked how we see an object, for example a pencil,
what light does before we can see and if there was no light, could we see? Students
answered these questions in a varied way. Several students said that something
leave the eye and strike to the pencil. Moreover, they claimed that it is possible to
stare at a person’s back and have that person feel the stare. For seeing in the
darkness, significant numbers of the students expressed that eyes can get used to
seeing in total darkness.
In another study about light, Bendall, Goldberg, and Galili (1993)
investigated the prospective elementary teachers’ prior knowledge about light and
shadow. They interviewed with 30 prospective teachers who were all in their junior
or senior year and very few had taken a physics course in high school. Bendall et
al. found that about 20% of their subjects tended to explain the shadow
phenomenon in terms of a reified shadow (attributing the shadow to the presence of
something, rather than to the absence of light). The students also could not explain
how would be the shadow when two light sources were used at the same time.
Most of the students reasoned that in the region of geometrical overlap there would
be either lightness (full illumination) or darkness (shadow). They did not consider
semi darkness. In the study, students had a static general illumination
conceptualization in which light only exists in space. For example, students could
not explain the brightness of a screen. They did not recognize the role of the light
in that process (light had to go from the bulb to the screen). Like, for example, in
the interview studies a student recognized that light must be present to observe
mirror images, but did not recognize any explicit role for light in that process. In
the interviews most of the students thought that presence of the light was necessary

22
to see the nonluminous objects in which they gave to the light a static role. Even if,
the students said that for seeing luminous objects light must enter to eyes, they did
not drew ray diagrams for this situation. Students also had difficulties in
understanding of the idea that light from each point on a source goes out in all
directions. They thought of light as emanating in only one direction from each
source, like flash light beams. In their ray diagrams, they tended to show only
single lines going outward from individual points on the bulb which is the root of
many students’ difficulties in understanding image formation.
Feher and Rice (1988) investigated the middle school children’s
conceptions of shadow formation. They interviewed 40 children using a protocol
that was developed through more than fifty interviews. The children explained the
shadow as the presence of something that is pushed, moved or thrown to the screen
i.e. as a reified shadow. They gave a material characteristic to the shadow. In their
diagrams, there were movements of dark areas or shadows between object and
screen. Most of the children gave a role to the light in the shadow formation as
initiating the shadow by hitting to the object and pushing it to the screen. Some of
these students thought that light reflects off the object and due to this reflection
shadow is formed and light carries it to the screen. Moreover, in the study children
were asked “Is there a shadow in the dark, where there is no light?” The students
thought shadow exists in the dark but they cannot see it. They explained this
situation in two different ways. One is that either the object produces the shadow
hiding within the object and can not be produced or cast until the light hits the
object and provokes it to do so. The other one is that their visual mechanisms are
not operative in the darkness. The researchers also found most of the children had
an idea that shadow belongs only to the non-luminous object and it always looks
like the object. The students did not consider the role of the light source in the
shadow formation.
Misconceptions of the students about nature and propagation of light and
shadows point out that students have difficulties in explaining and interpretation of
image formation by mirrors and lenses.
23
Langley et al. (1997) investigated pre-instruction students’ conceptions
about plane mirror images. They found that the students thought that creating
images was an inherent attribute of the silvery mirror material, rather than the
product of the reflection process. The students did not show image observation
without including a representation for image formation in their diagrams. In some
situations the issues were treated separately, with the image projected holistically
onto or into mirror and the observer directing sight lines at the image.
Goldberg and McDermott (1986) investigated the students’ difficulties in
understanding image formation by a plane mirror by using individual
demonstration interviews. They found that one-third of the students believed that
the image of an object in a plane mirror lies on the surface. In the study, students
had difficulties in understanding the position of the image depends only on the
position of the object relative to the mirror and is independent of the observer’s
position. They had a misconception that an image in a plane mirror lies behind the
mirror along the line of sight between a viewer and the object. Moreover, some of
the students invoked a parallax argument for their explanation in which they meant
to their experience of watching an object shift its position as they viewed it from
different perspectives. They had mistaken that the absolute position of the object
remains the same as an observer moves. Only change is its apparent position
relative to the background. Finally, they found that the students believed they
would see more of themselves in the plane mirror by moving back. In fact, in a
plane mirror anyone can see more of himself/herself with a minimum amount of
eye movement not with moving back.
Bendall et al. (1993) investigated the prospective elementary teacher’s
ideas about mirror images. They interviewed with prospective teachers and asked
open-ended questions to learn how they think about a mirror works. For creation of
image, only about half of the students thought that light was necessary for image
creation but they were not able to explain the role of light in that process. In their
diagrams, the lines between the light source and its image in the mirror suggest a
holistic way of thinking. They just implied that the image somehow went to the
mirror. Moreover, most of the students thought that nothing happened between
their eyes and mirror for seeing image of any object in a plane mirror. They said
that they saw just by looking. Although, most of the students thought light is

24
necessary for them to see the image, they seemed to be thinking only that back
round light was necessary for their eyes to function, and not that light from the
mirror had to enter their eyes to see the image of any object in the mirror. In the
interviews, an interesting interpretation of how a mirror works was interpretation of
reflection term differently from a scientific view. When the students said the mirror
reflects the light, they did not mean something actually bounding of the mirror.
Instead, they meant that the mirror makes a reproduction or duplicates. According
to some of the students, the ability of the mirror to make a reproduction of the
image was due to reflective substance of the mirror. Almost half of the students
thought that a mirror could make a reproduction even if there was no light in the
medium. For example, in the interviews, one student said: “it will be a picture of
the bulb, but it will be covered with dark.”
Chen et al. (2002) developed a two-tier diagnostic test to identify the
misconceptions of high school students about image formation by a plane mirror.
They found 9 misconceptions in the study: (1) Students thought that to see an
image of any object, it should be inside the front region straight ahead of the
mirror. (2) Students thought that image of an object depends on the observer and
they believed that image of any object is located right ahead of the observer. (3)
Students claimed that image of an object is located on the surface of the mirror, not
equal distance behind the mirror as the object is in front. (4) Students thought that
if a person wants to see him or herself, he or she should illuminate the mirror rather
than himself or herself. (5) Students believed that image of an object is in the line
sight of the observer. They could not realize image of an object does not depend on
the observer. (6) Students confused the image with the shadow. They expressed
image of an object on the mirror was its shadow. (7) Students claimed that image
of a black object on the mirror was due to black rays bouncing off the black object.
They could not realize that image of the black object was due to the reflection of
surroundings around the object and there was no light reflected from the mirror due
to the black object. (8) Students confused image formation with shadow formation.
They believed that in the presence on an illuminant the position and size of the
image of an illuminated object depends on the illuminant. For example, they
thought image size of an object gets longer when the illuminant is gotten closer to
the object. (9) Finally, students thought position and size of the image of any object
depends on the location of the observer. They thought when the observer retreats
size and position of the observer is changed.
25
Gee (1988) investigated a different aspect of the image in a plane mirror.
According to researcher, students believed that plane mirrors rotate the right to the
left and vice versa. School texts books mention this topic lateral inversion when
discussing the nature of the image in a plane mirror. Some texts books state that
lateral inversion occurs but they do not explain how it occurs. The only thing
understood is left and right are reversed. In reality, plane mirrors causes no lateral
inversion. The only thing occurs in a plane mirror is object points near to mirror
have images near to mirror and object points further to mirror have further images.
This is longnitual inversion in fact which reality of plane mirror is.
2.5 Summary of the Literature Review
Students come to classes with existing knowledge that they construct with
their experiences or learning (Fetherstonhaugh & Treagust, 1992). Some of these
students’ prior knowledge can be in conflict with the scientific view and called as
misconceptions. It is important to say that a misconception is not a mistake and it
does not stem from lack of knowledge. If a student has a misconception, his or her
conception is wrong scientifically, but it is true for him or her and works properly
and helps to understand the world (Eryılmaz & Sürmeli, 2002).
Research studies show that misconceptions resist changing. Hewson (as
cited in Al-Rubayea, 1996) said that misconceptions do not change because they
make better sense of the world than anything else. Moreover, according to
Nussbaum and Novick (as cited in Al-Rubayea, 1996) they interfere with learning
process and inhibit students’ learning.
Misconceptions have become a part of science education. Researchers have
done lots of studies to investigate the students’ misconceptions. Teachers should
take care of them seriously to teach their students in a reliable way. There were
many methods used and developed to investigate the misconceptions of the
students; interviews, word associations, open-ended questions, multiple-choice
tests, multiple-choice tests with explanation, two-tier tests and three –tier tests.
Even if the interviews provide more information by depth of probing and
flexibility, it is necessary to study with the larger samples to generalize the results
(Beichner, 1994). Moreover, conducting interviews require a large amount of time
26
(Chen et al., 2002). On the other hand, even if the open-ended tests overcome
generalizibilty problem, information obtained from open-ended tests are not as
deep as interviews’ (Beichner, 1994).
For the multiple-choice tests, although they are easily applicable to a large
number of the samples and can be scored easily and objectively (Al-Rubayea,
1996), one of the main disadvantages of multiple-choice tests is that questions do
not provide deep enough inside into the students’ ideas on the topic and students
very often give correct answers for wrong reasons (Rollnick & Mahooana, 1999).
According to Bork (as cited in Marx, 1988) multiple-choice tests should never be
used. He expressed that multiple-choice items encourage guessing.
As it is understood, multiple-choice tests are easily applicable and their
results can be analyzed quickly and easily, the problem is their effectiveness. To
overcome this problem, Staver and Gebal; Lavson; Lavson, Adi, and Karplus;
Tobin and Capie (as cited in Al-Rubayea, 1996) recommended that students should
justify their answers. In two tier tests, the first tiers consist of a content question
with two, three, or four choices. The second tiers consist of four possible reasons
for the first part with three of them alternative reasons and one desired reason. It is
required students to justify their responses in the first tier by the reasons in the
second tier Treagust (as cited in Odom & Barrow, 1995). However, Griffard and
Wandersee (2001) investigated the effectiveness of a two-tier instrument developed
by Haslam and Treagust in 1987 and criticized two-tier tests. One of the main
critics is that two-tier tests overestimate the proportions of the misconceptions
because gab in knowledge can not be discriminated by two-tier tests. Therefore, an
additional tier is required to discriminate a mistake whether it stems from a
misconception or lack of knowledge.
Eryılmaz and Sürmeli (2002) stated that misconceptions do not stem from
lack of knowledge. In three-tier tests, in the third tier it is asked to the students
whether they are confident with their answers for the first two tiers. Asking the
students’ confidence in the third tier provides information whether a wrong answer
to the first to tiers due to misconception or lack of knowledge. It is expected that if
a student explains his or her false as a true with reasons and says his confidence, it
is acceptable that this student has misconceptions.
27
Finally, the misconceptions in geometric optic found from the literature
review can be listed as the following:
1. For seeing in the darkness, students express that eyes can get used
to seeing in total darkness (Fetherstonhaugh & Treagust, 1992).
2. Students think that light travels a different distance depending
upon whether it is day or night (Fetherstonhaugh & Treagust,
1992).
3. Students think of light as emanating in only one direction from
each source, like flash light beams (Bendall et al., 1993).
4. Students have an idea that shadow belongs only to the non-
luminous object and it always looks like the object (Feher & Rice,
1988).
5. Most of the students reason that in the region of geometrical
overlap there would be either lightness (full illumination) or
darkness (shadow). They do not consider semi darkness. Students
treat the shadow as the presence of something i.e. they give
material characteristics to the shadow, rather than absence of the
light (Bendall et al., 1993).
6. Students think that to see an image of any object, it should be
inside the front region straight ahead of the mirror (Chen et al.,
2002)
7. Students have a misconception that an image in a plane mirror lies
behind the mirror along the line of sight between a viewer and the
object (Goldberg & McDermott, 1986).
8. Students think that an observer see the object because the observer
directs sight lines toward it, with light possibly emitted from the
eyes (Langley et al., 1997).
9. Students confuse image formation with shadow formation. They
believe that in the presence on an illuminant the position and size
of the image of an illuminated object depends on the illuminant.
For example, they think image size of an object gets longer when
the illuminant is gotten closer to the object (Chen et al., 2002).
28
10. Students think that the position and size of the image of any object
depend on the location of the observer. They have an idea that
when the observer retreats size and position of the observer is
changed (Chen et al., 2002).
11. Students claim that image of a black object on the mirror was due
to black rays bouncing off the black object (Chen et al., 2002).
12. Students think that creating images is an inherent attribute of the
silvery mirror material, rather than the product of the reflection
process. The students say that “The mirror reflects and so the
person sees” (Langley et al., 1997)
13. Students have a misconception that while watching an object its
position also shifts as they view it from different perspectives.
They mistake that the absolute position of the object remains the
same as an observer moves. Only change is its apparent position
relative to the background (Goldberg & McDermott, 1986).
14. Some of the students believes that image of any object is located
right ahead of the observer (Chen et al., 2002).
15. Students think that if a person wants to see him or herself in a dark
room, he or she should illuminate the mirror rather than himself or
herself (Chen et al., 2002).
29
CHAPTER 3
METHODOLOGY
The focus of this chapter is the methodology which was used to conduct
this study. It contains the research design, description of the subjects, variables of
the study, description of instruments used in the study, procedure by which the
study was conducted and description of the statistical techniques used in analyzing
the results.
3.1 Research Design
This study is a cross-sectional survey method study. In the developing
process of the TTGOMT, the students were interviewed and administered a free-
response test to collect data. Based on these data, the three-tier test was developed
and administered to the students to assess the misconceptions of the students about
geometric optic. The data from the three-tier test results were analyzed.
3.2 Population and Sample
The target population of this study was all 11th grade high school students
in Istanbul, in Turkey. However, it is appropriate to define an accessible
population, since it is not feasible to study with this target population. So, the
accessible population was 11th grade high school students in Bayrampaşa, in
Istanbul. Since the study includes development process of a three-tier test and its
application, three different groups of subjects were used; interview group, open-
ended test group, and three-tier test group.

30
3.2.1 Interview Group
First group was 15 11th grade students (8 male and 7 female) from three
types of high school in Bayrampaşa district to conduct the interviews. Table 3.1
shows the school type and number of students chosen. The age of the students was
between 16 and 19. Two-above-average male and female, two average male and
female and one-below-average students who had been taught the geometrical optic
in their curriculum were selected from each type of schools by considering their
physics teachers’ recommendations. School types were Anatolian High Schools,
Government High Schools and Foreign Language High Schools. They were
selected by convenience sampling. Table 3.1 shows the list of interviewees based
on the gender and school types.
Table 3.1 Students Having Been Interviewed
School Type Male Female Total
Government High School 2 3 5
Foreign Language Teaching High School 3 2 5
Anatolian High School 3 2 5
Total 8 7 15
3.2.2 Open-ended Group
The second group was 114 11th grade students from three classes from each
school type. The classes were selected by convenience sampling. These students
were again from the same school type as like the students in the interview group;
39 from Foreign Language High School, 36 from Government High School and 39
from Anatolian High School. Since it was difficult to adjust the sample by equating
the male-female ratio, one class from each type of schools satisfying this criteria
was selected. Table 3.2 shows the list of the students’ genders and school type who
have taken the open ended test.

31
Table 3.2 Students Having Taken the Open-Ended Test
School Type Male Female Total
Government High School 22 14 36
Foreign Language Teaching High School 20 19 39
Anatolian High School 16 23 39
Total 58 56 114
3.2.3 Three-tier Test Group
The third group who was administered the final version of the three-tier
test developed by the researcher was 141 students; 86 students were male and 55
students were female. It was selected by convenience sampling. All the students
were 11th grade students from Government High Schools and had been taught
geometric optic. It is recommended that for an item analysis of a test which is
widely used such as the Graduate Record examination should be based on a sizable
and representative sample perhaps of thousands of subjects. However, it can be
smaller for doctoral students who develop an instrument for a dissertation research.
200 subjects are the minimum desired number for this type of studies. Even if 141
is smaller than 200, the sample size also can be calculated with rule-of-thumb. This
rule requires 5 to 10 times as many subjects as the items of the test. In the
TTGOMT, if the third tiers are not accepted as an item, there were 32 items (first
and second tiers). 141 subjects is slightly less than 5 times of the items. Table 3.3
shows the students’ genders and school type who had taken the TTGOMT
(Schwab, 2005)

32
Table 3.3 Students Having Taken the TTGOMT
School Type Male Female Total
Government High Schools
86
55
141
3.3 Variables
In the study, seven variables were formed for each of student using answer
key of the TTGOMT (see Appendix D), choice selections indicating
misconceptions (see Appendix E), and the raw data (see Appendix F), and The
Excel program was used to enter the raw data. The raw data was changed to
(dummy-coded) nominal level. In analyzing the results 0 was accepted as incorrect
answer or non-existing misconception. 1 was accepted as correct answer or existing
misconception. The variables were obtained by using logical functions (IF, AND,
OR functions) of the Excel program. The variables are as the following:
Score-1: Each student’s answer was coded as 0 (wrong answer) and 1
(correct answer) for the first tiers of the each item on the TTGOMT. The
proportions of the correct answers to the first tiers for each item and total correct
answers of the students for the first tiers of test was calculated.
Score-2: Each student’s answers was coded as 0 (wrong answer) and 1
(correct answer) for the first-two tiers of the each item on the TTGOMT. The
proportions of the correct answers to the first two tiers for each item and total
correct answers of the students for the first two tiers of test were calculated.
Score-3: Each student’s answers was coded as 0 (wrong answer) and 1
(correct answer) for the all three tiers of the each item on the TTGOMT. In the
third tiers the confidences of the students were asked for the answers of the first
two tiers. It is important to say that even if a student’s answers for the first two tiers
33
were correct, it was not accepted unless the student clarified his/her confidence in
the third tier. If the student said “Yes, I am sure” it was accepted true and if the
student said “No, I am not sure” it was accepted false. The proportions of the
correct answers to the all three tiers for each item and total correct answers of the
students for all the three tiers were calculated.
Misconception-1: This variable was obtained by using the choice
selections indicating a misconception. A choice selection indicating a
misconception for the first tiers accepted as 1 and other choices accepted as 0. The
proportions of the misconceptions according to first tiers were estimated and also
the number of the misconceptions for each student for the first tiers was calculated.
Misconception-2: This variable was estimated as similar as misconception-
1. A choice selection indicating a misconception for the first two tiers was accepted
as 1 and other choices were accepted as 0. The proportions of the misconceptions
according to first two tiers were estimated and also the number of the
misconceptions for each student for the first two tiers was calculated.
Misconception-3: They were obtained by coding the choice selections
indicating a misconception for all three tiers as 1 and others as 0. It is important to
say that even if a student choice selection for the first two-tiers indicated a
misconception it was not accepted as a misconception Unless the student clarified
his/her confidence in the third tier. The proportions of the misconceptions
according to all three tiers were estimated and the number of the misconceptions
for each student for all the three tiers was calculated.
Confidence levels: They were obtained by using the student answers for
only to the third tiers. If the students showed their confidence for the answers of the
first two tiers in the third tier it is accepted as 1, the rest were accepted as 0.
3.4 Instruments
In this study, three instruments were used. During the construction process
of the TTGOMT to identify the misconceptions of the students in geometrical optic
a semi-structured interview protocol was prepared based on the misconceptions
found in the literature. Then, an open-ended test was created based on the interview
results and misconceptions found in the literature. Finally, open-ended test results
34
were analyzed and three-tier misconception test was created. Since, developments
of these three instruments were part of the study, they were told in more details in
the procedure part.
3.5 Procedure
The study started with a detailed review of the literature. Then a keyword
list was determined. After determining the keyword list, the researcher searched
Dissertation Abstracts International, Social Science Citation Index (SSCI),
Educational Resources Information Center (ERIC), Ebscohost, Science Direct and
INTERNET (e.g., Google). The studies made in Turkey also were searched from
YÖK, Hacettepe Eğitim Dergisi, Eğitim ve Bilim Dergisi and, Çağdaş Eğitim
Dergisi. The photocopies of the available documents were obtained from METU
Library, Hacettepe University Library, Tubitak-Ulakbim Library and, INTERNET.
All the related documents were read.
The procedure followed in this study was similar to the Treagust model (as
cited in Odom & Barrow, 1995). The difference was in defining the content
boundaries of the study. The content boundaries of the study were designated by
the misconceptions found in the literature. The researcher tried to include the topics
which were more studied in geometrical optic in the literature. There were three
main parts in the procedure; interviews, open-ended test and three-tier
misconception test.
3.5.1 Interviews
After finding the misconceptions from the literature, a semi-structured
interview-protocol (see Appendix A) was prepared on the basis of the literature
results. In the literature review, there were so many studies found conducted to
investigate the students’ misconceptions in geometrical optics. In these studies
different types of methods were used to collect data; interviews, open-ended
questions, multiple-choice tests and two-tier tests. The researcher extracted the
questions of the interview questionnaire from these studies. Some of the questions
were taken without making any changes and some of the questions were modified.

35
There were 16 open-ended questions in the questionnaire. Some questions required
students to draw a diagram that describes and explains a phenomenon. These types
of questions included some simple sketches and students were asked to complete
the sketches in a manner that explains the physical phenomenon. It was said to the
students that their drawings were not expected in artistic standards and their simple
drawings would be enough. Moreover, for interview questions 3, 4, 5, 8 and, 10
simple demonstrations were used to make the questions more understandable. In
some questions verbal presentation used only.
By means of this protocol, students’ misconceptions were investigated in a
deeper way. There were 16 questions in the protocol and 15 students were
interviewed one to one. In the interviews, students were also asked additional
questions to investigate the reasons for their answers and what lies behind their
answers. The researcher recorded interviews with an audio-type recorder and each
interview lasted approximately 40-50 minutes. Collecting interview data and
analyzing it took 3 weeks.
3.5.2 Open-ended Test
After the interviews, the researcher developed an open ended test (see
Appendix B) to get greater generalizibility and create the distracters of the three-
tier test. It was developed based on the interview results and misconceptions found
in the literature. Almost all the questions were selected from the interview-
protocol. However, the third question in the open-ended test was used instead of
interview questions 3, 4 and 5.
This replacement was done because students had some difficulties to understand
these three questions. So, there were 13 questions in the open-ended test. The test
was given to a physics teacher from Tuna High School and an instructor from the
department of Secondary School Science and Mathematics Education at METU
with the aim of establishing the content validity. And also, the grammatical
structure of the test was checked by a Turkish teacher. It was administered to
selected 114 11th grade students from three types of schools. The required
permissions were taken from the school directors. The researcher applied the test in
the physics lessons with the surveillance of the physics teachers. Students were
informed that results of the study would not affect any of their grades in their
school.

36
Each application takes 30-35 minutes. In the analyzing process, the
researcher categorized the results coming from the students for each item and made
a frequency table for it. Application of the test and analyzing the results took 6
weeks (see Table 4.1).
3.5.3 Three-tier Geometric Optic Misconception Test
After analyzing the results of the open-ended test, the researcher developed
the TTGOMT (see Appendix C) especially based on the open-ended test results.
Interview results and misconceptions found in the literature were also considered.
There were 16 items in the test and each item had three tiers. The items were as
similar to open-ended test items. 4th, 9th, 10th items were added the test. 4th item was
a different version of the 3rd item and both items asked clearness of the shadow. 5th
item of the interview-protocol was very similar to it. The 9th item was a different
version of the 8th item and both items asked what would happen to the image of any
object if an illuminant’s position was changed. The researcher constructed the
distracters of the test by considering the frequency table which had been done for
the open-ended test results. The most frequent categories were chosen as the
distracters. Also, some of the distracters were written according to interview results
and misconceptions found in the literature. The test was given to a physics teacher
from Merkez High school and an instructor from the department of Secondary
School Science and Mathematics Education at METU with the aim of establishing
the content validity. Grammatical rules and language of the test was checked by a
Turkish Teacher. Before administration of the test, required permissions were taken
from the school directors. The test was administered to selected 141 11th grade
students who had been taught geometric optic in the physics lessons. The students
were from Government High Schools and 86 students were male and 55 students
were female. The schools and classes were selected by convenience sampling. The
test was administered in the classes by the surveillance of the physics teachers.
Each application for one class took approximately 30-35 minutes.

37
3.6 Analysis of Data
Since this study was a development of a three-tier misconception test, there
were three times data collected from the students; interviews, open-ended test, and
three-tier misconception test. Interviews’ and open-ended tests’ results were
qualitative data and they were given in the results part in chapter 4.
One of the main purposes of the study was assessing the misconceptions of
the students by the developed three-tier misconception test. The data was entered to
an Excel file in which columns show the items and rows show the students
responding the three-tier test. The data was analyzed statistically by using the
Excel program. Then, the researcher transferred to the data from an Excel file to a
Statistical Package For The Social Sciences Program (SPSS). Additional required
statistical analyzes were done by using this program. Data entry and analyzing the
results took 3 weeks.
Reliability, item difficulty, item discrimination, factor analysis for correct
answers for the first two tiers and factor analysis for the misconceptions, false
positives and false negatives were calculated.
3.6.1 Validity
Validity refers to the appropriateness, meaningfulness, and usefulness of
the specific inferences researchers make based on the test results (Fraenkel &
Wallen, 1996, p. 153). Three major types of validation studies are:
1) Content validity- Content validity refers to the content and format
of the test. The purpose of the content validation is to assess
whether the items adequately represent a performance domain or
construct of specific interest i.e. how well the exam portrays the
domain of concepts it is intended to represent.
2) Criterion validity- Criterion validity refers to the relationship
between scores obtained using the instrument and scores obtained
using one or more other instruments or measures i.e. it is a
predictive power of a measure.
38
3) Construct validity- Construct validity is the degree to which an
exam measures an intangible quantity such as depression,
happiness, leadership or mental retardation.
Validity of the TTGOMT was established by using two quantitative
techniques. First, correlation between students’ scores on the first two tiers and
confidence levels on the third tiers were investigated to establish construct validity.
Because it is expected on a properly working test that students with higher scores
would be more confident about the correctness of their answers if they properly
understand what they read on a test (Çataloğlu, 2002). The correlation was
estimated by using SPSS program.
Second, factor analysis method was used to establish validity. When
several items are administered to the examinees, one aspect of validation may
involve determining whether there are one or more clusters of items on which
examinees display similar performance. Factor analysis was conducted by using
SPSS program. Before starting the factor analysis, it is important to meet some
requirements to conduct it. If these requirements are not met, factor analysis is not
appropriate. According to Schwab (2002), these requirements are:
• The variables included must be metric level or dichotomous
(dummy-coded) nominal level.
• The sample size must be greater than 50 (preferably 100).
• The ratio of cases to variables must be 5 to 1 or larger.
• The correlation matrix for the variables must contain 2 or more
correlations of 0.30 or greater.
• Variables with measures of sampling adequacy less than 0.50 must
be removed.
• The overall measure of sampling adequacy must be 0.50 or higher.
• The Bartlett test of sphericity must be statistically significant.
According to Schwab (2002) after satisfying the requirements, variables
and components should satisfy the following requirements:
• The derived components explain 50% or more of the variance in
each of the variables, i.e. have a communality greater than 0.50.

39
• None of the variables have loadings, or correlations, of 0.40 or
higher for more than one component, i.e. do not have complex
structure.
• None of the components has only one variable in it.
Third, probabilities of false positives and false negatives were estimated
because they were expressed by Hestenes and Halloun (1995) to be related to the
content validity.
3.6.2 Reliability
Reliability is the consistency of the scores obtained. A test is considered
meaningful if it produces consistent or reliable results. The reliability of the test
was calculated by calculating coefficient alpha which is a measure of internal
consistency of an exam. This coefficient (α) is a general form of Kuder-Richardson
reliability coefficient (Fraenkel & Wallen, 1996, p. 160). Coefficient alpha can not
be determined for all types of exams. For example, it can not calculate the
reliability of the speed tests. A speed test in which people are expected to get every
item they encounter correct, but, because of time limitation most people will not
finish the test. However, coefficient alpha can determine the reliability of power
tests. A power test is an exam in which all people are intended to finish, but,
because of difficulty of the items many people will get a number of items incorrect
(Marx, 1988).
There are many factors that influence the reliability; speed of the test, test
length, item difficulty, the number of the options offered in an item, subjectivity on
the scoring and group homogeneity (Marx, 1988).
3.6.3 Item Difficulty
Item difficulty was calculated for each item. Item difficulty, p, is
essentially average score for a particular exam question. It shows how much ratio
of the students answers the item correctly. It ranges from 0.00 to 1.00. A high item
difficulty, for example above 0.50, shows a majority of the students answered the
item correctly i.e. the higher the value of the item difficulty, the easier the test

40
question. According to Gronlund and Liinn (1990), for a norm-referenced test, it is
very important to get rid of too easy or too difficult items for spreading scores, thus
increasing the reliability. However, for a criterion-referenced test, difficulty is not
as important as for a norm-referenced test. The main purpose of a criterion-
referenced test is to assess students’ performance on a content domain, and so,
difficulty level of an item depends on the difficulty of each specific objective
within the defined content domain. Therefore, any attempt to arrange difficulty
levels on a criterion-referenced test is behind the importance of the specification
table.
3.6.4 Item Discrimination Index
Item discrimination index, D, shows how a test item discriminates between
high scorers and low scorers. If a test has items with high discrimination indexes it
shows that high scorers on the exam tend to answer the items correctly whereas
low scorers tend to answer the items incorrectly. It ranges from -1 ≤ D ≤1. If a test
scores are normally distributed discrimination index can be obtained by comparing
the highest scoring 27 % versus the lowest scoring 27 % of the examinees Gregory
(as cited in Marx, 1988)
According to Gregory, interpretations of D values are as the followings;
• If D ≥ 0.40, the item is functioning quite satisfactorily.
• If 0.30 ≤ D ≤ 39, the item requires little or no revision.
• If 0.20 ≤ D ≤0.29, the item is marginal and needs revision.
• If D ≤ 0.19, the item should be eliminated or completely revised.
3.6.5 Descriptive Statistics
The following is a brief overview of commonly used statistical terms to
describe properties of the exam scores.
• Mode- The mode is the most frequent score in a distribution.
• Median- The median is the point below which 50 percent of scores
fall.
41
• Mean- The mean is the arithmetic average of the scores in a
distribution.
• Standard Deviation- The standard deviation is the average of the
differences between the scores and the mean. It shows how the
scores are spread throughout the distribution.
• Skewness- The skew of a distribution indicates how much a
distribution “leans” toward low scores or high scores, relative to
the mean. A positive skew means there are more scores at the low
end, while a negative skew means there are more scores at the high
end. The skew can have values from - √t to √t, where t is the
number of the test items.
• Kurtosis- The kurtosis measures how much the distribution is
peaked or flattened as compared to the normal distribution. A
positive kurtosis corresponds to a peaked distribution, while a
negative kurtosis corresponds to a flattened distribution. The
kurtosis can have values from –t to t, where t is the number of the
test items.
42
CHAPTER 4
RESULTS
In this chapter results of the study were explained in three parts. First,
interview results are explained. In the second part, the results of the open-ended
tests are presented in a table. In the third part, the statistical analyses for the results
of the TTGOMT are presented.
4.1 Interview Results
The investigator prepared a questionnaire on the basis of the literature
results. In literature review, there were so many studies found conducted to
investigate the students’ misconceptions in geometrical optics. In these studies
different types of methods were used to collect data; interviews, open-ended
questions, multiple-choice tests and two-tier tests. The investigator extracted the
questions of the interview questionnaire from these studies. Some of the questions
were taken without making any changes and some of the questions were modified.
There were 16 open-ended questions in the questionnaire. Some questions required
students to draw a diagram that describes and explains a phenomenon. These types
of questions included some simple sketches and students were asked to complete
the sketches in a manner that explains the physical phenomenon. It was said to the
students that their drawings were not expected in artistic standards and their simple
drawings would be enough. Moreover, these types of questions and also the other
types of questions were supported by simple demonstrations. In some questions
verbal presentation used only.
Question 1 was presented verbally and asked the following: In a room
perfectly sealed to external light there are some flowers in a vase. When a candle is
lit in the room, one can see that the vase is white and that there is a red flower, a
yellow flower, a purple flower, a pink flower and some green leaves. What will we
see after the candle is extinguished? 8 students explained that light is necessary to
see the objects. If there is no light, we can not see anything. Their colors are not

43
important. The important thing is light. If light is present, it hits to the objects and
reflects from them to our eyes and we can see the objects. 2 students said they
would see the white vase only. Because, light colored objects can radiate the light
by themselves. This is their inner features. 4 students said they would see just the
shapes of the objects but they could not perceive the colors of the objects. They
explained this situation like that since the light was not in the medium, it could not
come to their eyes so they could not realize the colors of the objects. One of these
students said, the eyes would get used to darkness and we would see the objects
and we would see the light colored objects better than dark colored objects. One
student said that she could see the vase and also she could see the shapes of flowers
but not their colors. Because, before the candle was extinguished the white vase
absorbed all the lights on it. The others were absorbed less light because they were
selector compared to the white colored objects. One student, interestingly, said that
she could not see anything. Because, when the candle was extinguished, black light
comes to the vase and reflects from it. So, since black light comes to our eyes we
can not see the objects.
Question 2 asked the students whether the light travels a different distance
depending upon whether it is day or night. 9 students said that the light travels
equal distances on a day and at a night. It has a constant velocity in the atmosphere
so it travels equal distances. If the light enters in a different medium with a
different index so it will travel different distance. One student said that light seems
to travel faster at night. Because, the light is clearer at night and it is less clear in
the sun shine. Therefore, the light seems to travel faster in the darkness than in a
sunny day. 2 students thought that light travels faster in the dark. Because, in the
day light there can be some light in the medium to block the light and slow down
the light. However, in the darkness there is no light to block our light and therefore
it goes much distance. One student said that it travels a different distance. Because,
we see better and far distance in daylight but we see worse and less distance at
night. One student said it travels faster in the daylight but he could not explain the
reason. One student said that he does not know the answer.

44
In Question 3, the students were asked to predict what they would see on
the screen if a card with a small hole was placed on the middle of the light bulb and
question 4 is the next question of the third question, the students were asked to
predict what would happen when the screen was moved farther and farther away
from the light bulb. One student explained these both questions correctly. 9
students said that illuminated region would get smaller and if the screen was
moved from light bulb illuminated region would get bigger according to similarity
principle valid for the triangles. 3 students explained that the screen would be
illuminated completely and two of them said that illuminated region get bigger
according to the similarity principle. One of the student from these students said
that the screen, again, would be illuminated completely, nothing would be changed.
However, this student said nothing about the intensity of the illumination. One
student said that illumination region would get smaller and when the screen was
moved away, the intensity of the light decreased so it would be illuminated less but
the region of the illuminated part would get bigger. One of the students explained
the situation similarly like that the previous student but he predicted the shape of
the illuminated region on the screen as a rectangular shape.
Question 5 asked to the students why the shadow of the pencil diffused
when the pencil was removed from the screen and became clearer when the pencil
was drawn near to the screen. 5 students explained the situation in a correct
scientific way. 5 students could not explain the situation. One student said that
when the pencil was near the bulb it was illuminated too much therefore the
shadow of the pencil was not formed clearly. When the pencil was drawn near to
the screen, since the light became far away from the pencil, we can see the shadow
clearer. One student said that as the pencil was drawn near to the bulb, the angle of
the emerging rays from the top and bottom increased and the shadow got bigger.
So it lost its sharpness. Moreover, one student said that since the shadow got
bigger, the probability of the light from other sources in the medium increased so it
lost its sharpness.
Question 6 wanted the students to predict the shape of a small bead put in
front of a cross shape light source. Only two students predicted the shadow shape
of the bead as cross shape. 7 students predicted the shadow of the bead as a circular
shape. Most of them said that the shape of the light source is not important; the

45
important thing is the shape of the object put in front of the light source. 3 students
predicted the shape of the bead as circular like seven students did. But, they said
that there would be a cross illuminated area on the screen and the circular shape of
the bead would be in the centre of the cross illuminated area. One student
interestingly predicted 3 circular shapes on the screen and attributed this to the
shape of the light source. He explained that the light source had three parts one was
in the middle and vertical and the other two were horizontal near the right and left
side of the vertical part. Since the light source had three parts there would be three
circular shadow shapes on the screen. One student predicted the shape as a daisy
shape. One student predicted the shadow as a mix shape of cross and circular
shape.
In Question 7 it was said to the students that there would be a cross shape
shadow on the screen and wanted them to explain why there would be a cross
shape. Only one student explained the situation scientifically correct. Three
students said that it can not be cross shape. Because, the shape of the shadow has to
be similar to the shape of the object. 4 students said that they do not know and
insisted that it can not be a circular shape. One student said, it would be a mix
shape of circular and cross shapes. It can not be a cross shape only. Two students
decided that there could be a cross shape after drawing some rays on the sketch.
The other students could not explain the situation.
In Question 8 there were two light sources side by side and a small card
and a screen were mounted upright to the these sources respectively in the sketch.
Students were wanted to predict the shape of the shadow when the both sources
were turned on. In question 9 the correct shape of the shadow was showed to them
and wanted them to explain the situation. 10 students predicted that there would be
a total darkness and semi-darkness on the right and left of the total darkness and
explained the situation scientifically correct. Three of the ten students predicted the
shape of the shadow correct but explained the semi-shadows in the wrong way.
They said that these were due to mixture of illumination and darkness. They
confused the situation with harmony of the colors. One of the student among these
three students said that the shadow inhibited the full illumination. 3 students
predicted that the shadows due to each light source would intersect and there would
be a total darkness in the intersection area and the other parts would be illuminated.
46
Because, these parts took light from the one of the light sources even if the other
one was blocked. One student predicted that there would be a full shadow on the
screen due to connection of the both shadows.
In Question 10, the student was seated in a position that is no longer
directly in front of a covered plane mirror but beyond the right edge. The rod was
also placed beyond the right edge so that the positions of the rod and student lied
along a line that intersected the covered mirror. The students were asked whether
they would see the image of the rod in the mirror if the mirror was uncovered and
also the same question was asked for the investigator. 5 students answered the
question correctly for both observers; for himself or herself and for the observer.
Two students said that if the angle was proper the image would be created on the
mirror and both observers would see the image. These students drew different
images of the rod in different places for both observers. One student said that both
observers could not see the image. Because, the rod was not inside the front region
straight ahead of the mirror in order for its images to be seen. One student said both
observers would see the image. Because, the rays from the rod would reflect to the
both observers. So, they would see the image in the mirror. Two students said that
they would see the image. Because, the light would come to their eyes and reflect
from their eyes to the object then would go to the mirror and create the image so
they would see it. The investigator would not see. Because, the light emerging from
the observer’s eye would not go to the mirror. So, the observer could not see the
image. According to them, the image was created in the sight line of the observer.
Three students said that they would see the image and the observer would not see
it. Because, the object was in their sight region whereas it was not in the sight
region of the investigator.
In Question 11, in a room, a lamp was the only illuminant inside the room.
An observer looked to the mirror and could see an image of the pencil in the mirror
placed in front of the plane mirror. The students were wanted to predict what
happened to the image of the pencil if the lamb was raised a bit higher. 5 students
said that there would be nothing to the image which is a scientifically correct
answer. 4 students mistook images for shadows and said that it would get smaller
and slide down to the mirror. One student said that the light would come to the eye
and reflect to the mirror and the person could see the image. When the light was

47
raised the image would slide up to the mirror. 3 students said that, since the angle
of the incident ray changed, the image would be located in a different position. In
here, the angle of the incident ray slide down, so the image would slide down. One
student drew rays and concluded that the image would slide to the left.
In Question 12, students were wanted to express image formation of white
and black balls in a plane mirror. 4 students expressed image creation process
correctly for each ball. 7 students said that the light came to the ball from the sun
and reflected from it to the mirror and again reflected from mirror to the eye so the
person could see the ball. It was the same thing for the black ball. One student
attributed the situation to the characteristic structure of the mirror. This structure
was as similar to eye’s structure. The image of the object was created in the mirror.
So, the mirror created the images for each ball. Two students said that since both
balls were in the sight region, the observer could see each ball. The color of the
object was not important for seeing them. One student said that, the light from the
eyes went to the ball and then to the mirror and the image was created in the
mirror. It was the same thing for the black ball.
In Question 13, students were asked whether they would see an image of a
light bulb when all the lights were turned off and the light bulb was also turned off
and the light from outside could not get into the room. 9 students said that they
could not see the image. They explained that since there was no light, the image
could not be created in the mirror. Two students said that our eyes got used to
darkness and we could see the objects. We could not see them exactly and there
would not be a clear image in the mirror, but we could realize their shapes. One
student said that we could see the white and light colored objects even if the room
was dark. The light emerged from these objects so we could see them. However,
we could not see dark colored objects since there was no light to emerge in dark
colored objects.
Question 14 was a following question of the previous question. The
students were asked even if you could not see the image of the object, there would
be an image in the plane mirror. Three of the nine students said that there would be
an image in the mirror even if they could not see it in the plane mirror.

48
Question 15 is a following question of the previous question. Students
were asked whether they would put their fingers exactly the same place as for the
previous question if they were seated in the investigator’s position. 8 students said
that again they would put their fingers on the top of the rod. The others said they
would put their fingers to the different places. One student said that for the
shadows the position of the eye was important so the location of the image looking
from different positions would change. 3 students said that they would put their
fingers to the different places. Because, anyone looking from different positions
sees the image of the object in different positions. Two students said that if anyone
moves toward to the right the image of the object will move to the left. One student
said that it depends on the angle between the mirror and the rod.
In Question 16, there was a girl standing one side of a room and looking to
the mirror. There was a flower in the room and the girl could see the flower. The
students were wanted to explain how the girl could see the flower in the mirror. 6
students explained the situation correctly. Five students explained that the light
came to the mirror and the image was created in the mirror and the girl saw it since
it was in the sight region of the girl. Some of these students said only that the
flower was in the sight region of the girl so she could see the flower. One of the
four students said the structure of the mirror was similar to the eye. One student
explained the situation as like the four students. But, he said that firstly, the light
reflected from the mirror and then went to the flower. Then, it again reflected from
flower to the mirror and created the image in the mirror and since it was in the
sight region of the girl she would see it. Two students said that the light emerged
from the girl’s eyes came to the mirror and reflected to the flower so the girl could
see the flower. One student said that the image would be located on the mirror with
an angle of 90º between the flower and the mirror. But, the girl would not see it
there. Since she was looking to the mirror from right side, she would see it on the
left side of the mirror. The image would slide to the left. It was related with the
sight angle of the girl to the mirror.

49
4.2 Open-Ended Test Results
The open-ended test was administered to 141 11th grade students from
three different schools. The results of the test were categorized for each item based
on the students’ responses.
Table 4.1 shows the categories and category frequencies for each item.
Categories were formed based on the answers of the students on the open-ended
test items. The researcher wrote answers of the students for each item. Then, he
grouped the similar answers and created one factor that comprises all the answers
in that group. Some of the categories having no frequencies were extracted from
interview results and literature results even if they have no frequency in the open
ended test results. The categories which have “*” sign are the correct answers.
Table 4.1 Categories of the Open Ended Test Results for Each Item
Categories Frequencies
When the candle is extinguished, black light will be in the
medium. Therefore, the objects will reflect of black
colored.
-
When the candle is extinguished, the eyes will get used to
seeing in the darkness.
14
Even if the colors of the objects can not be seen exactly,
the shapes of the objects can be seen.
10
Item
1
* There is nothing can be seen. To see the objects the light
must reflects of objects and enter into the eyes of the
observer.
75

50
Table 4.1 (continued)
The white vase and light colored objects will be seen.
Because, these objects emits light by themselves, thus
making themselves to be seen in the darkness.
12
Categories Frequencies
The light travels more distance at nights. Because,
reflection is at the minimum level in the nights.
15
The light travels more distance at the daytime. Because,
the distant objects that can be seen in the daytime can not
be seen in the nights.
3
The light travels more distance at the daytime. Because,
the sunlight helps it to move further distances.
4
* The light travels equal distances whether it is daytime or
night. The velocity of the light depends on the density of
the medium.
51
The light travels more distance in the daytime. Because, it
uses its energy for going further and also illumination of
the medium. In the daytime, it is not necessary to
illuminate the medium.
3
The light travels more distance at nights. Because, the
light spreads out to everywhere in the day time, whereas it
focuses on a fixed point in the darkness.
10
The light travels more distance in the daytime. Because,
the sunlight blocks the motion of the light.
13
The bulb gives more powerful light when it gets bigger.
The more the light, the more it hits the pencil, thus
creating clearer shadow.
21
The shadow gets smaller when the bulb gets bigger. When
a shadow gets smaller, it will be clearer.
38
* When the bulb gets smaller it will approach a point light
source that causes less semi shadows areas. Therefore, the
shadow gets clearer.
23
Item
2
The bulb sizes do not affect the clearness of the shadows. 17
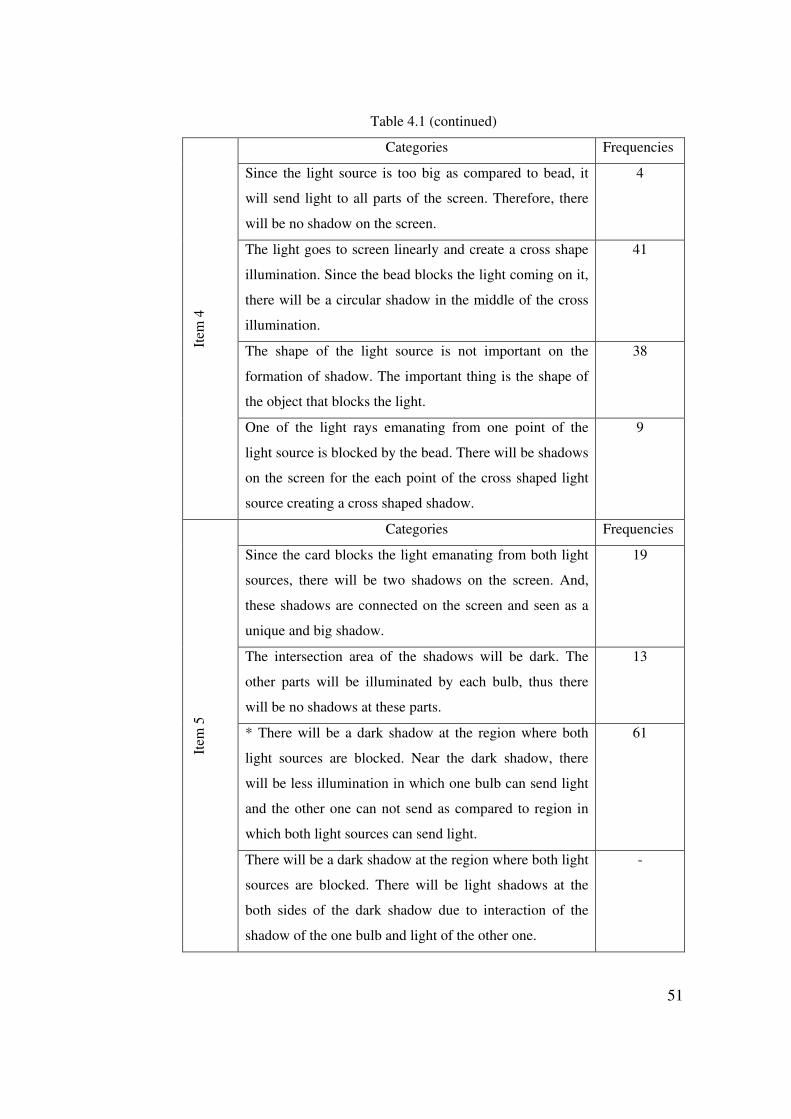
51
Table 4.1 (continued)
Categories Frequencies
Since the light source is too big as compared to bead, it
will send light to all parts of the screen. Therefore, there
will be no shadow on the screen.
4
The light goes to screen linearly and create a cross shape
illumination. Since the bead blocks the light coming on it,
there will be a circular shadow in the middle of the cross
illumination.
41
The shape of the light source is not important on the
formation of shadow. The important thing is the shape of
the object that blocks the light.
38
Item
4
One of the light rays emanating from one point of the
light source is blocked by the bead. There will be shadows
on the screen for the each point of the cross shaped light
source creating a cross shaped shadow.
9
Categories Frequencies
Since the card blocks the light emanating from both light
sources, there will be two shadows on the screen. And,
these shadows are connected on the screen and seen as a
unique and big shadow.
19
The intersection area of the shadows will be dark. The
other parts will be illuminated by each bulb, thus there
will be no shadows at these parts.
13
* There will be a dark shadow at the region where both
light sources are blocked. Near the dark shadow, there
will be less illumination in which one bulb can send light
and the other one can not send as compared to region in
which both light sources can send light.
61
Item
5
There will be a dark shadow at the region where both light
sources are blocked. There will be light shadows at the
both sides of the dark shadow due to interaction of the
shadow of the one bulb and light of the other one.
-

52
Table 4.1 (continued)
Since each bulb sends light to the areas that the other one
can not, there will be full illumination on the screen.
3
Categories Frequencies
The line sight of the teacher does not intersect the mirror,
whereas the line sight of the student intersects the mirror.
32
* The light rays reflecting from the pencil reflect of the
mirror and come to the teacher. However, it is not possible
for the student.
36
Since the pencil is not inside the front region straight
ahead the mirror, both observes can not see the image of
the pencil.
9
Both observers can see the image. Because, the pencil is
inside the sight region of the both observers.
3
The light ray emanating from the eyes of the teacher come
to mirror and reflects toward to the pencil. It is not
possible for the student.
-
Item
6
The image is formed in the mirror and both observers can
see it since their sight angles are appropriate.
9
Categories Frequencies
* Since, the position of the pencil is fixed there will be no
change. Because, image formation is not related with the
location of the light source.
42
When the bulb holds up, the angle of the light rays will
change causing the image to slide down.
23
When the bulb holds up, the angle of the light rays with
the horizontal will get bigger causing the image to get
smaller.
17 Item
7
When the bulb holds up, the light rays will extend with a
bigger angle. Therefore, the incident rays become greater
and the image will get bigger.
8

53
Table 4.1 (continued)
Categories Frequencies
Going away from the mirror or removing to the mirror
widens the sight angle causing to see the whole parts of
the body.
59
* Changing the angle of the mirror provides to see whole
parts of the body.
19
Approaching the mirror widens the sight angle causing to
see the whole parts of the body.
3
Item
8
Going up a higher position causes the increasing of the
sight region causing to see the whole parts of the body.
9
Categories Frequencies
The black ball reflects of the light to the mirror and the
light reflects from the mirror and come to the observer’s
eyes.
43
The light rays emanating from the observer’s eyes reflect
from the mirror and comes on the black ball.
5
The black ball emits black light rays and these rays reflect
from the mirror and come to the observer’s eyes.
-
The color of the ball is not important. Since the black ball
is inside the line sight of the observer, the observer can see
it.
53
* The light rays coming from the surroundings of the
blackball reflect to the mirror and come to observer’s
eyes. However, there will be no light reflecting from the
ball to the mirror and thus creating a dark area due to
absence of the light.
5
Item
9
The black ball neither scatters nor emits light. -

54
Table 4.1 (continued)
Categories Frequencies
* Since there is no light in the room, an image will not be
formed in the mirror.
57
Since the bulb is white colored, it can emit light and an
image will be formed in the mirror.
4
There will be an image in the mirror due to inner
characteristics of the mirror. But, the observer can not see
the image since there is no light.
32
In the total darkness, eyes will get used to darkness and
the observer will see the image even if it is not clear.
1
Item
10
Since the room is in total darkness, there will be black
light rays in the medium and they will reflect to the
mirror. But, since all the reflections are black, the observer
can not differentiate the image of the bulb.
4
Categories Frequencies
Since the line sight of the student is changed, the student
will see the image at the right side of the mirror.
37
Since the student slides to the left side, the image will
slide to the left side, too.
6
Item
11
* Since the location of the pencil is fixed, the student will
see the image at the same place in the mirror.
54
Categories Frequencies
* The flashlight should be aimed at his chin. The light rays
coming from the chin reflect from the mirror and comes to
his eyes.
55
The flashlight should be aimed at his chin. 26
The flashlight should be aligned parallel to the mirror. 9
Item
12
The direction in which the flash light is aimed does not
make any difference.
5
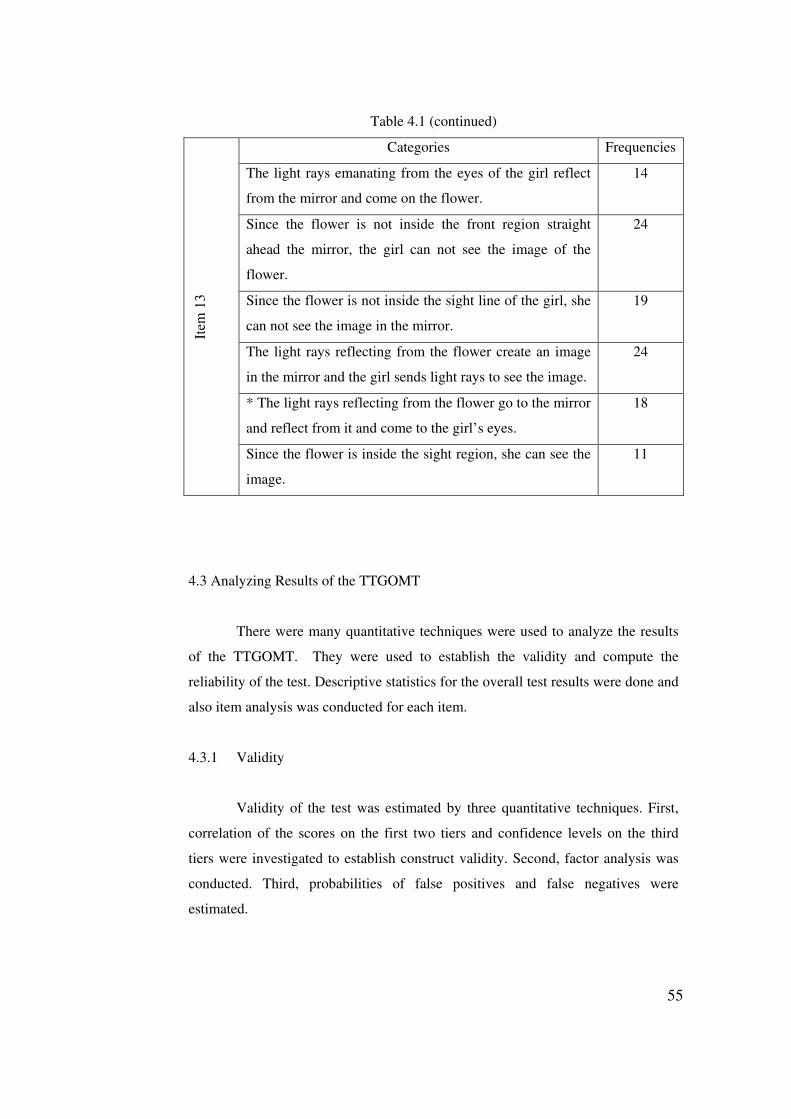
55
Table 4.1 (continued)
Categories Frequencies
The light rays emanating from the eyes of the girl reflect
from the mirror and come on the flower.
14
Since the flower is not inside the front region straight
ahead the mirror, the girl can not see the image of the
flower.
24
Since the flower is not inside the sight line of the girl, she
can not see the image in the mirror.
19
The light rays reflecting from the flower create an image
in the mirror and the girl sends light rays to see the image.
24
* The light rays reflecting from the flower go to the mirror
and reflect from it and come to the girl’s eyes.
18
Item
13
Since the flower is inside the sight region, she can see the
image.
11
4.3 Analyzing Results of the TTGOMT
There were many quantitative techniques were used to analyze the results
of the TTGOMT. They were used to establish the validity and compute the
reliability of the test. Descriptive statistics for the overall test results were done and
also item analysis was conducted for each item.
4.3.1 Validity
Validity of the test was estimated by three quantitative techniques. First,
correlation of the scores on the first two tiers and confidence levels on the third
tiers were investigated to establish construct validity. Second, factor analysis was
conducted. Third, probabilities of false positives and false negatives were
estimated.
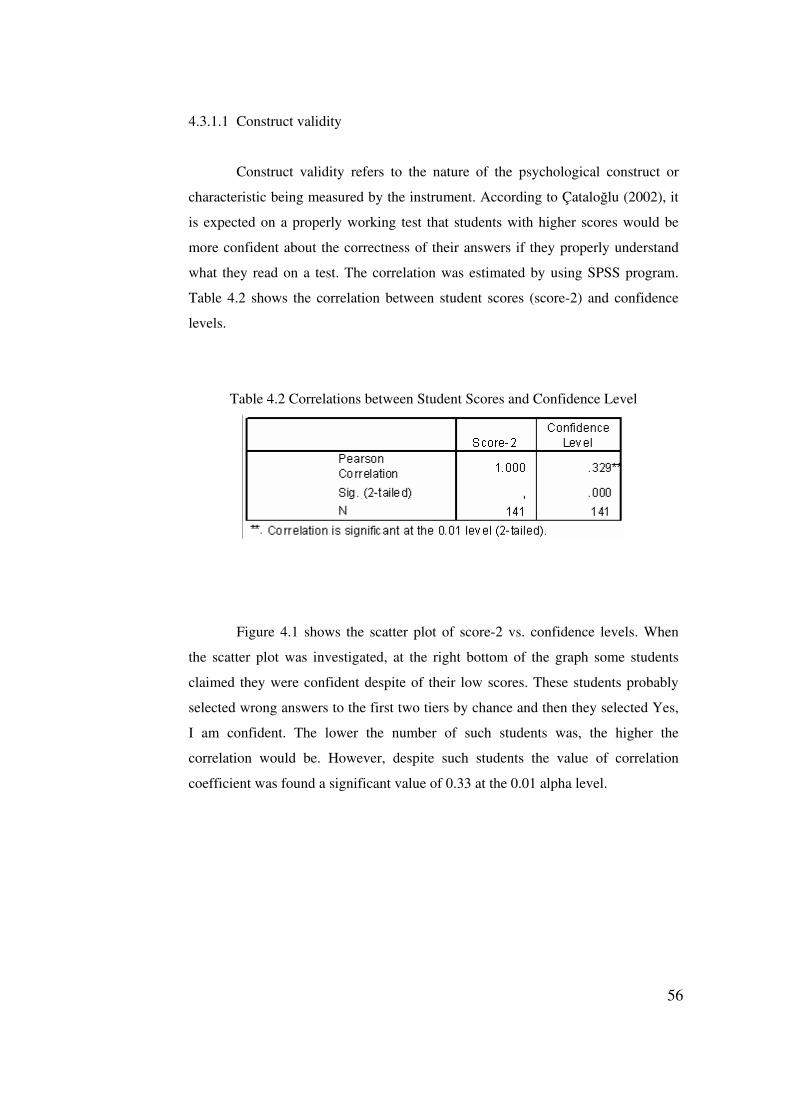
56
4.3.1.1 Construct validity
Construct validity refers to the nature of the psychological construct or
characteristic being measured by the instrument. According to Çataloğlu (2002), it
is expected on a properly working test that students with higher scores would be
more confident about the correctness of their answers if they properly understand
what they read on a test. The correlation was estimated by using SPSS program.
Table 4.2 shows the correlation between student scores (score-2) and confidence
levels.
Table 4.2 Correlations between Student Scores and Confidence Level
Figure 4.1 shows the scatter plot of score-2 vs. confidence levels. When
the scatter plot was investigated, at the right bottom of the graph some students
claimed they were confident despite of their low scores. These students probably
selected wrong answers to the first two tiers by chance and then they selected Yes,
I am confident. The lower the number of such students was, the higher the
correlation would be. However, despite such students the value of correlation
coefficient was found a significant value of 0.33 at the 0.01 alpha level.

57
Confidence Level
181614121086420
Stu
de
nts
' Sco
res
12
10
8
6
4
2
0
-2
Figure 4.1 Scatter plot of Student Scores for the First Two-tiers
vs. Confidence Levels
4.3.1.2 Factor analysis
The second quantitative technique for establishing the validity is factor
analyzing. When several items are asked to the same examinees, one aspect of
validation may involve determining whether there are one or more clusters of items
on which examinees display similar relative performance. These clusters are called
factors. A factor is an unobservable or latent variable. There were two factor
analyses were conducted. One of them was conducted based on the correct answers
of the students on all the three tiers. The other one was conducted based on the
misconceptions of the students for on all the three tiers.
Firstly, the factor analysis which is based on the correct answers for all the
three tiers were conducted. Before starting to conduct a factor analysis, there are
some requirements should be satisfied to conduct it. These requirements were
satisfied. The variables were in dichotomous nominal level. The sample size was
141 which is greater than 50. The ratio of cases to variables was 9 to 1 which is
greater than 5 to 1. The correlation matrix for the variables must contain 2 or more
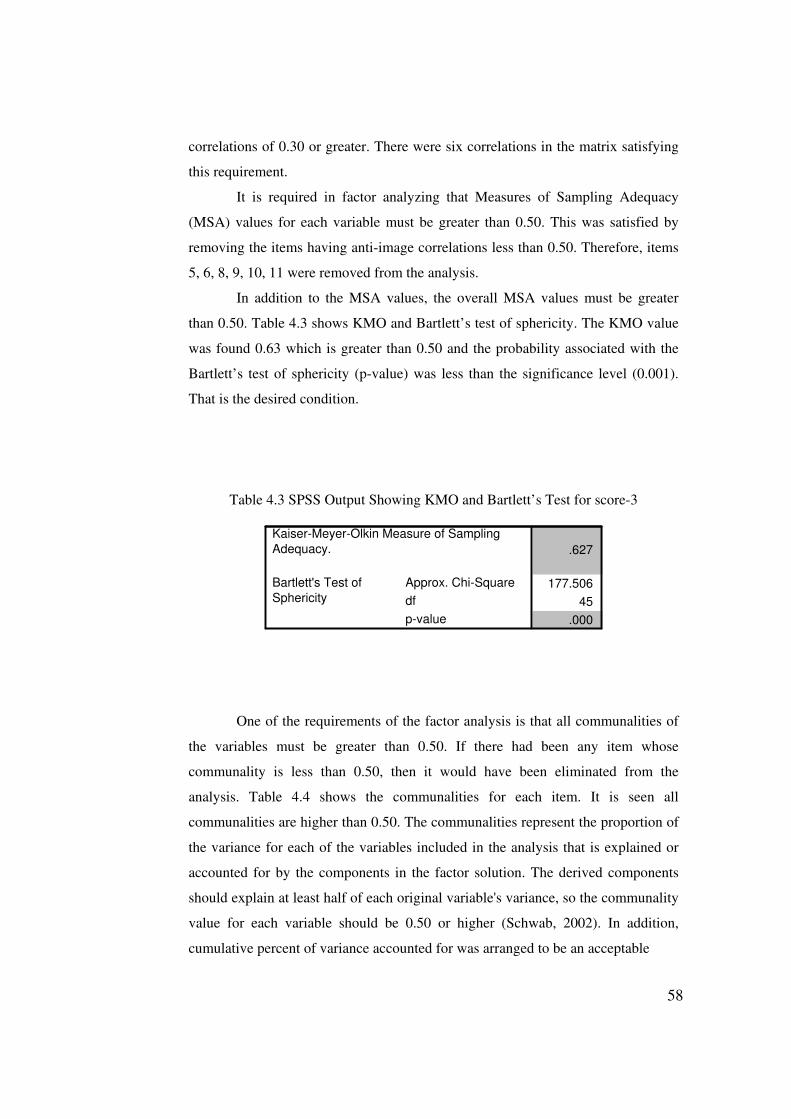
58
correlations of 0.30 or greater. There were six correlations in the matrix satisfying
this requirement.
It is required in factor analyzing that Measures of Sampling Adequacy
(MSA) values for each variable must be greater than 0.50. This was satisfied by
removing the items having anti-image correlations less than 0.50. Therefore, items
5, 6, 8, 9, 10, 11 were removed from the analysis.
In addition to the MSA values, the overall MSA values must be greater
than 0.50. Table 4.3 shows KMO and Bartlett’s test of sphericity. The KMO value
was found 0.63 which is greater than 0.50 and the probability associated with the
Bartlett’s test of sphericity (p-value) was less than the significance level (0.001).
That is the desired condition.
Table 4.3 SPSS Output Showing KMO and Bartlett’s Test for score-3
.627
177.506
45
.000
Kaiser-Meyer-Olkin Measure of Sampling
Adequacy.
Approx. Chi-Square
df
p-value
Bartlett's Test of
Sphericity
One of the requirements of the factor analysis is that all communalities of
the variables must be greater than 0.50. If there had been any item whose
communality is less than 0.50, then it would have been eliminated from the
analysis. Table 4.4 shows the communalities for each item. It is seen all
communalities are higher than 0.50. The communalities represent the proportion of
the variance for each of the variables included in the analysis that is explained or
accounted for by the components in the factor solution. The derived components
should explain at least half of each original variable's variance, so the communality
value for each variable should be 0.50 or higher (Schwab, 2002). In addition,
cumulative percent of variance accounted for was arranged to be an acceptable

59
value, 70 % under the criterions for retaining the factors. The cumulative percent of
variance was 70.4 % which is an acceptable value.
Table 4.4 SPSS Output Showing Communalities
1.000 .658
1.000 .685
1.000 .657
1.000 .699
1.000 .716
1.000 .787
1.000 .728
1.000 .820
1.000 .636
1.000 .651
Q1
Q2
Q3
Q4
Q7
Q12
Q13
Q14
Q15
Q16
Initial Extraction
Extraction Method: Principal Component Analysis.
Finally, items 13 and 16, 7 and 15, 4 and 3, 12 and 1 formed factors
according to factor analysis result, shown in Table 4.5.
Table 4.5 SPSS Output Showing Rotated Component Matrix for the score-3
.791 .304 -.062 .034 -.068
.783 -.038 .166 .038 -.083
.135 .770 .125 .169 -.248
.272 .607 -.210 .219 .320
.244 -.122 .790 -.003 -.029
-.097 .157 .772 .002 .166
.247 .042 -.029 .867 .063
-.287 .372 .040 .673 .098
-.071 -.149 .047 .139 .859
-.183 .449 .312 -.051 .568
Q13
Q16
Q7
Q15
Q4
Q3
Q14
Q2
Q12
Q1
1 2 3 4 5
Component
Extraction Method: Principal Component Analysis.
Rotation Method: Varimax with Kaiser Normalization.

60
The reliabilities of the factors were estimated 0.58, 0.44, 0.47, 0.48 and
0.43 respectively for the first, the second, the third, the fourth and the fifth factors.
The correlation coefficients between the items were found 0.42, 0.30, 0.32, 0.32
and 0.28 respectively for the items 13 and 16, 7 and 15, 4 and 3, 14 and 2, 12 and
1. It is seen that the reliabilities of the factors are a bit low.
Correlation coefficient is the square of the correlation between two
variables. It gives information about at what ratio in the variance of a variable is
related with the other variable’s variance. Therefore, 18 % of the variance in item
13 is associated with the variance in item 16. Similarly, 9 % of the variance in item
7 is associated with the variance in item 15, 10 % of the variance in item 4 is
associated with the variance in item 3, 10 % of the variance in item 14 is associated
with the variance in item 2 and 8 % of the variance in item 12 is associated with
variance in item 1. Table 4.6 presents the interpretation of factors formed as a
result of the factor analysis.
Table 4.6 Interpretation of the factors
Item(s) Factor Name (Interpretation)
1 13, 16 Items 13 and 16 ask whether the image position of any object in
a plane mirror depends on the observer’s position.
2 7, 15
Items 7 and 15 ask whether an observer can see image of any
object that is not inside the front region straight ahead of the
mirror.
3 3, 4
Items 3 and 4 ask what would happen to the shadow of any
object when the illuminant position is changed or different sizes
of illuminants are used. Both items mainly focus on the shadow
formation with point of light source.
4 14, 2
Although there is a good relation in the items 14 and 2 in the
factor analysis, there is not a good expression to explain that
relationship.
Fac
tors
5 12, 1 Items 12 and 1 ask whether the objects are seen in the total
darkness.

61
Secondly, besides conducting the factor analysis for the correct answers of
the students for all of the three tiers, a factor analysis was also conducted for the
students’ misconceptions on the TTGOMT by considering all of the three tiers. All
the requirements were satisfied to conduct the factor analysis which was done for
the previous factor analysis. It is important to say that in the correlation matrix
there was no correlation found greater than 0.30. That result contradicts with
Schwab’s criteria (2002); the correlation matrix for the variables must contain 2 or
more correlations of 0.30 or greater. Table 4.7 shows the KMO and Bartlett’s test
of sphericity for the misconception-3. However, since the Bartlett’s test of
sphericity (p-value) was significant, the factor analysis was continued.
Table 4.7 SPSS Output Showing KMO and Bartlett’s Test for
misconception-3
.500
61.903
1
.000
Kaiser-Meyer-Olkin Measure of Sampling
Adequacy.
Approx. Chi-Square
df
Sig.
Bartlett's Test of
Sphericity
The other requirements of the factor analysis were satisfied by adjusting
the MSA values for each variable to be greater than 0.50 and communality values
to be greater than 0.50. Both criteria were satisfied again by removing the
misconceptions having anti-image correlations less than 0.50 and communalities
less than 0.50. Therefore, except the misconceptions 12 and 18 all the
misconceptions were removed. In addition, the cumulative percent of variance was
80.0 % which was an acceptable value.
Finally, it is seen in Table 4.8 that only one factor was obtained.
Misconceptions 12 and 18 formed a factor together. In fact, it is an expected result.
Misconception 12 emphasizes that students think an image in a plane mirror lies
behind the mirror along the line of sight between a viewer and the object.

62
Misconception 18 focus on whether the image position changes in a plane mirror
when the observer changes his/her position.
Table 4.8 SPSS Output Showing Rotated Component Matrix for the
misconception-3
.895
.895
M18
M12
1
Component
Extraction Method: Principal Component Analysis.
The reliability of the factor was estimated by using Cronbah alpha and
found 0.75. And, the correlation coefficient between the misconceptions 12 and 18
was found 0.60. The coefficient of determination was found 0.36. It means that 36
% of the variance in Misconception 12 is associated with the variance in
Misconception 18.
4.3.1.3 Proportion of False Positives and False Negatives
Hestenes and Halloun (1995) stated that to be certain how accurate the test
results, false positives and false negatives must be estimated. This estimation
actually is an indication of the content validity as the same as the factor analysis.
They used follow-up interviews to estimate the false positives and false negatives.
However, this estimation was a qualitative data and also time consuming.
Moreover, the results were from the interviews not from the original test. Three-tier
tests are very suitable to compute the false positives and false negatives. Because,
not only students response to the first tiers, ordinary multiple choice item, but also
their reasoning is available from the second tiers.
63
The proportions of false positives and false negatives were estimated by
using Excel program. To compute the proportions, students’ responses for only the
first tiers and for only the second tiers were changed to metric level or dichotomous
(dummy-coded) nominal level i.e. correct responses were scored as 1 and wrong
responses were scored as 0. And then, the proportion of the false positives was
estimated by counting the students who gave correct answer to the first tier of any
item and wrong answer to the second tier of that item. This value was compared
with the number of the students (141). And percentage ratio was calculated easily
in the Excel program for each item. The mean of the false positives was calculated
by adding the all proportions of the false positives for each item and dividing it to
the number of the items. For the false negatives, wrong answers to the first tier of
any item and correct answer to the second tier of that item were counted. And
again, percentage ratio was calculated easily in the Excel program for each item
and mean proportion false negatives was found as similar with false positives. The
mean proportion of the false positives was estimated as 28.2 %. The mean
proportion of the false negatives was estimated 3.4 % which is a desired value.
According to Hestenes and Halloun (1995) the probability of false negatives should
be certainly less than 10 %.
4.3.2 Reliability
Coefficient alpha (α) was calculated to measure the reliability of the test. It
should be clear that α takes on values 0≤ α ≈1. The larger the value of α, the greater
the reliability of the test. The value of α for the three-tier misconception test
considering the correct answers of the students was 0.55. Perhaps this is not a
robust value. The reported reliability coefficients for the achievement tests are
typically 0.90 and for classroom tests are 0.70. In general it is acceptable that
reliability should be at least 0.70 (Fraenkel & Wallen, 1996, p. 163). It is important
to say that this reliability was calculated based on the correct answers for all three
tiers. Therefore it shows us how well the students understand the geometric optic
qualitatively in other words the students understood the geometric optic with a
reliability of 0.55. However, it is necessary to estimate the reliability by
considering the misconceptions. Therefore, one more reliability calculation was

64
also calculated based on the misconceptions for all three-tiers. It was found 0.28
which is smaller than the reliability of the correct answers. Since it was a low
value, a discrimination analysis was conducted by using the Excel program to
investigate the reason of the low reliability. The discrimination index was obtained
by comparing the misconceptions of the highest scoring 27 % versus the lowest
scoring 27 % of the students. And, the mean of the misconceptions’ discrimination
index was found 0.01. It shows us that high scorer students and low scorer students
had misconceptions nearly at same proportion.
4.3.3 Item Analysis
Item difficulty levels and item discrimination indexes on the TTGOMT
were estimated by using the ITEMAN item analysis program. Table 4.9 shows item
difficulty levels and discrimination indexes for each item. In Table 4.9, Prop.
Correct values represent the item difficulty levels. Point Biser. values represent the
correlation between student responses on an item scored as 0 or 1 (wrong or right)
and the score the student received on the test (Marx, 1988). In fact, it shows how a
test item discriminates between high scorers and low scorers as the item
discrimination does. Therefore, Point Biser. values represent the item
discrimination indexes.
Table 4.9 Output of the ITEMAN based on Score-3 Item Statistics Alternative Statistics
----------------------- -----------------------------------
Seq. Scale Prop. Point Prop. Point
No. -Item Correct Biser. Biser. Alt. Endorsing Biser. Biser. Key
---- ----- ------- ------ ------ ----- --------- ------ ------ ---
1 0-1 0.163 0.689 0.459 1 0.163 0.689 0.459 *
2 0.837 -0.689 -0.459
Other 0.000 -9.000 -9.000
2 0-2 0.255 0.730 0.538 1 0.255 0.730 0.538 *
2 0.745 -0.730 -0.538
Other 0.000 -9.000 -9.000
3 0-3 0.085 0.689 0.385 1 0.085 0.689 0.385 *
2 0.915 -0.689 -0.385
Other 0.000 -9.000 -9.000

65
Table 4.9 (continued)
4 0-4 0.177 0.459 0.312 1 0.177 0.459 0.312 *
2 0.823 -0.459 -0.312
Other 0.000 -9.000 -9.000
5 0-5 0.028 0.142 0.056 1 0.028 0.142 0.056 *
2 0.972 -0.142 -0.056
Other 0.000 -9.000 -9.000
6 0-6 0.213 0.584 0.415 1 0.213 0.584 0.415 *
2 0.787 -0.584 -0.415
Other 0.000 -9.000 -9.000
7 0-7 0.270 0.707 0.527 1 0.270 0.707 0.527 *
2 0.730 -0.707 -0.527
Other 0.000 -9.000 -9.000
8 0-8 0.028 0.551 0.215 1 0.028 0.551 0.215 *
2 0.972 -0.551 -0.215
Other 0.000 -9.000 -9.000
9 0-9 0.014 0.601 0.183 1 0.014 0.601 0.183 *
2 0.986 -0.601 -0.183
Other 0.000 -9.000 -9.000
10 0-10 0.057 0.461 0.227 1 0.057 0.461 0.227 *
2 0.943 -0.461 -0.227
Other 0.000 -9.000 -9.000
11 0-11 0.035 0.451 0.191 1 0.035 0.451 0.191 *
2 0.965 -0.451 -0.191
Other 0.000 -9.000 -9.000
12 0-12 0.284 0.519 0.390 1 0.284 0.519 0.390 *
2 0.716 -0.519 -0.390
Other 0.000 -9.000 -9.000
13 0-13 0.035 0.597 0.252 1 0.035 0.597 0.252 *
2 0.965 -0.597 -0.252
Other 0.000 -9.000 -9.000
14 0-14 0.305 0.681 0.518 1 0.305 0.681 0.518 *
2 0.695 -0.681 -0.518
Other 0.000 -9.000 -9.000
15 0-15 0.128 0.843 0.528 1 0.128 0.843 0.528 *
2 0.872 -0.843 -0.528
Other 0.000 -9.000 -9.000
16 0-16 0.064 0.356 0.182 1 0.064 0.356 0.182 *
2 0.936 -0.356 -0.182
Other 0.000 -9.000 -9.000
Mean P 0.13 Mean Item-Tot. 0.34
In the TTGOMT wrong answers are more important than true answers and
it has very strong distracters. Therefore, most of the items were very difficult and
had small difficulty levels. The average value of item difficulty was 0.13 and
ranged from 0.01 to 0.31.

66
The average value of the point-biserials, which are the item discrimination
indexes, on the TTGOMT was 0.34 with a maximum value of 0.54 and a minimum
value of 0.06. According to Gregory’s criteria the item with average discrimination
index requires little or no revision. So, the average item on the test was
discriminatory.
4.3.4 Descriptive Statistics
Table 4.10 summarizes the results of the general descriptive statistics
which were estimated by using SPSS program for the TTGOMT. The mean of the
scores was found 2.14 and with a 95 % confident true mean of the scores is
between 1.83 and 2.45. The standard deviation was found 1.88. It is a small value
considering a test with a possible maximum score 16. As it is seen, since the
standard deviation which shows how the scores spread throughout the distribution
was a small value, the reliability of the test for the correct answers was also a little
bit small value.
A positive and great value of skewness indicates that most of the students’
scores are low. A positive value of kurtosis shows that the distribution of the scores
corresponds to a peak distribution.

67
Table 4.10 Descriptive Statistics
Figure 4.2 shows the histogram of score-3. It is seen most of the scores are
at the low end which means the items were generally difficult for most of the
students.
# of Students 141
# of Items 16
Mean 2.14
Standard Deviation 1.88
Standard Error of the Mean 0.16
Lower 1.83 95 % Confidence Interval for Mean
Upper 2.45
Variance 3.52
Skewness 0.90
Kurtosis 0.46
Minimum 0.00
Maximum 8.00
Median 2.00
Mode 1.00
Reliability (Coefficient Alpha) 0.55
Standard Error of the Measurement 1.58

68
SCORES
8,07,06,05,04,03,02,01,00,0
Fre
qu
en
cy
40
30
20
10
0
Std. Dev = 1,88
Mean = 2,1
N = 141,00
Figure 4.2 Histogram for the Students’ Scores
4.3.5 Other Test Results
If Figure 4.3 is examined carefully, the proportion of each misconception
gradually decreases when the tiers of the test are increased from one to three one
by one. It is understood from Figure 4.3 that the first tiers overestimate the
proportion of the misconceptions. And also first two tiers, not as much as first tiers,
overestimate the proportion of the misconceptions. The percentages of the
misconceptions are given in Table 4.9. How these values were obtained was
mentioned in Section 3.5.

69
M1 M2 M3 M4 M5 M6 M7 M8 M9 M10 M11 M12 M13 M14 M15 M16 M17 M18 M19 M20
0%
5%
10%
15%
20%
25%
30%
35%
ALL THREE TIERS FIRST TWO TIERS ONLY FIRST TIER
Figure 4.3 Proportions of the Misconceptions in terms of Type of the Test
Table 4.11 Proportions of the Misconceptions Considering the Tiers of the Test
ALL THREE
TIERS
(Misconception-1)
FIRST TWO
TIERS
(Misconception-2)
ONLY FIRST
TIERS
(Misconception-3)
M1 4% 7% 10%
M2 4% 4% 13%
M3 11% 15% 23%
M4 4% 6% 31%
M5 18% 20% 17%
M6 18% 23% 30%
M7 5% 8% 19%
M8 4% 5% 7%
M9 10% 14% 17%
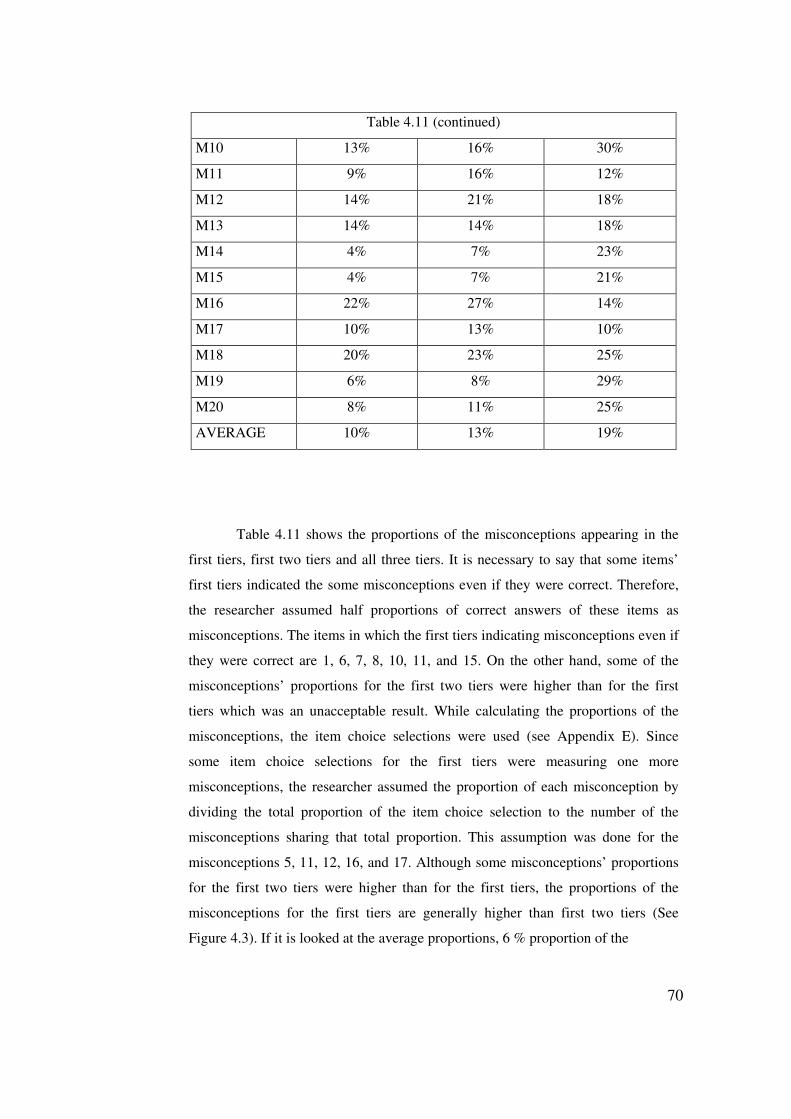
70
Table 4.11 (continued)
M10 13% 16% 30%
M11 9% 16% 12%
M12 14% 21% 18%
M13 14% 14% 18%
M14 4% 7% 23%
M15 4% 7% 21%
M16 22% 27% 14%
M17 10% 13% 10%
M18 20% 23% 25%
M19 6% 8% 29%
M20 8% 11% 25%
AVERAGE 10% 13% 19%
Table 4.11 shows the proportions of the misconceptions appearing in the
first tiers, first two tiers and all three tiers. It is necessary to say that some items’
first tiers indicated the some misconceptions even if they were correct. Therefore,
the researcher assumed half proportions of correct answers of these items as
misconceptions. The items in which the first tiers indicating misconceptions even if
they were correct are 1, 6, 7, 8, 10, 11, and 15. On the other hand, some of the
misconceptions’ proportions for the first two tiers were higher than for the first
tiers which was an unacceptable result. While calculating the proportions of the
misconceptions, the item choice selections were used (see Appendix E). Since
some item choice selections for the first tiers were measuring one more
misconceptions, the researcher assumed the proportion of each misconception by
dividing the total proportion of the item choice selection to the number of the
misconceptions sharing that total proportion. This assumption was done for the
misconceptions 5, 11, 12, 16, and 17. Although some misconceptions’ proportions
for the first two tiers were higher than for the first tiers, the proportions of the
misconceptions for the first tiers are generally higher than first two tiers (See
Figure 4.3). If it is looked at the average proportions, 6 % proportion of the

71
misconceptions disappeared as the tier was increased from one tier to two tiers. 3.4
% of the 6 % is the proportion of false negatives. The remaining 2.6 % is the result
of inconsistent answers. Similarly, 3 % proportion of the misconceptions
disappeared as the tiers of the test were increased from two tiers to three tiers. This
proportion stems from lack of knowledge. Because, in misconception-3, a
misconception is not accepted even if the answer of the student to the first two tiers
shows a misconception unless the student clarifies his/her confidence in the third
tier.
Figure 4.4 shows the proportion of the correct answers to each item in
terms of the tiers of the test. In fact, these proportions are the difficulty levels.
Table 4.12 shows the proportions of the correct answers for the score-1, score-2
and score-3. How these values were obtained was mentioned in section 3.5
I1 I2 I3 I4 I5 I6 I7 I8 I9 I10I11 I12
I13I14
I15I16
0%
10%
20%
30%
40%
50%
60%
70%
80%
90%
ALL THREE TIERS FIRST TWO TIERS ONLY FIRST TIER
Figure 4.4 Proportions of the Correct Answers in terms of Type of the Test

72
Table 4.12 Proportions of the Correct answers Considering the Tiers of the Test
ALL THREE
TIERS
(Score-3)
FIRST TWO
TIERS
(Score-2)
ONLY FIRST
TIER
(Score-1)
I1 16% 18% 30%
I2 26% 30% 37%
I3 9% 12% 52%
I4 18% 26% 34%
I5 3% 4% 12%
I6 21% 30% 59%
I7 27% 32% 46%
I8 3% 4% 52%
I9 1% 1% 50%
I10 6% 9% 57%
I11 4% 5% 81%
I12 28% 40% 54%
I13 4% 5% 33%
I14 30% 34% 37%
I15 13% 16% 67%
I16 6% 8% 26%
AVERAGE 13% 17% 45%
The average values are 45 % for the first tiers, and 17 % for the first two
tiers. The gab, 28 %, between the first tiers and first two tiers is due to false
positives. Besides, 4 % of the correct answers disappear when the tier of the test
was increased from two to the three. This proportion shows the lack of knowledge
of the students.

73
4.3.6 Summary of the Results
• In the interviews, the students showed in ability using the terminology. For
example, some of the students used refraction to mean reflection.
• In the interviews and open-ended test some new misconceptions were
found. These misconceptions are:
� Students believe that they can see the light colored objects in the
total darkness. Because, they emit light by themselves.
� Students claim that there will be black rays in the total darkness.
� Students think that the shadows of the objects are clearer when the
bigger bulb is used as a light source.
� Students claim that there will be no shadow even if a light source
and a non- transparent object exist together.
� Students think that shadow is black color and light is white color.
When they overlap, they mix and form the grey color. In a similar
way, they think when the shadow and light overlap, the shadow
reduce the brightness of the light.
• It was found that there was a significant correlation between the score-2
and confidence levels. It means that high scorer students were more
confident than low scorer students in the TTGOMT.
• There was a factor analysis conducted for the score-3 and 5 factors were
found with reliabilities 0.58, 0.44, 0.47, 0.48 and 0.43.
• There was also a factor analysis conducted for the misconception-3 and
one factor was found with a reliability of 0.75.
• The proportion of the false positives was estimated 28.2 % and the
proportion of the false negatives was estimated 3.4 %.
• The reliability of the score-3 was estimated by using Cronbach alpha and
found 0.55. It means 55 % of variance in the total scores is due to the
variance in the true scores.
• The reliability of the misconception-3 was estimated by using Cronbach
alpha and found 0.28. It means 28 % of variance in total misconception-3
scores is due to the variance of true student misconceptions.

74
• The average item discrimination index on TTGOMT was 0.34 with a
maximum 0.54 and a minimum 0.06. Item 5 with a discrimination index of
0.056 can be removed from the test. Because, its discrimination index was
too small.
• The average value of item difficulty was 0.13 ranged from 0.01 to 0.31.
• Histogram of the score-3 was right-skewed. It means the items of
TTGOMT were difficult for the students.
• The mean of the misconceptions’ discrimination indexes was found 0.01. It
means the high scorer students and the low scorer students had nearly same
proportion of misconceptions.
• The proportions of the misconceptions among the students decreased as the
tier of test was increased. The proportions of the misconception for one-
tier, two-tier and all three-tier of the TTGOMT were 19 %, 13 % and 10 %
respectively. The difference between the mean misconception proportion
of the one tier test and two-tier test was 6 % and the difference between the
mean misconception proportion of the two-tier test and three-tier test was 3
%. 3.4 % of 6 % was false negatives and remaining 2.6 % was inconsistent
student answers. The 3 % difference between the two-tier test and three-
tier test was due to lack of knowledge.
• The proportions of the correct answers of the students also decreased as the
tier of the test was increased. The proportions of the correct answers for
one-tier, two-tier and all three-tier of the TTGOMT were 45 %, 17 % and
13 % respectively. The difference between the mean proportions of the
correct answers to the one-tier test and two-tier test was 28 % which was
false positives. And, the difference between the mean proportions of the
correct answers to the firs two-tier and all three-tier was 4 % due to lack of
knowledge.
• It was found that misconception 16 (M16) (see Appendix E) was the most
frequent misconception among the students with 22 % of proportion.
Moreover, it was seen that the students gave most wrong answers due to
lack of knowledge for Misconception 12. 7 % of proportion of the
misconception disappeared since the students did not show their
confidence in the third tier.
75
CHAPTER 5
CONCLUSIONS, DISCUSSIONS AND IMPLICATIONS
This chapter consists of seven sections. The first section is the summary of
the study. The second section includes the conclusions based on the results. The
third section is the discussion of the results. Internal and external validities of the
study are given in the fourth and fifth sections respectively. The sixth section
presents the implications of the study. Finally, the last section presents the
recommendations for the further studies.
5.1 Summary of the Research Study
This study included development process of a three-tier test and
assessment of the misconceptions of 11th grade students about geometric optic with
this three-tier test. Research design of the study is a cross-sectional survey study.
Firstly, the literature was reviewed to investigate the students’ conceptions
about geometric optic. Second, interviews were conducted with 11th grade students
in the light of the literature review. Third, open-ended test was constructed based
on the interview and literature review results and administered to 114 the students.
Fourth, the TTGOMT was developed mainly based on the open-ended test results.
Interview results and literature review were also considered in the construction of
the test. Fifth, the test was administered to the 141 students and the results were
analyzed.
5.2 Conclusions
For establishing validity of the test two quantitative techniques were used.
First, the scores of the students for the first two tiers and the confidence levels of
the students for the third tiers were correlated and a positive correlation was found
to be 0.33. It shows students with high scores for the first two tiers of the test had
76
high confidence and students with low scores for the first two tiers had low
confidence. This indicates the students answered the test items sincerely and the
test functioned properly. It is important to say that three-tier tests have an
advantage over the two-tier tests in terms of discriminating students’ lack of
knowledge from their misconceptions by means of the third tier items which assess
how confident the students are about their responses for the first and second tiers. It
is known that misconceptions do not stem from lack of knowledge. Since, this
correlation deals with confidence levels of the students which is a physiological
construct, it can be attributed to the construct validity of the test. Second, factor
analyses were conducted by means of students’ scores (score-3) and students’
misconceptions (misconception-3) so that similar items or misconceptions formed
acceptable factors. Items 13 and 16, 7 and 15, 3 and 4, 2 and 14, 1 and 12 formed
factors based on the correct answers which are expected except the factor formed
by 2 and 14. In fact, it is expectable that items 8 and 9 to form a factor together.
Because, both items ask what would happen to image position or image size when
the bulb was raised. They mainly focus on the whether the students confuse image
formation with shadow formation. Also, item 10 can be expected in the factor
formed by the items 13 and 16. Because, both items mainly focus on whether the
image position depends on the observer’s position. Since, the item 10 also focus on
whether image position or size depends on the observer’s position, item 10 can be
expected in that factor. The reliabilities of the factors were estimated 0.58, 0.44,
0.47, 0.48 and 0.43 respectively for the first, the second, the third, the fourth and
the fifth factors. And, the correlation coefficients between the items were found
0.42, 0.30, 0.32, 0.32 and 0.28 respectively for the items 13 and 16, 7 and 15, 4 and
3, 14 and 2, 12 and 1. It is seen that the reliabilities of the factors are generally
small values. That can be attributed to two reasons. First, it is normal to have low
value reliability with two items. The reliability is increased with the number of the
items. Second, since the most of the items in the test were very difficult for the
students, the score of the students were not spread and thus created low reliability.
Since the items asking similar concepts formed factors which also had
been expected before conducting the factor analysis that can be attributed to the
content validity of the test. Moreover, a factor analysis was done for the
misconceptions and only one factor was found. Misconception 12 and 18 formed a
77
factor together with a reliability of 0.75 and correlation of 0.60. In fact, it is
expectable that the students who had the misconception 12 also had the
misconception 18. Because, both misconceptions mainly focus on that the image
position of the any object in the plane mirror depends on the position of the
observer.
The proportion of the false positives was estimated 28.2 %. This value is
not a too big value. Because, students have a chance to give responses randomly in
all multiple choice tests. In fact, powerful distracters of the TTGOMT which were
created based on the interview and open-ended test results may also appear
reasonably to the students causing the false positives. The proportion of the false
negatives was estimated 3.4 %. The probability of the false negatives can be
attributed to the carelessness or inattention of the students. This shows the
TTGOMT has items with good format and understandable language that prevent
students from fall in inattention or carelessness.
Two reliabilities were estimated by using Cronbach alpha. Reliability of
the test based on the correct answers was found 0.55 which is a little low value.
There were many items in the test with low item difficulties which caused the
reliability to be a little low. However, it is normal to have difficult items in a
misconception test. Because, the items had very strong distracters. It is possible to
increase reliability by removing difficult items. However, misconception tests are
criterion-referenced; therefore objective of an item is more important than its
difficulty level. This reliability shows us that the students understand the geometric
optic qualitatively with 0.55 reliability. Also, since the distracters of the TTGOMT
were created based on the interviews and open-ended test results, they seemed
reasonable to the students. Therefore, the items with powerful distracters were very
difficult for the students. That lowered the reliability of the test for the correct
answers. On the other hand, since the TTGOMT is a misconception test and it
focuses on the misconceptions, other reliability was also calculated based on the
misconceptions for all three-tiers. The reliability for the misconceptions was found
0.28 which is smaller than the reliability of the correct answers. This low value
may stem from that the students with higher scores also have as many
misconceptions as low scorers have. Therefore, a discrimination index was
conducted to explain the reason of that result. 27 % of the students who have the

78
highest score on the test and 27 % of the students who have the lowest score on the
test were compared considering the misconceptions that they possess. The mean of
the discrimination index was found 0.01. It shows that students who have high
scores on the test have as many misconceptions as the students who have low
scores. Therefore, there was no difference among the students in terms of the
misconceptions and the sample was a homogenous group as considering the
misconceptions. It is known that the more diverse the group, the more reliable the
exam i.e. if the sample is diverse, the variance of the observed scores will be
greater.
The mean of the item difficulty levels of the TTGOMT was 0.13. It shows
that the test was very difficult for the students. The reliability of the test for the
score-3 was a bit low since the scores of the students were not spread due to
difficult items. To improve the reliability of the test difficult items can be removed.
However, since this test is a misconception test it is not necessary to eliminate
difficult items. In misconception test wrong answers are more important than the
correct answers. On the other hand, the mean of the discrimination index of the
items was 0.34. It shows that an average item on the test is discriminatory.
When the changes in the proportion of the misconceptions were examined,
the proportions of the misconceptions were observed to lessen gradually as the tiers
of the test were increased one by one. It is observed that 6 % of the misconceptions
disappear when the tier of the test changed from one tier to two tiers. And, 3.4 % of
the 6 % was calculated as the false negatives. The remaining 2.6 % is the
inconsistent answers. However, this value is not a big value. Because, some items
have many distracters and since the test is a misconception test the items of the test
have powerful distracters. Therefore, students might have fallen in inconsistency
due to many and powerful distracters. It is also observed that 3 % of the
misconceptions disappeared when the tier of the test changed from two tiers to
three tiers. It is important to say that even if a student holds a misconception for the
first two tiers, it is not accepted as a misconception if the confidence is not stated in
the third tier. Therefore, that 3 % of decreasing proportion in the misconceptions
can be attributed to the students’ lack of knowledge. To sum up, multiple-choice
tests and two-tier tests over estimate the proportion of the misconceptions. They do
not take into account wrong answers due to mistakes or lack of knowledge.

79
When the changes in the proportions of the correct responses to each item
were examined, they were also observed to lessen gradually when the tiers of the
test were increased one by one. There was 28 % of a decreasing proportion when
the tier of the test changes from one tier to two tiers and 4 % when the test changes
from two tiers to three tiers. That 28 % decreasing was false positives. And, 4 %
can be attributed to the lack of knowledge. Because, the correct answers were not
accepted unless the students clarified their confidence in the third tier. These
results showed that the first tier of the test and even first two tiers overestimate the
proportion of students who have the correct conceptual understanding.
Finally, proportions of the misconceptions measured by each item were
calculated. Some misconceptions were measured by two or more items. However,
some misconceptions were measured by only one item. It is desired that each
misconception is measured by two or more items. However, even if these items
measure one misconception, their measuring proportions are very high (see Table
4.11).
In this study, besides the misconceptions found from the literature review,
some misconceptions were found that were not discussed before. It is important to
say that these misconceptions may have been studied. But the researcher could not
see them in the literature review. These new misconceptions are:
• Students believe that they can see the light colored objects in the
total darkness. Because, they emit light by themselves.
• Students claim that there will be black rays in the total darkness.
• Students think that the shadows of the objects are clearer when the
bigger bulb is used as a light source.
• Students claim that there will be no shadow even if a light source
and a non- transparent object exist together.
• Students think that shadow is black color and light is white color.
When they overlap, they mix and form the grey color. In a similar
way, they think when the shadow and light overlap, the shadow
reduce the brightness of the light.
80
5.3 Discussion of the Results
The validity of the test was estimated by three quantitative techniques.
According to Çataloğlu (2002) there should be a positive correlation between
students’ scores for the first two tiers and confidence levels for the third tier which
shows the construct validity of the test. The correlation was found for the
TTGOMT 0.33 which is a positive and significant value. According to Eryılmaz
and Sürmeli (2002) to accept a misconception of any student it is important that the
student must show his or her confidence. Because, the answer of the student for the
first two tiers may stem from lack of knowledge. Therefore, even if an item choice
selection points out a misconception for the first two tiers, it is not accepted as a
misconception without showing the confidence in the third tier. They said that
three-tier tests have an advantage over the two-tier tests in terms of discriminating
the students’ lack of knowledge. Huffmann and Heller (as cited in Hestenes and
Halloun, 1995) investigated the content validity of the FCI by conducting a factor
analysis. As Huffman and Heller did, a factor analysis was conducted to estimate
the content validity of the TTGOMT. There were 5 factors found in the TTGOMT
and 4 of 5 were expected. Items 13 and 16, 7 and 15, 3 and 4, 2 and 14, 1 and 12
formed factors which are expected, except the factor formed by 2 and 14. The
reliabilities of these factors were a bit small values. However, according to Marx
(1988) reliability can be influenced by the number of the items and item
difficulties. The greater the number of the items, the more reliable test and if a test
has too difficult or too easy items, the reliability will be low. Therefore, low
reliabilities of the factors can be attributed to these two reasons.
Hestenes and Halloun (1995), however, established the content validity of
the test by estimating the probabilities of false positives and false negatives instead
of conducting a factor analysis. In the TTGOMT the proportions of the false
positives and false negatives were found 28.2 % and 3.4 % respectively. These
values are satisfactory according to Hestenes and Halloun. According to them false
negatives can be attributed to the carelessness or inattention of the students. For the
false positives students have a chance to give responses randomly in all multiple
choice tests. However, they also emphasized that powerful distracters may also
appear reasonably to the students causing the false positives.

81
The reliability of the test for the correct answers of the all three tiers was
found 0.55 by using Cronbach alpha. The reported reliability coefficients for the
achievement tests are typically 0.90 and for classroom tests are 0.70. In general it is
acceptable that reliability should be at least 0.70 (Fraenkel & Wallen, 1996, p.
163). It was found that most items were difficult for the students. Since the items
were very difficult, the scores of the students did not spread, thus lowering the
reliability. However, Gronlund, and Linn (1990) stated that in norm-referenced
tests it is necessary to avoid from too difficult and too easy items to spread the
scores of the students for the discrimination. Spreading the scores of the students
causes high reliability. But, for criterion-referenced tests it is not necessary to avoid
from too difficult or too easy items. The important thing is not spreading the scores
of the students but the content in interest. Therefore, the reliability of the criterion-
referenced tests can be lower as compared to the norm referenced tests. The
skewness was found 0.90 which shows the items were generally difficult for the
students. Kurtosis was found 0.46 which shows a peak distribution. A peak
distribution shows most of the students’ scores are nearly similar, thus the scores
do not spread widely. Since the items were very difficult in the TTGOMT, the
scores did not spread, thus a low reliability. However, the TTGOMT is a criterion-
referenced test and having too difficult items is not concern.
The reliability for the misconceptions was found 0.28. It is important to say
that there is no reported acceptable reliability coefficient for the misconception
tests in the literature. Therefore, determining whether the 0.28 reliability is good or
bad is difficult. According to Marx (1988) group homogeneity influences the
reliability. It was found that the mean of the discrimination index for the
misconceptions was 0.01. This low value indicates that the students with higher
scores have as many misconceptions as the students with lower scorers. And, that
shows the homogeneity of the sample in terms of possessing the misconceptions
which may be attributed to cause of low reliability.
One findings of the study showed that multiple-choice tests and two-tier
tests overestimate the proportion of the misconceptions as Griffard and Wandersee
(2001) found. In the TTGOMT, the proportion of the misconceptions decreased
gradually when the type of the test was changed from a multiple-choice test to

82
a two-tier test in which if the first tiers were accepted as a multiple-choice test and
the first-two tiers were accepted as a two-tier test. It is understood that multiple-
choice tests can not measure the students’ minds deeply as Rollnick and Mahooana
(1999) stated. In multiple-choice tests, if the student’s answer is wrong it is
accepted as a misconception. Even though two-tier tests measure the proportion of
the misconceptions better than multiple-choice tests, they also overestimate the
proportion of the misconceptions. Because, some wrong answers may arise from
lack of knowledge. Even if a student holds a misconception for the first two tiers, it
can not be accepted as a misconception unless the student expresses his confidence
Eryılmaz and Sürmeli (2002). In the TTGOMT, the proportion of the
misconceptions decreased 6 % when the tier of the test changed from one tier to
two tiers and 3 % when the tier of the test changed from two tiers to three tiers. If
the first tiers of the test are accepted as a multiple choice test and the first two tiers
are accepted as a two tier test, third tier tests have advantage over multiple-choice
tests and two-tier tests in terms of estimating the proportions of the
misconceptions. Eryılmaz and Sürmeli (2002) investigated the students’
misconceptions about heat and temperature with a three tier test. They found that
the students in their study had misconceptions with a mean of 46 % for the first
tiers. This value was similarly decreased to 27 % for the first two tiers and 18 % for
all of the three tiers as in the TTGOMT. They stated that there were some students
in the percentage of the misconceptions measured by the first tiers giving wrong
answers by mistake or lack of knowledge. They found that 19 % of the students fell
in the mistakes in the first tiers. Because, their answers for the second tiers were
not consistent with the first tiers i.e. that students did not choose the reasons that
support their mistake in the first tiers. They also found that 9 % of the students
selected misconceptions for the first two tiers without expressing their confidence
in the third tier. Eryılmaz and Sürmeli said that these students’ wrong answers were
due to lack of knowledge in which they did not show their confidence in the third
tier. According to them, a misconception is not a mistake or a wrong answer due to
lack of knowledge. They expressed the misconceptions as the conceptions in the
students’ minds that are incorrect scientifically. If someone has a misconception, it
is necessary for him/her to say the reason of the mistake and say his/her
confidence. They concluded that misconceptions can be distinguished from

83
mistakes and lack of knowledge with three-tier tests. Therefore, it can be said that
three-tier tests measure the misconceptions more reliable than multiple-choice tests
and two-tier tests.
5.4 Internal Validity
Internal validity means that observed differences on the dependent variable
are directly related to the independent variable, and not due to some other
unintended variable (Fraenkel & Wallen, 1996, p. 241). In this section, possible
threats to internal validity and methods to deal with them were discussed.
The selection of the classes for the administration of the open-ended test
and the TTGOMT was convenience sampling, thus a threat for the internal validity.
And also, the students interviewed were selected by convenience sampling.
Location in which the students were interviewed and administered open-
ended test and the TTGOMT may affect the students’ responses. Therefore,
students were interviewed in the schools’ laboratories and provided comfortable
conditions.
The open-ended test and the TTGOMT were administered in the same type of the
classrooms. The classrooms had a board, a table and chair for the teachers, desks
for the students about the same wideness, the same heating and lighting conditions,
etc.
Instrument decay can be a threat to the internal validity. Because, scoring
the 141 open-ended test results was long and difficult to score, thereby resulting in
fatigue of the scorer. To avoid fatigue, scoring was done by the same scorer and
students’ responses were categorized systematically.
Data collector characteristics were also a threat to internal validity
especially for the interviews. However, since the interviews were conducted by
only the researcher, this threat was avoided.
Data collector bias could be a threat to internal validity for the interviews.
Because, the data collector could lead the student responses in the purposes of
desired outcomes from the interviews. However, a complete attention was paid to
avoid the use of leading questions.

84
Testing could be a threat to internal validity. Because, in the interviews the
students’ responses were recorded by an audio-recorder. Therefore, students might
have been alerted. However, when the students were informed why the audio-
recorder was used they got relaxed.
Mortality and maturation could not be a threat to internal validity. Because,
the data collection procedures for the interviews, open-ended tests and the
TTGOMT were at just one point in time and the time took 40-45 minutes for the
interviews and 30-35 minutes for the open-ended tests and the TTGOMT.
Also, confidentiality was not a threat to internal validity. Because, the
names of the students were not taken in any part of the study.
5.5 External Validity
External validity is the extent to which the results of the study can be
generalized. There are two types of external validity: population genaralizability
and ecological genaralizability. Population generalizibility refers to the degree to
which a sample represents the population of interest and ecological generalizability
refers to the degree to which results of the study can be extended to other settings
or conditions (Fraenkel & Wallen, 1996, p. 106).
The number of the 11th grade science students in Bayrampaşa was
approximately 900 students. The TTGOMT was administered to 141 students
which is more than 15 % of the accessible population. Therefore, the results of the
study can be generalized the accessible population, which covers all 11th grade
science students.
The administration of the TTGOMT occurred in ordinary classrooms
during regular class hours. However, some variables such as region, socio-
economic statues, ethnicity, education facilities, father’s occupation etc. can affect
the results of the study. Since these variables were not taken into account in the
study, the generalizibility of the results is doubtful.
85
5.6 Implications of the Study
According to the results of the study and findings of the previous studies,
following suggestions can be offered:
1. The results of the study and the previous studies showed that students have
misconceptions and these misconceptions resist to change and obstructing
the learning process. The teachers should take students’ misconceptions
into account. The more teachers know about theirs students’
misconceptions, the more they will be able to provide them to learn.
2. In the study, it was found that the students who had higher scores on the
test have as many misconceptions as the students who had lower scores.
Therefore, the teachers should consider that even if the students have high
scores on the exams, they may have as many misconceptions as the
students who have low marks.
3. In the interviews, it was seen that even if the students were above average,
the students had little or no understanding of a conceptual understanding of
a physical phenomenon. For example, when the students were asked to
explain seeing process of an image of any object in a plane mirror, most of
the students could not explain the process. In fact, they complained that
their teachers do not ask such questions asking conceptual understanding
of the subject. They stated that this question is very simple and they had
solved more difficult and complex questions for the plane mirrors. They
concluded that they learn the types of questions and they resort to rote
memorization of formulae and procedures but they do not understand the
concepts scientifically. Therefore, teachers should emphasize on the
conceptual understanding of the students.
4. Teachers can use the TTGOMT for formative evaluation to assess the
misconceptions of the 11th grade students about geometric optic. Therefore,
it can be needed for them to use different methods or instruments in the
lecture to make the concepts more clear and understandable.

86
5. The findings of the study show that multiple-choice tests and also two-tier
tests overestimate the misconception of the students. Because, they do not
take into account the mistakes of the students and lack of knowledge of the
students. Moreover, both types of tests also overestimate the correct
answers of the students. Therefore, to avoid from mistakes and lack of
knowledge causing the wrong answers of the students teachers should use
three-tier tests to investigate the misconceptions of the students. They
should consider that the results of the multiple-choice tests or even if two-
tier tests can be misleading while investigating the misconceptions of the
students.
6. Identifying the students’ misconceptions in geometric optic by the
TTGOMT can give some feedback to the textbook editors. They can use
more examples and simple questions dealing with the misconceptions
instead of complex situations and questions.
5.7 Recommendations for Further Research
The recommendations for further studies can be as the followings:
1. This study was done for assessing the misconceptions of the students about
geometric. The other physics topics can be studied and students’
misconceptions can be investigated by a three-tier test that will have been
developed in the study. It is also important to say that in the literature some
concepts studied too much, whereas some concepts studied a few.
Therefore, it is worth working with the concepts which were studied a few.
2. The TTGOMT was administered to 141 11th grade students. However, the
independent variables such as school type, gender, socio-economic statue
etc. did not take into account. Therefore, a study that investigates the
effects of these independent variables to the students’ misconceptions
about geometric optic can be studied.
3. In the study it was found that reliability of the misconceptions was lower
than reliability of the correct answers. Consistency of conceptions and
misconceptions can be investigated.
4. The TTGOMT was administered to 141 students. For ecological validity
concerns, it can be administered to larger samples.

87
REFERENCES
Al-Rubayea, A. A. M. (1996). An analysis of Saudi Arabian high school
students’ misconceptions about physics concepts. Kansas State University.
Dissertation Abstracts International (University Microfilms No. 9629018).
Beichner, R. J. (1994). Testing student interpretation of kinematics graphs.
American Journal of Physics, 62 (8), 750-762.
Bendall, S., Goldberg, F., & Galili, I. (1993). Prospective Elementary
Teachers' Prior Knowledge about Light. Journal of Research in Science Teaching,
30 (9), 1169-87.
Çataloğlu, E. (2002). Development and Validation of an Achievement Test
in Introductory Quantum Mechanics: The Quantum Mechanics Visualization
Instrument. The Pennsylvania State University.
Chapter 2 Review of the Literature.(n.d.), http://webphysics.davidson.edu/
faculty/mhd/dissertation/dissertation1/chaptwo.pdf, Last accessed date March 2004
Chapter 4. Multiple-Choice Concept Tests: The Force Concept Inventory.
(n.d.), http://www.physics.umd.edu/perg/dissertations/saul/Chapter4.PDF, Last
accessed date February 2004
Chen, C. C., Lin, S. H., & Lin, M. L. (2002). Developing a Two-Tier
Diagnostic Instrument to Assess High School Students’ Understanding - The
Formation of Images by a Plane Mirror. Proc. Natl. Sci. Counc. ROC(D), 12 (3),
106-121.
Dupin, J. –J. & Johsua, S. (1987). Conceptions of French pupils
concerning electric circuits: Structure and evolution. Journal of Research in
Science Teaching, 24(9), 791-806.
Eryılmaz, A. & Sürmeli, E. (2002). Üç-aşamalı Sorularla Öğrencilerin Isı
ve Sıcaklık Konularındaki Kavram Yanılgılarının Ölçülmesi,
http://www.fedu.metu.edu.tr/ufbmek-5/, Last accessed date March 2004
Feher, E. & Rice, K. (1988). Shadows and Anti-Images : Children’s
Conceptions of Light and Vision. 2. Science Education, 72 (5), 637-649.
Fetherstonhaugh, T., & Treagust, D. F. (1992). Students’ understanding of
light and its properties: Teaching to engender conceptual change. Science
Education, 76, 653-672.
Fraenkel, J. R., & Wallen, N. E. (1996). How to design and evaluate
research in education. (3rd ed.). New York: McGraw-Hill.

88
Gee, J. K. (1988). The myth of lateral inversion. Physics Education, 28,
300-301
Goldberg, F., & McDermott, L. C. (1986). Student difficulties in
understanding image formation by a plane mirror. The Physics Teacher, 24, 472-
480.
Gredler, M. E. (n.d.). Learning and Instruction Theory Into Practice.
Newyork: Macmillan Publishing Company.
Griffard, P. B., & Wandersee, J. H. (2001). The Two-Tier Instrument on
Photosynthesis: What Does It Diagnose? International Journal of Science
Education, 23 (10), 1039-52.
Gronlund, N. E. & Linn, R. L. (1990). Measurement and evaluation
in teaching. New York: Mac Millian Publishing.
Hestenes, D. & Halloun, I. (1995). Interpreteting the Force Concept
Inventory. A response to Huffman and Heller. The Physics Teacher, 33, 502-506.
Hestenes, D., Wells, M. & Swackhamer, G. (1992). Force Concept
Inventory. The Physics Teacher, 30, 141-158.
Klammer, J. (1998). An Overview of Techniques for Identifying,
Acknowledging and Overcoming Alternative Conceptions in Physics Education,
http://www.klingenstein.org/html/research/projects/1998/klammer.htm, Last
accessed date January 2004
Langley, D., Ronen, M., & Eylon, B. (1997). Light Propagation and Visual
Patterns: Preinstruction Learners' Conceptions. Journal of Research in Science
Teaching, 34 (4), 399-424.
Marx, J. D. (1988). Creation of a diagnostic exam for introductory,
undergraduate electricity and magnetism. Rensselaer Polytechnic Institute, Troy,
New York. Dissertation Abstracts International (University Microfilms
No.9908686).
Mcleod, G., (n.d.). Learning theory and Instructional Design,
http://courses.durhamtech.edu/tlc/www/html/Resources/learningmatters/learningth
eory.pdf, Last accessed date January 2004
Mergel, B. (1998). Instructional Design & Learning Theory,
http://www.usask.ca/education/coursework/802papers/mergel/brenda.htm, Last
accessed date February 2004
Odom, A. L., & Barrow, L. H. (1995). Development and Application of a
Two-Tier Diagnostic Test Measuring College Biology Students' Understanding

89
of Diffusion and Osmosis after a Course of Instruction. Journal of Research in
Science Teaching, 32 (1), 45-61.
Osborne, R. J. & Gilbert, J. K. (1980). A technique for exploring students’
views of the world. Physics Education, 15, 376-379
Reiner, M., Slotta, J. D., Chi, M. T. H., & Resnick, L. B. (2000). Naïve
Physics Reasoning: A commitment to Substance Based Conceptions. Cognition
and Instruction, 18 (1), 1-34.
Rollnick, M. & Mahooana, P. P. (1999). A quick and effective way of
diagnosing student difficulties: two tier from simple multiple choice questions. S.
African Journal of Chemistry., 52 (4), 161-164
Savinainen, A. & Scot, P. (2002). The Force Concept Inventory: a tool for
monitoring student learning. Physics Education, 37 (1), 45-52.
Schwab, A. J. (2002). Course Materials- Current semester, http://www.
utexas.edu/courses/schwab, Last accessed date February 2004
Steinberg, R. N. & Sabella, M. S. (1997). Performance on Multiple-Choice
Diagnostics and Complementary Exam Problems. Physics Teacher, 35, 150-155.
The Free Dictionary (2005), http://www.thefreedictionary.com/conception,
Last accessed date September 2005
Tsai, C. C., & Chou, C. (2002). Diagnosing students’ alternative
conceptions in science. Journal of Computer Assisted Learning, 18, 157-165.
Watts, D. M. (1985). Student Conceptions of Light: A Case Study. Physics
Education, 20 (4), 183-87.
Zeilik, M. (n.d.). Conceptual Diagnostic Tests, http://www.flaguide.org/
extra/download/cat/diagnostic/diagnostic. PDF, Last accessed date March 2004

90
APPENDIX A
INTERVIEW GUIDE
1. Dışarıdan ışığın hiçbir durumda giremeyeceği yalıtılmış bir odada, vazo içinde
çiçekler bulunmaktadır. Tamamen karanlık olan bu odada mum yakan birisi, vazonun beyaz; vazo içinde bir kırmızı, bir sarı, bir mor, bir pembe çiçeği ve bu çiçeklerin yeşil yapraklarının olduğunu görmektedir. Eğer mum söndürülürse, bu kişi neler görebilecektir? Açıklayınız.
2. Işığın aldığı mesafe gündüz ve geceleyin farklılık gösterir mi? Açıklayınız. 3. Şekil 1’de görüldüğü gibi, küçük delikli kart ampulün ortasına delik olan kısmı
gelecek şekilde yerleştirilirse perdede ne görürsün? Açıklayınız.
Şekil 1 4. Bir önceki soru için, perde ampulden uzaklaştırılırsa, perdede herhangi bir şey
değişir miydi? Açıklayınız. 5. Şekil 2’de görüldüğü gibi ampul ile perdenin arasına bir kürdan konmuş ve
kürdan ekrana yaklaştırılıp uzaklaştırılmaktadır. Kürdan ekrana yaklaştırıldığında gölge daha net olurken ekrandan uzaklaştırıldığında dağılmaktadır. Bu durumu açıklayabilir misiniz?

91
6. Eğer küçük yuvarlak boncuğu artı şeklindeki ışık kaynağının önüne koyarsak, ışık yandığında perdede ne görürsün? Açıklayınız. (Boncuğun asılı olduğu ipi önemsemeyiniz. Şekil 3’e bakınız.)
Şekil 3 7. Bir önceki soru için, yapılan deneyde gölgenin artı bir işaret olduğu
gözlenmiştir. Gölgenin niçin artı bir işaret olduğunu açıklayabilir misiniz? 8. Şekillerde görüldüğü gibi tek düzeneğin üzerine iki ışık kaynağı yan yana
konmuştur, önlerine bir kart ve kartın arkasına bir ekran yerleştirilmiştir. Işık kaynaklarından ilk önce sağdaki açılmış ve perdede şekil 4’de olduğu gibi gölge oluşmuştur. Daha sonra soldaki ışık kaynağı açılmış ve şekil 5’de olduğu gibi gölge şekil 4’da oluşan gölgeye göre biraz daha sağa kaymıştır. Farzedin ki her iki kaynak aynı anda açılırsa ekranda ne görürdünüz? Açıklayınız.
Şekil 4 Şekil 5

92
9. Bir önceki soru için, yapılan deneyde ekranda aşağıdaki şekle benzer bir şekilde gölge oluştuğu gözlenmiştir. Gölgedeki açık ve koyu bölgeleri açıklayınız. Bu durumu şekil çizerek gösteriniz.
Şekil 6 10. Bir araştırmacı ve bir çocuk bir düz aynanın önüne şekil 7’de olduğu gibi
oturmaktadırlar. Araştırmacı aynayı bir örtü ile kapamış ve aynanın ön cephe sınırlarının dışında, biraz daha sağ tarafına tahta bir çubuk koymuştur. Aynanın üzerindeki örtü olmasa, öğrenci cismin görüntüsünü aynada görür mü? Araştırmacı cismin görüntüsünü görür mü? Açıklayınız.
Şekil 7 11. Bir düz ayna ve kalem, masanın üzerine şekil 8’de olduğu gibi yerleştiriliyor.
Bir gözlemci kalemin görüntüsünü görebilmek için aynaya bakmaktadır. Ortamdaki tek ışık kaynağı bir ampuldür. Eğer ampul biraz daha yukarı kaldırılacak olursa, kalemin aynadaki gözlemci tarafından görülen görüntüsünün yerinde ne değişiklik olur? Açıklayınız.
Şekil 8
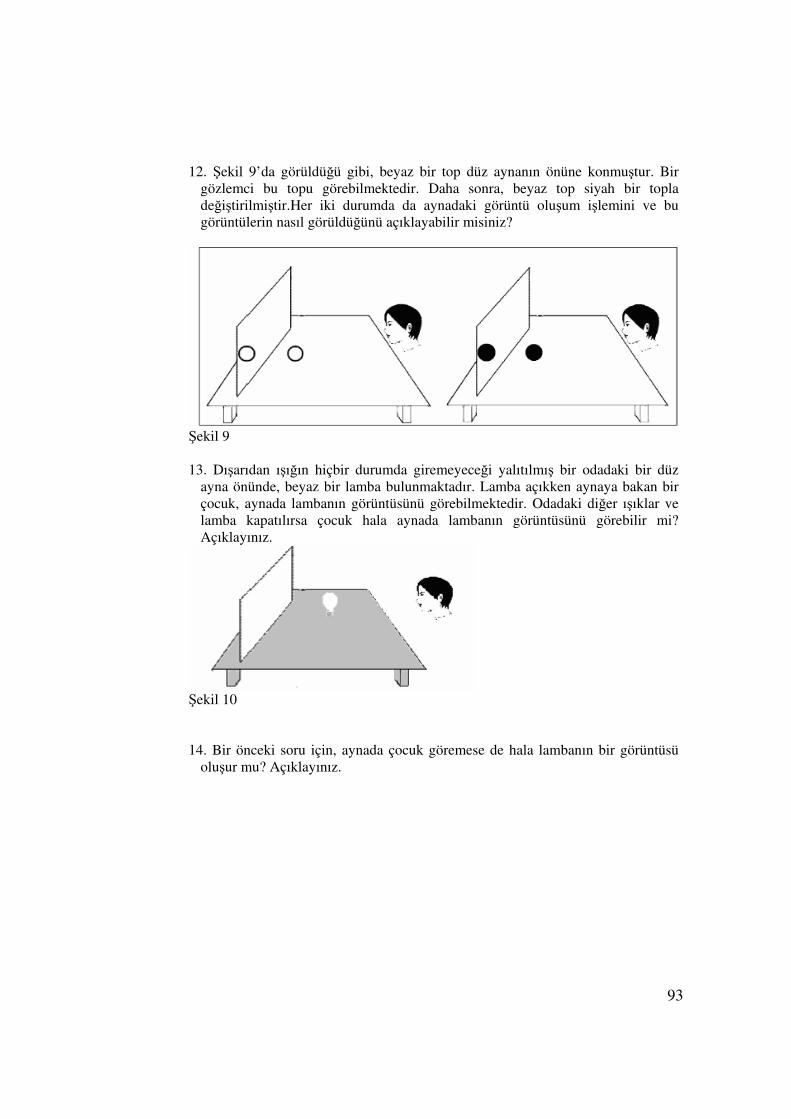
93
12. Şekil 9’da görüldüğü gibi, beyaz bir top düz aynanın önüne konmuştur. Bir
gözlemci bu topu görebilmektedir. Daha sonra, beyaz top siyah bir topla değiştirilmiştir.Her iki durumda da aynadaki görüntü oluşum işlemini ve bu görüntülerin nasıl görüldüğünü açıklayabilir misiniz?
Şekil 9 13. Dışarıdan ışığın hiçbir durumda giremeyeceği yalıtılmış bir odadaki bir düz
ayna önünde, beyaz bir lamba bulunmaktadır. Lamba açıkken aynaya bakan bir çocuk, aynada lambanın görüntüsünü görebilmektedir. Odadaki diğer ışıklar ve lamba kapatılırsa çocuk hala aynada lambanın görüntüsünü görebilir mi? Açıklayınız.
Şekil 10 14. Bir önceki soru için, aynada çocuk göremese de hala lambanın bir görüntüsü
oluşur mu? Açıklayınız.

94
15. Bir çocuk bir düz aynanın karşısına oturup aynanın karşısında durmakta olan
kalemin görüntüsüne bakmaktadır. Eğer çocuk, solundaki boş sandalyeye geçerse görüntünün yeri değişir mi? Açıklayınız.
Şekil 11 16. Odanın bir tarafında ayakta duran kız aynaya bakmaktadır. Kız aynada çiçeğin
görüntüsünü görebildiğini söylemektedir. a) Kızın çiçeği aynada nasıl görebildiğini açıklayınız. b) Şekli kızın aynada çiçeği nasıl gördüğünü açıklayan çizimle tamamlayınız.
Şekil 12

95
APPENDIX B
OPEN-ENDED TEST
1. Dışarıdan ışığın hiçbir durumda giremeyeceği yalıtılmış bir odada, vazo
içinde çiçekler bulunmaktadır. Tamamen karanlık olan bu odada mum
yakan birisi, vazonun beyaz; vazo içinde bir kırmızı, bir sarı, bir mor, bir
pembe çiçeği ve bu çiçeklerin yeşil yapraklarının olduğunu görmektedir.
Eğer mum söndürülürse, bu kişi neler görebilecektir? Açıklayınız.
2. Işığın aldığı mesafe gündüz ve geceleyin farklılık gösterir mi? Nedenini
kısaca açıklayınız.
3. Şekilde 1’de farklı büyüklükte özdeş dört ampul verilmiştir. Bu ampullerin
her biri şekilde belirtilen yere ayrı ayrı konulup kalemin ve perdenin
yerleri sabit tutulursa, her bir ampul için perdede gölge oluşmaktadır.
Gölgeleri netlik açısından karşılaştırınız. Nedenlerini açıklayınız.
Şekil 1 4. Eğer bu küçük yuvarlak boncuğu artı şeklindeki ışık kaynağının önüne
koyarsak, ışık yandığında perdede ne görürsün? (Boncuğun asılı olduğu ipi
önemsemeyiniz.) Nedenini açıklayınız.
Şekil 2

96
4. Şekillerde görüldüğü gibi tek düzeneğin üzerine iki ışık kaynağı yan yana
konmuştur, önlerine bir kart ve kartın arkasına bir ekran yerleştirilmiştir.
Işık kaynaklarından önce sağdaki açılmış ve perdede şekil 3’ de olduğu
gibi gölge oluşmuştur. Daha sonra soldaki ışık kaynağı açılmış ve şekil
4’de olduğu gibi gölge şekil 3’de oluşan gölgeye göre biraz daha sağa
kaymıştır. Farzedin ki her iki kaynak aynı anda açılırsa ekranda ne
görürdünüz? Nedenini açıklayınız.
Şekil 3 Şekil 4
6. Aşağıdaki şekilde bir öğretmen ve öğrenci üzerinde ayna ve kalem
konulmuş masanın etrafına oturuyorlar. Kalem aynanın ön cephe sınırlarının
dışına konuluyor ve öğrenci kalemin biraz daha sağında oturuyor (şekle
bakınız). Sizce, öğrenci cismin görüntüsünü aynada görür mü? Öğretmen,
cismin görüntüsünü aynada görür mü? Şekil çizerek nedenlerini açıklayınız.
Şekil 5

97
7. Bir düz ayna ve kalem, masanın üzerine şekil 6’da olduğu gibi
yerleştiriliyor. Bir gözlemci kalemin görüntüsünü görebilmek için aynaya
bakmaktadır. Ortamdaki tek ışık kaynağı bir ampuldür. Eğer ampul biraz daha
yukarı kaldırılacak olursa, kalemin aynadaki gözlemci tarafından görülen
görüntüsünün yerinde ne değişiklik olur? Sebebini açıklayınız.
Şekil 6
8. Ayna karşısında durmakta olan Ali, aynada vücudunun üst yarısını
görebilmektedir. Ali’nin vücudunun tamamını görebilmesi için yapabileceği
bir şey var mı? Varsa nedenini kısaca açıklayınız.
9. Şekil 7’de beyaz bir top, görüldüğü gibi düz aynanın önüne konmuştur. Bir
gözlemci bu topu aynada görebilmektedir. Daha sonra, beyaz top siyah bir
topla değiştirilmiştir.Her iki durumda da aynadaki görüntü oluşumunu ve bu
görüntülerin nasıl görüldüğünü açıklayabilir misiniz?
Şekil 7

98
10. Dışarıdan ışığın hiçbir durumda giremeyeceği yalıtılmış bir odadaki bir düz
ayna önünde, beyaz bir lamba bulunmaktadır. Lamba açıkken aynaya bakan bir
çocuk, aynada lambanın görüntüsünü görebilmektedir. Odadaki diğer ışıklar ve
lamba kapatılırsa aynada ampulün görüntüsü oluşur mu? Nedenini açıklayınız.
Şekil 8
11. Bir öğretmen ile bir öğrenci bir düz aynanın karşısına oturmuşlardır. Öğretmen,
aynanın karşısına öğrencinin görebileceği bir tahta çubuk koymuştur. Eğer öğrenci
iki adım solunda olan öğretmeninin yerine geçerse öğrencinin görmüş olduğu
cismin görüntüsünün yeri değişir miydi? Nedenini kısaca açıklayınız.
Şekil 9
12. Geceleyin uyumakta olan Mustafa, çenesini ısıran bir sivrisinek tarafından
uyandırılmıştır. Karanlık odasında, çenesindeki ısırığı görmek isteyen Mustafa
eline ayna ve elfeneri almıştır. Çenesini aynada görmek isteyen Mustafa, el
fenerinin ışığını nereye tutmalıdır? Nedenini açıklayınız.

99
13. Aşağıdaki şekilde odanın bir tarafında ayakta duran kız, aynaya bakmaktadır.
Kız, aynada çiçeğin görüntüsünü görebilir mi? Şekil üzerinde çizimle gösteriniz
ve nedenini açıklayınız.
Şekil 10

100
APPENDIX C
THREE-TIER GEOMETRIC OPTIC MISCONCEPTION TEST
GEOMETRİK OPTİK
Yönergeler
1. Sınava başlamadan önce yukarıda verilen kısma okulunuzun türünü ve cinsiyetinizi işaretleyiniz.
2. Testte 16 soru vardır. Her bir sorunun üç alt aşamalı sorusu vardır. Birinci aşamada fiziksel bir olay ya da fiziksel bir olayın sonucu sorulmuştur. İkinci aşamada, birinci aşamada verilen cevabın nedeni sorulmuştur. Üçüncü aşamada ise bir ve ikinci aşamalarda verilen cevaplardan emin olunup olunmadığı sorulmuştur.
3. Bu testtin sonuçları Ortadoğu Teknik Üniversitesi’nde Orta Öğretim Fen ve Matematik Eğitimleri Bilimi Alanı’nda yüksek lisans yapan araştırmacının tezinde veri olarak kullanılacaktır.
4. Bütün sorulara cevap vermek için gayret gösteriniz. Cevap vermek istediğiniz şıkkı yuvarlak daire içine alınız.
5. Bu bir bilimsel çalışmadır. Sizde şu an bilimsel bir çalışmanın parçasısınız. Gerekli ilgiyi gösterdiğiniz için teşekkür ederim.
OKULUNUZ : □Anadolu □ Düz □Süper Lisesi Lise Lise
CİNSİYETİNİZ : □ Erkek □ Kız

101
IŞIK
1.1. Dışarıdan ışığın hiçbir durumda giremeyeceği yalıtılmış bir odada, vazo içinde çiçekler bulunmaktadır. Tamamen karanlık olan bu odada mum yakan birisi, vazonun beyaz; vazo içinde bir kırmızı, bir sarı, bir mor, bir pembe çiçeği ve bu çiçeklerin yeşil yapraklarının olduğunu görmektedir. Eğer mum söndürülürse, bu kişi neler görebilecektir? a) Beyaz vazoyu ve açık renkli çiçekleri görebilir. b) Vazoyu da çiçekleri de göremez. c) Net olmasa da cisimleri yine görebilecektir. d) Cisimlerin rengini net göremese de karartılar halinde şekillerini görebilir.
1.2. Yukarıdaki seçeneği seçmemin sebebi; a) Mum söndüğü zaman ortamda siyah ışın olduğu için cisimler siyah
yansıyacaktır. b) Mum söndükten bir süre sonra göz, karanlıkta görmeye alışacaktır. c) Mum söndüğünde ortamda cisimlerin renklerini yansıtacak ışık olmayacağı
için cisimleri karartılar halinde görecektir. d) Mum söndüğünde ortamda cisimlere çarpıp yansıyacak ışık olmayacaktır. e) Mum söndüğünde açık renkli cisimlerin yaydığı ışık olacağı için, açık
renkli cisimler kendilerini karanlıkta belli ederler. 1.3. Yukarıdaki iki soruya verdiğiniz cevaptan emin misiniz? a) Eminim. b) Emin değilim. 2.1. Işığın aldığı mesafe gündüz ve geceleyin farklılık gösterir mi?
a) Gösterir, ışık gece daha çok yol alır. b) Gösterir, ışık gündüz daha çok yol alır. c) Göstermez, ışık gece ve gündüz eşit yol alır.
2.2. Yukarıda seçeneği seçmemin sebebi; a) Geceleyin ortam karanlık olduğundan yansıma en azdır. b) Gündüz görünen uzaktaki cisimler, gece görünmeyebilir. c) Gündüz ortamdaki güneş ışığı ışığın ilerlemesini kolaylaştırır. d) Işık hızı ortamın yoğunluğuna bağlıdır. e) Işık, gücünü gece hem ilerlemek hem de etrafını aydınlatmak için kullanır. f) Gündüz, ışık her tarafa yayılırken gece sabit bir noktaya odaklanır. g) Gündüz ortamdaki güneş ışığı, ışığın ilerlemesini engeller.
2.3. Yukarıdaki iki soruya verdiğiniz cevaptan emin misiniz? a) Eminim. b) Emin değilim.
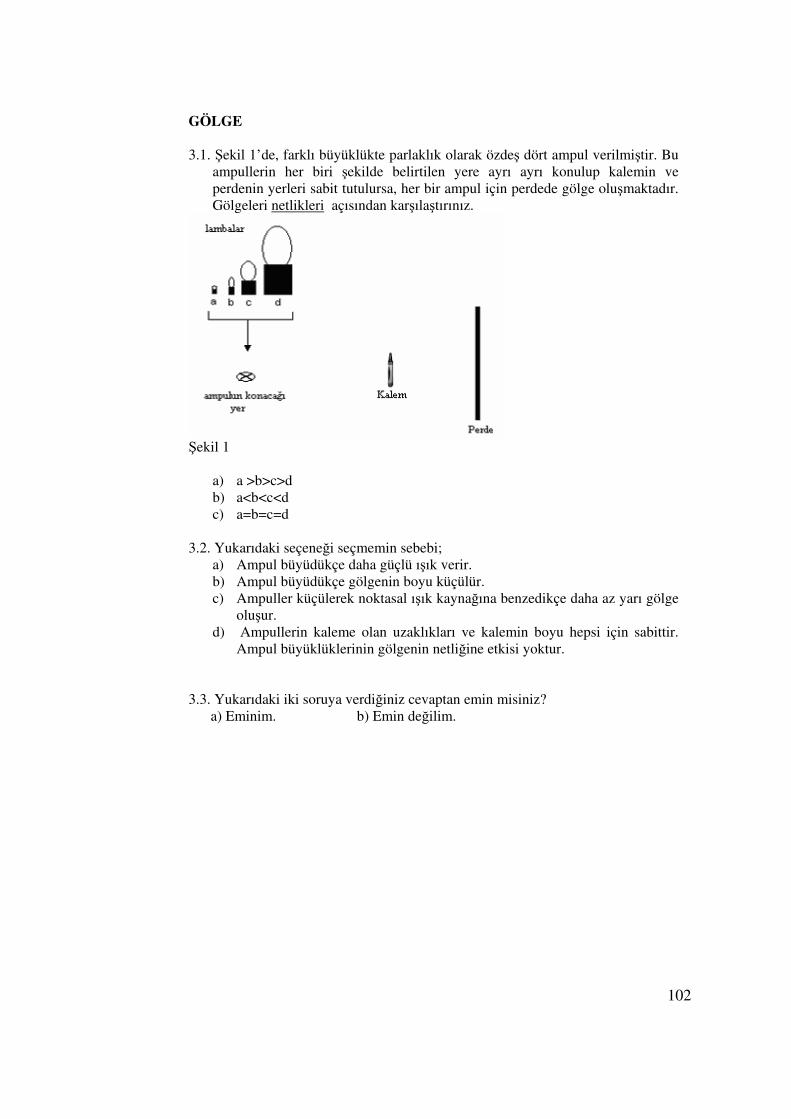
102
GÖLGE 3.1. Şekil 1’de, farklı büyüklükte parlaklık olarak özdeş dört ampul verilmiştir. Bu
ampullerin her biri şekilde belirtilen yere ayrı ayrı konulup kalemin ve perdenin yerleri sabit tutulursa, her bir ampul için perdede gölge oluşmaktadır. Gölgeleri netlikleri açısından karşılaştırınız.
Şekil 1
a) a >b>c>d b) a<b<c<d c) a=b=c=d
3.2. Yukarıdaki seçeneği seçmemin sebebi;
a) Ampul büyüdükçe daha güçlü ışık verir. b) Ampul büyüdükçe gölgenin boyu küçülür. c) Ampuller küçülerek noktasal ışık kaynağına benzedikçe daha az yarı gölge
oluşur. d) Ampullerin kaleme olan uzaklıkları ve kalemin boyu hepsi için sabittir.
Ampul büyüklüklerinin gölgenin netliğine etkisi yoktur. 3.3. Yukarıdaki iki soruya verdiğiniz cevaptan emin misiniz? a) Eminim. b) Emin değilim.

103
4.1. Aşağıdaki şekilde bir perde ile yanmakta olan ampul arasına bir kart
konulmuştur. Ampul hangi yönde hareket ettirilirse perdedeki gölgenin netliği daha belirgin olur? a) 1 yönüne b) 2 yönüne c) Hiçbiri
Şekil 2
4.2. Yukarıdaki seçeneği seçmemin sebebi;
a) Ampulün yerinin önemi yoktur, kart ile perde arasındaki uzaklık önemlidir. b) Ampul yaklaştıkça karta daha güçlü ışık gelir. c) Ampul karttan uzaklaşırken noktasal ışık kaynağına benzediği için daha az
yarı gölge oluşur. 4.3. Yukarıdaki iki soruya verdiğiniz cevaptan emin misiniz? a) Eminim. b) Emin değilim.

104
5.1. Eğer bu küçük yuvarlak boncuğu artı şeklindeki ışık kaynağının önüne koyarsak, ışık yandığında perdede ne görürsün? (Boncuğun asılı olduğu ipi önemsemeyiniz.)
Şekil3
5.2. Yukarıdaki seçeneği seçmemin sebebi;
a) Işık kaynağı boncuğa göre çok büyük olduğu için perdenin her yerine ışık gönderebilir.
b) Işık kaynağından çıkan ışınlar perdeye doğrusal gittiği için perdede artı şekinde bir aydınlanma olur. Boncuğun üzerine gelen ışınları engellemesiyle artı şeklindeki aydınlanmanın ortasında noktasal bir gölge oluşur.
c) Işık kaynağının şeklinin gölge oluşumunda etkisi yoktur. Önemli olan ışığı engelleyen cismin şeklidir.
d) Işık kaynağının bir noktasından her yöne dağılan ışınlardan bir tanesi boncuk tarafından engellenir. Artı ışık kaynağının her bir noktasının perdede gölgesi olur. Bu gölgelerin perde üzerinde yan yana bulunmasıyla artı şekli olur.
5.3. Yukarıdaki iki soruya verdiğiniz cevaptan emin misiniz? a) Eminim. b) Emin değilim.

105
6.1. Şekillerde görüldüğü gibi tek düzeneğin üzerine iki ışık kaynağı yan yana konmuştur, önlerine bir kart ve kartın arkasına bir ekran yerleştirilmiştir. Işık kaynaklarından ilk önce sağdaki açılmış ve perdede şekil 4’de olduğu gibi gölge oluşmuştur. Daha sonra soldaki ışık kaynağı açılmış ve şekil 5’de olduğu gibi gölge şekil 4’de oluşan gölgeye göre biraz daha sağa kaymıştır. Farzedin ki her iki kaynak aynı anda açılırsa ekranda ne görürdünüz?
Şekil 4 Şekil 5
6.2. Yukarıdaki seçeneği seçmemin sebebi;
a) Her iki ışık kaynağından çıkan ışınların kart tarafından engellenmesiyle perdede iki gölge oluşur. Bu iki gölge perdede birleştiği için koyu büyük bir gölge oluşur.
b) Her iki kaynağın ışığının gidemediği yerde küçük koyu bir gölge oluşurken diğer yerler her bir ışık kaynağı tarafından aydınlatıldığı için aydınlık olur.
c) Her iki ışık kaynağının kart tarafından engellediği bölgede küçük koyu bir gölge olur. Yan taraflarında birinin aydınlatıp diğerinin aydınlatamadığı yeler, her ikisinin aydınlattığı yerlere göre daha az aydınlık olur.
d) Her iki kaynaktan ışık almayan orta kısımda koyu bir gölge oluşur. Koyu gölgenin yan taraflarında bir kaynağın engellenmesiyle oluşan gölge ile diğerinin oluşturduğu aydınlığın birleşmesi ile daha açık bir gölge oluşur.
e) Her bir kaynağın ışık gönderemediği yerlere diğer kaynak ışık gönderdiği için perde aydınlık olur.
6.3. Yukarıdaki iki soruya verdiğiniz cevaptan emin misiniz? a) Eminim. b) Emin değilim.

106
Düz Ayna 7.1. Aşağıdaki şekilde bir öğretmen ve öğrenci üzerinde ayna ve kalem konulmuş
masanın etrafına oturuyorlar. Kalem aynanın ön cephe sınırlarının dışına konuluyor ve öğrenci kalemin biraz daha sağında oturuyor. Sizce, öğrenci cismin görüntüsünü aynada görür mü? Öğretmen, cismin görüntüsünü aynada görür mü?
Şekil 6
a) Sadece öğrenci görür. b) Sadece öğretmen görür. c) Her ikisi de göremez. d) Her ikisi de görür.
7.2. Yukarıdaki seçeneği seçmemin sebebi; a) Öğretmenin kaleme baktığı doğrultu aynanın dışında kalırken, öğrencinin
kaleme baktığı doğrultu ayna ile kesişmektedir. b) Kalemden aynaya yansıyan ışınlar aynadan öğretmene yansımaktadır.
Fakat, kalemden aynaya yansıyan ışınların aynadan öğrenciye yansıma ihtimali yoktur.
c) Her iki gözlemci, kalem aynanın yansıtıcı ön cephe sınırları içersine girmediği için göremez.
d) Kalem her iki gözlemcinin görüş alanları içersindedir. e) Öğretmenin gözünden çıkan ışınlar aynaya gelip aynadan cismin üzerine
yansır. Öğrencinin gözünden çıkan ışınların aynadan yansıyıp kalemin üzerine gelme ihtimali yoktur.
f) Kalemin aynada bir görüntüsü oluşur. İki gözlemci de bakış açıları uygun olduğu için görebilirler.
7.3. Yukarıdaki iki soruya verdiğiniz cevaptan emin misiniz? a) Eminim. b) Emin değilim.

107
8.1. Bir düz ayna ve kalem, masanın üzerine şekilde olduğu gibi yerleştiriliyor. Bir gözlemci kalemin görüntüsünü görebilmek için aynaya bakmaktadır. Ortamdaki tek ışık kaynağı bir ampuldür. Eğer ampul biraz daha yukarı kaldırılacak olursa, kalemin aynadaki gözlemci tarafından görülen görüntüsünün yerinde ne değişiklik olur?
a) Yukarı çıkar. b) Aşağı kayar. c) Görüntünün yeri değişmez.
Şekil 7 8.2. Yukarıdaki seçeneği seçmemin sebebi; 8.3. Yukarıdaki iki soruya verdiğiniz cevaptan emin misiniz? a) Eminim. b) Emin değilim.

108
9.1. (Bir önceki soru için) Eğer ampul yukarı kaldırılırsa görüntünün boyunda ne değişiklik olur?
a) Görüntünün boyu büyür. b) Görüntünün boyu küçülür. c) Görüntünün boyu değişmez.
9.2. Yukarıdaki seçeneği seçmemin sebebi;
9.3. Yukarıdaki iki soruya verdiğiniz cevaptan emin misiniz a) Eminim. b) Emin değilim.

109
10.1. Aşağıdaki şekilde bir çocuk bir düz aynanın önünde duran kalemin aynadaki görüntüsüne bakmaktadır. Eğer çocuk aynadan geri geri giderek uzaklaşırsa aynadaki cismin görüntüsünün yerinde ne değişiklik olur?
Şekil 8
a) Görüntü aynadan uzaklaşır. b) Görüntünün yeri değişmez. c) Görüntü aynaya yaklaşır.
10.2. Yukarıdaki seçeneği seçmemin sebebi;
10.3. Yukarıdaki iki soruya verdiğiniz cevaptan emin misiniz? a) Eminim. b) Emin değilim.

110
11.1. Şekil 9’da beyaz bir top, görüldüğü gibi düz aynanın önüne konmuştur. Bir gözlemci beyaz topu aynada görebilmektedir. Daha sonra beyaz top kaldırılıp yerine aynı büyüklükte siyah bir top konmuştur.
Şekil 9 Aşağıdakilerden hangisi doğrudur?
a) Gözlemci siyah topu aynada görebilir. b) Gözlemci siyah topu aynada göremez.
11.2. Yukarıdaki seçeneği seçmemin sebebi; a) Siyah top üzerine gelen ışığı aynaya yansıtıp, aynadan yansıyan ışınlar
gözlemcinin gözüne gelir. b) Gözlemcinin gözünden çıkan ışınlar aynadan yansıyarak, siyah topun
üzerine gelir. c) Siyah topun yaydığı siyah ışınlar, aynadan yansıyarak gözlemcinin gözüne
gelir. d) Topun renginin siyah olmasının önemi yoktur. Siyah top çocuğun aynaya
baktığı doğrultuda olduğundan aynadaki görüntüyü görür. e) Siyah topun etrafındaki yerlerden ışınlar aynaya yansıyıp gözlemcinin
gözüne gelirken siyah toptan ışın yansımayacağı için gözlemci orayı karartı görecektir.
f) Siyah top ne üzerine gelen ışığı yansıtır ne de kendisi ışık yayar. 11.3. Yukarıdaki iki soruya verdiğiniz cevaptan emin misiniz? a) Eminim. b) Emin değilim.

111
12.1. Dışarıdan ışığın hiçbir durumda giremeyeceği yalıtılmış bir odadaki bir düz ayna önünde, beyaz bir lamba bulunmaktadır. Lamba açıkken aynaya bakan bir çocuk, aynada lambanın görüntüsünü görebilmektedir. Odadaki diğer ışıklar ve lamba kapatılırsa aynada ampulün görüntüsü oluşur mu?
Şekil 10 a) Oluşur. b) Oluşmaz. 12.2. Yukarıdaki seçeneği seçmemin sebebi;
a) Odada ışık olmadığı için aynada görüntü oluşmaz. b) Lamba beyaz olduğu için kendinden ışın yollayarak görüntü oluşturur. c) Ampulün ve aynanın yeri değiştirilmediği sürece aynanın kendi iç yapı
özelliğinden görüntü oluşur; fakat çocuk, ışık olmadığı için görüntüyü göremez.
d) Karanlık olduktan bir süre sonra göz uyumu olur. Çocuk lambanın görüntüsünü çok net olmasa da aynada görebilir.
e) Oda karanlık olduğu için ampulden aynaya siyah ışın yansır. Aynaya yansımaların tümü siyah ışın olduğu için çocuk görüntüyü fark edemez.
12.3. Yukarıdaki iki soruya verdiğiniz cevaptan emin misiniz? a) Eminim. b) Emin değilim.
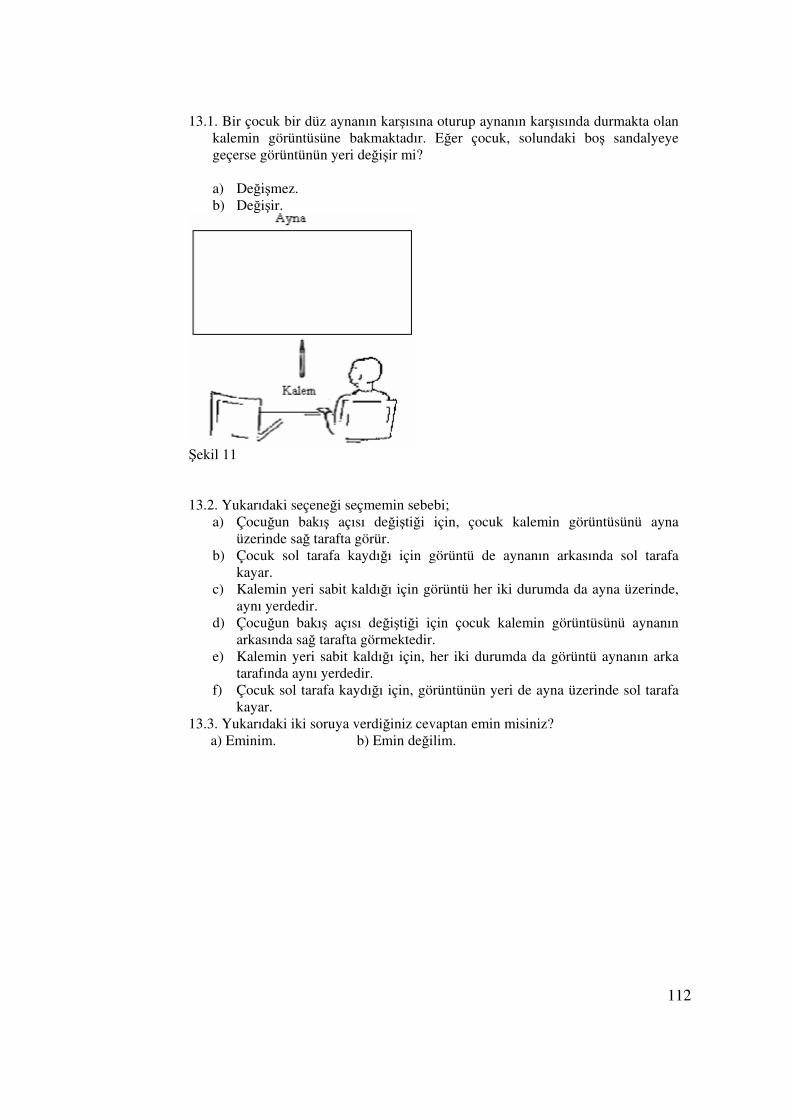
112
13.1. Bir çocuk bir düz aynanın karşısına oturup aynanın karşısında durmakta olan kalemin görüntüsüne bakmaktadır. Eğer çocuk, solundaki boş sandalyeye geçerse görüntünün yeri değişir mi?
a) Değişmez. b) Değişir.
Şekil 11 13.2. Yukarıdaki seçeneği seçmemin sebebi;
a) Çocuğun bakış açısı değiştiği için, çocuk kalemin görüntüsünü ayna üzerinde sağ tarafta görür.
b) Çocuk sol tarafa kaydığı için görüntü de aynanın arkasında sol tarafa kayar.
c) Kalemin yeri sabit kaldığı için görüntü her iki durumda da ayna üzerinde, aynı yerdedir.
d) Çocuğun bakış açısı değiştiği için çocuk kalemin görüntüsünü aynanın arkasında sağ tarafta görmektedir.
e) Kalemin yeri sabit kaldığı için, her iki durumda da görüntü aynanın arka tarafında aynı yerdedir.
f) Çocuk sol tarafa kaydığı için, görüntünün yeri de ayna üzerinde sol tarafa kayar.
13.3. Yukarıdaki iki soruya verdiğiniz cevaptan emin misiniz? a) Eminim. b) Emin değilim.

113
(E)
14.1. Geceleyin uyumakta olan Mustafa, çenesini ısıran bir sivrisinek tarafından
uyandırılmıştır. Karanlık odasında, çenesindeki ısırığı görmek isteyen Mustafa eline ayna ve el feneri almıştır. Çenesini aynada daha net görmek isteyen Mustafa, el fenerinin ışığını nereye tutmalıdır? a) El fenerini çenesine tutmalıdır. b) El fenerini aynaya tutmalıdır. c) El fenerini ışığının hem aynaya hem de çenesine gelecek şekilde
tutmalıdır. d) El fenerini nereden tuttuğu önemli değildir.
14.2. Yukarıdaki seçeneği seçmemin sebebi; 14.3. Yukarıdaki iki soruya verdiğiniz cevaptan emin misiniz? a) Eminim. b) Emin değilim.

114
15.1. Aşağıdaki şekilde, ayakta durmakta olan kız aynaya bakmaktadır. Kız aynanın diğer tarafında aynanın ön cephe sınırlarının dışında olan çiçeği görebilir mi?
Şekil 12
a) Görebilir. b) Göremez.
15.2. Yukarıdaki seçeneği seçmemin sebebi;
15.3. Yukarıdaki iki soruya verdiğiniz cevaptan emin misiniz? a) Eminim. b) Emin değilim.
a) Kızın gözünden çıkan ışınlar aynadan yansıyarak çiçeğe gelir.
b) Çiçek aynanın yansıtıcı ön cephe sınırlarının dışarısında kalmaktadır.
c) Çiçek kızın aynaya baktığı doğrultuda değildir.
d) Çiçekten yansıyan ışınlar aynada görüntü oluşturur. Kızın gözünden çıkan ışınlar aynaya giderek görüntüyü algılar.
e) Çiçekten yansıyan ışınlar aynadan yansıyarak kızın gözüne gelir.

115
16.1. Aşağıdaki şekilde görüldüğü gibi bir düz ayna ve kalem masanın üzerine yerleştirilmiştir. Ali ve Ayşe yan yana oturup aynaya bakmaktadırlar.
Şekil 12 Aşağıdakilerden hangisi doğrudur?
a) Kalemin aynadaki görüntüsünü aynı yerde görürler. b) Kalemin aynadaki görüntüsünü farklı yerde görürler.
16.2. Yukarıdaki seçeneği seçmemin sebebi, a) Ali ve Ayşe farklı yerde oturmaktadırlar. Ali kalemin görüntüsünü aynanın
üzerinde sol tarafta görür. Ayşe yine ayna üzerinde fakat sağ tarafta görür. b) Ali ve Ayşe’nin oturdukları yerlerin önemi yoktur. İkisi de aynanın
üzerinde, aynı yerde görüntüyü görürler. c) Ali ve Ayşe’nin bakış açıları farklıdır. Ali görüntüyü aynanın arkasında
sağ tarafta görür. Ayşe ise aynanın arka tarafında sol tarafta görür. d) Ali ve Ayşe’nin oturdukları yerin önemi yoktur ikisi de aynanın arkasında
aynı yerde görür. e) Ali ve Ayşe’nin bakış açıları farklıdır. Ali görüntüyü aynanın üzerinde sağ
tarafta görür. Ayşe ise aynanın üzerinde sol tarafta görür. f) Ali ve Ayşe farklı yerde oturmaktadırlar. Ali kalemin görüntüsünü aynanın
arkasında sol tarafta görür. Ayşe ise yine aynanın arkasında fakat sağ tarafta görür.
16.3. Yukarıdaki iki soruya verdiğiniz cevaptan emin misiniz? a) Eminim. b) Emin değilim.
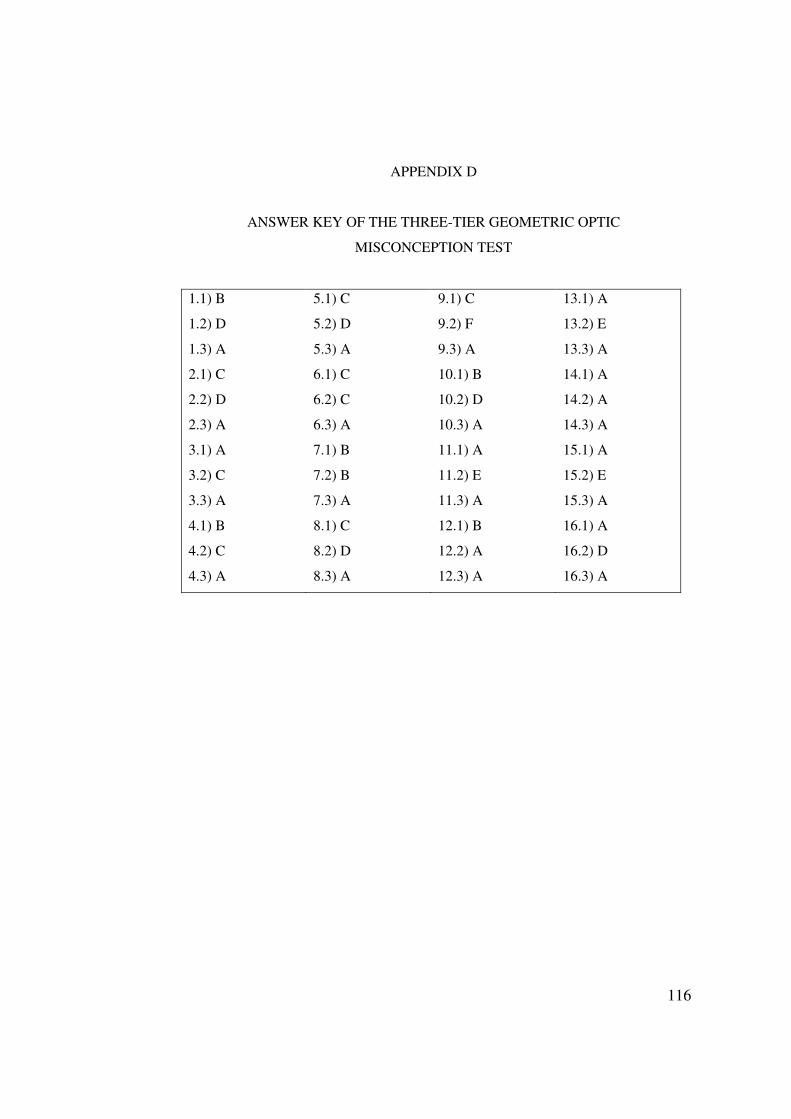
116
APPENDIX D
ANSWER KEY OF THE THREE-TIER GEOMETRIC OPTIC
MISCONCEPTION TEST
1.1) B
1.2) D
1.3) A
2.1) C
2.2) D
2.3) A
3.1) A
3.2) C
3.3) A
4.1) B
4.2) C
4.3) A
5.1) C
5.2) D
5.3) A
6.1) C
6.2) C
6.3) A
7.1) B
7.2) B
7.3) A
8.1) C
8.2) D
8.3) A
9.1) C
9.2) F
9.3) A
10.1) B
10.2) D
10.3) A
11.1) A
11.2) E
11.3) A
12.1) B
12.2) A
12.3) A
13.1) A
13.2) E
13.3) A
14.1) A
14.2) A
14.3) A
15.1) A
15.2) E
15.3) A
16.1) A
16.2) D
16.3) A
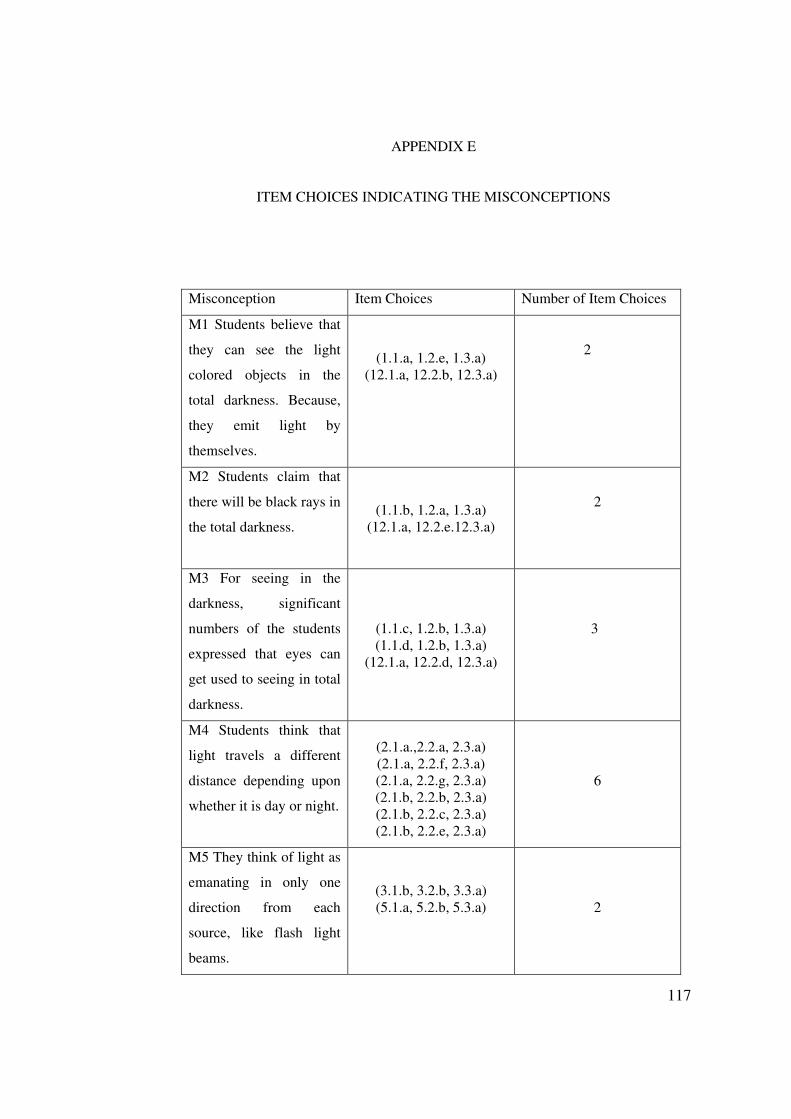
117
APPENDIX E
ITEM CHOICES INDICATING THE MISCONCEPTIONS
Misconception Item Choices Number of Item Choices
M1 Students believe that
they can see the light
colored objects in the
total darkness. Because,
they emit light by
themselves.
(1.1.a, 1.2.e, 1.3.a) (12.1.a, 12.2.b, 12.3.a)
2
M2 Students claim that
there will be black rays in
the total darkness.
(1.1.b, 1.2.a, 1.3.a) (12.1.a, 12.2.e.12.3.a)
2
M3 For seeing in the
darkness, significant
numbers of the students
expressed that eyes can
get used to seeing in total
darkness.
(1.1.c, 1.2.b, 1.3.a) (1.1.d, 1.2.b, 1.3.a)
(12.1.a, 12.2.d, 12.3.a)
3
M4 Students think that
light travels a different
distance depending upon
whether it is day or night.
(2.1.a.,2.2.a, 2.3.a) (2.1.a, 2.2.f, 2.3.a) (2.1.a, 2.2.g, 2.3.a) (2.1.b, 2.2.b, 2.3.a) (2.1.b, 2.2.c, 2.3.a) (2.1.b, 2.2.e, 2.3.a)
6
M5 They think of light as
emanating in only one
direction from each
source, like flash light
beams.
(3.1.b, 3.2.b, 3.3.a) (5.1.a, 5.2.b, 5.3.a)
2
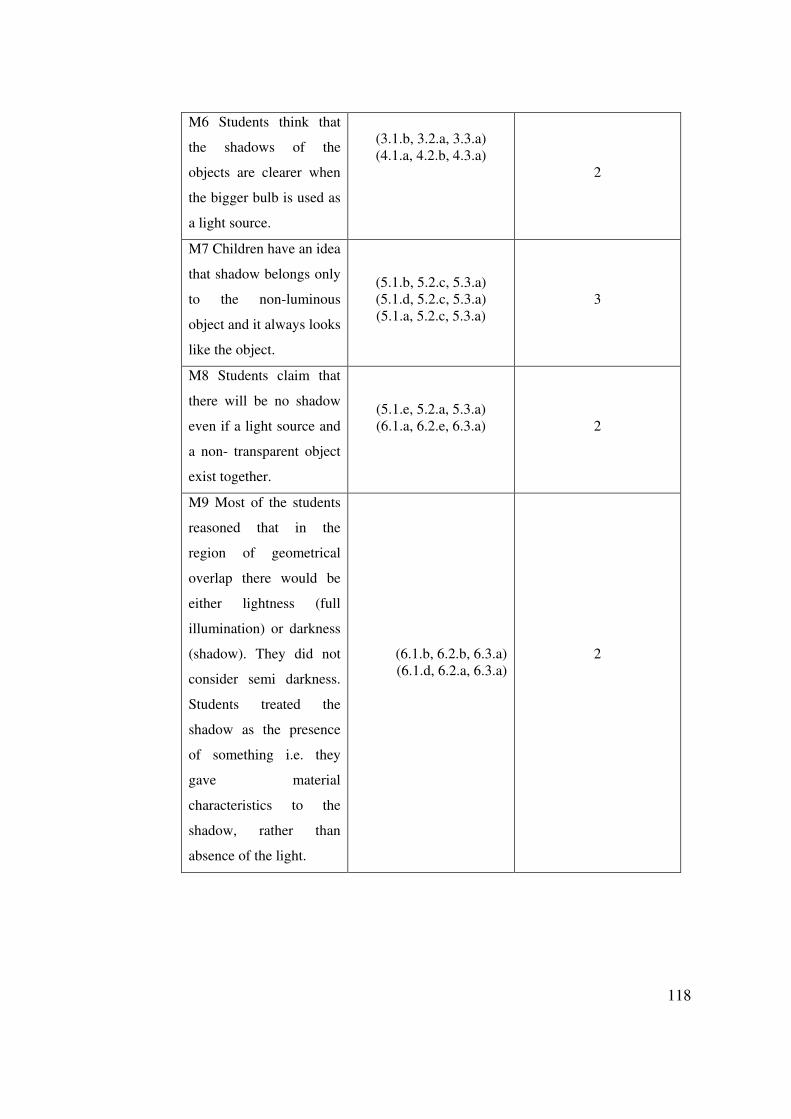
118
M6 Students think that
the shadows of the
objects are clearer when
the bigger bulb is used as
a light source.
(3.1.b, 3.2.a, 3.3.a) (4.1.a, 4.2.b, 4.3.a)
2
M7 Children have an idea
that shadow belongs only
to the non-luminous
object and it always looks
like the object.
(5.1.b, 5.2.c, 5.3.a) (5.1.d, 5.2.c, 5.3.a) (5.1.a, 5.2.c, 5.3.a)
3
M8 Students claim that
there will be no shadow
even if a light source and
a non- transparent object
exist together.
(5.1.e, 5.2.a, 5.3.a) (6.1.a, 6.2.e, 6.3.a)
2
M9 Most of the students
reasoned that in the
region of geometrical
overlap there would be
either lightness (full
illumination) or darkness
(shadow). They did not
consider semi darkness.
Students treated the
shadow as the presence
of something i.e. they
gave material
characteristics to the
shadow, rather than
absence of the light.
(6.1.b, 6.2.b, 6.3.a) (6.1.d, 6.2.a, 6.3.a)
2

119
M10 Students think that
shadow is black color and
light is white color.
When they overlap, they
mix and form the grey
color. In a similar way,
they think when the
shadow and light overlap,
the shadow reduce the
brightness of the light.
(6.1.c, 6.2.d, 6.3.a)
1
M11 Some students think
that to see an image of
any object, it should be
inside the front region
straight ahead of the
mirror.
(7.1.c, 7.2.c, 7.3.a) (15.1.b, 15.2.b, 15.3.a)
2
M12 Students think that
an image in a plane
mirror lies behind the
mirror along the line of
sight between a viewer
and the object.
(7.1.a, 7.2.a, 7.3.a) (11.1.a, 11.2.d, 11.3.a) (13.1.b, 13.2.a, 13.3.a) (15.1.b, 15.2.c, 15.3.a) (16.1.b, 16.2.c, 16.3.a) (16.1.b, 16.2.e, 16.3.a)
6
M13 Students believe
that an observer see the
object because the
observer directs sight
lines toward it, with light
possibly emitted from the
eyes.
(7.1.b, 7.2.e, 7.3.a) (11.1.a, 11.2.b, 11.3.a) (15.1.a, 15.2.a, 15.3.a) (15.1.a, 15.2.d, 15.3.a)
(8.1.a, 8.2.f, 8.3.a)
5

120
M14 Students confuse
image formation with
shadow formation. They
believed that in the
presence on an illuminant
the position and size of
the image of an
illuminated object
depends on the
illuminant. For example,
they think image size of
an object gets longer
when the illuminant is
gotten closer to the object
(8.1.a, 8.2.g, 8.3.a) (8.1.a, 8.2.h, 8.3.a) (8.1.b, 8.2.a, 8.3.a) (8.1.b, 8.2.b, 8.3.a) (8.1.b, 8.2.c, 8.3.a) (8.1.c, 8.2.c, 8.3.a) (9.1.a, 9.2.a, 9.3.a) (9.1.a, 9.2.b, 9.3.a) (9.1.a, 9.2.c, 9.3.a) (9.1.b, 9.2.d, 9.3.a) (9.1.b, 9.2.e, 9.3.a)
11
M15 Some of the
students think that the
position and size of the
image of any object
depend on the location of
the observer. They think
when the observer
retreats size and position
of the observer is
changed.
(10.1.a, 10.2.a, 10.3.a) (10.1.a, 10.2.b, 10.3.a) (10.1.a, 10.2.c, 10.3.a) (10.1.c, 10.2. k, 10.3a)
4
M16 Students claim that
image of a black object
on the mirror was due to
black rays bouncing off
the black object.
(11.1.a, 11.2.a, 11.3.a)
1

121
M17 Students think that
creating images is an
inherent attribute of the
silvery mirror material,
rather than the product of
the reflection process.
The students say that
“The mirror reflects and
so the person sees”.
(12.1.a, 12.2.c, 12.3.a)
1
M18 Students have a
misconception that while
watching an object its
position also shifted as
they viewed it from
different perspectives.
They misunderstand that
the absolute position of
the object remains the
same as an observer
moves. Only change is its
apparent position relative
to the background).
(13.1.b, 13.2.a, 13.3.a) (13.1.b, 13.2.d, 13.3.a)
2
M19 Some of the
students believe that
image of any object is
located right ahead of the
observer.
(13.1.b, 13.2.b, 13.3.a) (13.1.b, 13.2.f, 13.3.a) (16.1.b, 16.2.a, 16.3.a) (16.1.b, 16.2.f, 16.3.a)
4
M20 Students think that
if a person wants to see
him or herself in a dark
room, he or she should
illuminate the mirror
rather than himself or
herself.
(14.1.b, 14.2.b, 14.3.a) (14.1.b, 14.2.c, 14.3.a)
1

122
APPENDIX F
RAW DATA
123

124
125

126

127