DIAGNOSIS OF DIABETIC RETINOPATHY THROUGH...
13
[Purushottama et. al., Vol.5 (Iss.4: RACEEE), April, 2017] ISSN- 2350-0530(O), ISSN- 2394-3629(P) ICV (Index Copernicus Value) 2015: 71.21 IF: 4.321 (CosmosImpactFactor), 2.532 (I2OR) InfoBase Index IBI Factor 3.86 Recent Advances in Communication, Electronics & Electrical Engineering Http://www.granthaalayah.com ©International Journal of Research - GRANTHAALAYAH [92] RACEEE - 17 DIAGNOSIS OF DIABETIC RETINOPATHY THROUGH SCREENING OF RETINAL IMAGES Purushottama T L *1 , Kishore C 2 * 1, 2 Department of Electronics and Communication Engineering, S.I.T, Tumakuru, India DOI: https://doi.org/10.5281/zenodo.580631 Abstract Diabetic Retinopathy (DR) is progressive dysfunction of the retinal blood vessels caused by chronic hyperglycemia which can be a complication of diabetes type 1 or diabetes type 2. Initially, DR is asymptomatic, if not treated though it can cause low vision and blindness. Diabetic retinopathy is responsible for 1.8 million of the 37 million cases of blindness throughout the world. So the early detection of Diabetic retinopathy through proper screening is essential. The paper presents a Diabetic Retinopathy Screening System which can be used as a primary diagnosis tool by ophthalmologists in the screening process to detect symptoms of Diabetic Retinopathy. The system uses the anatomical structures such as blood vessels, exudates and microaneurysms in retinal images. The retinal images are segmented and classified as normal or DR affected images by extracting features from segmented images and the Gray Level Co- occurrence Matrix (GLCM). The classifier used is Support Vector Machine (SVM) which gives a better accuracy. The system is implemented and tested in MATLAB and LabView for the standard database and need to be optimized for real time screening of images. LabView creates distributable .EXE files and .DLL files which can be downloaded into the FPGA/DSP processor. Hardware implementation on LabView FPGA presents a small learning curve which drastically reduces development time and eliminates the need for custom hardware design. Keywords: Diabetic Retinopathy (DR); Blood Vessels; Exudates; Microaneurysms (MA); Morphological Processing; Grey Level Co-Occurrence Matrix (GLCM); Support Vector Machine (SVM). Cite This Article: Purushottama T L, and Kishore C. (2017). “DIAGNOSIS OF DIABETIC RETINOPATHY THROUGH SCREENING OF RETINAL IMAGES.” International Journal of Research - Granthaalayah, 5(4) RACEEE, 92-104. https://doi.org/10.5281/zenodo.580631.
Transcript of DIAGNOSIS OF DIABETIC RETINOPATHY THROUGH...

[Purushottama et. al., Vol.5 (Iss.4: RACEEE), April, 2017] ISSN- 2350-0530(O), ISSN- 2394-3629(P)
ICV (Index Copernicus Value) 2015: 71.21 IF: 4.321 (CosmosImpactFactor), 2.532 (I2OR)
InfoBase Index IBI Factor 3.86
Recent Advances in Communication, Electronics & Electrical Engineering
Http://www.granthaalayah.com ©International Journal of Research - GRANTHAALAYAH [92]
RACEEE - 17
DIAGNOSIS OF DIABETIC RETINOPATHY THROUGH SCREENING
OF RETINAL IMAGES
Purushottama T L *1
, Kishore C 2
*
1, 2 Department of Electronics and Communication Engineering, S.I.T, Tumakuru, India
DOI: https://doi.org/10.5281/zenodo.580631
Abstract
Diabetic Retinopathy (DR) is progressive dysfunction of the retinal blood vessels caused by
chronic hyperglycemia which can be a complication of diabetes type 1 or diabetes type 2.
Initially, DR is asymptomatic, if not treated though it can cause low vision and blindness.
Diabetic retinopathy is responsible for 1.8 million of the 37 million cases of blindness
throughout the world. So the early detection of Diabetic retinopathy through proper screening is
essential.
The paper presents a Diabetic Retinopathy Screening System which can be used as a primary
diagnosis tool by ophthalmologists in the screening process to detect symptoms of Diabetic
Retinopathy. The system uses the anatomical structures such as blood vessels, exudates and
microaneurysms in retinal images. The retinal images are segmented and classified as normal or
DR affected images by extracting features from segmented images and the Gray Level Co-
occurrence Matrix (GLCM). The classifier used is Support Vector Machine (SVM) which gives
a better accuracy.
The system is implemented and tested in MATLAB and LabView for the standard database and
need to be optimized for real time screening of images. LabView creates distributable .EXE files
and .DLL files which can be downloaded into the FPGA/DSP processor. Hardware
implementation on LabView FPGA presents a small learning curve which drastically reduces
development time and eliminates the need for custom hardware design.
Keywords: Diabetic Retinopathy (DR); Blood Vessels; Exudates; Microaneurysms (MA);
Morphological Processing; Grey Level Co-Occurrence Matrix (GLCM); Support Vector
Machine (SVM).
Cite This Article: Purushottama T L, and Kishore C. (2017). “DIAGNOSIS OF DIABETIC
RETINOPATHY THROUGH SCREENING OF RETINAL IMAGES.” International Journal of
Research - Granthaalayah, 5(4) RACEEE, 92-104. https://doi.org/10.5281/zenodo.580631.

[Purushottama et. al., Vol.5 (Iss.4: RACEEE), April, 2017] ISSN- 2350-0530(O), ISSN- 2394-3629(P)
ICV (Index Copernicus Value) 2015: 71.21 IF: 4.321 (CosmosImpactFactor), 2.532 (I2OR)
InfoBase Index IBI Factor 3.86
Recent Advances in Communication, Electronics & Electrical Engineering
Http://www.granthaalayah.com ©International Journal of Research - GRANTHAALAYAH [93]
1. Introduction
The main aim of this work is to develop reliable and accurate image processing and pattern
recognition methods for automatic fundus image analysis to aid ophthalmologist’s diagnosis and
to be used as an automatic tool for the screening of diabetic retinopathy. Given a low quality
color fundus image, the fundus image analysis system should extract the features such as the
optic disk, fovea and the retinal blood vessels as reference coordinates before the system can
achieve more complex tasks of identifying pathological entities such as hard exudates, cotton
wool spots (soft exudates), hemorrhages and microaneurysms [3]. The system must be able to do
it all the time irrespective of variability in color, illumination levels and amount of noise. Finally
to develop an algorithm that will be able to identify and classify the patients with normal,
moderate and severe from the obtained retinal fundus image of the patients.
1.1. Diabetic Retinopathy
Diabetic retinopathy is a complication of diabetes to the retina. It is a very asymptomatic disease
in the early stages and it could lead to permanent vision loss if untreated for long time [8]. The
problem here is the patients may not know about it until it reaches advanced stages. Once it
reaches advanced stages vision loss becomes inevitable. Diabetic retinopathy occurs because of
microangiopathy which in turn affects the retinal pre-capillary arterioles, capillaries and venules.
It is caused by microvascular leakages from the breakdown of the internal blood-retinal barrier
and microvascular occlusion. Due to the progressive damage of the microvascular system, loss of
vision and blindness can occur. The presence of diabetic retinopathy can be detected by
examining the retina form its characteristic features [9].
1.2. Abnormalities Associated with the Retina
Diabetic retinopathy occurs due to the leakage of blood vessels, formation of dark spots on
retinal surface, etc. The clinical symptoms of diabetic retinopathy are discussed below. Fig.1
shows the effect of diabetic retinopathy on vision.
Microaneurysms: These are the first clinical abnormality to be noticed in the eye [8]. They may
appear in isolation or in clusters as tiny, dark red spots. Microaneurysms arise due to high sugar
levels in the blood which causes the walls of tiny blood vessels to distend. Their sizes ranges
from 10-100 microns i.e. less than 1/12th the diameter of an average optics disc and are circular
in shape, at this stage, the disease is not eye threatening [1].
Hemorrhages: Occurs in the deeper layers of the retina and are often called ‘blot’ hemorrhages
because of their round shape. As the retinal blood vessels become more damaged and permeable,
their number will increase. Retinal hemorrhages look either as small red dots or blots identical to
microaneurysms or as larger flame-shaped hemorrhages.
Hard exudates: These are one of the main characteristics of diabetic retinopathy and can vary in
size from tiny specks to large patches with clear edges. As well as blood, fluid that is rich in fat
and protein is contained in the eye and this is what leaks out to form the exudates. These can
impair vision by preventing light from reaching the retina [9].

[Purushottama et. al., Vol.5 (Iss.4: RACEEE), April, 2017] ISSN- 2350-0530(O), ISSN- 2394-3629(P)
ICV (Index Copernicus Value) 2015: 71.21 IF: 4.321 (CosmosImpactFactor), 2.532 (I2OR)
InfoBase Index IBI Factor 3.86
Recent Advances in Communication, Electronics & Electrical Engineering
Http://www.granthaalayah.com ©International Journal of Research - GRANTHAALAYAH [94]
Soft exudates: These are often called ‘cotton wool spots’. As the disease advances further,
multiple small patches of the retina become ischemic deprived of blood. These ischemic regions
are observable on the retina as fluffy whitish blobs called cotton wool spots. This is more often
seen in advanced retinopathy.
Figure 1: Effect of diabetic retinopathy on vision without retinopathy and with retinopathy
1.3. Methodologies for Detection and Classification
The green channel extraction of image gives the better contrast enhancement between foreground
and background. Mathematical morphology approach gives the finer details of thin vessels in
blood vessel segmentation compared with wavelet transform. K-means clustering is used for
exudates segmentation contains some noisy pixel, so it needs to reduce the error due to over
enhancement of noise. kNN, NB, and SVM, are used for classification and SVM has shown
slightly better result compared to other classifiers.
2. Methodology
The proposed automatic screening methodology is shown in Fig. 2. The input to the system
retinal fundus image taken by the digital fundus camera. The input retinal images undergo per-
processing to enhance the contrast of an image and segmentation to detect blood vessels,
exudates and microaneurysms separately. Textural feature analysis is done by using GLCM.
Then features such as area of blood vessels, area of exudates, and area of microaneurysms,
energy, entropy, contrast and homogeneity are extracted. These features are fed to SVM
classifier which classifies the image as normal or abnormal based on the presence of DR.
2.1. Database
The retinal fundus images of the diabetic patients are collected from the Government hospital,
which are taken by the digital fundus camera. The database contains 60 images of the retina, and
was saved in JPEG format. These 60 images were divided into a training set and a testing set.
The database used here is diagnosed by the medical experts for each image such as Diabetic
Retinopathy and normal image.

[Purushottama et. al., Vol.5 (Iss.4: RACEEE), April, 2017] ISSN- 2350-0530(O), ISSN- 2394-3629(P)
ICV (Index Copernicus Value) 2015: 71.21 IF: 4.321 (CosmosImpactFactor), 2.532 (I2OR)
InfoBase Index IBI Factor 3.86
Recent Advances in Communication, Electronics & Electrical Engineering
Http://www.granthaalayah.com ©International Journal of Research - GRANTHAALAYAH [95]
Figure 2: Proposed methodology
2.2. Pre-Processing
Green channel extraction: Green Channel Extraction is the process of converting the color image
into green channel image. Normally a RGB color consists of red, green and blue color. The green
channel extraction produces high contrast image. The green color plane was used in this analysis
since it shows the best contrast between the vessels and the background retina in the eye [1, 4,
and 7].
Contrast Enhancement: Adaptive histogram equalization is an image processing technique used
to improve contrast in images. It is considered an image enhancement technique capable of
improving an image's local contrast, bringing out more detail in the image [4,5].
Denoising: It is usually necessary to perform a high degree of noise reduction in an image before
performing higher level processing steps. Median filter is a non-linear digital filtering technique
which is often used to eliminate noise from images or other signals. Its edge-conserving nature
makes it useful in cases where edge blurring is undesirable. Median filtering operation replaces a
pixel by the median of all pixels in the neighborhood of small sliding window. It may be applied
prior to segmentation in order to reduce the amount of noise in a stack of 2D images. The median
filter reduces the variance of the intensities in the image. Median filters change the intensity
mean value of the image, if the spatial noise distribution in the image is not symmetrical within
the window [8,10].

[Purushottama et. al., Vol.5 (Iss.4: RACEEE), April, 2017] ISSN- 2350-0530(O), ISSN- 2394-3629(P)
ICV (Index Copernicus Value) 2015: 71.21 IF: 4.321 (CosmosImpactFactor), 2.532 (I2OR)
InfoBase Index IBI Factor 3.86
Recent Advances in Communication, Electronics & Electrical Engineering
Http://www.granthaalayah.com ©International Journal of Research - GRANTHAALAYAH [96]
2.3. Segmentation of Retinal Structures
Detection of Blood Vessels: The segmentation of blood vessels is done by using the Kirsch’s
edge detection and morphological method. This is followed by applying Kirsch’s edges [11].
Kirsch’s edges helps to capture the edges of the exudates. This edge detector is based on the
kernel k evaluated at 8 different directions on the image. The kernel is given by,
15/315/315/5
15/3015/5
15/315/315/5
k (1)
The kernel outputs are combined together by selecting the maximum value found on each pixel
output. This is followed by erosion operation and binary conversion.
Detection of Exudates and Microaneurysms: Morphological operators are used for the detection
of exudates and MA in this work. The morphological operators extract relevant structures of the
image by probing the image with another set of known shape called structuring element (SE) [7].
By using the prior knowledge of the geometry the shape of the SE is chosen. The morphological
operations are erosion, dilation, opening, closing. Erosion computes the minimum of each pixel’s
neighborhood and is given by,
ABEzBA z (2)
Where A is a binary image, B is a structuring element and E is the Euclidean space.
Dilation computes the maximum of each pixel’s neighborhood and is given by,
ABEzBA s )( (3)
Opening involves single erosion followed by a single dilation by the same operator.
BBABA )( (4)
Closing involves a single dilation followed by single erosion by the same operator.
BBABA )( (5)
The steps for the detection of exudates are as follows. Green channel of the retinal image is
extracted from the colored image. First median filtering is applied to the green image. Then
morphological reconstruction is done to obtain the background image, which is subtracted from
the original image. Next step is to remove all the connected components form the binary image
that has fewer than P pixels so that the resultant binary image will contain only optic disc, where
P was chosen such that it is smaller than the maximum size of optic disc. The optic disc occupies
nearly 80 x 80 pixels. The resulting image that contains only the optic disc is subtracted from the
threshold image so that it delivers an image that contains only exudates.

[Purushottama et. al., Vol.5 (Iss.4: RACEEE), April, 2017] ISSN- 2350-0530(O), ISSN- 2394-3629(P)
ICV (Index Copernicus Value) 2015: 71.21 IF: 4.321 (CosmosImpactFactor), 2.532 (I2OR)
InfoBase Index IBI Factor 3.86
Recent Advances in Communication, Electronics & Electrical Engineering
Http://www.granthaalayah.com ©International Journal of Research - GRANTHAALAYAH [97]
Microaneurysms are also detected using morphological operators in this work. The first step is
adaptive histogram equalization for image enhancement. Closing operator is applied to eliminate
the details. Then filling operation is done to fill the holes in the vessels. Then the difference
between the closed image and the filled image is found.
)()( ffillfclosefdiff (6)
This difference image is binarized by thresholding. Then extended-minima transform is applied
to this binary image. The extended-minima transform is the regional minima of h-minima
transform. This is a thresholding technique that brings most of the valleys to zero. The h-minima
transform suppresses all the minima in the intensity image whose depth is less than or equal to a
predefined threshold. In the output binary image (fE), the white pixels represent the regional
minima in the original image. Regional minima are connected pixels with the same intensity
value, whose external boundary pixels all have a higher value. Finally the vessels and exudates
are removed to separate out the MAs.
exvEMA ffff (7)
2.4. Texture Analysis
Texture means repeating patterns of local variation of pixel intensities. It gives information about
the arrangement of surface pixels and their relationship with the surrounding pixels. Statistical
texture analysis is based on Gray Level Co-occurrence Matrix (GLCM). It is a tabulation of how
often different combinations of pixel grey levels occur in an image. For a 2-dimensional image
f(x,y) with N grey levels, the GLCM ),( dp for each d and is given by,
1,11,10,1
1,11,10,1
1,01,00,0
..
.....
.....
..
..
),(
NNNN
N
N
ppp
ppp
ppp
dp
(8)
Where consideredpairsofnumbertotal
jiensitywithpairspixelofnumberp ji
),(int,
ijpis defined as the relative number of times gray level pair (i,j) occurs when pixels separated by
the distance d along the angle are compared. Each element is normalized by the total number
of occurrences to form the GLCM P. The commonly extracted textural features from GLCM are
contrast, homogeneity, correlation and energy [7,10].

[Purushottama et. al., Vol.5 (Iss.4: RACEEE), April, 2017] ISSN- 2350-0530(O), ISSN- 2394-3629(P)
ICV (Index Copernicus Value) 2015: 71.21 IF: 4.321 (CosmosImpactFactor), 2.532 (I2OR)
InfoBase Index IBI Factor 3.86
Recent Advances in Communication, Electronics & Electrical Engineering
Http://www.granthaalayah.com ©International Journal of Research - GRANTHAALAYAH [98]
2.5. Feature Extraction
The features are extracted for the classification purpose, which are obtained from segmentation
of retinal structures and texture analysis. These features are the area of blood vessels, area of
exudates, area of MA, contrast, homogeneity, correlation and energy.
Area of blood vessels: It is determined by finding the total number of white (vessel) pixels in the
vessel-segmented image.
Area of exudates: It is determined by finding the total number of white pixels in the exudates
image.
Area of MA: It is determined by finding the total number of white pixels in the MA image.
Contrast: It is a measure of the intensity contrast between a pixel and its neighbor over the whole
image, and is given by,
1
0
1
0
2)(N
i
N
j
ijpjicontrast
(9)
Where ijpare the elements of the GLCM.
Homogeneity: It measures the closeness of the distribution of elements in the GLCM to the
GLCM diagonal and can be mathematically written as
1
1
1
0 )1(
N
i
N
j
ij
ji
pyHomogeneit
(10)
Correlation: It calculates the linear dependency of the gray level values in the co-occurrence
matrix. It is represented mathematically as
1
0
1
0
))((N
i
N
j ji
ijji pjinCorrelatio
(11)
Where μi, μj, σi and σj are the means and standard deviations of Pi and Pj.
Energy: It is the sum of squared elements in the co-occurrence matrix.
1
0
1
0
2N
i
N
j
ijpEnergy
(12)
All the seven features together form a feature vector of an image.
2.6. Classification
In this work, classification based on the extracted features is done by using SVM classifier [5, 7,
8, and 10]. SVM is used to classify the group of eye images as either affected or normal

[Purushottama et. al., Vol.5 (Iss.4: RACEEE), April, 2017] ISSN- 2350-0530(O), ISSN- 2394-3629(P)
ICV (Index Copernicus Value) 2015: 71.21 IF: 4.321 (CosmosImpactFactor), 2.532 (I2OR)
InfoBase Index IBI Factor 3.86
Recent Advances in Communication, Electronics & Electrical Engineering
Http://www.granthaalayah.com ©International Journal of Research - GRANTHAALAYAH [99]
depending on the feature values. A Support Vector Machine (SVM) performs classification by
constructing an N dimensional hyper plane that optimally separates the data into two categories.
Based on the results of area Computation and texture analysis, the system will classify the image
as normal or diabetic retinopathy. In the normal stage, there are no micro aneurysms and
exudates. In DR stage, both exudates and micro aneurysms are present.
3. Results and Discussions
The study evaluating a new test that screens people for a disease. Each person taking the test
either has or does not have the disease. The test outcome can be positive (predicting that the
person has the disease) or negative (predicting that the person does not have the disease). The
test results for each subject may or may not match the subject's actual status. In that setting:
True positive: Affected retina correctly diagnosed as defected; False positive: Healthy retina
incorrectly identified as affected; True negative: Healthy retina correctly identified as healthy
False negative: Affected retina correctly identified as healthy
In general, Positive = identified and negative = rejected. Therefore, True positive = correctly
identified; False positive = incorrectly identified; True negative = correctly rejected
False negative = incorrectly rejected
The screening diabetic retinopathy is performed with respect to sensitivity and specificity.
(13)
(14)

[Purushottama et. al., Vol.5 (Iss.4: RACEEE), April, 2017] ISSN- 2350-0530(O), ISSN- 2394-3629(P)
ICV (Index Copernicus Value) 2015: 71.21 IF: 4.321 (CosmosImpactFactor), 2.532 (I2OR)
InfoBase Index IBI Factor 3.86
Recent Advances in Communication, Electronics & Electrical Engineering
Http://www.granthaalayah.com ©International Journal of Research - GRANTHAALAYAH [100]
3.1. Simulation Results of MATLAB
3.1.1. Segmentation of Blood Vessels
a) b) c)
d) e) f)
Figure 3: (a) retina image (b) green channel image (c) contrast enhancement (d) kirsch’s edge
detection (e) mask creation (f) segmented blood vessels
The segmentation of blood vessels is done by using Kirsch’s edge detection (method 1) and
morphological operation, which is shown in Fig 3.
3.1.2. Segmentation of Exudates
a) b) c)
[Purushottama et. al., Vol.5 (Iss.4: RACEEE), April, 2017] ISSN- 2350-0530(O), ISSN- 2394-3629(P)
ICV (Index Copernicus Value) 2015: 71.21 IF: 4.321 (CosmosImpactFactor), 2.532 (I2OR)
InfoBase Index IBI Factor 3.86
Recent Advances in Communication, Electronics & Electrical Engineering
Http://www.granthaalayah.com ©International Journal of Research - GRANTHAALAYAH [101]
d) e) f)
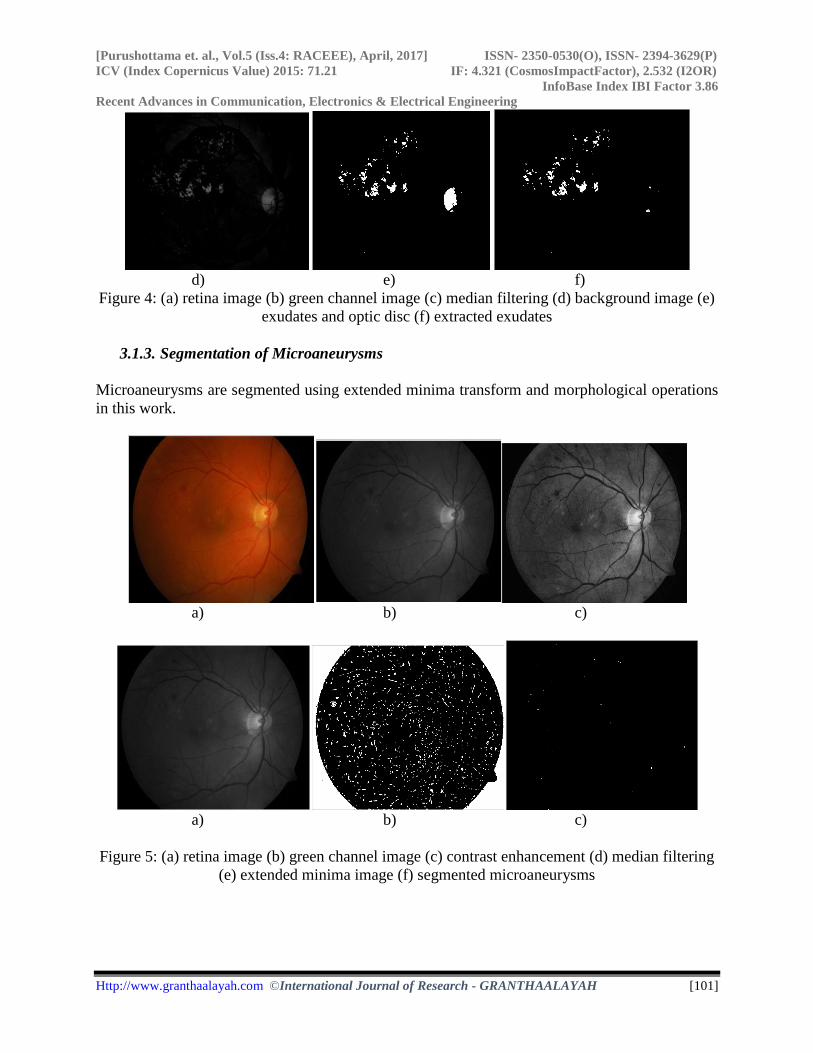
Figure 4: (a) retina image (b) green channel image (c) median filtering (d) background image (e)
exudates and optic disc (f) extracted exudates
3.1.3. Segmentation of Microaneurysms
Microaneurysms are segmented using extended minima transform and morphological operations
in this work.
a) b) c)
a) b) c)
Figure 5: (a) retina image (b) green channel image (c) contrast enhancement (d) median filtering
(e) extended minima image (f) segmented microaneurysms

[Purushottama et. al., Vol.5 (Iss.4: RACEEE), April, 2017] ISSN- 2350-0530(O), ISSN- 2394-3629(P)
ICV (Index Copernicus Value) 2015: 71.21 IF: 4.321 (CosmosImpactFactor), 2.532 (I2OR)
InfoBase Index IBI Factor 3.86
Recent Advances in Communication, Electronics & Electrical Engineering
Http://www.granthaalayah.com ©International Journal of Research - GRANTHAALAYAH [102]
3.2. Simulation Result in LabView
Figure 6: Snap shot of retina after which showing segmentation of blood vessels using method 2,
exudates, microaneurysms and extracted feature values
3.3. Classification Result
3.3.1. Using MATLAB
All the features are extracted and combined to a single vector and this vector is used as input to
the SVM classifier. The image is classified as ‘Normal’ if it does not contain any exudates and
microaneurysms. The image is classified as ‘Moderate’ if it contained only microaneurysms and
not the exudates. The image is classified as ‘Severe’ if it contains both microaneurysms and
exudates.
Table 1: Classification results in Matlab
Class No. of Training Images No. of Testing Images No. of Correctly classified Images
Normal 100 14 13
Mild 100 14 12
Severe 100 14 12
True Positive = 12, False Positive = 1, True Negative = 13, False Negative = 2
Sensitivity = TN/(TN+FP) = 92.85% Specificity = TP/(TP+FN) = 85.71%
3.3.2. Using LabView
Table 2: Classification results in LabView
Class No. of Training Images No. of Testing Images No. of Correctly classified Images
Normal 100 14 13
Mild 100 14 10
Severe 100 14 11
True Positive = 13, False Positive = 1, True Negative = 12, False Negative = 2
Sensitivity = TN/(TN+FP) = 92.85% ; Specificity = TP/(TP+FN) = 78.52%

[Purushottama et. al., Vol.5 (Iss.4: RACEEE), April, 2017] ISSN- 2350-0530(O), ISSN- 2394-3629(P)
ICV (Index Copernicus Value) 2015: 71.21 IF: 4.321 (CosmosImpactFactor), 2.532 (I2OR)
InfoBase Index IBI Factor 3.86
Recent Advances in Communication, Electronics & Electrical Engineering
Http://www.granthaalayah.com ©International Journal of Research - GRANTHAALAYAH [103]
The main objective of LabView simulation tool is that it allows easy implementation on the
LabView FPGA tool kit. Due to this the specifications used are different compared to the Matlab
which makes the blocks more compatible to be implemented in the hardware. Different
parameters for individual block sets are present in LabView, so that classification accuracy of the
SVM classifier varies for LabView and Matlab.
4. Conclusion
Diabetic Retinopathy system consists of three modules, Segmentation, feature extraction and
classification is developed and tested using simulation tools Matlab and LabView. Segmentation
module includes segmentation of blood vessels, exudates and microaneurysms. Feature
extraction includes extracting different features from GLCM and then classification using SVM.
Kirsch’s edge detection and matched filter response are used for blood vessel segmentation.
Exudates are segmented using image reconstruction and connected component analysis.
Microaneurysms are segmented by using extended minima transform. The features are extracted
by textural analysis. The extracted features describe the relevant information from the input data
in order to perform the identification process. The extracted features are used for effective
classification of three different stages of diabetic retinopathy that is normal, moderate or severe.
The accuracy of classification is calculated in terms of sensitivity and specificity.
This system intends to help in the screening process to detect symptoms of Diabetic Retinopathy.
This can be a preliminary diagnosis tool or decision support system for ophthalmologists. The
proposed technique does not require any user intervention, and has consistent performance in
both normal and abnormal images.
References
[1] Iqbal.M.I, Aibinu.A.M, Gubbal.N.S and Khan.A “Automatic diagnosis of Diabetic Retinopathy
using fundus images”, Ph.D. Dissertation, Blekinge Institute of Technology, 2006. MEE06:19,
october 2006.
[2] Jestin V.K, Anitha J and Jude Hemanth, “Texture feature extraction for retinal image processing”,
in Proc. International Conference on Computing, Electronics and Electrical Technologies
(ICCEET), vol. 1, pp: 548-551, 2012.
[3] ManjulaSriRayudu, Vaibhav Jain and MM.RaoKunda , “Review of image processing techniques
for automatic detection of eye diseases”, in Proc. Sixth International conference on sensing
technology (ICST), pp: 320-325, 2012.
[4] Priya.R, Aruna.P, “Review of automated diagnosis of diabetic retinopathy using the support
vector machine”, International journal of applied engineering research, vol. 1, no 4, pp: 844-863,
2011.
[5] DRIVE Database
Retrieved from http://www.isi.uu.nl/Research/Database/DRIVE, Accessed on 02-01-2014.
[6] DIARETDB1 Database
Retrieved from http://www2.it.lut.fi/project/imagetert/diaretdb1/, Accessed on 02-01-2014
[7] DIARETDB1 Database
Retrieved from http://www2.it.lut.fi/project/imagetert/diaretdb0/, Accessed on 02-01-2014

[Purushottama et. al., Vol.5 (Iss.4: RACEEE), April, 2017] ISSN- 2350-0530(O), ISSN- 2394-3629(P)
ICV (Index Copernicus Value) 2015: 71.21 IF: 4.321 (CosmosImpactFactor), 2.532 (I2OR)
InfoBase Index IBI Factor 3.86
Recent Advances in Communication, Electronics & Electrical Engineering
Http://www.granthaalayah.com ©International Journal of Research - GRANTHAALAYAH [104]
[8] Istvan Lazar and AndrasHajdu, “Retinal microaneurysm detection through local rotating cross-
section profile analysis”, IEEE transaction on medical imaging, vol. 32, no. 2, pp: 400-407, 2013.
[9] Giribabukande, P.Venkatasubbaiah, T.sathyasavithri, “Feature extraction in Digital fundus
Image”, Journal of Medical and Biological engineering vol. 29, no. 3, pp 122-130, 2009.
[10] CemalKose, UgurSevik, CevatIkibas and HidayetErdol, “Simple methods for segmentation and
measurement of diabetic retinopathy lesions in retinal fundus images”, in Proc. Computer
Methods and Programs in Biomedicine (CMPB), vol. 107, no. 2, pp: 274–293, 2012.
[11] A.Sopharak,B.Uyyanonvara,S.Barman and T.H.Williamson, “Automatic detection of diabetic
retinopathy exudates from non-dilated retinal images using mathematical morphology methods”,
in Proc. Computerized Medical Imaging and Graphics ,vol. 32, pp: 720–727, 2009.
[12] RagavVenkatesan, ParagChandakkar, Baoxin Li, Senior member, IEEE, and Helen K. Li,
“Classification of diabetic retinopathy images using multi-class multi instance learning based on
colorcorrelogram features”, in Proc. 34th International conference of IEEE EMBS, pp: 1462-
1465, 2012.
[13] Dr.Chandrashekar. M. Patil, “An Approach for the Detection of Vascular Abnormalities in
Diabetic Retinopathy”, International Journal of Data Mining Techniques and Applications, vol.
02, no. 5, pp. 246-250, 2013.
[14] Mahendran.G, Dhanashekar.R, NarmadhaDevi.K.N, “Recognition of Retinal Exudates for
Diabetic Retinopathy and its Severity Level Assessment” IJECEAR, vol. 2, no. 1, pp: 104-108,
2014.
[15] Selvathi.D, N.B.Prakash, NeethiBalagopal,”Automatic Detection of Diabetic Retinopathy for
Early Diagnosis using Feature Extraction and Support Vector Machine”, International Journal of
Emerging Technology and Advanced Engineering, vol. 2, no. 11, pp: 103-108, 2012.
[16] Berrichi Fatima Zohra, Benyettou Mohamed, “Automated diagnosis of retinal images using the
Support Vector Machine(SVM)”, Laboratoire de Modélisation et Optimisation des
SystèmesIndustriels : LAMOSI, pp: 1-6, 2011.
[17] Tadej Tasner, Darko Lovrec, Francisek Trsner and Jorg Edler, “Comparison of LabVIEW and
MatLab for scientific research”, International journal of engineering, vol. 3, no.7, pp: 133-137,
2012.
*Corresponding author.
E-mail address: [email protected]