Diagnosis of carbonation induced corrosion initiation...
34
1 Diagnosis of carbonation induced corrosion initiation and progression in reinforced concrete structures using piezo-impedance transducers V. Talakokula 1 , S. Bhalla 2* , R. J. Ball 3 , C. R. Bowen 4 , G. L. Pesce 3 , R. Kurchania 5 , B. Bhattacharjee 2 , A. Gupta 2 , and K. Paine 3 ABSTRACT In addition to chloride induced corrosion, the other commonly occurring type of rebar corrosion in reinforced concrete structures is that induced by the ingress of atmospheric carbon dioxide into concrete, commonly referred to as ‘carbonation induced corrosion’. This paper presents a new approach for detecting the onset and quantifying the level of carbonation induced rebar corrosion. The approach is based on the changes in the mechanical impedance parameters acquired using the electro-mechanical coupling of a piezoelectric lead zirconate titanate (PZT) ceramic patch bonded to the surface of the rebar. The approach is non-destructive and is demonstrated though accelerated tests on reinforced concrete specimens subjected to controlled carbon dioxide exposure for a period spanning over 230 days. The equivalent stiffness parameter, extracted from the frequency response of the admittance signatures of the PZT patch, is found to increase with penetration of carbon dioxide inside the surface and the consequent carbonation, an observation that is correlated with phenolphthalein staining. After the onset of rebar corrosion, the equivalent stiffness parameter exhibited a reduction in magnitude over time, providing a clear indication of the occurrence of corrosion and the results are correlated with scanning electron microscope images and Raman spectroscopy measurements. The average rate of corrosion is determined using the equivalent mass parameter. The use of PZT ceramic transducers, therefore, provides an alternate and effective technique for diagnosis of carbonation induced rebar corrosion initiation and progression in reinforced concrete structures non-destructively. Key words: SEM, Chloride, Corrosion, Carbonation, Steel Reinforced concrete 1 Department of Civil Engineering, ABES Engineering College, Ghaziabad, (INDIA), 2 Department of Civil Engineering, Indian Institute of Technology Delhi, Hauz Khas, New Delhi 110016 (INDIA), 3 Department of Architecture and Civil Engineering, University of Bath, Bath, BA2 7AY, (UNITED KINGDOM) 4 Department of Mechanical Engineering, University of Bath, Bath, BA2 7AY, (UNITED KINGDOM) 5 Department of Physics, Maulana Azad National Institute of Technology (MANIT), Bhopal, 462051 (INDIA) *Corresponding author (Email: [email protected])
Transcript of Diagnosis of carbonation induced corrosion initiation...

1
Diagnosis of carbonation induced corrosion initiation and progression in reinforced concrete structures using piezo-impedance transducers
V. Talakokula1, S. Bhalla2*, R. J. Ball3, C. R. Bowen4, G. L. Pesce3, R. Kurchania5, B.
Bhattacharjee2, A. Gupta2, and K. Paine3
ABSTRACT
In addition to chloride induced corrosion, the other commonly occurring type of rebar
corrosion in reinforced concrete structures is that induced by the ingress of atmospheric
carbon dioxide into concrete, commonly referred to as ‘carbonation induced corrosion’.
This paper presents a new approach for detecting the onset and quantifying the level of
carbonation induced rebar corrosion. The approach is based on the changes in the
mechanical impedance parameters acquired using the electro-mechanical coupling of a
piezoelectric lead zirconate titanate (PZT) ceramic patch bonded to the surface of the
rebar. The approach is non-destructive and is demonstrated though accelerated tests on
reinforced concrete specimens subjected to controlled carbon dioxide exposure for a
period spanning over 230 days. The equivalent stiffness parameter, extracted from the
frequency response of the admittance signatures of the PZT patch, is found to increase
with penetration of carbon dioxide inside the surface and the consequent carbonation,
an observation that is correlated with phenolphthalein staining. After the onset of rebar
corrosion, the equivalent stiffness parameter exhibited a reduction in magnitude over
time, providing a clear indication of the occurrence of corrosion and the results are
correlated with scanning electron microscope images and Raman spectroscopy
measurements. The average rate of corrosion is determined using the equivalent mass
parameter. The use of PZT ceramic transducers, therefore, provides an alternate and
effective technique for diagnosis of carbonation induced rebar corrosion initiation and
progression in reinforced concrete structures non-destructively.
Key words: SEM, Chloride, Corrosion, Carbonation, Steel Reinforced concrete 1Department of Civil Engineering, ABES Engineering College, Ghaziabad, (INDIA), 2Department of Civil Engineering, Indian Institute of Technology Delhi, Hauz Khas, New Delhi 110016 (INDIA), 3Department of Architecture and Civil Engineering, University of Bath, Bath, BA2 7AY, (UNITED KINGDOM) 4Department of Mechanical Engineering, University of Bath, Bath, BA2 7AY, (UNITED KINGDOM) 5Department of Physics, Maulana Azad National Institute of Technology (MANIT), Bhopal, 462051 (INDIA) *Corresponding author (Email: [email protected])
2
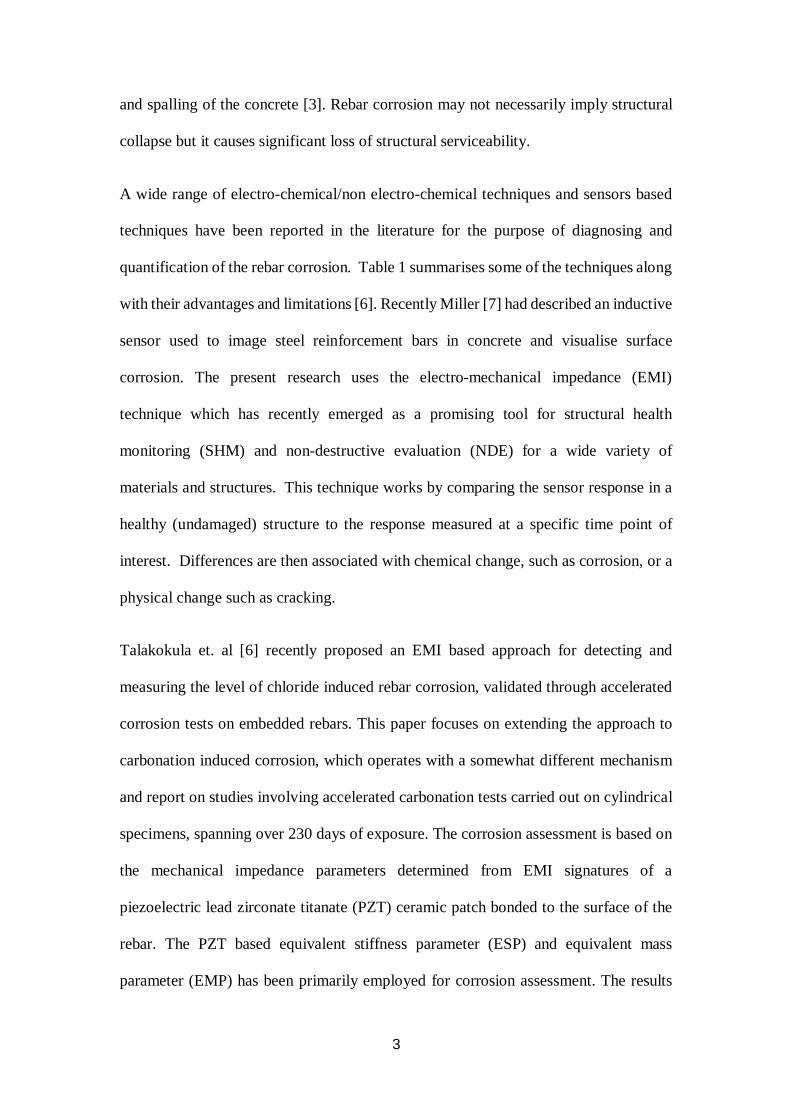
1. INTRODUCTION
Rebar corrosion is widely regarded as the most common cause of deterioration and
premature failure of reinforced concrete (RC) structures [1]. In general, concrete is
expected to provide a high degree of corrosion protection to the embedded steel rebars
owing to its highly alkaline nature. A well compacted and cured concrete, with low
water-cement ratio, has a permeability that is low enough to inhibit the penetration of
corrosion inducing agents from the environment. However, such ideal conditions are
seldom met in practice, leading to corrosion of the reinforcement, which is the major
tensile load resisting element in RC structures.
Rebar corrosion is of two types, namely (i) chloride induced and (ii) carbonation
induced. In the first type, chloride ions, either present in the raw materials or introduced
from outside, due to insufficient cover or high permeability, lead to a breakdown of the
alkaline passive film around the rebar [2, 3]. The second type of rebar corrosion, namely
carbonation induced corrosion, results from the ingress of atmospheric carbon dioxide
(CO2) into the concrete. The penetrated CO2 dissolves in the pore solution to form
carbonic acid, which reacts with calcium hydroxide and unhydrated silicates in the
cement paste, forming mainly calcium carbonate [4]. Although calcium carbonate fills
up the concrete pores leading to a somewhat lower permeability, the associated drop in
the pore fluid alkalinity from a pH value of over 12 to as low as 8 disrupts the
passivating layer surrounding the steel reinforcement, leading to corrosion [5].
Irrespective of whether the primary mechanism is chloride or carbonation induced,
rebar corrosion is generally accompanied by the loss of cross section and the
accumulation of corrosion products, which occupy much larger volume than the
original steel. Hence, this process generates tensile stresses, which leads to cracking
3
and spalling of the concrete [3]. Rebar corrosion may not necessarily imply structural
collapse but it causes significant loss of structural serviceability.
A wide range of electro-chemical/non electro-chemical techniques and sensors based
techniques have been reported in the literature for the purpose of diagnosing and
quantification of the rebar corrosion. Table 1 summarises some of the techniques along
with their advantages and limitations [6]. Recently Miller [7] had described an inductive
sensor used to image steel reinforcement bars in concrete and visualise surface
corrosion. The present research uses the electro-mechanical impedance (EMI)
technique which has recently emerged as a promising tool for structural health
monitoring (SHM) and non-destructive evaluation (NDE) for a wide variety of
materials and structures. This technique works by comparing the sensor response in a
healthy (undamaged) structure to the response measured at a specific time point of
interest. Differences are then associated with chemical change, such as corrosion, or a
physical change such as cracking.
Talakokula et. al [6] recently proposed an EMI based approach for detecting and
measuring the level of chloride induced rebar corrosion, validated through accelerated
corrosion tests on embedded rebars. This paper focuses on extending the approach to
carbonation induced corrosion, which operates with a somewhat different mechanism
and report on studies involving accelerated carbonation tests carried out on cylindrical
specimens, spanning over 230 days of exposure. The corrosion assessment is based on
the mechanical impedance parameters determined from EMI signatures of a
piezoelectric lead zirconate titanate (PZT) ceramic patch bonded to the surface of the
rebar. The PZT based equivalent stiffness parameter (ESP) and equivalent mass
parameter (EMP) has been primarily employed for corrosion assessment. The results
4
are correlated with phenolphthalein stain test and high resolution microscopic images.
The following sections of the paper cover the physical principles of the EMI technique
followed by experimental results and analysis.
2. FUNDAMENTALS OF THE ELETRO-MECHANICAL IMPEDANCE (EMI)
TECHNIQUE
Piezoelectric materials are categorized as ‘smart’ materials owing to their ‘stimulus-
response’ behaviour, exhibited with reference to mechanical and electrical domains.
When subjected to mechanical stresses, a PZT patch develops surface charges, a
phenomenon called the ‘direct piezoelectric effect’. Similarly, when subjected to an
electric field, it undergoes mechanical strain, often referred to as the ‘converse
piezoelectric effect’. The direct and the converse effects are mathematically represented
by Eqs. (1) and (2) respectively [8]:
1313333 TdED T (1)
331
11 Ed
Y
TS
E (2)
where S1 is the strain along axis ‘1’, D3 the electric displacement over the surface of the
PZT patch, d31 the piezoelectric strain coefficient and T1 the axial stress in the patch
along axis ‘1’. It is assumed that the axis ‘3’ points along the thickness of the PZT patch
and the axes ‘1’ and ‘2’ lie in the plane of the patch as shown in Fig. 1 (a) and (b) for
a typical PZT patch. )1( jYY EE represents the Young’s modulus of the patch at
constant electric field and )1(3333 jTT is its electric permittivity at constant stress,
with and denoting the mechanical loss factor and the dielectric loss factor
respectively.
5
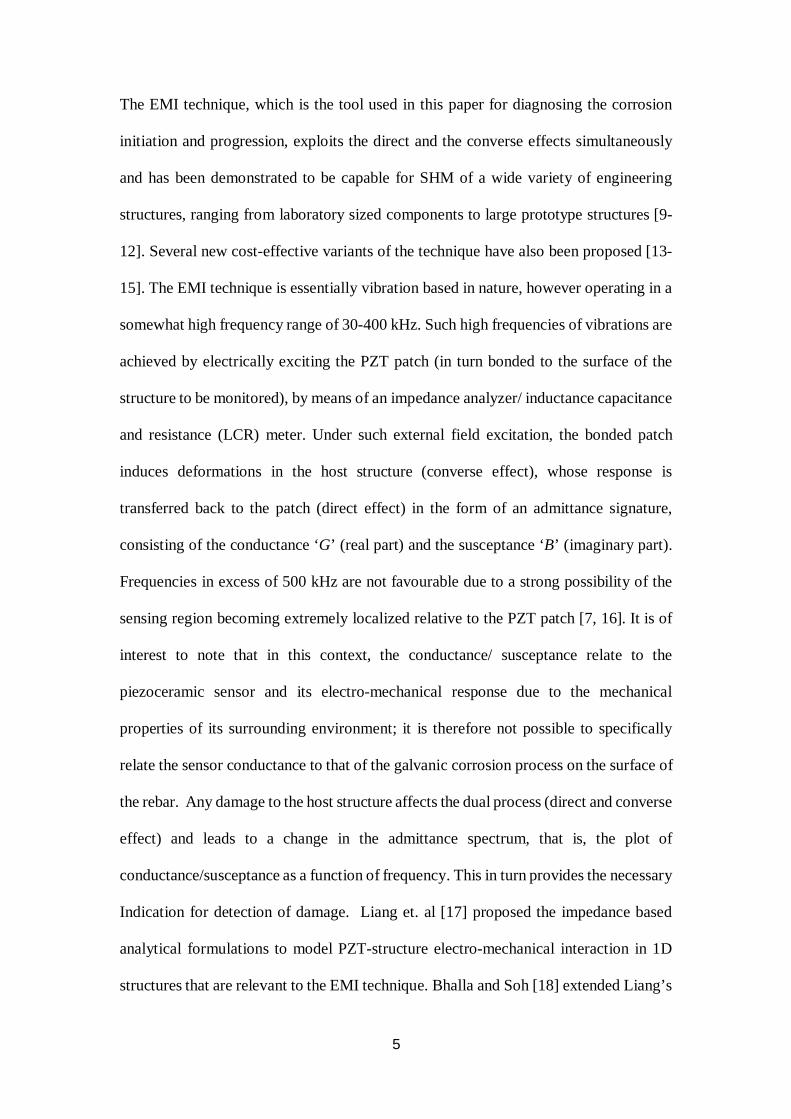
The EMI technique, which is the tool used in this paper for diagnosing the corrosion
initiation and progression, exploits the direct and the converse effects simultaneously
and has been demonstrated to be capable for SHM of a wide variety of engineering
structures, ranging from laboratory sized components to large prototype structures [9-
12]. Several new cost-effective variants of the technique have also been proposed [13-
15]. The EMI technique is essentially vibration based in nature, however operating in a
somewhat high frequency range of 30-400 kHz. Such high frequencies of vibrations are
achieved by electrically exciting the PZT patch (in turn bonded to the surface of the
structure to be monitored), by means of an impedance analyzer/ inductance capacitance
and resistance (LCR) meter. Under such external field excitation, the bonded patch
induces deformations in the host structure (converse effect), whose response is
transferred back to the patch (direct effect) in the form of an admittance signature,
consisting of the conductance ‘G’ (real part) and the susceptance ‘B’ (imaginary part).
Frequencies in excess of 500 kHz are not favourable due to a strong possibility of the
sensing region becoming extremely localized relative to the PZT patch [7, 16]. It is of
interest to note that in this context, the conductance/ susceptance relate to the
piezoceramic sensor and its electro-mechanical response due to the mechanical
properties of its surrounding environment; it is therefore not possible to specifically
relate the sensor conductance to that of the galvanic corrosion process on the surface of
the rebar. Any damage to the host structure affects the dual process (direct and converse
effect) and leads to a change in the admittance spectrum, that is, the plot of
conductance/susceptance as a function of frequency. This in turn provides the necessary
Indication for detection of damage. Liang et. al [17] proposed the impedance based
analytical formulations to model PZT-structure electro-mechanical interaction in 1D
structures that are relevant to the EMI technique. Bhalla and Soh [18] extended Liang’s
6
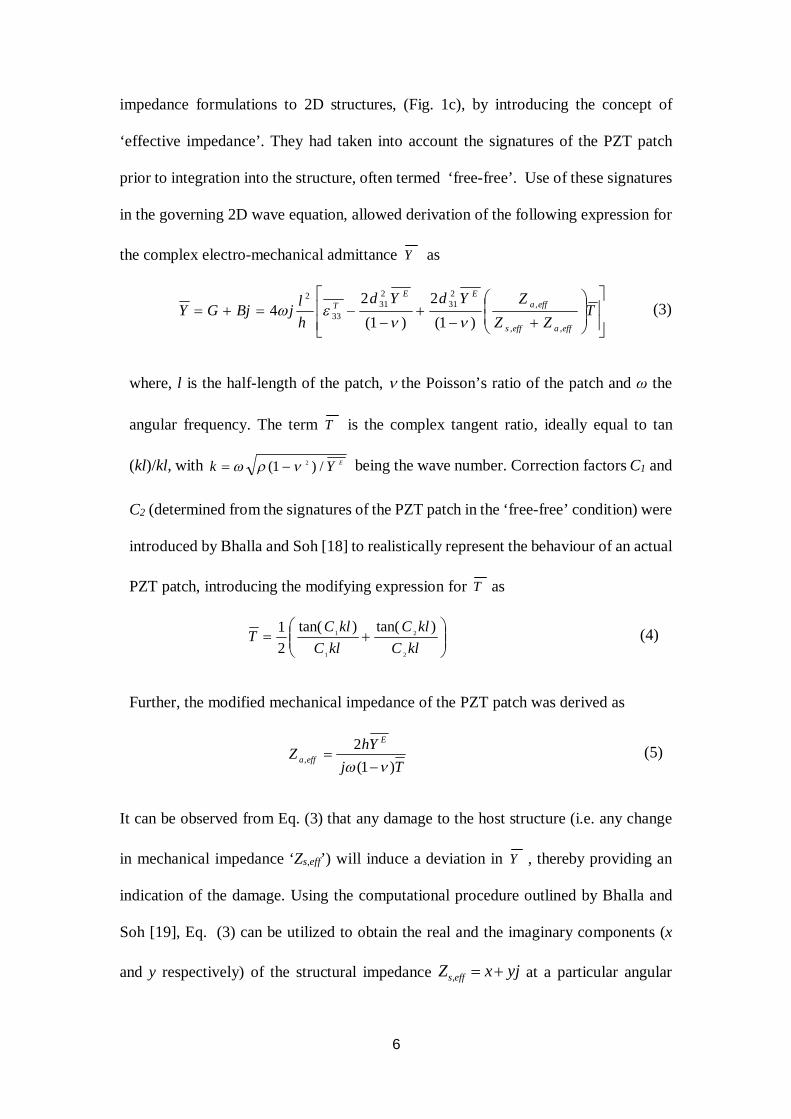
impedance formulations to 2D structures, (Fig. 1c), by introducing the concept of
‘effective impedance’. They had taken into account the signatures of the PZT patch
prior to integration into the structure, often termed ‘free-free’. Use of these signatures
in the governing 2D wave equation, allowed derivation of the following expression for
the complex electro-mechanical admittance Y as
T
ZZZYdYd
hljBjGY
effaeffs
effaEE
T
,,
,231
231
33
2
)1(2
)1(2
4
(3)
where, l is the half-length of the patch, the Poisson’s ratio of the patch and ω the
angular frequency. The term T is the complex tangent ratio, ideally equal to tan
(kl)/kl, with EYk /)1( 2 being the wave number. Correction factors C1 and
C2 (determined from the signatures of the PZT patch in the ‘free-free’ condition) were
introduced by Bhalla and Soh [18] to realistically represent the behaviour of an actual
PZT patch, introducing the modifying expression for T as
klCklC
klCklCT
2
2
1
1 )tan()tan(21 (4)
Further, the modified mechanical impedance of the PZT patch was derived as
TjYhZ
E
effa )1(2
, (5)
It can be observed from Eq. (3) that any damage to the host structure (i.e. any change
in mechanical impedance ‘Zs,eff’) will induce a deviation in Y , thereby providing an
indication of the damage. Using the computational procedure outlined by Bhalla and
Soh [19], Eq. (3) can be utilized to obtain the real and the imaginary components (x
and y respectively) of the structural impedance yjxZ effs , at a particular angular

7
frequency from the measured G and B values. Thus, bonding a PZT patch to a
structure and measuring its admittance signature enables the determination of the drive
point mechanical impedance of the structure, Zs,eff = x + yj, from the measured data
alone, without demanding any a priori information governing the phenomenological
nature of the structure. Depending upon the variation of ‘x’ and ‘y’ with frequency and
the associated values, the inherent elements constituting the host structure can be
identified [20]. Soh and Bhalla [11] and Bhalla et. al [12] found in their experiments
that the PZT patches identified the host structure as a Kelvin-Voigt system, consisting
of a parallel combination of spring and the damper elements. The stiffness element,
termed as the ESP, has been found to be related to the actual stiffness of the host
structure. Monitoring the ESP at different times provides an accurate condition of the
residual stiffness of the structure and can be employed for SHM.
The next sections describe the identification of structural system based on the values of
‘x’ and ‘y’ and utilization of the ESP for monitoring and quantifying the severity of the
structural damage induced by carbonation on rebars embedded in concrete.
3. ACCELERATED CARBONATION TESTS ON RC SPECIMENS:
EXPERIMENTAL PROCEDURE
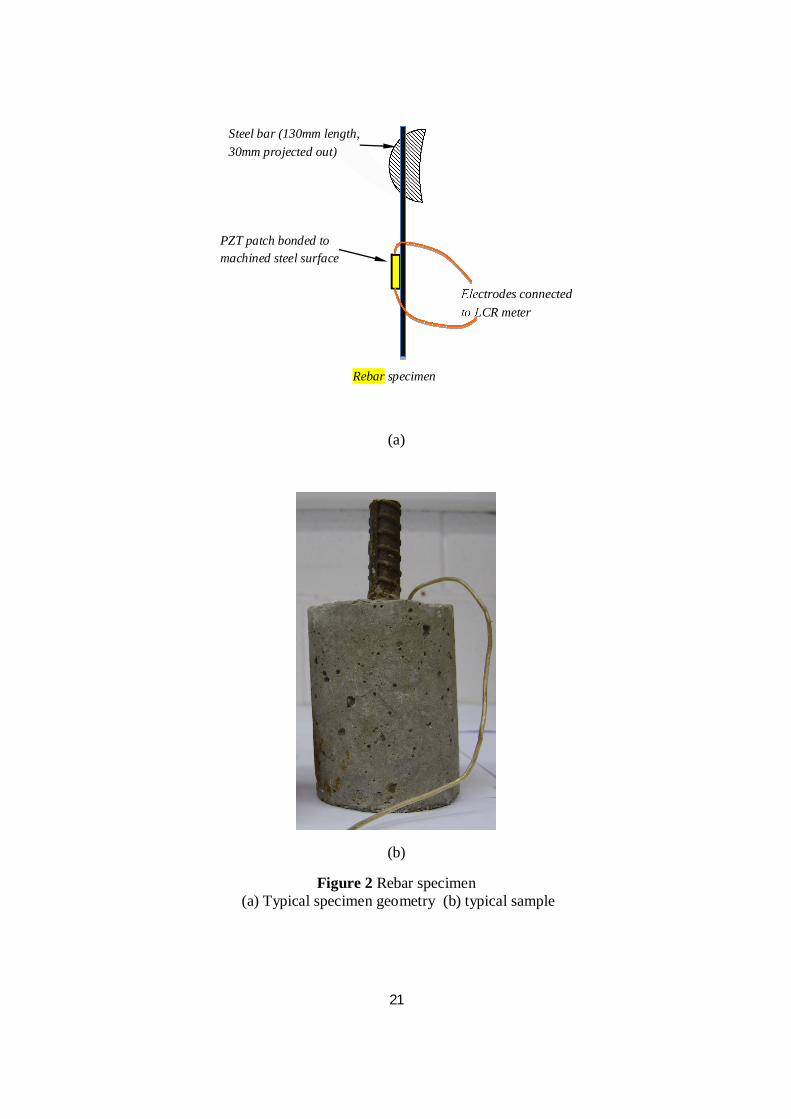
Four RC cylinders of grade M30 [21] were cast with diameters of 25, 35, 45 and 60 mm
respectively and length 100 mm, as described in Table 2. A single piece of 16 mm
diameter high yield deformed (HYD) steel rebar, grade Fe415 [22], was cast at the
centre of each cylinder. The rebar’s length was 130 mm, allowing 30 mm to project out
at one end of the cylinder, as shown in Fig. 2. The four different diameters provided
concrete cover depths of 4.5, 9.5, 14.5 and 22 mm respectively. Specimen number 1,
with a cover depth 22 mm, was employed as a reference for the purpose of monitoring

8
carbonation penetration depth through phenolphthalein staining. No PZT patch was
attached to the reference sample as this was to be used for destructive testing such as
for phenolphthalein test measurements to determine the carbonation depth and imaging
analysis. On the other samples, a PZT patch measuring 10×10×0.3 mm (Fig. 1a), of
ferroelectric grade PIC 151 [23] was bonded to each rebar at the mid length, where a
small flat surface was achieved through machining to allow for the bonding of the patch,
as shown in Fig. 2. A thin layer of epoxy was applied on the machined rebar surface
first and the PZT patch was placed on it; the whole set-up was then kept undisturbed at
room temperature for 24 h to enable full curing of the adhesive, after which wires were
soldered to the PZT patch’s electrodes. The PZT patch was then covered with an
additional thin layer of epoxy adhesive as a protective measure. The concrete
cylindrical specimens were cast using ordinary Portland cement (OPC) 53 Grade, fine
aggregate of Zone 1 grading [24] and crushed coarse aggregate of nominal size 10 mm.
Table 3 presents the details of the composition of the concrete mix. The moulds were
filled with concrete in three layers along with the rebar (with the PZT patch bonded on
it), taking particular care in pouring the concrete to avoid damage to the sensor. The
concrete was compacted carefully using a table vibrator. For the 25 mm diameter
specimen, it was necessary to remove some of the larger pieces of the aggregate from
the mortar at the time of casting to accommodate the thin concrete cover of 4.5 mm.
The specimens were demoulded after 24 h of casting. The soldered electrodes of the
PZT patch were connected to an LCR meter (Agilent E4980 [25]). In this manner, the
electro mechanical admittance signature, consisting of the real part (G) and the
imaginary part (B) were acquired in the frequency range of 50-400 kHz. A frequency
interval of 100 Hz was used for each impedance measurement.

9
Compared to chloride-induced corrosion, carbonation is a slower process. In high-
quality concrete, it has been estimated that carbonation will proceed at a rate of not
more than 1.0 mm per year [26]. The carbonation rate is significantly increased in
concrete with a high water-cement ratio (more than specified by IS 10262, 2009 [27]),
low cement content, short curing period, lower strength, and highly permeable or
porous paste. In addition, the carbonation rate is highly dependent on the relative
humidity of the concrete. The highest rates of carbonation occur when the relative
humidity ranges between 50 % and 75 %. Carbonation-induced corrosion typically
occurs on areas of building facades that are exposed to rainfall, shaded from sunlight,
and have smaller concrete cover over the reinforcing steel [27]. Since the carbonation
process is too slow under natural conditions, accelerated carbonation is preferred in the
laboratory investigations since the 1960’s [28]. In the present study, the accelerated
corrosion experiments were initiated after a period of 28 days from the day of casting,
assuming that any further concrete strength gain on account of concrete curing is
negligible.
After the baseline signatures were acquired, the specimens were placed in a carbonation
chamber. The CO2 concentration in the chamber was maintained at 5 % under a relative
humidity of 75±5 % and temperature of 25°C. Studies of the chemical changes and
phase analysis of Portland cement pastes under conditions of accelerated carbonation
in excess of 3 % (CO2 concentration) have been conducted by Castellote and colleagues
[29]. They demonstrated that, where CO2 concentrations were in excess of 3 %,
microstructural changes were observed compared to ambient conditons . This should
be considered when translating results from this study to systems carbonating under
ambient conditions. Wax was applied to the circular ends of each cylindrical samples
to allow CO2 ingress radially from the sides only. During the accelerated carbonation

10
exposure, the admittance signatures were acquired at frequent intervals throughout the
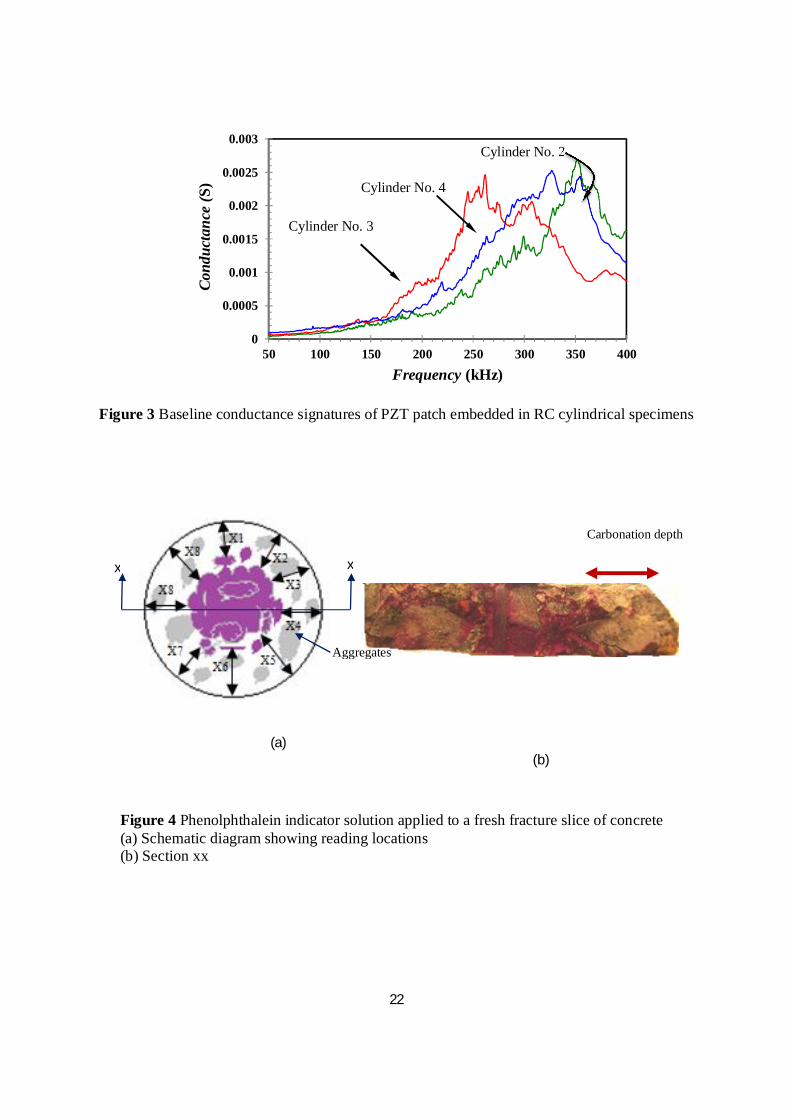
experimental exposure period of 230 days. In order to measure the carbonation
penetration depth, a 50 mm thick slice was cut from the bottom of the reference
specimen , as shown in Fig. 4 and the fracture surface was sprayed with a saturated
solution of phenolphthalein indicator in ethanol. The slicing was done on the same face
in dry conditions. However, the ends were covered immediately with wax after cutting,
so that any CO2 ingress or diffusion of moisture takes place only radially. Maximum
and minimum depth of carbonation was measured and numerically averaged. During
the exposure period, the carbonation penetration depth was periodically measured using
the phenolphthalein method by cutting fresh slices from the reference specimen.
At high pH (uncarbonated), the indicator has a bright pink colour. However, below a
pH of 8.6 (carbonated condition), it becomes colourless. The interface between the pink
and the colourless regions indicates the carbonation front. Maximum and minimum
penetration depths were measured and numerically averaged. During the investigation,
the carbonation penetration depth was periodically measured. Depths of 2.5, 12 and 15
mm were observed at 15, 30 and 40 days respectively. The low values of carbonation
depth observed during the initial days may be attributed to the initial high moisture
content in the specimens. Based on the concrete covers described previously (see table
2), it is estimated that the carbonation front reached the rebar after 18, 26 and 39 days
for specimens 2, 3 and 4 respectively. The numbers of days has been calculated
assuming that carbonation follows a square root time law. The next section correlates
these observations (which are made through destructive tests) with ESP obtained non-
destructively via the EMI technique.
The baseline signatures of the specimens were first acquired as reference prior to
placing in the carbonation chamber. Fig. 3 shows the baseline conductance spectrum of

11
the PZT patches of three specimens, acquired after 28 days of curing, before being
subjected to accelerated carbonation. Even though the initial baseline signatures of the
specimens are different, when applying the EMI technique it is the variation of the
signature of interest with the baseline signature that is important as it is used here to
deduce changes in the specimen.
4. CHANGES IN IMPEDANCE BASED EQUIVALENT PARAMETERS
DURING CARBONATION
Fig. 4 (a, b and c) show the conductance signatures of the bonded PZT patches for the
three test specimens (Nos. 2, 3 and 4) acquired during various times. It is worth noting
that all the specimens were 28 days old before the initiation of the experiment and hence
the majority of the hydration process was already completed. The figures show that the
resonance peaks of the conductance signature have changed its magnitude and
frequency for all the three specimens with increasing carbonation.
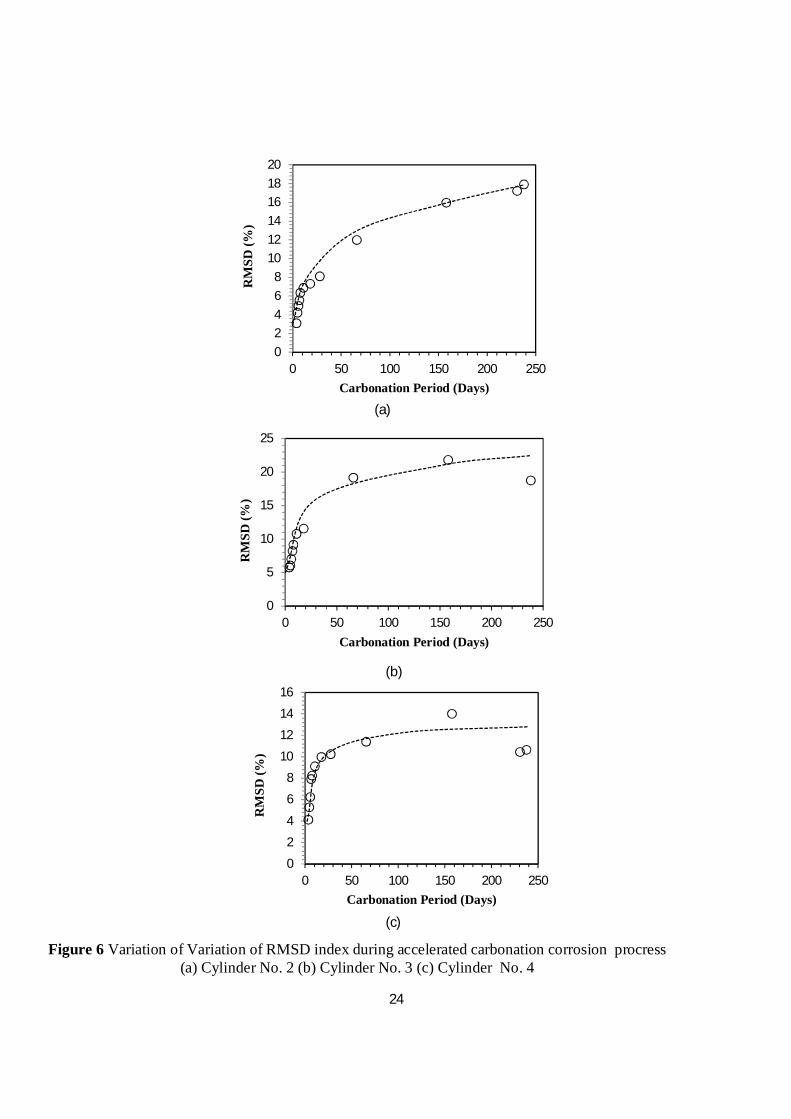
To quantify damage, at first crudely, root mean square deviation (RMSD) metric was
utilized, which is defined as [12]
100
1
20
1
20
N
i
N
ii
G
GGRMSD
where Gi is the conductance of the PZT patch at any stage during the test and Gi0 is the
baseline value (in pristine condition), i representing the frequency index (100 to 400
kHz). Fig. 5 (a, b and c) shows the variation of the RMSD index of the three specimens
against the exposure period. The RMSD values increased during the exposure period,
which provides a useful indicator that the PZT sensors are sensitive enough to identify
(6)

12
changes in the system. This is not always the case, as previous studies on other systems
such as reinforced concrete structures and steel bolted joints [6, 12] RMSD sometimes
exhibit a random response, hence under these conditions the RMSD approach is
unreliable. RMSD is a non parameter based statistical index to quantify the changes in
the signature acquired by the PZT patch. Previous studies by the authors (Talakokula
et. al. [6]; Bhalla et. al. [12]) have confirmed that it is suitable for preliminary analysis
not very reliable for in depth analysis. It just provides the deviation of the raw signature
with respect to the baseline, thereby not directly linking to any structure related
parameter
4.1 Equivalent stiffness parameters (ESP)
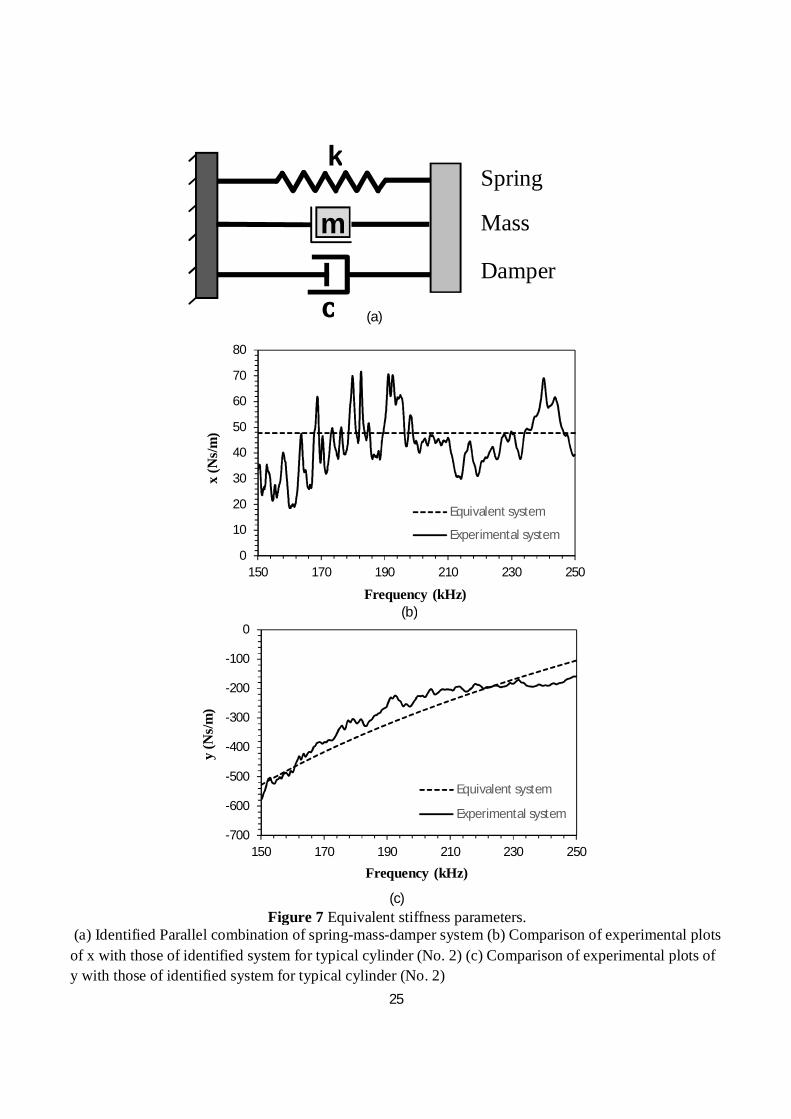
To gain deeper insight into the corrosion mechanism, Equivalent structural parameters
were extracted from the impedance spectrum using the computational procedure
outlined by Bhalla and Soh [19]. The extracted mechanical impedance 푍 , consists
of the real and imaginary components x and y respectively. Observing the variation of
x and y closely in the frequency range of 150-250 kHz revealed that the variation is
similar to the variation of x and y of a parallel spring-damper-mass (k-c-m) combination
[20] as shown in Fig. 6 (a). For this system,
cx and
kmy
Where 푐 is the equivalent damping parameter, k equivalent stiffness parameter (ESP),
m equivalent mass parameter (EMP) and is the angular frequency. The variation of
‘x’ and’y’ for both equivalent system (parallel spring-damper-mass) and that of the
experimental is shown in Fig. 6 (b and c) for a typical specimen (no.2), confirming the
(7)
13
observation that the host structure has been identified as a parallel spring-damper-mass
system.
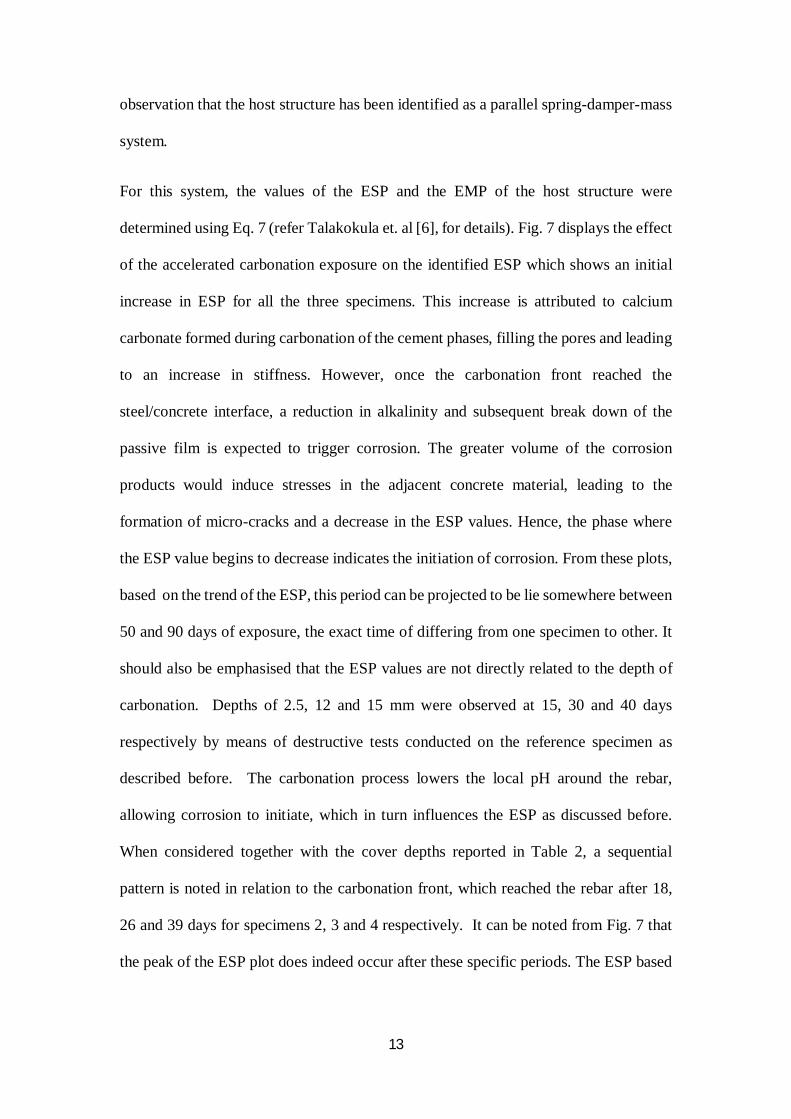
For this system, the values of the ESP and the EMP of the host structure were
determined using Eq. 7 (refer Talakokula et. al [6], for details). Fig. 7 displays the effect
of the accelerated carbonation exposure on the identified ESP which shows an initial
increase in ESP for all the three specimens. This increase is attributed to calcium
carbonate formed during carbonation of the cement phases, filling the pores and leading
to an increase in stiffness. However, once the carbonation front reached the
steel/concrete interface, a reduction in alkalinity and subsequent break down of the
passive film is expected to trigger corrosion. The greater volume of the corrosion
products would induce stresses in the adjacent concrete material, leading to the
formation of micro-cracks and a decrease in the ESP values. Hence, the phase where
the ESP value begins to decrease indicates the initiation of corrosion. From these plots,
based on the trend of the ESP, this period can be projected to be lie somewhere between
50 and 90 days of exposure, the exact time of differing from one specimen to other. It
should also be emphasised that the ESP values are not directly related to the depth of
carbonation. Depths of 2.5, 12 and 15 mm were observed at 15, 30 and 40 days
respectively by means of destructive tests conducted on the reference specimen as
described before. The carbonation process lowers the local pH around the rebar,
allowing corrosion to initiate, which in turn influences the ESP as discussed before.
When considered together with the cover depths reported in Table 2, a sequential
pattern is noted in relation to the carbonation front, which reached the rebar after 18,
26 and 39 days for specimens 2, 3 and 4 respectively. It can be noted from Fig. 7 that
the peak of the ESP plot does indeed occur after these specific periods. The ESP based
14
diagnosis clearly proves its leverage over the conventional statistical diagnostics such
as RMSD as covered before.
In addition, the non-dimensional stiffness loss (∆k/k) was determined to quantify the
level of corrosion damage on account of carbonation. Fig. 8 (a, b and c) shows the
variation of (∆k/k) with the exposure period for the three test specimens. From the
figures, it can be observed that for smaller diameter specimen (No. 2), the downward
trend of the curve started when the ∆k/k value reached 0.45. As the diameter of the
specimens increased (Nos. 3 and 4), thereby increasing the cover to steel, it is noted
that the peak ∆k/k values are lower at 0.4 and 0.3 respectively. Further, relative to the
peak value of the ESP, the decrease in the ∆k/k values of specimens 2, 3 and 4 are found
to be 0.3, 0.2 and 0.28 respectively. Based on the empirical equivalent stiffness model
of Talakokula et. al [6], the corrosion process can be identified to be in the
“propagation” phase for these values of ∆k/k .
4.2. EQUIVALENT MASS PARAMETER (EMP)
The initial mass of all the rebars were measured before embedding them in concrete
and after splitting all the specimens, the final mass loss of the steel bars was determined
by the gravimetric method after chemically cleaning the corrosion products. The EMP
was also calculated directly using Eq. (7) after mathematical calculations (refer
Talakokula et. al [6], for details) during the carbonation corrosion exposure, without
any destructive measure.
Knowing the actual mass and the PZT identified EMP, a non-dimensional mass model
is derived as
∆ = Λ ∆ (8)

15
Where 훬 is a constant relating PZT identified EMP with actual mass loss determined
as 0.54 [6]. This correlation will be useful in calculating the corrosion rates of the rebar
non-destructively, because measuring the actual mass loss in real life structures is not
possible as rebar is inside the concrete.
4.3. VALIDATION OF NON-DIMENSIONAL MASS MODEL
Knowing the mass loss, the corrosion rate is calculated as described in ASTM G1-03
[32] using the equation
DTa
mkc
(9)
where ∆ is the corrosion rate (mm/year) K is a constant equal to 8.76x10⁴, ∆푚 is the
mass loss in g, a the area in cm2, T time of corrosion exposure in hours and D is the
density of steel i.e.7.8 kg/m3. The corrosion rates were calculated using both actual
mass loss as well as the non-dimension mass model Eq. (8) and are tabulated in Table.4.
Upon comparing both, it was found that using the model developed, the corrosion rates
can be calculated with reasonable accuracy (average error of 10 % only). This is a very
important observation, which establishes that the application of the proposed
methodology enables circumventing the determination of actual mass loss, which in
practice is infeasible.
5. CORRELATION WITH MICROSCOPIC IMAGE ANALYSIS AND RAMAN
ANALYSIS
To verify the nature of changes highlighted by the ESP, conventionally available
experimental techniques including optical microscopy, scanning electron microscopy
(SEM) and Raman spectroscopy were applied to representative cross sections of the
specimens. The sections were cut during the exposure period for performing these
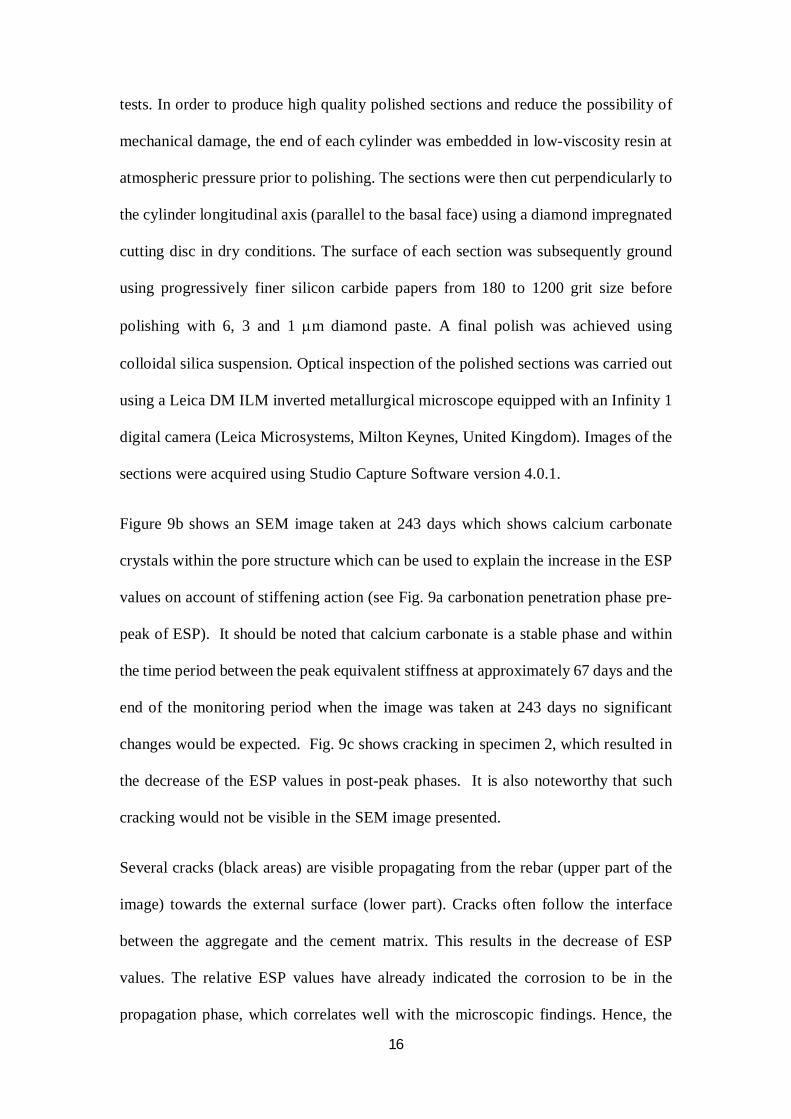
16
tests. In order to produce high quality polished sections and reduce the possibility of
mechanical damage, the end of each cylinder was embedded in low-viscosity resin at
atmospheric pressure prior to polishing. The sections were then cut perpendicularly to
the cylinder longitudinal axis (parallel to the basal face) using a diamond impregnated
cutting disc in dry conditions. The surface of each section was subsequently ground
using progressively finer silicon carbide papers from 180 to 1200 grit size before
polishing with 6, 3 and 1 m diamond paste. A final polish was achieved using
colloidal silica suspension. Optical inspection of the polished sections was carried out
using a Leica DM ILM inverted metallurgical microscope equipped with an Infinity 1
digital camera (Leica Microsystems, Milton Keynes, United Kingdom). Images of the
sections were acquired using Studio Capture Software version 4.0.1.
Figure 9b shows an SEM image taken at 243 days which shows calcium carbonate
crystals within the pore structure which can be used to explain the increase in the ESP
values on account of stiffening action (see Fig. 9a carbonation penetration phase pre-
peak of ESP). It should be noted that calcium carbonate is a stable phase and within
the time period between the peak equivalent stiffness at approximately 67 days and the
end of the monitoring period when the image was taken at 243 days no significant
changes would be expected. Fig. 9c shows cracking in specimen 2, which resulted in
the decrease of the ESP values in post-peak phases. It is also noteworthy that such
cracking would not be visible in the SEM image presented.
Several cracks (black areas) are visible propagating from the rebar (upper part of the
image) towards the external surface (lower part). Cracks often follow the interface
between the aggregate and the cement matrix. This results in the decrease of ESP
values. The relative ESP values have already indicated the corrosion to be in the
propagation phase, which correlates well with the microscopic findings. Hence, the

17
ESP provides a strong indication of the changes occurring during the carbonation
process.
To verify the nature of the oxides formed on the rebar surface (which, through
expansion led to the formation of the cracks identified during with the optical
microscope), analysis was performed using Raman spectroscopy of the metal phase
located at the cement/ rebar interface. A Renishaw inVia Raman Spectrometer with a
laser of wavelength 532 nm (green visible light) was used. The laser was set at 100%
of the power; and scans were performed between 100 and 3200 cm-1 with only one
accumulation and an exposure time of 10 seconds. A WiRE software version 3.4
developed by Renishaw plc, New Mills, Wotton-under-Edge, Gloucestershire, United
Kingdom, was used to set the experiment and acquire the spectra.
Fig. 10 shows one of these spectra with the corresponding location along the interface
highlighted by a red dot in the box (upper right corner). Peaks in the spectrum are
located at 220, 278, 390, 486, 582, 804, 1058, 1280 cm-1. Data reported in the scientific
literature by Oh et. al [30] attributed the peaks at 220, 278 and 1280 cm-1 to hematite
α-Fe2O3. It is already known, in fact, that depending on the crystallinity and grain size,
the characteristic double at 294/225 cm-1 of this mineral in some cases shifts downward
in wave number [30]. Peaks at 390, 486 and 582 cm-1 are attributed to goethite α-
FeOOH [31]. Both these phases are common in the corrosion products associated with
rebar corrosion.
7. CONCLUSIONS
This paper has presented a new approach for monitoring the progression of carbonation
and the coupled rebar corrosion in RC structures based on the ESP and EMP parameters
extracted from the admittance signatures of PZT patches surface-bonded to the rebars.
18
This is the first ever study involving PZT sensors and utilizing the EMI technique to
diagnose carbonation induced corrosion initiation and progression. The main objective
was proof-of-concept demonstration of the ESP and EMP based rebar carbonation
initiation, progression and quantification. A total of four specimens were tested, all of
which showed consistent results, commensurate with the individual cover thickness.
The ESP extracted from the admittance signatures of surface-bonded PZT patches is
established as a reliable carbonation progression as well as rebar corrosion indicator.
ESP correlates well with the microscopic image analysis. The average rate of corrosion
has been determined using EMP and compared with the actual corrosion rates using
gravimetric mass loss measurements, the error has been found to be 10 % only. The
most promising feature of the proposed approach is that the two main phases in the
process, namely carbonation penetration through concrete cover and corrosion
initiation are determined. The significance of the proposed approach is that it is non-
destructive in nature, simple and fully autonomous. The empirical correlation derived
from the PZT patches can be utilized in carbonation induced corrosion of rebars in real-
life RC structures, where they are not exposed for direct visual check.
REFERNCES
[1] M. Moreno, W. Morrism, W, M. G. Alvarez and G. S. Duffo, Corrosion of
reinforcing steel in simulated concrete pore solutions: Effect of carbonation and
chloride content, Corros Sci, 42(11) (2004), 2681-2699.
[2] J. P. Broomfield, J. P, Corrosion of Steel in Concrete, Understanding,
Investigation and Repair, Second ed., Taylor and Francis, (2007).

19
[3] H. A. F. Dehwah, M. Maslehuddin and S. A. Austin, Long-Term Effect Of
Sulphate Ions And Associated Cation Type On Chloride Induced Reinforcement
Corrosion In Portland Cement Concretes, Cem. Concr. Compos, 24 (2002), 17-25.
[4] P. Claisse, H. Elsayad and E. Ganjian, Permeability and Pore Volume of
Carbonated concrete” European concerted action, Final report, Brussels, 1997.
[5] L. J. Parrott, A review of carbonation in reinforced concrete, British Cement
Association, contract report for the Building Research Establishment, C/I-0987,
1987.
[6] V. Talakokula, S. Bhalla and A. Gupta, (2014) “Corrosion Assessment of
Reinforced Concrete Structures Based on Equivalent Parameters Using Electro-
Mechanical Impedance Technique”, J Intel Mat Syst Str, Volume 25 (4), pp 484-
500.
[7] G. Miller, P. Gaydecki, S. Quek, B. Fernandes and M. Zaid, A combined Q and
heterodyne sensor incorporating real-time DSP for
reinforcement imaging,corrosion detection and material characterisation,
Sensor Actuat A-Phys, 121 (2) (2005), 339-346.
[8] T. Ikeda, Fundamentals of Piezoelectricity, Oxford University Press, Oxford
1990.
[9] W. Li, Y. Cho, Quantification and imaging of corrosion wall
thinning using shear horizontal guided waves generated by magnetostrictive
sensors, Sensor Actuat A-Phys, 232 (2015), 251-258.
[10] C. K. Soh, K. K. H. Tseng, S. Bhalla, S. and A. Gupta, Performance of Smart
Piezoceramic Patches in Health Monitoring of a RC Bridge, Smart Mater. Struct.,
9(4) (2000), 533-542.

20
[11] C. K. Soh and S. Bhalla, Calibration of Piezo-impedance Transducers for
Strength Prediction and Damage Assessment of Concrete, Smart Mater. Struct., 14
(2005), 671-684.
[12] S. Bhalla, A. P. R. Vittal, and M. Veljkovic, Piezo-Impedance Transducers for
residual Fatigue Life Assessment of Bolted Steel Joints, Struct. Health Monit.,
11(6) (2012), 733-750.
[13] D. M. Peairs, G. Park and D. J. Inman, Improving accessibility of the
Impedance-Based Structural Health Monitoring Method, J Intel Mat Syst Str, 15 (2)
(2004), 129-139.
[14] T. G. Overly, G. Park, K. M. Farinholt and C. R. Farrar, Development of an
extremely compact impedance-based wireless sensing device”, Smart Mater.
Struct, 17(6) (2008), 065011.
[15] S. Bhalla, A. Gupta, S. Bansal, S. and A. Garg, A , Ultra Low Cost Adaptation
of Electro-mechanical Impedance for Structural health Monitoring”, J Intel Mat
Syst Str, 20 (2009), 991-999.
[16] V. Giurgiutiu and A. N. Zagrai, Embedded Self-Sensing Piezoelectric Active
Sensors for On-Line Structural Identification, J Vib Acoust, ASME, 124 (2002),
116-125.
[17] C. Liang, F. P. Sun and C. A. Rogers, Coupled Electro-Mechanical Analysis
of Adaptive Material Systems- Determination of the Actuator Power Consumption
and System Energy Transfer”, J Intel Mat Syst Str, 5 (1994), 12-20.
[18] S. Bhalla and C. K. Soh, Structural Health Monitoring by Piezo-Impedance
Transducer: Modelling, J. Aerospace Eng, ASCE, 17(4) (2004a), 154-165.
[19] S. Bhalla, C. K. Soh, C. K, Structural Health Monitoring by Piezo-Impedance
Transducer: Application, J. Aerospace Eng, ASCE, 17(4) (2004b),, 166-171.

21
[20] E. L. Hixon, Mechanical Impedance Shock and Vibration Handbook, edited
by C. M. Harris, 3rd edition, Mc Graw Hill Book Co, New York, 1988.
[21]IS 456, Indian Standard plain and reinforced concrete, code of practice. Bureau
of Indian Standards, New Delhi, India, 2000.
[22] IS 1786, Indian Standard Specification for High Strength Deformed Steel Bars
and Wires for Concrete Reinforcement, Bureau of Indian Standards, New Delhi,
1985.
[23] PI Ceramic, Product information catalogue”, Lindenstrabe, Germany,
www.piceramic.de, 2012.
[24] IS 383, Indian Standard specification for coarse and fine aggregates from
natural sources for concrete, Bureau of Indian Standards, New Delhi, India, 1970.
[25] Agilent Technologies, Test and measurement catalogue, (2011),
www.agilent.com.
[26] Jana, D. and Erlin, B., “Carbonation as an Indicator of Crack Age”, ACI
Concrete International, May 2007, pp. 61-64.
[27] IS: 10262-2009 Indian Standard Specification for Concrete Mix Proportions:
Guidelines, Bureau of Indian Standards, New Delhi, 2009.
[28] C. L. Page, Basic Principles of Corrosion” Schiessl P. (editor), Corrosion of
steel in concrete, Chapman and Hall, London, 1988.
[29] M. L. Castellote, C. Fernandez, C. Andrade and Alonso, Chemical changes and
phase analysis of OPC pastes carbonated at different CO2 concentrations. Mater.
Struct., 42 (2009), 515-525.
[30] S. J. Oh, D. C. Cook and H. E. Townsend, Characterization of Iron Oxides
Commonly Formed as Corrosion Products on Steel, Hyperfine Interact, 112 (1998),
59-66
22
[31] A. Wang, L. A. Haskin and B. L. Jolliff, B.L, Characterization of Mineral
Products of Oxidation and Hydration by Laser Raman Spectroscopy - Implications
for In Situ Petrologic Investigation on the Surface of Mars, in: Lunar and Planetary
Institute Science Conference Abstracts, 29 (1998), 1819.
[32] ASTM G I -03. Standard Practice for Preparing, Cleaning and Evaluating
Corrosion Test Specimens, (2003). West Conshohocken, PA

20
(c)
Figure 1 PZT patch and its interaction with host structure. (a) Geometric details of a typical PZT patch (b) Modelling scheme of PZT-structure interaction 1D (c) A PZT patch bonded to the host structure 2D
(a)
(b)
21
(a)
(b)
Figure 2 Rebar specimen (a) Typical specimen geometry (b) typical sample
Rebar specimen
Steel bar (130mm length, 30mm projected out)
PZT patch bonded to machined steel surface
Electrodes connected to LCR meter
22
Figure 3 Baseline conductance signatures of PZT patch embedded in RC cylindrical specimens
Figure 4 Phenolphthalein indicator solution applied to a fresh fracture slice of concrete (a) Schematic diagram showing reading locations (b) Section xx
0
0.0005
0.001
0.0015
0.002
0.0025
0.003
50 100 150 200 250 300 350 400
Cond
ucta
nce
(S)
Frequency (kHz)
Cylinder No. 4
Cylinder No. 3
Cylinder No. 2
(b) (a)
x x
Aggregates
Carbonation depth

23
0.0005
0.001
0.0015
0.002
0.0025
0.003
200 250 300 350 400
Cond
ucta
nce
(S)
Frequency (kHz)
0.0005
0.001
0.0015
0.002
0.0025
200 250 300 350 400
Cond
ucta
nce
(S)
Frequency (kHz)
0.0005
0.001
0.0015
0.002
0.0025
200 250 300 350 400
Cond
ucta
nce
(S)
Frequency (kHz)
(c)
Figure 5 Variation of conductance signatures during accelerated carbonation corrosion procress (a) Cylinder No. 2 (b) Cylinder No. 3 (c) Cylinder No. 4
(b)
(a)
Baseline
Day 66
Day 230
Baseline
Day 230
Day 66
Day 230
Day 66
Baseline
24
02468
101214161820
0 50 100 150 200 250
RM
SD (%
)
Carbonation Period (Days)
0
5
10
15
20
25
0 50 100 150 200 250
RM
SD (%
)
Carbonation Period (Days)
0
2
4
6
8
10
12
14
16
0 50 100 150 200 250
RM
SD (%
)
Carbonation Period (Days)
Figure 6 Variation of Variation of RMSD index during accelerated carbonation corrosion procress (a) Cylinder No. 2 (b) Cylinder No. 3 (c) Cylinder No. 4
(a)
(b)
(c)
25
0
10
20
30
40
50
60
70
80
150 170 190 210 230 250
Equivalent system
Experimental system
x (N
s/m
)
Frequency (kHz)
-700
-600
-500
-400
-300
-200
-100
0
150 170 190 210 230 250
Equivalent system
Experimental system
Frequency (kHz)
y (N
s/m
)
k
c
m
Spring
Mass Damper
(a)
(b)
(c) Figure 7 Equivalent stiffness parameters.
(a) Identified Parallel combination of spring-mass-damper system (b) Comparison of experimental plots of x with those of identified system for typical cylinder (No. 2) (c) Comparison of experimental plots of y with those of identified system for typical cylinder (No. 2)

26
0
50
100
150
200
250
300
350
0 50 100 150 200 250
Equi
vale
nt st
iffne
ss (k
Ns/m
)
Carbonation Period (Days)
Corrosion initiation period
0
50
100
150
200
250
300
350
0 50 100 150 200 250
Equi
vale
nt st
iffne
ss (k
Ns/m
)
Carbonation Period (Days)
Corrosion initiation period
0
50
100
150
200
250
300
350
0 50 100 150 200 250
Equi
vale
nt st
iffne
ss (k
Ns/m
)
Carbonation Period (Days)
Corrosion initiation period
Figure 8 Variation of equivalent stiffness during accelerated carbonation corrosion process (a) Cylinder No. 2 (b) Cylinder No. 3 (c) Cylinder No. 4
(c)
(b)
(a)

27
0
0.1
0.2
0.3
0.4
0.5
0.6
0 50 100 150 200 250
∆k/k
(%)
Duration (days)
III
I. Carbonation penetration phase
II. Corrosion initiation phase
0
0.1
0.2
0.3
0.4
0.5
0.6
0 50 100 150 200 250
∆k/k
(%)
Duration (days)
III
I. Carbonation penetration phase
II. Corrosion initiation phase
0
0.1
0.2
0.3
0.4
0 50 100 150 200 250
∆k/k
(%)
Duration (days)
III
I. Carbonation penetration phase
II. Corrosion initiation phase
(a)
(b)
(c)
Figure 9 Variation of ∆k/k during accelerated corrosion procress (a) Cylinder No. 2 (b) Cylinder No. 3 (c) Cylinder No. 4

28
(b) (c)
Figure 10 Correlation of ESP values with SEM and optical images. (a) ESP values for carbon penetration phase (Region I) and corrosion initiation/cracking phase (Region II). (b) high magnification secondary electron image (scale bar 10μm) corresponding to a typical internal crack microstructure at
243 days (c) low magnification optical image (scale bar 300μm) of a polished section between the rebar (top) and sample edge (bottom) at 243 days.
0
50
100
150
200
250
300
350
0 50 100 150 200 250
Equi
vale
nt st
iffne
ss (k
Ns/m
)
Carbonation Period (Days)
(I)
(a)
(II)
I. Carbonation penetration phase
II. Corrosion Initiation phase

29
Figure 11 Raman spectrum of α-hematite (Fe2O3) oxide layer on steel rebar extracted from sample 2 at 243 days. Inset shows optical image of polished section and location of analysis. Cement matrix
shown in top right hand side dark area and steel re bar shown in light bottom left hand side.

30
Table 1. Comparison of various corrosion detection techniques [6]
Detection technique
Advantage Disadvantage
Half-cell potential measurements
Common procedure for routine inspection of RC structures
Simple and cost-effective
Provides only information on probability of corrosion, cannot indicate corrosion rates.
Values can be misleading Only a first approach to corrosion
detection and must be complimented
by other techniques for corrosion rates
Requires the knowledge of potential in non-corroded areas
Polarization resistance technique
Provides a measurement of the corrosion rate
An instantaneous measuring system.
In most cases, e.g., when the cover concrete is too thick, the confinement of the polarization area may not be achieved.
Gravimetric mass loss measurements
Most effective method for calculating corrosion rates
Destructive method Requires the knowledge of the mass
of rebar in healthy state
EMI technique
The assessment is Non-destructive in nature
Detection is based on the structural response.
Equivalent structural parameters can be extracted thus circumventing the determination of actual parameters
Reduces required sensors by allowing self-sensing actuation
Sensitive and changes to damage induced due to carbonation corrosion
Maintaining sensor health and bonding is important.
Requires knowledge of a healthy structure.
31
Table 2. Specimen identification number, dimensions and cover to reinforcement
Table 3. Concrete mix design specification
Materials Quantity
Water cement ratio 0.4
OPC (kg/m3) 500
Fine aggregate (kg/m3) 570.5
Coarse aggregate (kg/m3) 10mm 1062.2
Slump (mm) 100
Table 4 Comparison of corrosion rates for specimens Nos. 2, 3 and 4 determined from gravimetric mass loss and PZT identified mass loss.
Specimen Actual corrosion rates using gravimetric mass
loss (mm/year)
Corrosion rates using PZT identified mass loss after
incorporating 횲퐦 (mm/year)
Percentage error
2 0.059 0.067 13.5
3 0.048 0.052 8.3
4 0.012 0.013 8.3
Specimen Specimen size (mm) Cover to reinforcement (mm)
1 60 x 100 (Reference specimen)
22
2 25 x 100 4.5
3 35 x 100 9.5
4 45 x 100 14.5


![Carbonation PH-Final-Meheen [Read-Only] · PDF fileI. The Basics of Carbonation - Dave Meheen, President, Meheen Manufacturing II. Principles of Natural Carbonation Marty Velas, Director](https://static.fdocuments.us/doc/165x107/5a6fa97c7f8b9a9d538b49c7/carbonation-ph-final-meheen-read-only-nbsppdf-filei-the-basics-of.jpg)