Diabetes Update: Diabetes Management in Primary Care · PDF file1 Diabetes Update: Diabetes...
13
1 Diabetes Update: Diabetes Management in Primary Care Jeffrey Unger, MD, FAAFP, FACE ACTIVITY DISCLAIMER The material presented here is being made available by the American Academy of Family Physicians for educational purposes only. Please note that medical information is constantly changing; the information contained in this activity was accurate at the time of publication. This material is not intended to represent the only, nor necessarily best, methods or procedures appropriate for the medical situations discussed. Rather, it is intended to present an approach, view, statement, or opinion of the faculty, which may be helpful to others who face similar situations. The AAFP disclaims any and all liability for injury or other damages resulting to any individual using this material and for all claims that might arise out of the use of the techniques demonstrated therein by such individuals, whether these claims shall be asserted by a physician or any other person. Physicians may care to check specific details such as drug doses and contraindications, etc., in standard sources prior to clinical application. This material might contain recommendations/guidelines developed by other organizations. Please note that although these guidelines might be included, this does not necessarily imply the endorsement by the AAFP. DISCLOSURE It is the policy of the AAFP that all individuals in a position to control content disclose any relationships with commercial interests upon nomination/invitation of participation. Disclosure documents are reviewed for potential conflict of interest (COI), and if identified, conflicts are resolved prior to confirmation of participation. Only those participants who had no conflict of interest or who agreed to an identified resolution process prior to their participation were involved in this CME activity. The following individual(s) in a position to control content for this session have disclosed the following relevant financial relationships: Jeffrey Unger, MD, FAAFP, FACE • Consultant or Advisory Board: Abbott, Boehringer Ingelheim, Dance Pharmaceutical, Intarcia, Janssen, Lilly, Merck, Novo Nordisk, Proteus, and Sanofi-Aventis (Diabetes) • Honorarium: Janssen, Novo Nordisk, Abbott Diabetes and Janssen (Diabetes) • Research Grants or support: Abbott Diabetes, Dexcom, Lilly, Merck, Novo Nordisk, Sanofi-Aventis, Janssen, Proteus and Intarcia (Diabetes) • Speakers' Bureaus: Abbott Diabetes, Intarcia, Janssen, and Novo Nordisk (Diabetes) • Stock/Bond Holdings: Novo Nordisk (Diabetes) All other individuals in a position to control content for this session have indicated they have no relevant financial relationships to disclose. The content of my material/presentation in this CME activity will include discussion of unapproved or investigational uses of products or devices as indicated: • Presentation will include non-approved indications for certain therapeutic interventions. Experimental therapies will also be discussed. The audience will be informed about unapproved drug interventions. Jeffrey Unger, MD, FAAFP, FACE Director, Unger Primary Care Concierge Medical Group, Rancho Cucamonga, California; Director of Metabolic Studies, Catalina Research Institute, Montclair, California Dr. Unger’s private practice is devoted to the comprehensive care of patients who have diabetes, addiction, mental illness, migraine, and other chronic disease states. He has published more than 190 peer- reviewed articles on diabetes, migraine, and pain management. In addition, he has written three medical textbooks on diabetes, including Diabetes Management in Primary Care, 2nd Edition, which was published in December 2012. Dr. Unger is board certified in family medicine and has served as a consulting physician for the Los Angeles Angels of Anaheim baseball club and the World Wrestling Federation. Learning Objectives 1. Critically evaluate the evidence emerging within diabetes research as it applies to recommendations for physician change. 2. Evaluate current standards of care (screening, prevention, diagnosis, treatment, management) for patients with diabetes, or who are at risk for developing diabetes, for opportunities to update standards in accordance to current research and evidence-based guidelines. 3. Assess new and novel treatments for diabetes in terms of efficacy, safety, contraindications and cost/benefit relative to existing treatments. 4. Apply a patient-centered approach to incorporate guideline recommendations for intensifying therapy to achieve glycemic control. Associated Session • Diabetes Update: PBL
Transcript of Diabetes Update: Diabetes Management in Primary Care · PDF file1 Diabetes Update: Diabetes...

1
Diabetes Update: Diabetes Management in Primary Care
Jeffrey Unger, MD, FAAFP, FACE
ACTIVITY DISCLAIMERThe material presented here is being made available by the American Academy of Family Physicians for educational purposes only. Please note that medical information is constantly changing; the information contained in this activity was accurate at the time of publication. This material is not intended to represent the only, nor necessarily best, methods or procedures appropriate for the medical situations discussed. Rather, it is intended to present an approach, view, statement, or opinion of the faculty, which may be helpful to others who face similar situations.
The AAFP disclaims any and all liability for injury or other damages resulting to any individual using this material and for all claims that might arise out of the use of the techniques demonstrated therein by such individuals, whether these claims shall be asserted by a physician or any other person. Physicians may care to check specific details such as drug doses and contraindications, etc., in standard sources prior to clinical application. This material might contain recommendations/guidelines developed by other organizations. Please note that although these guidelines might be included, this does not necessarily imply the endorsement by the AAFP.
DISCLOSUREIt is the policy of the AAFP that all individuals in a position to control content disclose any relationships with commercial interests upon nomination/invitation of participation. Disclosure documents are reviewed for potential conflict of interest (COI), and if identified, conflicts are resolved prior to confirmation of participation. Only those participants who had no conflict of interest or who agreed to an identified resolution process prior to their participation were involved in this CME activity.
The following individual(s) in a position to control content for this session have disclosed the following relevant financial relationships:
Jeffrey Unger, MD, FAAFP, FACE• Consultant or Advisory Board: Abbott, Boehringer Ingelheim, Dance Pharmaceutical, Intarcia, Janssen, Lilly, Merck, Novo Nordisk,
Proteus, and Sanofi-Aventis (Diabetes)• Honorarium: Janssen, Novo Nordisk, Abbott Diabetes and Janssen (Diabetes)• Research Grants or support: Abbott Diabetes, Dexcom, Lilly, Merck, Novo Nordisk, Sanofi-Aventis, Janssen, Proteus and Intarcia
(Diabetes)• Speakers' Bureaus: Abbott Diabetes, Intarcia, Janssen, and Novo Nordisk (Diabetes)• Stock/Bond Holdings: Novo Nordisk (Diabetes)
All other individuals in a position to control content for this session have indicated they have no relevant financial relationships to disclose.
The content of my material/presentation in this CME activity will include discussion of unapproved or investigational uses of products or devices as indicated:
• Presentation will include non-approved indications for certain therapeutic interventions. Experimental therapies will also be discussed. The audience will be informed about unapproved drug interventions.
Jeffrey Unger, MD, FAAFP, FACEDirector, Unger Primary Care Concierge Medical Group, Rancho Cucamonga, California; Director of Metabolic Studies, Catalina Research Institute, Montclair, California
Dr. Unger’s private practice is devoted to the comprehensive care of patients who have diabetes, addiction, mental illness, migraine, and other chronic disease states. He has published more than 190 peer-reviewed articles on diabetes, migraine, and pain management. In addition, he has written three medical textbooks on diabetes, including Diabetes Management in Primary Care, 2nd Edition, which was published in December 2012. Dr. Unger is board certified in family medicine and has served as a consulting physician for the Los Angeles Angels of Anaheim baseball club and the World Wrestling Federation.
Learning Objectives1. Critically evaluate the evidence emerging within diabetes research as it
applies to recommendations for physician change.
2. Evaluate current standards of care (screening, prevention, diagnosis, treatment, management) for patients with diabetes, or who are at risk for developing diabetes, for opportunities to update standards in accordance to current research and evidence-based guidelines.
3. Assess new and novel treatments for diabetes in terms of efficacy, safety, contraindications and cost/benefit relative to existing treatments.
4. Apply a patient-centered approach to incorporate guideline recommendations for intensifying therapy to achieve glycemic control.
Associated Session
• Diabetes Update: PBL
2
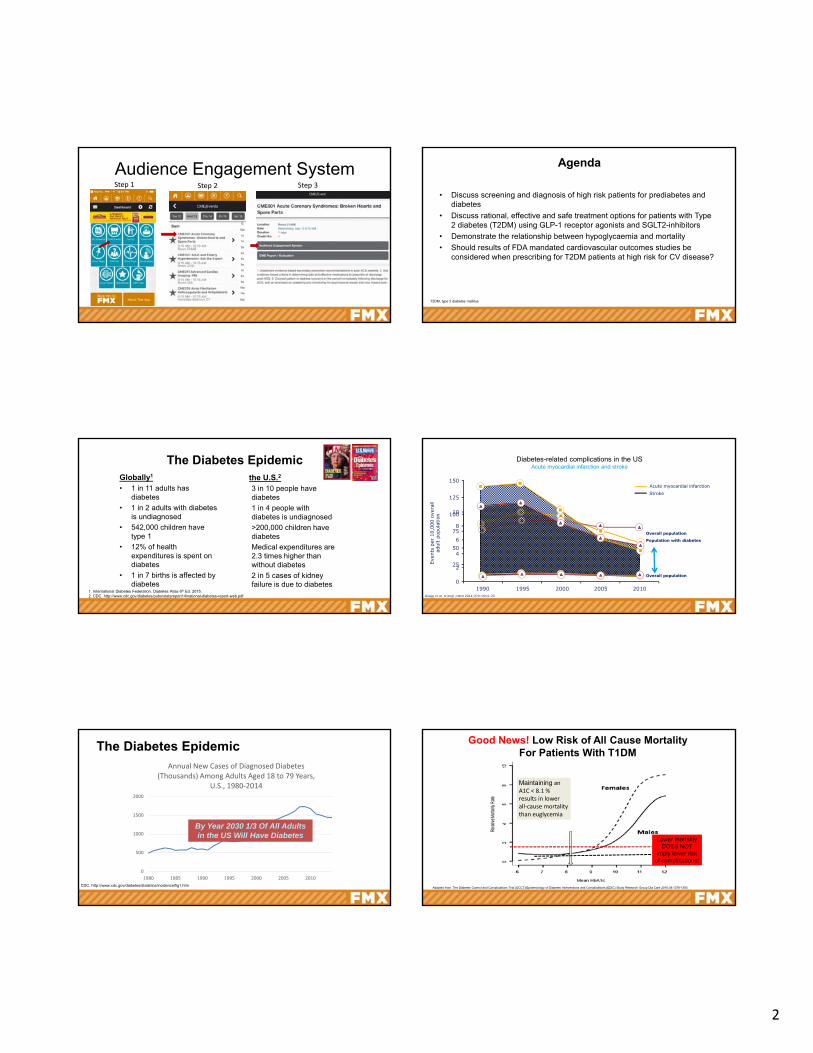
Audience Engagement SystemStep 1 Step 2 Step 3
Agenda
• Discuss screening and diagnosis of high risk patients for prediabetes and diabetes
• Discuss rational, effective and safe treatment options for patients with Type 2 diabetes (T2DM) using GLP-1 receptor agonists and SGLT2-inhibitors
• Demonstrate the relationship between hypoglycaemia and mortality
• Should results of FDA mandated cardiovascular outcomes studies be considered when prescribing for T2DM patients at high risk for CV disease?
T2DM, type 2 diabetes mellitus
The Diabetes EpidemicGlobally1
• 1 in 11 adults has diabetes
• 1 in 2 adults with diabetes is undiagnosed
• 542,000 children have type 1
• 12% of health expenditures is spent on diabetes
• 1 in 7 births is affected by diabetes
In the U.S.2
• 3 in 10 people have diabetes
• 1 in 4 people with diabetes is undiagnosed
• >200,000 children have diabetes
• Medical expenditures are 2.3 times higher than without diabetes
• 2 in 5 cases of kidney failure is due to diabetes
1. International Diabetes Federation. Diabetes Atlas 6th Ed. 2015.2. CDC. http://www.cdc.gov/diabetes/pubs/statsreport14/national-diabetes-report-web.pdf
Even
ts p
er 1
0,00
0 ov
eral
lad
ult
popu
latio
n
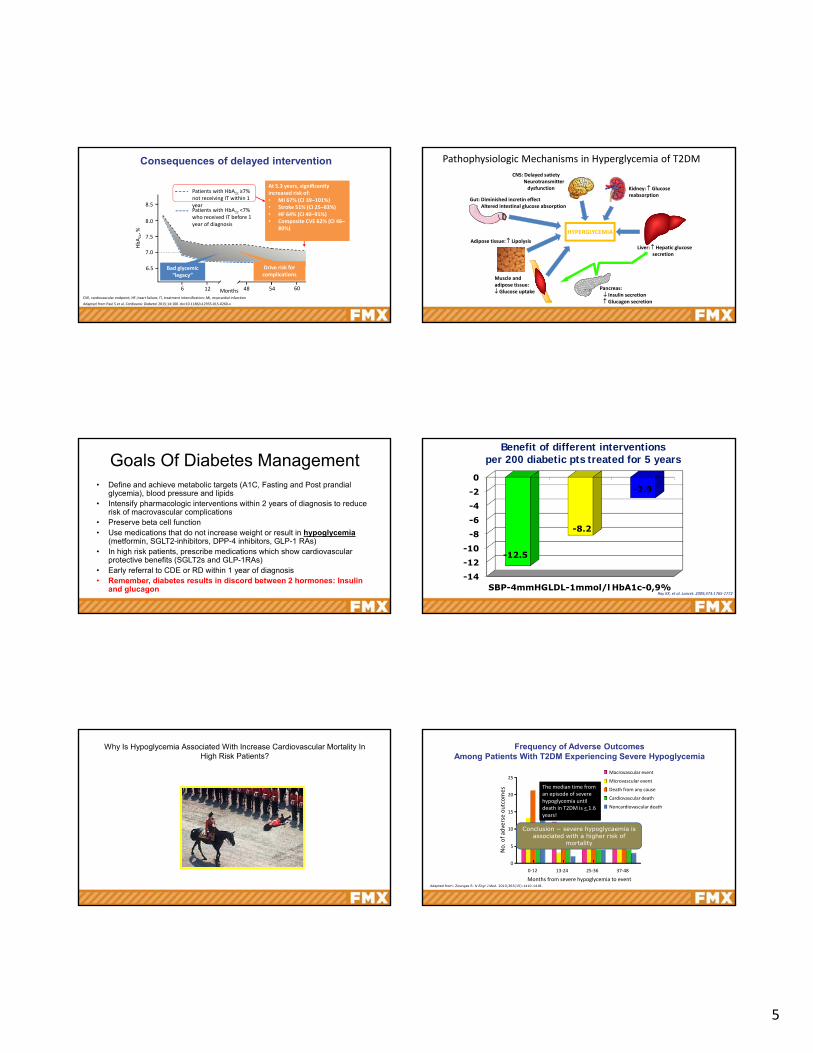
Diabetes-related complications in the USAcute myocardial infarction and stroke
Overall population
Population with diabetes
Overall population
Acute myocardial infarctionStroke
1990 1995 2000 2005 2010
10
2
4
6
8
0
150
125
25
100
75
50
Gregg et al. N Engl J Med 2014;370:1514–23
The Diabetes Epidemic
0
500
1000
1500
2000
1980 1985 1990 1995 2000 2005 2010
Annual New Cases of Diagnosed Diabetes (Thousands) Among Adults Aged 18 to 79 Years,
U.S., 1980‐2014
CDC. http://www.cdc.gov/diabetes/statistics/incidence/fig1.htm
By Year 2030 1/3 Of All Adults in the US Will Have Diabetes
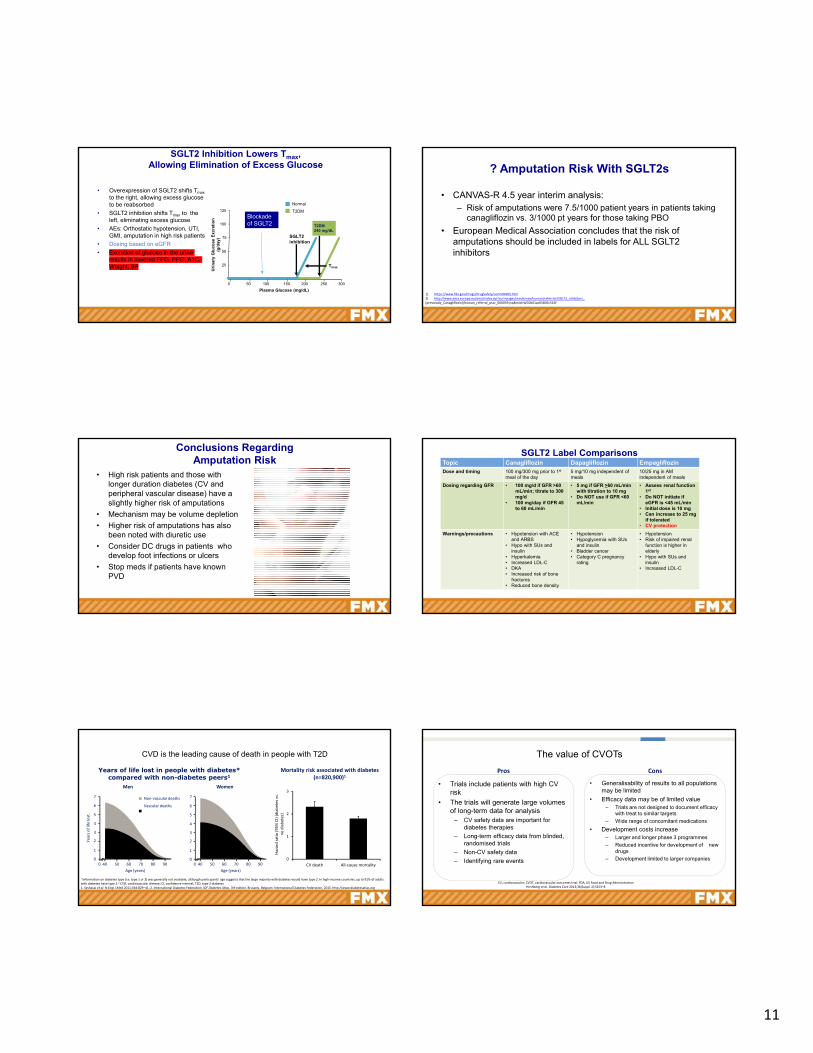
Good News! Low Risk of All Cause Mortality For Patients With T1DM
Adapted from: The Diabetes Control and Complications Trial (DCCT)/Epidemiology of Diabetes Interventions and Complications (EDIC) Study Research Group Dia Care 2016;39:1378-1383
Maintaining an A1C < 8.1 % results in lower all‐cause mortality than euglycemia
Lower mortality DOES NOT
imply lower risk of complications!

3
Normal
Diabetes Mellitus
PrediabetesImpaired Glucose
Tolerance
Fasting Plasma
Glucose
ULN= 99 mg/dL
Fasting Plasma
Glucose
ULN= 99 mg/dL
2-hour Plasma Glucose On OGTT
ULN= 140 mg/dL
2-hour Plasma Glucose On OGTT
ULN= 140 mg/dL
/ 200 mg/dLdL
/ 200 mg/dLdL
140 mg/dL140 mg/dL
Any abnormality must be repeated and confirmed on a separate day Any abnormality must be repeated and confirmed on a separate day The diagnosis of diabetes can also be made based on unequivocal symptoms and a random glucose >200 mg/dL
Prediabetes is NOT a benign condition. Patients may progress to diabetes or develop macrovascular/microvascular disease
The diagnosis of diabetes can also be made based on unequivocal symptoms and a random glucose >200 mg/dL
Prediabetes is NOT a benign condition. Patients may progress to diabetes or develop macrovascular/microvascular disease
100 mg/dL100 mg/dL
PrediabetesImpaired Fasting
Glucose
Classification Of Impaired Glucose Tolerance Prediabetes?
Normal
Diabetes Mellitus
A1CA1C
6.5%6.5%
5.7%5.7%
Prediabetes
Normal
Diabetes Mellitus126
mg/dL
140 mg/dL
6.5 %
ADA. Diabetes Care. 2014;37 Suppl 1: S81-90
Prediabetes Consensus statement, Endocr Pract. 2008;14(No. 7) 933-946
• 80-140 mg/dL= normal glycemic range
• Normal A1C= 5.1 %
Prediabetes High Risk Patients
• PCOS
• 1st degree relative
• GDM by history
• Abdominal obesity (WC > 35 inches female, 40 inches men)
Whom to Screen for Prediabetes
• +FH
• Hx of CVD
• Obesity (BMI < 25 kg/m2)
• Sedentary life style
• Nonwhite ancestry
• Previous hx ot IGT or IFG
• Hx of HTN
• Elevated TG, low HDL or both
• PCOS
• Delivered baby weighing > 9 lbs
• Pts with schizophrenia or bipolar disorderGarber AJ, Handelsman Y, Einhorn D, et al. Diagnosis and management of
prediabetes in the continuum of hyperglycemia—when do the risk of diabetes begin? A consensus statement from the American College of Endocrinology and the American Association of Clinical Endocrinologists. Endocr Pract. 2008;14(7):933–945.
Screening High Risk Patients For Prediabetes*
*If NO risk factors begin screening at age 45 then every 2‐3 years+ risk screen at any time
Prediabetes
• In 2009-2012, based on fasting glucose or A1C levels, prediabetes was detected in
– 37% of adults ages 20 years and older
– 51% of adults ages 65 years and older
– An estimated 86 million adults ages20 years and older
• People with prediabetes have an increased risk of developing type 2 diabetes, heart disease, and stroke
• ½ billion people in China have prediabetes!
National Diabetes Information Clearinghouse. National Diabetes Statistics, 2014. Available at: http://diabetes.niddk.nih.gov/dm/pubs/statistics/International Diabetes Federation Website. [(accessed on 9 May 2016)]. Available online:http://www.Idf.Org/media‐events/press‐releases/2015/diabetes‐atlas‐7th‐edition.
Baseline A1C Predicts Diabetes Progression Over 5 Years
A1C (%) Risk of Diabetes Progression (%)
< 5.0 < 0.1
5.0‐5.5 % < 9
5.5‐6 % 9‐25
6‐6.5 ^ 25‐50
Zhang X, Gregg EW, Williamson DF, et al. A1C level and future risk of diabetes: a systematic review. Diabetes Care. 2010;33:1665–167
Prediabetes Constitutes Inherent Disease Risk
• IGT progression to diabetes is 6-10 % per year• 50 % of patients with IGT have metabolic syndrome• IGT doubles the risk of CVD• DECODE study: All-cause mortality doubled as 2 hr
postchallenge OGTT values increased from 95-200 mg/dL. (FBG is not correlated with increased mortality)
• 15 % increased risk of cancer (stomach, colon, liver, pancreas)
• Associated with increased risk of Alzheimer’s disease, Parkinson’s disease and major depression
Unger, J. Diabetes Management in Primary Care. Lippincott. 2012Decode Study Group. Lancet. 1999;354:617–662. Huang, Y, et al. Diabeologia. 2014. Sept 11
Screening Children for Prediabetes and Diabetes
Consider for all children who are overweight and have 2 of any of the following risk factors
● Family history of type 2 diabetes in first- or second-degree relative● High-risk race/ethnicity● Signs of insulin resistance or conditions associated with insulin
resistance● Maternal history of diabetes of GDM during child’s gestation
Begin screening at age 10 years or onset of puberty
Screen every 3 years
A1C test is recommended for diagnosis in childrenAdapted from:ADA. Testing for Diabetes in Asymptomatic Patients. Diabetes Care. 2014;37(suppl 1):S17-18.

4
Initial Treatment Target Is Restoration of Normal Glucose Regulation
Beta Cell Stage Ambient Glucose (mg/dL)Beta Cell Changes Within
Islet
85‐130 Beta cell hypertrophy
89‐130
Decreased expression of glucose transport proteins
130‐285 Reduced insulin stores
285‐350
Beta cell death
> 350
FibrosisUnger J. Diabetes Management in Primary Care. 2nd ed. Lippincott, Williams & Wilkins; 2012
Knowler WC. N Engl J Med. 2002;346:393–40.
Risk Stratification1 and Management Strategies for Prediabetes
Risks and treatments Low Medium High
Hemoglobin A1C, % 5.7–5.8 5.9–6.1 6.2–6.49
Risk stratification √ √ √
A1C target: <5.7% √ √ √
Lifestyle modification, 16-week course √ √ √
Lose 7% of body weight if BMI ≥25 kg/m2 √ √ √
Physical activity ≥150 minutes/week √ √ √
Pharmacologic therapy (e.g., metformin)* √
Gastric bypass surgery† √
Adapted from:1. Tuso P. Perm J. 2014 Summer;18:88–93.
* Consider in low and medium risk if no weight loss after 16-week lifestyle modification course
† BMI ≥40 kg/m2 with no risk factors or ≥35 kg/m2 1 or more severe obesity-related co-morbidities and/or if no weight loss after lifestyle modification and/or metformin therapy
Overview Of Lifestyle Recommendations for Prediabetes
• Weight loss: 7 % of baseline weight
• Exercise: 150 min/week of moderate exercise
• Diet: No specific recommendations, refer to intensive behavioral management to achieve the 7 % weight loss goal
• Among persons in a prediabetic state, the incidence of type 2 diabetes is reduced by approximately 40 to 45% with effective lifestyle changes or drug treatment
American Diabetes Association Standards of medical care in diabetes—2014. Diabetes Care. 2015;38(Suppl 1):S31–S33Knowler WC, Barrett‐Connor E, Fowler SE, et al. Reduction in the incidence of type 2 diabetes with lifestyle intervention or metformin. N Engl J Med 2002;346:393‐403
Diabetes Prevention Program:Mean Weight Change
Adopted from: Knowler WC, et al. N Engl J Med. 2002;346:393-403.
Placebo
MET
Lifestyle
-8
-6
-4
-2
0
0 1 2 3 4Years After Randomization
Weight (kg)
2 lbs
Relative risk of progression of diabetic complications
1
3
5
7
9
11
13
15
6 7 8 9 10 11 12
Retinop
Neph
Neurop
Microalb
Relativerisk
Mean HbA1c levelAdapted from Skyler JS. Endocrinol Metab Clin N Am 1996;25:243–329; DCCT Research Group. N Engl J Med 1993;329:977–986
Retinopathy
Nephropathy
Neuropathy
Microalbuminuria
Each 1 % reduction in A1C results in a 35 %
decrease in microvascular and 25 % decrease in DM related deaths.
ADA-EASD Position Statement: Management of Hyperglycemia in T2DM
•Target A1C for MOST patients is < 7%
•Age: Older adults- Reduced life expectancy
- Higher CVD burden
- Reduced GFR
- At risk for adverse events from polypharmacy
- More likely to be compromised from hypoglycemia
Less ambitious targets
HbA1c <7.5–8.0% if tighter targets not easily achieved
Focus on drug safetyADA. Diabetes Care. 2012. 35 (6):1364-1379
5
At 5.3 years, significantly increased risk of:• MI 67% (CI 39–101%)• Stroke 51% (CI 25–83%)• HF 64% (CI 40–91%)• Composite CVE 62% (CI 46–
80%)
At 5.3 years, significantly increased risk of:• MI 67% (CI 39–101%)• Stroke 51% (CI 25–83%)• HF 64% (CI 40–91%)• Composite CVE 62% (CI 46–
80%)
Consequences of delayed intervention
Adapted from Paul S et al. Cardiovasc Diabetol 2015;14:100 doi:10.1186/s12933‐015‐0260‐x
8.5
8.0
7.5
7.0
6.5
6 12 54 6048Months
HbA1c, %
Patients with HbA1c ≥7% not receiving IT within 1 yearPatients with HbA1c <7% who received IT before 1 year of diagnosis
CVE, cardiovascular endpoint; HF, heart failure; IT, treatment intensification; MI, myocardial infarction
Bad glycemic“legacy”
Drive risk for complications
Pathophysiologic Mechanisms in Hyperglycemia of T2DM
HYPERGLYCEMIA
Pancreas: Insulin secretion Glucagon secretion
Liver: Hepatic glucosesecretion
Muscle andadipose tissue: Glucose uptake
CNS: Delayed satietyNeurotransmitterdysfunction Kidney: Glucose
reabsorptionGut: Diminished incretin effect
Altered intestinal glucose absorption
Adipose tissue: Lipolysis
Goals Of Diabetes Management• Define and achieve metabolic targets (A1C, Fasting and Post prandial
glycemia), blood pressure and lipids• Intensify pharmacologic interventions within 2 years of diagnosis to reduce
risk of macrovascular complications• Preserve beta cell function• Use medications that do not increase weight or result in hypoglycemia
(metformin, SGLT2-inhibitors, DPP-4 inhibitors, GLP-1 RAs)• In high risk patients, prescribe medications which show cardiovascular
protective benefits (SGLT2s and GLP-1RAs)• Early referral to CDE or RD within 1 year of diagnosis• Remember, diabetes results in discord between 2 hormones: Insulin
and glucagon
Benefit of different interventions per 200 diabetic pts treated for 5 years
-14-12-10
-8-6-4-20
SBP-4mmHGLDL-1mmol/l HbA1c-0,9%
-12.5
-8.2
-2.9
red
uct
ion
in %
Ray KK, et al. Lancet. 2009;373:1765‐1772
Why Is Hypoglycemia Associated With Increase Cardiovascular Mortality In High Risk Patients?
Frequency of Adverse Outcomes Among Patients With T2DM Experiencing Severe Hypoglycemia
Adapted from: Zoungas S. N Engl J Med. 2010;363(15):1410-1418.
25
No. o
f ad
verse outcomes
Months from severe hypoglycemia to event
20
15
10
5
0
0‐12 13‐24 25‐36 37‐48
Macrovascular event
Microvascular event
Death from any cause
Cardiovascular death
Noncardiovascular death
The median time from an episode of severe hypoglycemia until death in T2DM is < 1.6 years!
Conclusion − severe hypoglycaemia is associated with a higher risk of
mortality

6
ACCORD All Cause Mortality
1.41%/yr
1.14%/yr
HR = 1.22 (1.01‐1.46)P = 0.04
•10,251 pts with T2DM•CT target A1C= 7‐7.9 %•IT target A1C = 6.0 %•Does IT reduce CV risk?
•257 vs 203 deaths IT vs CT. Study terminated early
Hurdles to Intensive TherapyRates of Severe Hypoglycemia
aHypoglycemia requiring any assistance; bIntensive glycemic control was defined differently in these trials.ACCORD, Action to Control Cardiovascular Risk in Diabetes; ADVANCE, Action in Diabetes and Vascular Disease: PreterAx and DiamicroN MR Controlled Evaluation; CON, conventional therapy; GLY, glibenclamide; HR, hazard ratio; INS, insulin; INT, intensive therapy; STD, standard therapy; UKPDS, UK Prospective Diabetes Study; VADT, Veterans Affairs Diabetes Trial. 1. UKPDS Group. Lancet. 1998;352(9131):837-853; 2. Patel A, et al; [ADVANCE]. N Engl J Med. 2008;358(24):2560-2572; 3. Gerstein HC, et al; [ACCORD]. N Engl J Med. 2008;358(24):2545-2559; 4. Duckworth W, et al. N Engl J Med. 2009;360(2):129-139.
Annualized
Rate of
Severe Hyp
oglycemia
a , %
7.9%
P<0.001 vs CON
7.2% 7.3% 6.5% 7.5% 6.4% 8.4% 6.9%
HR 1.86 (1.42‐2.40)P<0.001
P<0.001 P=0.01
UKPDS1 ADVANCE2 ACCORD3 VADT4
7.1%A1c=
0.7
1.41.8
0.40.7
1.5
4.6
1.8
3.8
0
1.0
2.0
3.0
4.0
5.0
CON GLY INS STD INTb STD INTb STD INTb
aP<0.05 vs euglycemia; bP<0.01 vs euglycemia apart (data are mean ± standard error of the mean).N=10 patients with T2DM underwent paired hyperinsulinemic clamp stuides at least 4 weeks apart.hsCRP, high-sensitivity CRP.Chow EYK, et al. Diabetologia. 2013;56(suppl 1):S243.
Effects of Hypoglycemia on Thrombosis in T2DM
Max
imu
m
Ab
sorb
ance
, AU
ΔC
lot
Lys
is
Tim
e, s
ΔF
ibri
no
gen
, m
g/m
LΔ
hsC
RP,
mg
/L
-0.10
-0.05
0.00
0.05
0.10
Baseline End of Clamp
Day 1 Day 7
-400
-200
0
200
400
Baseline End of Clamp
Day 1 Day 7
Timepoint
ab
b ba
Timepoint
-1
0
1
2
3
Baseline End of Clamp
Day 1 Day 7
-2
-1
0
1
2
Baseline End of Clamp
Day 1 Day 7
Hypoglycemia
Euglycemia
b
a
Abnormal QT prolongation and T-wave morphology during hypoglycaemia in a single patient
Baseline QTc 456msGlucose nadir 2.5mmol QTc 550ms
Adapted from: how et al. Diabetes 2014;63:1738‐47
Normal QT interval= 0.36‐0.44 sec (varies slightly with age, gender, pulse)
Progressive flattening of T wave is noted with fall in glucose over time
1.0
1.2
1.4
1.6
1.8
2.0
2.2
2.4
2.6
2.8
3.0
CV death Total death Macrovascular Microvascular
Severe hypoglycaemia is associated with more complications
N Engl J Med 2010;363:1410‐8.CV, cardiovascular
Hazard ratio
Zoungas et al. N Engl J Med 2010;363:1410–8
Hypoglycemia with antidiabetes therapies
aExenatide twice daily; bIncludes liraglutide, exenatide once weekly, albiglutide, and dulaglutide; cIncludes saxagliptin, linagliptin, and sitagliptin; dIncludes canagliflozin, dapagliflozin, and empagliflozin; dIncludes neutral protamine Hagedorn insulin, insulin glargine, and insulin detemir.1. Drugs, FDA. Available at: http://www.accessdata.fda.gov/scripts/cder/drugsatfda/. Accessed 01 April 2016; 2. Boland CL et al. Ann Pharmacother. 2013;47:490–505; 3. Nauck MA. Drug Des Devel Ther. 2014;8:1335–80.
Drug Class EstimatedA1c Reduction, %
Hypoglycemia Incidence, %
Short‐acting GLP‐1 RA1,a 0.5‐0.7 3.8‐10.7*
Long‐acting GLP‐1 RA1,b 0.7‐1.6 0‐10.9*
DPP‐4 inhibitors2,c 0.4‐0.8 0.3‐5*
SGLT‐2 inhibitors3,b 0.7 0‐6*
Sulfonylureas6 1‐2 18‐30
Pioglitazone6 0.5‐1.4 0‐3.7
Basal insulin6,d 1.5‐3.5 29.9‐61.2
*Hypoglycemia risks are higher when agents are combined with a sulfonylurea or insulin.

7
• More frequent SBGM• Avoid mixed insulin in patients
who skip meals• Use analog, not human insulin• Preferred basal insulins
include degludec and glargine U-300
• Use continuous glucose sensors in patients with a history of hypoglycemia unawareness
Mitigating Hypoglycemia In High Risk Patients
Libre ProCPT Codes:9525095252
Rational Pharmacotherapy For T2DM
• Safety and efficacy TRUMP cost
• Hypoglycemia risk increases with duration of disease
• Consider diabetes pathogenesis when prescribing medications
– GLP-1 RA + SGLT2 inhibitors effectively reverse 7/8 of the ominous octet defects
• Treat early, effectively, rationally, for as long as possible and as safely as possible
Unger, J. Diabetes Management in Primary Care. 2nd Ed. 2012
• DPP-4i, dipeptidyl peptidase-4 inhibitor; SGLT2i, sodium-glucose cotransporter 2 inhibitor; GLP-1 RA, glucagon-like peptide-1 receptor agonist; SU, sulfonylurea; TZD, thiazolidinedione;
ADA 2016: Standards of medical care in diabetes
Basal insulin + mealtime insulin or GLP‐1 RA
Healthy eating, weight control, increased physical activity
Two‐drug combinations
Three‐drug combo
Metformin
SU
TZD DPP‐4i SGLT2i
GLP‐1 RA Insulin
TZD
SU DPP‐4i SGLT2i
GLP‐1 RA Insulin
DPP‐4i
SU TZD SGLT2iInsulin
GLP‐1 RA
Insulin (basal)
TZD DPP‐4i SGLT2i
GLP‐1 RA
SUTZD
Insulin
Combination injectable therapy
Initial monotherapy
SGLT2i
SU TZDDPP‐4i Insulin
Escalate therapy at 3 months if target not achieved
Displays hierarchy of rational pharmacology
without discussion of A1C intervention points
American Diabetes Association. Diabetes Care 2016;39(Suppl. 1):S1–S2
Recommended Targets for Patients with T2DM
1. American Diabetes Association. Diabetes Care. 2016;39(Suppl 1):S1‐S117.2. Garber AJ, et al. Endocr Pract. 2016;22(Suppl1):84‐113.
ADA1 AACE2
HbA1c < 7.0%* 6.5% (Individualize)
Pre-prandial plasma glucose
80–130 mg/dL* < 110 mg/dL
Peak post-prandial glucose† < 180 mg/dL* < 140 mg/dL
Blood pressure < 140/90 mm Hg# < 130/80 mm Hg
LDL Cholesterol< 100 mg/dL < 100mg/dL (high risk)
< 70 mg/dL (very high risk)
Triglycerides < 150 mg/dL < 150 mg/dL
HDL Cholesterol> 40 mg/dL (male)
> 50 mg/dL (female)—
* Individualized based on duration of diabetes, age/life expectancy, comorbid conditions, known CVD or advanced microvascular complicatons, hypoglycemic unawareness, and individual pa ent considera ons. †Postprandial glucose measurements should be made 1‐2h after the beginning of the meal, generally peak levels in patients with diabetes. #SBP <130 mmHg and DBP <80 mm Hg for younger patients, those with albuminuria, and/or those with HTN and ≥1 additional atherosclerotic CVD risk factors, if they can be achieved without undue treatment burden.

8
The Incretin Effect in Healthy Subjects
Oral Glucose Intravenous Glucose
C-p
eptid
e (n
mol
/L)
Time (min)
0.0
0.5
1.0
1.5
2.0
Incretin Effect*
*
*
*
**
*
60 120 1800
N = 6; Mean (SE)*P0.05
Republished with permission of Endocrine Society, from Journal of Clinical Endocrinology and Metabolism, Nauck MA, volume 63 , issue 2, pages 492-498, 2016; permission conveyed through Copyright Clearance Center, Inc.
GLP-1 Secreted From The L-cells of Gut In Response To Carbohydrate Stimulus
GLP-1 Secretion And Receptor Activation Is Reduced In T2DM
Adapted from Deacon CF, et al. Diabetes. 1995;44:1126-1131.
GLP-1 Secretion and Inactivation
IntestinalGLP‐1release
GLP‐1 (7‐36)active
Mixed meal
GLP‐1 (9‐36)inactive
(>80% of pool)
DPP‐4
t½ = 1 to 2 min
DPP-4 Inhibitors and GLP-1 RAs Increase GLP-1 Activity in Different Ways
• GLP-1 activity is higher with GLP-1 RAs (≈ 9 ×baseline) vs DPP-4 inhibitors (≈ 2 ×baseline)
• Both classes mediate glucose-dependent changes
– Increase insulin– Decrease glucagon
• GLP-1 RAs also– Slow gastric emptying– Increase satiety
Baggio L, et al. Gastroenterology. 2007;132:2131-2157.DeFronzo RA, et al. Curr Med Res Opin. 2008;24:2943-2952.Inzucchi SE, et al. Diabetes Care. 2015;38:140-149.
< 2 minDPP‐4 inhibitors increase GLP‐1 by
preventing degradation
GLP‐1 RAs act like GLP‐1 but are not readily
degraded by DPP‐4Active GLP‐1
DPP‐4
Inactive GLP‐1
Comparing Dosage and Administration of Current GLP-1 RAs: Daily GLP-1 RAs
Exenatide BIDa Liraglutide QDa Lixisenatide QDa
Inject within 60 minutes prior to 2 main meals of the day, at least 6 h apart
Initiate at 0.6 mg once daily for 1 weekb
Inject within 1 hour of the first daily meal
Initiate 5 μg per dose twice daily After 1 week, increase to 1.2 mg Initiate 10 μg dose once daily
Increase to 10 μg twice daily after 1 month, based on clinical response
Can increase to 1.8 mg if 1.2 mg does not provide acceptable glycemic control
Increase to 20 μg once daily at 15 days
Multidose pen Multidose pen Multidose pen
a May need needle prescription.b Dose intended to reduce gastrointestinal symptoms during titration; not effective for glycemic control.
US FDA. Drugs@FDA. http://www.accessdata.fda.gov/Scripts/cder/DrugsatFDA.

9
Comparing Dosage and Administration of Current GLP-1 RAs: Once-Weekly GLP-1 RAs
US FDA. Drugs@FDA. http://www.accessdata.fda.gov/Scripts/cder/DrugsatFDA.
Exenatide QW Albiglutide QW Dulaglutide QW
23‐G needle (supplied) 29‐G needle (supplied) 29‐G needle (supplied)
Administer 2 mg once weekly Initiate at 30 mg once weekly Initiate at 0.75 mg once weekly
No dose titration Can increase dose to 50 mg if needed
Can increase dose to 1.5 mg if needed
Available in a single‐use vial and syringe or in a single‐dose pen
Available in a single‐dose pen Available in a single‐dose pen
GLP-1 Receptor Agonists Demonstrate a Low Risk of Hypoglycemia
GLP-1 Receptor Agonists Demonstrate a Low Risk of Hypoglycemia
24.8 28.018.2 16.0
35.3
0
50
Overall
Hyp
o, %
5.3 3.0 3.6 1.3 3.0 5.60
50
Overall
Hyp
o, %
EXN 10 μg BID
LIXI 20 μg QD
LIRA 1.8 mgQD
No data
Consider decreasing insulin and SU dose to reduce hypoglycemia risk
1. Drugs@FDA. http://www.accessdata.fda.gov/scripts/cder/drugsatfda. 2. Ahmann A, et al. Diabetes Obes Metab. 2015;17:1056-1064. 3. Pozzilli P, et al. ADA Scientific Sessions 2016 [abstract 237-OR].
With MET1
With Basal Insulin1‐3
GLP-1RA Comparative Studies: Change in HbA1c
*Treatment difference (nominal 95% CI)=-0.06 (-0.19, 0.07), p<0.0001 for non inferiority vs liraglutideBID, twice a day; GLP-1RA, glucagon-like peptide-1 receptor agonist; HbA1c, glycosylated haemoglobin
Buse JB et al. Lancet 2009;374:39–47 (LEAD-6); Drucker DJ et al. Lancet 2008;372:1240–50 (DURATION-1); Buse JB et al. Lancet 2013;381:117–24 (DURATION-6); Pratley RE et al. Lancet Diabetes Endocrinol2014;2:289–97 (Harmony-7); Wysham C et al. Diabetes Care 2014;37(8):2159–67 (AWARD-1); Dungan KM et al. Lancet 2014; 384(9951):1349–1357 (AWARD-6).
Ch
ang
e in
Hb
A1c
(%)
p<0.0001
p=0.085
Baseline HbA1c (%):
8.2 8.1 8.2 8.28.5 8.4 8.1 8.1
-1.12
-0.79
-1.28
p=0.0001
-1.36-1.48
p=0.0023-1.83
p=0.085*
Liraglutide 1.8 mg Exenatide 10 µg BID
Dulaglutide 1.5 mgAlbiglutide 50 mg Exenatide 2 mg
-1.90
8.3 8.3
-1.50
-0.98-0.79
-1.42 -1.36
-0.99
-1.51
p<0.001
8.1 8.1
ITCA 650 – Exenatide –Not FDA Approved
Whitson A. American Diabetes Association 76th Scientific Sessions, June 10 - 14, 2016, New Orleans, Louisiana. Abstract 1027-P.
Continuous delivery of exenatide through a matchstick-size, osmotic mini-pump device
Simple subcutaneously placement
Continuous and consistent drug therapy using 3- or 6-month pumps with potential for device lasting up to 1 yr
Continuous Delivery of Exenatide
Re
leas
e R
ate
(mcg
pe
r d
ay)
Time (days)
Henry R et al. Presented at EASD, 2010(1) Buse JB, et al. Diabetes Obes Metab. 2015;17(2):145-151; (2) Holst JJ, Vilsbøll T. Diabetes Obes Metab. 2013;15(1):3-14; (3) Vora J, et al. Diabetes Metab. 2013;39(1):6-15.t
GLP-1 Receptor Agonist + Basal Insulin
- Simple to initiate- Control nocturnal hyperglycemia
- Control FPG- Less hypoglycemia risk vs NPH- Can cause weight gain- Achieve HbA1c target in ~50%a
Basal InsulinAnalogs
Basal InsulinAnalogs
- Simple to initiate- Can control FPG and PPG- Do not impair α-cell response to hypoglycemia
(reduce severe hypoglycemia)- Reduce weight- Achieve HbA1c target in ~60%a
GLP-1 RAs
GLP-1 RAs

10
Approved Fixed-Ratio Combinations of Basal Insulin and GLP-1 RAs
GLP‐1 RA Lixisenatide
Insulin Glargine
IGlarLixi(Soliqua 100/33)
GLP‐1 RA Liraglutide
InsulinDegludec
IDegLira(Xultophy 100/3.6
Check-list For Patients Using GLP-1RAs
• Do not use in patients with hx of pancreatitis
• Do not use in patients with personal for family hx of medullary thyroid carcinoma
• Most common AE= nausea and vomiting. Transient. Educate about satiety
• Injections using 32 g needles or self injectors
• Liraglutide can be used when eGFR is < 30 ml/Min
• Do NOT use with DPP-4s
• When used with insulin in patients with A1C < 8 % reduce dose of insulin by 20 %.
• Brain ~125 g/day
• Rest of the body ~125 g/day
Glucose uptake ~250 g/day:
−
• Dietary intake ~180 g/day
• Glucose production ~70 g/day
• Gluconeogenesis
• Glycogenolysis
Normal Glucose Homeostasis
+
Net balance ~0 g/day
Glucose input ~250 g/day:
The kidney filters circulating glucose
Glucose filtered~180 g/day
Glucose reabsorbed~180 g/day
The kidney reabsorbs and recirculates
glucose
How is Glucose Reabsorbed in the Kidney (Renal Medulla)?
• Glucose reabsorption is mediated in the proximal tubules of the
kidney
– Actively through sodium-coupled glucose cotransporters (SGLT)
– Passively through glucose transporters (GLUT)
• ~90% of glucose is reabsorbed by SGLT-2 and GLUT-2 in the S1 and
S2 segments
• ~10% of glucose is reabsorbed by SGLT-1 and GLUT-1 in the S3
segment
SGLT-2 Inhibitors: Mechanism of Action (cont)
Juxtoglomerular Complex
Proximal Convoluted Tubules
Loop of Henle
Free Filtration of Solute
Active Reabsorption
Glucose
SGLT‐2
SGLT‐1
Glucose
Type 2 Diabetes
0.0
1.0
2.0
3.0
4.0
5.0
6.0
7.0
SGLT2 GLUT2
Control T2DM
Increased Glucose Transporter Activity in T2DM
P<.05
P<.05
SGLT-2 and GLUT-2 Protein Expression in Healthy Controls and Patients with T2DM
Nor
mal
ized
Glu
cose
T
rans
port
er L
evel
s
11
SGLT2 Inhibition Lowers Tmax, Allowing Elimination of Excess Glucose
• Overexpression of SGLT2 shifts Tmax
to the right, allowing excess glucose to be reabsorbed
• SGLT2 inhibition shifts Tmax to the left, eliminating excess glucose
• AEs: Orthostatic hypotension, UTI, GMI, amputation in high risk patients
• Dosing based on eGFR
• Excretion of glucose in the urine results in lowered FPG, PPG, A1C, Weight, BP
300250200150100500
25
50
75
100
125U
rin
ary
Glu
cose
Exc
reti
on
(g/d
ay)
Plasma Glucose (mg/dL)
Tmax
SGLT2inhibition
Normal
T2DM 240 mg/dL
T2DMBlockade of SGLT2
? Amputation Risk With SGLT2s
• CANVAS-R 4.5 year interim analysis: – Risk of amputations were 7.5/1000 patient years in patients taking
canagliflozin vs. 3/1000 pt years for those taking PBO
• European Medical Association concludes that the risk of amputations should be included in labels for ALL SGLT2 inhibitors
1) https://www.fda.gov/Drugs/DrugSafety/ucm500965.htm2) http://www.ema.europa.eu/ema/index.jsp?curl=pages/medicines/human/referrals/SGLT2_inhibitors_(previously_Canagliflozin)/human_referral_prac_000059.jsp&mid=WC0b01ac05805c516f
• High risk patients and those with longer duration diabetes (CV and peripheral vascular disease) have a slightly higher risk of amputations
• Mechanism may be volume depletion
• Higher risk of amputations has also been noted with diuretic use
• Consider DC drugs in patients who develop foot infections or ulcers
• Stop meds if patients have known PVD
Conclusions Regarding Amputation Risk
SGLT2 Label ComparisonsTopic Canagliflozin Dapagliflozin EmpagliflozinDose and timing 100 mg/300 mg prior to 1st
meal of the day5 mg/10 mg independent of meals
10/25 mg in AM independent of meals
Dosing regarding GFR • 100 mg/d if GFR >60 mL/min; titrate to 300 mg/d
• 100 mg/day if GFR 45 to 60 mL/min
• 5 mg if GFR >60 mL/min with titration to 10 mg
• Do NOT use if GFR <60 mL/min
• Assess renal function 1st
• Do NOT initiate if eGFR is <45 mL/min
• Initial dose is 10 mg• Can increase to 25 mg
if tolerated• CV protection
Warnings/precautions • Hypotension with ACE and ARBS
• Hypo with SUs and insulin
• Hyperkalemia• Increased LDL-C• DKA• Increased risk of bone
fractures• Reduced bone density
• Hypotension• Hypoglycemia with SUs
and insulin• Bladder cancer• Category C pregnancy
rating
• Hypotension• Risk of impaired renal
function is higher in elderly
• Hypo with SUs and insulin
• Increased LDL-C
0
1
2
3
CV death All‐cause mortality
Hazard ratio (95% CI) (diabetes vs.
no diabetes)
CVD is the leading cause of death in people with T2D
Mortality risk associated with diabetes (n=820,900)1
0
7
40 50 60 70 80 90
Age (years)
Years of life lost
6
5
4
3
2
1
0
7
6
5
4
3
2
1
0
Men
40 50 60 70 80 900
Age (years)
Women
Non‐vascular deaths
Vascular deaths
Years of life lost in people with diabetes* compared with non-diabetes peers1
*Information on diabetes type (i.e. type 1 or 2) was generally not available, although participants' age suggests that the large majority with diabetes would have type 2. In high‐income countries, up to 91% of adults with diabetes have type 2.2 CVD, cardiovascular disease; CI, confidence interval; T2D, type 2 diabetes 1. Seshasai et al. N Engl J Med 2011;364:829–41; 2. International Diabetes Federation. IDF Diabetes Atlas, 7th edition. Brussels, Belgium: International Diabetes Federation, 2015. http://www.diabetesatlas.org
The value of CVOTs
• Trials include patients with high CV risk
• The trials will generate large volumes of long-term data for analysis
– CV safety data are important for diabetes therapies
– Long-term efficacy data from blinded, randomised trials
– Non-CV safety data
– Identifying rare events
• Generalisability of results to all populations may be limited
• Efficacy data may be of limited value– Trials are not designed to document efficacy
with treat to similar targets
– Wide range of concomitant medications
• Development costs increase– Larger and longer phase 3 programmes
– Reduced incentive for development of new drugs
– Development limited to larger companies
CV, cardiovascular; CVOT, cardiovascular outcomes trial; FDA, US Food and Drug AdministrationHirshberg et al. Diabetes Care 2013;36(Suppl. 2):S253–8
Pros Cons

12
White et al. N Engl J Med 2013;369:1327–35; Sciria et al. N Engl J Med 2013;369:1317–26; Green et al. N Engl J Med 2015;16;373:232–42; Pfeffer et al. N Engl J Med 2015;373:2247–57
ACS, acute coronary syndrome; CI, confidence interval; CV, cardiovascular; EXAMINE, Examination of Cardiovascular Outcomes: Alogliptin vs. Standard of Care in Patients with Type 2 Diabetes Mellitus and Acute Coronary Syndrome; HR, hazard ratio; MI, myocardial infarction; SAVOR TIMI-53, Saxagliptin Assessment of Vascular Outcomes Recorded in Patients with Diabetes Mellitus–Thrombolysis in Myocardial Infarction 53; T2D, type 2 diabetes; TECOS, Trial Evaluating Cardiovascular Outcomes with Sitagliptin; UA, unstable angina
Alogliptin (6.25, 12.5 or 25 mg/day*) + standard of care
T2D; HbA1c 6.5–11.0%; ACS within 15–90 days (n=5380)
Placebo + standard of care
Saxagliptin (2.5 or 5 mg/day**) + standard of care
Placebo + standard of care
T2D; HbA1c 6.5–12.0%; ≥40 years + CVD; ≥55 (men) or ≥60 (women) years + CV risk factors (n=16,492)
Lixisenatide (10 or 20 g/day†) + standard of care
Placebo + standard of care
T2D; HbA1c 5.5–11.0%; ACS within 180 days (n=6068)
T2D; HbA1c 6.5–8.0%; ≥50 years; CVD history (n=14,671)
Sitagliptin (100 or 50 mg/day***) + standard of care
Placebo + standard of care
SAVOR-TIMI-53 EXAMINE
TECOS ELIXA
Time (days)Time (months)
Time (months)Time in the trial (months)
Patients with endpoint (%
)
Patients with endpoint (%
)
Patients with endpoint (%
)
Patients with endpoint (%
)
EMPA‐REG1 LEADER4 SUSTAIN‐65
Population T2D + high CV risk T2D + high CV risk T2D
Drug (Class)
Empagliflozin(SGLT‐2i)
Liraglutide (GLP‐1RA)
Semaglutide (GLP‐1RA)
Objective Non‐inferiority Non‐inferiority Non‐inferiority
Endpoint 3‐point MACE 3‐point MACE 3‐point MACE
Results HR 0.86 HR 0.87 HR 0.74
Selected CVOTs:Assessing CV benefit with antiglycemic agents
1. Zinman et al. N Engl J Med 2015;373:2117–28; 2. Green et al. N Engl J Med 2015;373:232–42; 3. Pfeffer et al. N Engl J Med 2015;373:2247–57; 4. Marso et al. N Engl J Med 2016;375:311–22; 5. Marso et al. N Engl J Med 2016;375:1834–44
3‐point MACE: first occurrence of CV death, nonfatal MI or nonfatal stroke; MACE+: CV death, nonfatal MI, nonfatal stroke and hospitalisation for UA procedure ACS, acute coronary syndrome; CV, cardiovascular; CVOT, cardiovascular outcomes trial; GLP‐1RA, glucagon‐like peptide‐1 receptor agonist; HR, hazard ratio; LEADER, Liraglutide Effect and Action in Diabetes: Evaluation of Cardiovascular Outcome Results; MACE, major adverse cardiovascular event; MI, myocardial infarction; SGLT‐2i, sodium‐glucose cotransporter‐2 inhibitor; T2D, type 2 diabetes; UA, unstable angina
EMPA-REG Trial-Demonstrates Rapid Improvement in 3-Point MACE
aCumulative incidence of death from cardiovascular causes, nonfatal myocardial infarction, or nonfatal stroke.N=7020 patients with T2DM at high risk of cardiovascular events.Adpoted from : Zinman B, et al. N Engl J Med. 2015;373(22):2117-2128.
Patie
nts
With
Ev
ent,
%
Empagliflozin
P=0.04 for superiorityHazard ratio, 0.86 (95.02% CI, 0.74–0.99)
Placebo20
15
5
10
00 126 18 24 30 36 42 48
Cumulative Incidence of the Primary Outcomea
Patie
nts
With
Ev
ent,
%
Empagliflozin
P<0.001Hazard ratio, 0.62 (95% CI, 0.49–0.77)
Placebo9
3
6
00 126 18 24 30 36 42 48
Cumulative Incidence of Death From CV Causes
Patie
nts
With
Ev
ent,
%
Empagliflozin
P=0.002Hazard ratio, 0.65 (95% CI, 0.50–0.85)
Placebo76
45
00 126 18 24 30 36 42 48
Month
Hospitalization for Heart Failure
321
38% risk reduction
14% risk reduction
35% risk reduction
Death from a CV event, non-fatal MI, or strokeEmpa 10, 25 mg or standard of care
CANVAS CVOT-
Canagliflozin and Cardiovascular and Renal Events in Type 2 DiabetesNEJMjune 12, 2017DOI: 10.1056/NEJMoa1611925
14 % risk reduction in 3‐point MACE• Acute MI• Acute Stroke• CV Death
Primary outcomes in LEADER and EMPA-REG Timing of separation of treatment arms suggest different cardioprotective MoAs
LEADER1
Liraglutide
Proportion of individuals
with a M
ACE even
t (%
)
Time from randomisation (months)
HR: 0.86 (95% CI: 0.74;0.99)p=0.04 (superiority)
HR: 0.87 (95% CI: 0.78;0.97)p=0.01 (superiority)
Empaglifozin
20
15
10
5
0
0 6 12 18 24 30 36 42 48 54
20
15
10
5
0
0 6 12 18 24 30 36 42 48
EMPA‐REG2
3‐point MACE: first occurrence of CV death, nonfatal MI or nonfatal strokeCI, confidence interval; HR, hazard ratio; LEADER, Liraglutide Effect and Action in Diabetes: Evaluation of Cardiovascular Outcome Results; MACE, major adverse cardiovascular event; MoA, mode of action
1. Marso et al. N Engl J Med 2016;375:311–22; 2. Zinman et al. N Engl J Med 2015;373:2117–28
3 Point MACE improvement not driven by glycemic efficacy!
Empa-Reg Renal Data
Warner C, et al. NEJM. DOI: 10.1056/NEJMoa1515920
Incidence of nephropathy by 39 %

13
Diabetes Is A Complex Disease State!
•A1C•Exercise•Timing of medications in relation to meals•Blood pressure control•Lipid control•Stop smoking•Reduce carbs•Low testosterone•Depression•Work hours•Spouse•Blood glucose monitoring•Consultant appointments•Refills
• 66 y/o social worker, vet
• T2DM x 17 years
• A1c= 9.1%
• Taking NPH 200 u/d + metformin 1 gram/d+ pioglitazone 45 mg/d + glipizide 10 mg/d
• Taking meds as directed
Is This Patient “Non-Compliant?”
Glycemic variability
• Know your metabolic targets
• Know how to achieve your metabolic targets
• Take your medicines
• Don’t smoke
• Receive care from clinicians who are knowledgeable about diabetes pathogenesis and management
The 5 Strategies Which Guarantee Successful Diabetes Self-Management
Unger J. Diabetes Management in Primary Care‐2nd Ed. Lippincott 2012
Practice Recommendations
• Timely, intensive intervention in patients with diabetes can reduce the incidence of long-term diabetes-related complications and all-cause mortality. (SOR A).
• Several SGLT2-inhibitors and GLP-1 RAs have been shown to reduce the risk of cardiovascular mortality in “high risk” patients with type 2 diabetes. (SOR A)
• Drugs which reduce the risk of weight gain and hypoglycemia (SGLT2 inhibitors and GLP-1 RAs) should be used as 2nd line therapy in patients threated with metformin. (SOR A)
Questions