Diabetes Prevention Programs: Effectiveness and Value
145
©Institute for Clinical and Economic Review, 2016 Diabetes Prevention Programs: Effectiveness and Value Final Evidence Report and Meeting Summary July 25, 2016 Institute for Clinical and Economic Review
Transcript of Diabetes Prevention Programs: Effectiveness and Value

©Institute for Clinical and Economic Review, 2016
Diabetes Prevention Programs: Effectiveness and Value
Final Evidence Report and Meeting Summary
July 25, 2016
Institute for Clinical and Economic Review

©Institute for Clinical and Economic Review, 2016 Page i Final Evidence Report – Diabetes Prevention Programs
AUTHORS: Jeffrey A. Tice, MD Associate Professor of Medicine University of California, San Francisco
Rick Chapman, PhD, MS Director of Health Economics, Institute for Clinical and Economic Review Karen K. Shore, PhD Principal, Transform Health Matt Seidner, BS Program Manager, Institute for Clinical and Economic Review Daniel A. Ollendorf, PhD Chief Scientific Officer, Institute for Clinical and Economic Review Jed Weissberg, MD Senior Fellow, Institute for Clinical and Economic Review Steven D. Pearson, MD, MSc President, Institute for Clinical and Economic Review
DATE OF PUBLICATION: July 25, 2016 We would also like to thank Erin Lawler and Anne Loos for their contributions to this report.

©Institute for Clinical and Economic Review, 2016 Page ii Final Evidence Report – Diabetes Prevention Programs
About ICER
The Institute for Clinical and Economic Review (ICER) is an independent non-profit research organization that evaluates medical evidence and convenes public deliberative bodies to help stakeholders interpret and apply evidence to improve patient outcomes and control costs. ICER receives funding from government grants, non-profit foundations, health plans, provider groups, and health industry manufacturers. For a complete list of funders, visit http://www.icer-review.org/about/support/. Through all its work, ICER seeks to help create a future in which collaborative efforts to move evidence into action provide the foundation for a more effective, efficient, and just health care system. More information about ICER is available at http://www.icer-review.org
About CTAF
The California Technology Assessment Forum (CTAF) – a core program of ICER – provides a public venue in which the evidence on the effectiveness and value of health care services can be discussed with the input of all stakeholders. CTAF seeks to help patients, clinicians, insurers, and policymakers interpret and use evidence to improve the quality and value of health care.
The CTAF Panel is an independent committee of medical evidence experts from across California, with a mix of practicing clinicians, methodologists, and leaders in patient engagement and advocacy. All Panel members meet strict conflict of interest guidelines and are convened to discuss the evidence summarized in ICER reports and vote on the comparative clinical effectiveness and value of medical interventions. More information about CTAF is available at http://icer-review.org/programs/ctaf/

©Institute for Clinical and Economic Review, 2016 Page iii Final Evidence Report – Diabetes Prevention Programs
Table of Contents
Executive Summary ............................................................................................................................ ES1
1. Background ........................................................................................................................................ 1
1.1 Introduction ................................................................................................................................. 1
2. The Topic in Context .......................................................................................................................... 5
2.1 National and California Landscape .............................................................................................. 5
2.2 Barriers and Opportunities ........................................................................................................ 10
3. Public and Private Coverage for DPPs .............................................................................................. 16
3.1 Health Insurance Coverage for DPPs ......................................................................................... 16
3.2 Employer and Purchaser Coverage of DPPs ............................................................................... 18
4. Comparative Clinical Effectiveness .................................................................................................. 20
4.1 Overview .................................................................................................................................... 20
4.2 Methods ..................................................................................................................................... 21
4.3 Results ........................................................................................................................................ 24
5. Other Benefits or Disadvantages ..................................................................................................... 36
6. Comparative Value ........................................................................................................................... 37
6.1 Overview .................................................................................................................................... 37
6.2 Prior Published Evidence on Costs and Cost-Effectiveness of Diabetes Prevention Programs . 37
6.3 Potential Budget Impact ............................................................................................................ 43
6.4 Summary and Comment ............................................................................................................ 48
7. Voting Results .................................................................................................................................. 50
7.1 About the CTAF Process ............................................................................................................. 50
7.2 Summary of the Votes ............................................................................................................... 52
8. Recommendations to Guide Policy and Practice ............................................................................. 55
For Payers ......................................................................................................................................... 56
For Clinicians .................................................................................................................................... 57
For DPP Providers ............................................................................................................................ 58
For Policymakers .............................................................................................................................. 59
For the General Public ..................................................................................................................... 59
For Purchasers.................................................................................................................................. 60

©Institute for Clinical and Economic Review, 2016 Page iv Final Evidence Report – Diabetes Prevention Programs
Future Research Needs .................................................................................................................... 61
References ........................................................................................................................................... 64
Appendix A. Search Strategies and Results .......................................................................................... 74
Appendix B. Key Informant Interviews ................................................................................................ 79
Appendix C: Topic in Context Supplemental Information ................................................................... 81
Appendix D. Clinical Guidelines ........................................................................................................... 83
Appendix E. Public and Representative Private Insurer Coverage Policies ......................................... 88
Appendix F. Previous Systematic Reviews and Technology Assessments ........................................... 91
Appendix G. Ongoing US Studies ......................................................................................................... 95
Appendix H. Comparative Clinical Effectiveness Supplemental Information ...................................... 99
Appendix I. Comparative Value Supplemental Information .............................................................. 114
Appendix J. Conflict of Interest Disclosures ....................................................................................... 119

©Institute for Clinical and Economic Review, 2016 Page v Final Evidence Report – Diabetes Prevention Programs
List of Acronyms Used in this Report
ACA Affordable Care Act ACO Accountable care organization ADA American Diabetes Association AE Adverse event AHIP America’s Health Insurance Plans AHRQ Agency for Healthcare Research and Quality AMA American Medical Association BI Budget impact BMI Body mass index CDC Centers for Disease Control and Prevention CDPH California Department of Public Health CEA Cost-effectiveness analysis CI Confidence interval CMMI Center for Medicare and Medicaid Innovation CMS Centers for Medicare & Medicaid Services CVD Cardiovascular disease DHCS Department of Health Care Services DM Diabetes mellitus DPP Diabetes prevention program DPPOS Diabetes Prevention Program Outcomes Study DPRP Diabetes Prevention Recognition Program EHR Electronic health record FPG Fasting plasma glucose GDM Gestational diabetes mellitus HbA1c Hemoglobin A1c HRQOL Health-related quality of life HHS Health & Human Services ICSI Institute for Clinical Systems Improvement IFG Impaired fasting glucose IGT Impaired glucose tolerance NDEP National Diabetes Education Program NDPP National Diabetes Prevention Program NHANES National Health and Nutrition Examination Survey NIH National Institutes of Health OGTT Oral glucose tolerance test P4P Pay for performance PICOTS Population, Intervention, Comparators, Outcomes, Timing, and Settings PRISMA Preferred Reporting Items for Systematic Reviews and Meta-Analyses PSA Public service advertisement QALY Quality-adjusted life-year RCT Randomized controlled trial ROI Return on investment RR Risk ratio RRR Relative risk reduction SF-36 36-Item Short-Form Health Survey STAT Screen, Test, Act Today UCLA University of California, Los Angeles USPSTF United States Preventive Services Task Force VLM Virtual Lifestyle Management WHO World Health Organization

©Institute for Clinical and Economic Review, 2016 Page ES1 Final Evidence Report – Diabetes Prevention Programs Return to Table of Contents
Executive Summary Background
According to the Centers for Disease Control and Prevention (CDC), approximately 86 million Americans age 20 and older (37%) have prediabetes (i.e., blood glucose levels highera than normal but not high enough to be diagnosed with diabetes) and 90% of those with prediabetes do not know they have it.1 Obesity is strongly associated with both type 2 diabetes and prediabetes. In California, a recent study found that 13 million adults in the state (approximately 46% of the state adult population) have prediabetes or undiagnosed diabetes.2
Interventions to prevent or delay the development of type 2 diabetes have the potential both to improve individual health and quality of life through disease avoidance (e.g., eye, kidney, and nerve damage; strokes; heart attacks) and to save the health care system substantial medical costs by reducing the incidence of type 2 diabetes and its associated complications. Without such interventions, it is estimated that 15-30% of individuals with prediabetes will develop type 2 diabetes mellitus (DM) within five years.1 The Diabetes Prevention Program Trial (DPP Trial) demonstrated that the incidence of type 2 diabetes could be reduced using intensive diet and lifestyle counseling for individuals at high risk for developing diabetes.3 Since publication of the trial results in 2002, many commercial programs have been developed to implement a less expensive, scalable version of the DPP Trial intervention.
Topic in Context
This report addresses several key issues related to diabetes prevention programs (DPPs) for patients, provider organizations, payers, and other policymakers and includes: 1) a landscape analysis of available DPP approaches and relevant policy considerations; 2) a comparative effectiveness evaluation of DPPs participating in the CDC Diabetes Prevention Recognition Program (DPRP); and 3) an assessment of the costs, cost-effectiveness, and potential budget impact of DPPs.
Studies have shown that 5-7% weight loss can prevent or delay the development of type 2 diabetes in individuals with elevated levels of blood sugar consistent with prediabetes, and many clinicians and researchers use weight loss as a surrogate measure for effective prevention of type 2 diabetes.4,5 Participants in the DPP Trial lowered their body weight by approximately 7% after one
a Hemoglobin A1c (HbA1c) between 5.7 and 6.5%, fasting plasma glucose (FPG) between 100-125 mg/dL, and oral glucose tolerance test (OGTT) between 140 and 199 mg/dL. As explained in section 6.3 of the full report, use of a FPG threshold for prediabetes of 110 mg/dL rather than 100 mg/dL decreases the number of people estimated to have prediabetes by about two-thirds.

©Institute for Clinical and Economic Review, 2016 Page ES2 Final Evidence Report – Diabetes Prevention Programs Return to Table of Contents
year (decreasing to weight loss of about 4% after four years), which led to a 58% reduction in the risk of progressing to type 2 diabetes over three years compared with standard lifestyle recommendations plus a placebo.3,6 The lifestyle intervention was also more effective than drug therapy with metformin, an antidiabetic agent that has also been shown to promote weight loss.3
Because the initial DPP Trial involved individual counseling and the one-year program cost was about $1,400 per participant, subsequent research and practice have focused on replicating the results with programs that could be distributed more widely at a lower cost. Several published studies have examined the effectiveness of DPPs delivered in community settings, and more recently, in digital/online formats, both of which have reported significant weight loss.7-9
The CDC developed the National Diabetes Prevention Program (NDPP), a public/private partnership working to offer evidence-based, cost-effective interventions across the US with the goals of reducing the growing problem of prediabetes and type 2 DM as well as to build on the DPP Trial results with a focus on scalability. Organizations delivering a DPP with three key components – a CDC-approved curriculumb that promotes 5-7% weight loss and increased physical activity, a lifestyle coach, and a peer support group of program participants – can apply for CDC recognition through the Diabetes Prevention Recognition Program (DPRP). To achieve recognition, programs must submit data annually on participant weight and duration of physical activity in minutes, which are used by CDC to assess program impact on preventing or delaying the onset of type 2 DM.
Barriers and Opportunities
Scalability
To attain the NDPP goal of scalability, the format of DPPs has evolved from individual in-person counseling in the DPP Trial to in-person group sessions, and more recently to digital programs delivered via computer, tablet, or phone (see Table ES1). In addition to the considerable heterogeneity among in-person DPP delivery models, some of the currently available digital programs are delivered to virtual groups that are assigned a human coach while another delivers coaching messages through a fully-automated system based on algorithms.
b In addition to the DPP curriculum publicly available from the CDC, organizations offering DPPs can submit their curricula to the CDC for review. If approved, organizations can then seek recognition.

©Institute for Clinical and Economic Review, 2016 Page ES3 Final Evidence Report – Diabetes Prevention Programs Return to Table of Contents
Table ES1. Key Features of DPPs
Format Scalability Cost* Typical
Group Size Key
Resources Examples
In-person, individual coaching
Lowest Highest 1 Humans, facilities
DPP Trial
In-person, group coaching Medium Medium 8-15 Humans, facilities
Weight Watchers for Prediabetes Y
Digital, human coaching (virtual interaction)
High Medium 1-24 Humans, technology
Omada® (Omada Health, Inc.) Virtual Lifestyle Management (VLM™, Canary Health, Inc.)
Digital, fully-automated coaching (based on algorithms)
Highest Lowest 1+† Technology Alive-PD™ (Turnaround Health)
*Average costs and cost-offsets by program type are available in Appendix Table I2 † No group counseling, but participants can join optional virtual teams. The team size was 10 in the published trial.10
Coverage of DPPs by Health Plans and Purchasers
One of the major goals of the CDC and its NDPP partners is to increase access to DPPs by promoting health insurance coverage in both public and private settings. Medicare does not currently cover DPPs, but a proposal to expand coverage to Medicare beneficiaries was recently released for public comment; only one state Medicaid program (Montana) currently covers DPPs.11,12 There is wide variation among private health plans in their coverage of DPPs, but at least 30 private plans currently cover DPPs for some of their lines of business.13 Some private and public purchasers are incorporating DPPs into their health plans or wellness programs, or offering them as standalone benefits, but it is challenging to assess how extensive these practices are. Increased payer coverage of DPPs may be forthcoming based on 1) the aforementioned proposal to expand coverage of DPPs to all Medicare beneficiaries (using a 110 mg/dL FPG threshold to define prediabetes), 2) a CDC initiative to partner with two states to expand Medicaid coverage for DPPs, and 3) two US Preventive Services Task Force (USPSTF) recommendations that may be interpreted to relate to DPPs with a grade of B (i.e., services that must be covered by private plans without patient cost sharing to be compliant with the Affordable Care Act [ACA]).
Additional DPP Implementation Considerations
Despite several national and state efforts to increase awareness of prediabetes and the use of DPPs, the expansion of DPPs is challenged by several factors that are discussed in greater detail in the full report and include:

©Institute for Clinical and Economic Review, 2016 Page ES4 Final Evidence Report – Diabetes Prevention Programs Return to Table of Contents
1) A steep learning curve in terms of data collection and analysis requirements for DPPs seeking CDC recognition, as well as limitations on data sharing among providers, patients, DPP vendors, and plans;
2) A need for better, culturally-appropriate methods to reach underserved communities with populations at high risk of diabetes based on race/ethnicity, literacy, and income; and a need for innovative approaches to retain such participants in the year-long program;
3) A need for greater provider awareness of prediabetes and increased referral by providers of patients to DPPs, as well as more linkages between clinicians and DPPs;
4) The extensive efforts required to screen, identify, train, and retain skilled lifestyle program coaches who can connect to the community targeted by the DPP; and
5) A lack of awareness of prediabetes by many individuals who are at risk of developing diabetes and who must be willing to make a commitment to a year-long program of behavior change.
Comparative Clinical Effectiveness of DPPs
Since publication of the initial results of the DPP Trial, there have been more than 50 studies translating the lifestyle intervention to real world settings. Several systematic reviews found that these programs decrease body weight, decrease fasting plasma glucose, improve blood pressure and cholesterol levels, and prevent or delay the onset of type 2 DM.14-19 The CDC and the Community Preventive Services Task Force recently commissioned a review of programs that promote dietary changes and physical activity to prevent or delay the onset of diabetes.17 This high-quality systematic review and meta-analysis summarized 53 studies describing 66 diet and activity programs published through February 2015. They found that diet and exercise programs reduced diabetes incidence by 41% (95% confidence interval [CI]: 34% to 48%) compared with usual care. The programs also reduced body weight by 2.2% (95% CI: 1.4% to 2.9%) and FPG by 2.2 mg/dL (95% CI: 0.9 to 3.6 mg/dL). The more intensive programs, like the DPP Trial intervention, were more effective.17
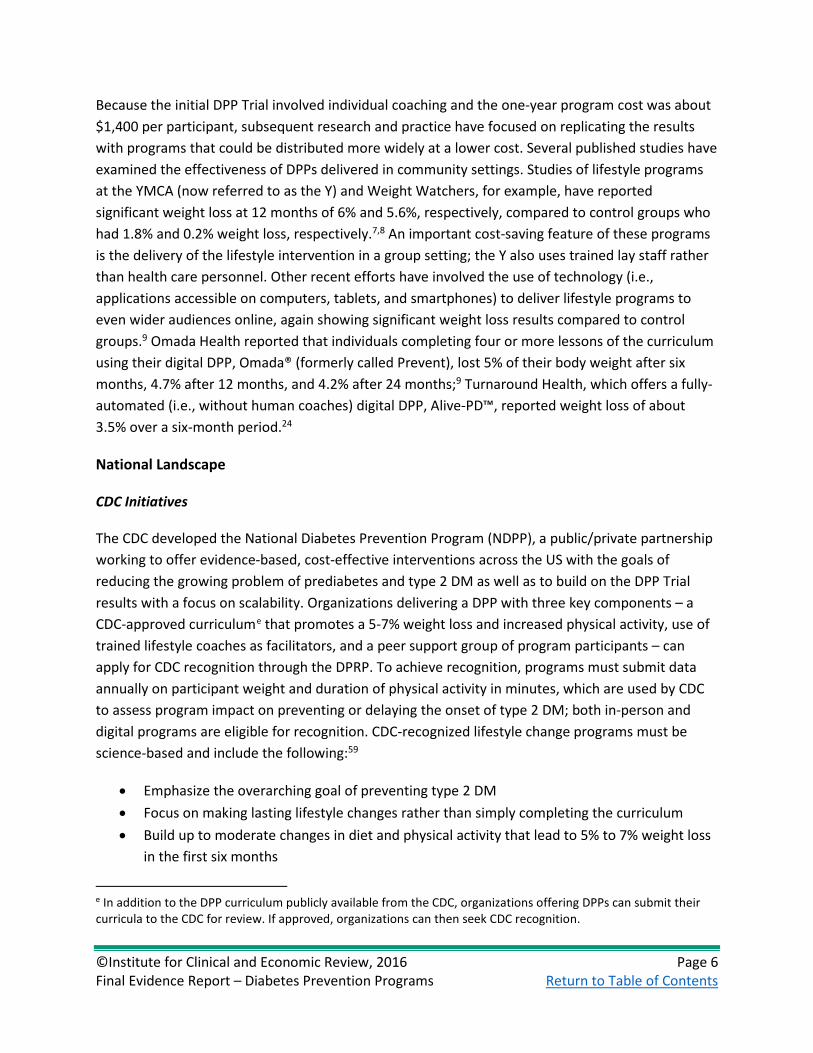
This evidence review summarizes the published literature for lifestyle interventions in the US that have full or pending recognition through the DPRP. The literature search identified 10 studies that met our inclusion criteria (five randomized controlled trials [RCTs] and five case-series using a pre-post design).7-9,20-34 The studies are grouped by degree of human contact ranging from in-person individual counseling performed on a weekly, one-on-one basis with a trained health care professional (DPP Trial) to digital with fully-automated counseling (Alive-PD). Studies using in-person group counseling were the most common, and included four studies in the Y system (formerly referred to as the YMCA), one supported by the Montana Department of Public Health and Human Services, one at Weight Watchers, and one at Wake Forest University.

©Institute for Clinical and Economic Review, 2016 Page ES5 Final Evidence Report – Diabetes Prevention Programs Return to Table of Contents
Quality of the Studies
The original DPP Trial was a large, good-quality trial with long enough follow-up (15 years) to assess the impact of the intervention on diabetes incidence.3 Three of the implementation trials were randomized trials of good quality (RAPID, Alive-PD, HELP-PD), though the Alive-PD trial has only published six-month outcomes.21,24,30 The lifestyle changes necessary to prevent or delay the development of diabetes need to be sustained for decades, so outcomes beyond the initial intensive intervention period are preferred. The two other randomized trials (DEPLOY, Weight Watchers) were judged to be of fair quality because of baseline differences between the groups and significant loss to follow-up.7,8
Among the pre-post case series, one (Omada, formerly called Prevent) was judged to be of fair quality; although case series provide weaker evidence than RCTs, the study included a careful description of the participants, and featured adequate length and completeness of follow-up, objective outcome measures, and appropriate analysis methods.9,33 The other four were judged to be of poor quality because of the small number of participants with prediabetes, the use of self-reported outcomes, and significant loss to follow-up.26,27,32,34
Weight Loss
In the DPP Trial, weight loss was the primary predictor of the reduction in diabetes incidence,4,5 ranging from a 35% reduction in diabetes incidence among participants with 0-3% weight loss to an 85% reduction in diabetes incidence for participants with >10% weight loss (see Figure ES1).5 Participants in the lifestyle intervention also had reductions in blood pressure and improvements in cholesterol measurements that may translate into additional benefits in the long term prevention of cardiovascular disease.35
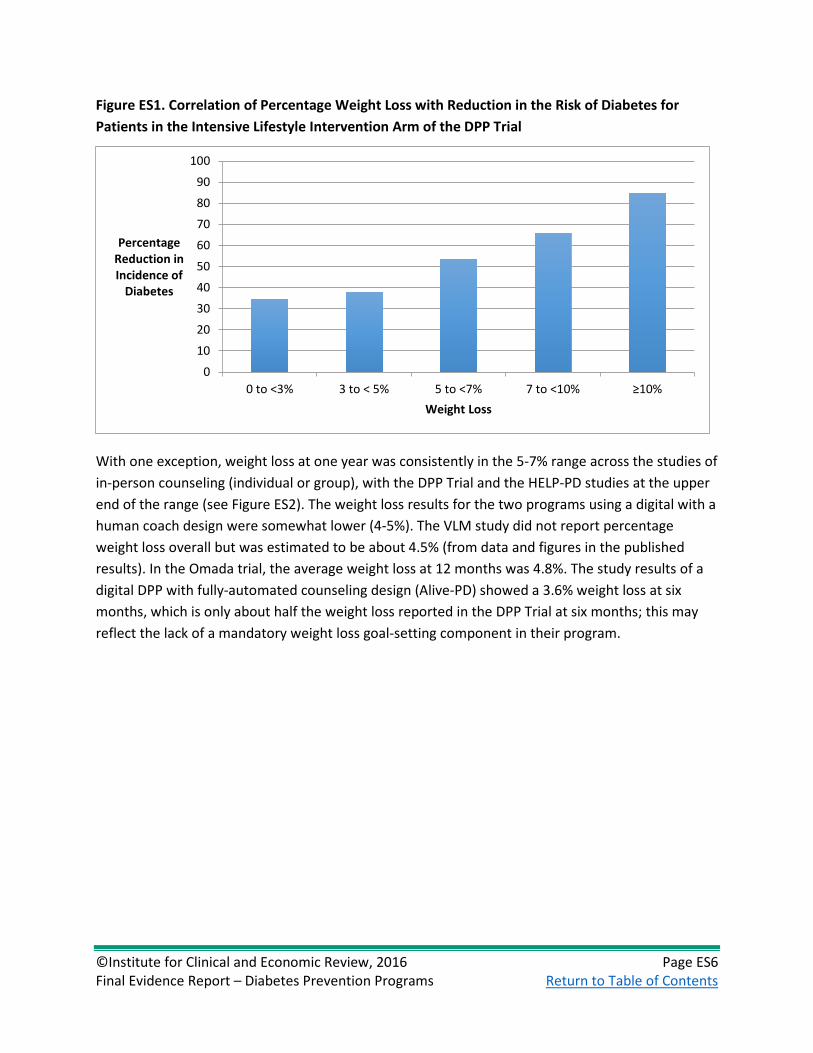
©Institute for Clinical and Economic Review, 2016 Page ES6 Final Evidence Report – Diabetes Prevention Programs Return to Table of Contents
Figure ES1. Correlation of Percentage Weight Loss with Reduction in the Risk of Diabetes for Patients in the Intensive Lifestyle Intervention Arm of the DPP Trial
With one exception, weight loss at one year was consistently in the 5-7% range across the studies of in-person counseling (individual or group), with the DPP Trial and the HELP-PD studies at the upper end of the range (see Figure ES2). The weight loss results for the two programs using a digital with a human coach design were somewhat lower (4-5%). The VLM study did not report percentage weight loss overall but was estimated to be about 4.5% (from data and figures in the published results). In the Omada trial, the average weight loss at 12 months was 4.8%. The study results of a digital DPP with fully-automated counseling design (Alive-PD) showed a 3.6% weight loss at six months, which is only about half the weight loss reported in the DPP Trial at six months; this may reflect the lack of a mandatory weight loss goal-setting component in their program.
0
10
20
30
40
50
60
70
80
90
100
0 to <3% 3 to < 5% 5 to <7% 7 to <10% ≥10%
Percentage Reduction in Incidence of
Diabetes
Weight Loss

©Institute for Clinical and Economic Review, 2016 Page ES7 Final Evidence Report – Diabetes Prevention Programs Return to Table of Contents
Figure ES2. Percentage Weight Loss at Six and 12 Months for Translational DPPs compared with the DPP Trial
* Estimated from results in publication
Glycemic Control
Half of the available studies reported some measure of change in glycemic control during follow-up. In the original DPP Trial, there was only a small reduction in HbA1c (-0.1%) and in FPG (-5 mg/dL) at one year in the lifestyle group. Among the in-person group counseling programs, the DEPLOY study had a similar reduction in HbA1c at six and 12 months (-0.1%); the Weight Watchers study reported a greater reduction in HbA1c at 12 months (-0.26%) but a smaller reduction in FPG (-2.8 mg/dL); and the HELP-PD study only reported changes in FPG (-4.5 mg/dL) at 12 months.
Among the digital with human coach programs, only the Omada study reported results, but the change in HbA1c (-0.4% at 12 months) was the largest reported of any program including the original DPP Trial. Interestingly, even though the Alive-PD program (digital with fully automated counseling) reported a relatively low percentage weight loss at 6 months (3.6%), the reductions in HbA1c (-0.3%) and FPG (-7.4 mg/dL) were greater than those observed in most other studies. This may reflect the greater focus on diabetes prevention and control as the primary goal of their dietary intervention rather than weight loss.
0123456789
10
% W
eigh
t Los
s
6 months
12 months
In-person/Group Digital/Human
Digital/ Automated
In-person/Individual

©Institute for Clinical and Economic Review, 2016 Page ES8 Final Evidence Report – Diabetes Prevention Programs Return to Table of Contents
Diabetes Incidence
Most of the studies of DPP implementations were of too short a duration to assess incident diabetes. The HELP-PD study (in-person group counseling) reported that the diabetes incidence at two years was non-significantly lower in the lifestyle group than in the usual care group (3.0% versus 8.7%, p=0.10). In the DPP Trial, the cumulative incidence of diabetes was approximately 4% in the lifestyle intervention group and 13% in the usual care group.36
Other Cardiovascular Risk Factors
The DPP Trial reported reductions in blood pressure and improvements in total and HDL-cholesterol levels (Appendix Table H10). These improvements, though small, could contribute to an overall reduction in cardiovascular disease independent of the reduction in diabetes incidence. Among the in-person group counseling programs, the DEPLOY study reported greater improvements in cholesterol than those reported in the DPP Trial. The Weight Watchers study reported similar reductions in blood pressure compared with the DPP Trial and a greater increase in HDL-cholesterol, but also a small increase in total cholesterol. Finally, the VLM study (digital with a human coach) reported twice the reduction in systolic blood pressure compared with the DPP Trial, but a slight increase in diastolic blood pressure. None of the other digital programs reported changes in blood pressure or cholesterol levels.
Harms
There was no excess rate of adverse events or serious adverse events in patients randomized to the lifestyle intervention in any of the randomized trials. The DPP Trial and other RCTs specifically assessed myalgias, arthralgias, fractures and other musculoskeletal complaints potentially arising from lifestyle interventions and no significant increases were observed for participants in the lifestyle group.
Controversies and Uncertainties
The degree of weight loss observed in translational DPP studies is somewhat less than that attained by participants in the DPP Trial, and the long-term sustainability of this weight loss has not yet been demonstrated. The primary uncertainty is whether the one-year weight loss observed in these studies will lead to a significant reduction in the incidence of diabetes in these patients and whether the reduction (or delay) in the diagnosis of diabetes will result in meaningful reductions in the complications of diabetes for patients with prediabetes. At 15 years of follow-up, there was no reduction in either microvascular disease or cardiovascular disease in the DPP Trial.
Additional controversy arises from the definition of prediabetes. In clinical practice, patients with prediabetes are usually diagnosed by measurement of FPG. In the US, the American Diabetes

©Institute for Clinical and Economic Review, 2016 Page ES9 Final Evidence Report – Diabetes Prevention Programs Return to Table of Contents
Association (ADA) defines an FPG of 100-125 mg/dL as prediabetes, but the World Health Organization (WHO) definition requires an FPG of 110-125. Patients with an FPG of 100-109 mg/dL are at lower risk for progression to type 2 diabetes and may receive less benefit from intensive lifestyle interventions. Furthermore, critics of the term “prediabetes” have raised concerns about the adverse effects of labeling patients given that those with prediabetes are at high risk for diabetes but do not yet have a diagnosed disease.37
Comparative Clinical Effectiveness: Summary and Comment
We judge the evidence for the CDC-recognized intensive lifestyle programs using an in-person group coaching design to provide an incremental or better (B+) net health benefit when compared to usual care for patients with prediabetes. There is no question that these programs yield modest weight loss in the short term compared with usual care. However, there is moderate certainty of a net benefit because of the uncertainties about the long-term durability of weight loss and the long-term improvements in health from the modest weight reductions demonstrated after one to two years of follow-up in the published studies.
We also judge the evidence for the CDC-recognized intensive lifestyle programs using a digital with human coach design to provide an incremental or better (B+) net health benefit when compared to usual care for patients with prediabetes. There is more uncertainty in this judgment than that for in-person group coaching because the number of studies is smaller (two) and because there are no good-quality trials. However, there is clearly modest weight loss with these programs through two years compared with usual care that is similar in magnitude to that observed with the in-person group coaching programs. There is uncertainty about the long-term durability of weight loss and subsequent long-term health improvements similar to that described for the in-person group counseling programs.
We judge the evidence for the CDC-recognized intensive lifestyle programs using a digital with fully-automated coaching design to provide comparable or better (C+) net health benefit when compared to usual care for patients with prediabetes. There is greater uncertainty of a net benefit for the fully-automated approach because there is only one trial, it only reported six-month outcomes, and the weight loss was qualitatively less than that observed in the original DPP Trial and the majority of the other translational programs. However, it was a high-quality randomized trial that showed statistically significant improvements in body weight and glycemic control compared with usual care.
We judge that there is Insufficient Evidence (I) to distinguish the efficacy of any one approach (in-person group counseling; digital with a human coach; digital with fully-automated counseling) from the others. There are no randomized trials or cohort studies that directly compare any two of the approaches, and the evidence base is currently too sparse to perform a network meta-analysis.

©Institute for Clinical and Economic Review, 2016 Page ES10 Final Evidence Report – Diabetes Prevention Programs Return to Table of Contents
Other Benefits or Disadvantages
The primary additional benefit would be the public health benefits that may result from decreasing weight and increasing physical activity of a large segment of the population. In addition to the likely reductions in diabetes and cardiovascular disease described above, there may be reductions in some of the many complications of obesity, including arthritis, sleep apnea, and esophageal reflux disease. Further, exercise has been proposed to improve mental health and quality of life, and to decrease long-term disability.
Comparative Value of DPPs
We reviewed the published literature for analyses that have examined the economic impact of DPPs in the US with full or pending recognition from the CDC DPRP. We also explored the potential health system budget impact of DPPs over a shorter-term time horizon, utilizing published or otherwise publicly-available information on program planning, implementation, and ongoing treatment costs; any cost offsets; and the potential population eligible for such services.
Cost-Effectiveness Analyses
Li et al. conducted a systematic review of economic analyses of “diet and physical activity promotion programs with at least two sessions over at least three months delivered to persons at increased risk for type 2 DM.”38 Overall, the median cost per quality-adjusted life-year (QALY) gained for the eight US-based analyses was $9,824, with an interquartile range of $1,930 to $41,982 per QALY gained. However, the authors noted that few studies included information on recruitment costs, or on the cost to implement and scale up these programs.
In-person, Individual Coaching
DPP Trial
The DPP Research Group has conducted multiple analyses based on the DPP Trial. From a health system perspective, the cost per QALY for the intensive lifestyle intervention decreased as the time horizon increased, from $32,000/QALY at three years,39 to $13,000/QALY at 10 years,40,41 and $1,100/QALY using a lifetime time horizon.42
In contrast to the above analyses, Eddy et al. conducted a cost-effectiveness analysis (CEA) of the DPP lifestyle intervention using the Archimedes model, which simulates detailed anatomic and physiologic components of several diseases.43 Over a 30-year time horizon, they found that the DPP Trial intervention would cost approximately $143,000 per QALY gained from a health system perspective. The primary differences from the DPP Research Group models were that Eddy et al. assumed that the clinical benefits of the DPP would diminish over time, that there would be a lower

©Institute for Clinical and Economic Review, 2016 Page ES11 Final Evidence Report – Diabetes Prevention Programs Return to Table of Contents
rate of glycemic progression (i.e., slower progression from prediabetes to type 2 diabetes, and from type 2 diabetes diagnosis to complications). Their health system perspective analysis also assumed a rate of participant turnover, which would lead to higher estimated cost-effectiveness ratios than in the DPP Trial evaluations.
In-person, Group Coaching
DPP Trial
As part of the DPP Research Group’s within-trial CEA of the DPP Trial,39 they evaluated the DPP as a group intervention rather than an individual one, assuming lower costs but equal effectiveness. The group DPP was estimated to cost $4,500 per diabetes case prevented and $9,000 per QALY gained from a health system perspective at three years. In their evaluation of the lifetime cost-effectiveness of the DPP Trial intervention, Herman and colleagues42 also estimated the impact if costs could be reduced by implementing the lifestyle intervention in groups of 10 participants rather than one-to-one coaching, assuming equal clinical effectiveness. They estimated that the program would be cost-saving over a lifetime, even if effectiveness were reduced by 50%. Finally, Eddy et al.43 evaluated a scenario where the DPP was provided as a group intervention costing $217 per year, and they estimated a cost per QALY of $27,000 from a health system perspective.
Y DPP
RTI International44 conducted an evaluation of the Y DPP using claims analysis based on the Centers for Medicare & Medicaid Services’ (CMS) Chronic Conditions Data Warehouse through 2014. The authors compared 1,679 participants to propensity score-matched Medicare beneficiaries diagnosed with prediabetes, and found statistically significant reductions in spending for the treatment group in the first five calendar quarters of the program with no significant differences in subsequent quarters. The overall weighted average quarterly spending differential was calculated as $455 per member per quarter.
The CMS Office of the Actuary developed a model to project net costs per beneficiary over a lifetime horizon, as detailed in a Certification of Medicare DPP memorandum.45 The model estimated net costs or savings per year from lowering the probability of progression to type 2 diabetes and thus delaying diabetes-related costs, and it assumed that the Medicare DPP expansion would be somewhat less effective than the DPP Trial because it was less intensive. Their analysis estimated that near-term savings would be offset by higher Medicare spending due to lower mortality, making it unclear whether the DPP expansion would break even over a lifetime horizon. If the mortality reduction is ignored (as required in the certification process), the model suggested that the DPP would reduce Medicare expenditures.

©Institute for Clinical and Economic Review, 2016 Page ES12 Final Evidence Report – Diabetes Prevention Programs Return to Table of Contents
Digital, Human Coaching
Omada (Omada Health)
A recent analysis examined the return on investment (ROI) of the Omada digital DPP.46 A Markov-based model with a 10-year time horizon was used to compare Omada DPP participants with propensity score-matched community controls with prediabetes. Their simulation found a break-even point at three years, with a positive ROI of $1,565 at five years. One limitation of this study is that it relied on only 26 weeks of weight loss data from Omada participants, which required assumptions about longer-term weight loss.
VLM (Canary Health)
Smith et al. assessed the cost-effectiveness of the VLM DPP using a Markov model with a 10-year time horizon.47 Costs and changes in weight came from a pre-post study of the VLM intervention, which estimated an incremental cost of $458 and incremental gain of approximately 0.06 QALYs compared to usual care in a hypothetical cohort without diabetes. They estimated that the intervention would cost approximately $7,800 per QALY gained from a health system perspective. Using a $100,000 per QALY threshold, the intervention was found to be cost-effective in over 95% of model iterations in a probabilistic sensitivity analysis. However, it should be noted that these results are based on data from one study using a one-year before/after design in only 50 patients, 14 of whom already had diabetes.
Digital, Fully-automated Coaching
We were unable to locate any publicly-available CEAs of digital DPPs with fully-automated coaching.
Potential Budget Impact
We also estimated the potential budget impact of different types of DPPs among candidate populations for such treatment in the US. Our estimates are based on those found in the published and grey literature for in-person and digital human coached programs; no published data were available for digital fully automated DPPs. We combined estimates of the mean cost per participant with estimates of the prediabetes population potentially eligible for DPPs, as well as different assumed levels of uptake of such programs.
Potential budget impact was defined as the total incremental cost of DPPs for the enrolled population, calculated as the incremental health care costs of DPPs minus any health care costs that were offset in enrolled participants. All costs were undiscounted and estimated over one- and five-year time horizons. The five-year timeframe was of primary interest, given the potential for cost offsets to accrue over time. The candidate population size is approximately 93.7 million individuals in the US using FPG of 100-125 mg/dL as the definition of prediabetes, and approximately 31.2

©Institute for Clinical and Economic Review, 2016 Page ES13 Final Evidence Report – Diabetes Prevention Programs Return to Table of Contents
million individuals using 110-125 mg/dL.48 We assumed that 2% of the eligible population would enroll in each year.
Over the entire five-year time horizon, 10% uptake for individuals meeting the ADA definition (i.e., including individuals with FPG of 100-109 mg/dL) would lead to approximately 9.4 million individuals enrolled in a DPP for one or more years. Across this timeframe, the weighted potential budget impact (i.e., adjusted for differing periods of utilization and associated cost-offsets) for in-person individual programs is approximately $2,800 per participant, leading to an average annual potential budget impact of approximately $5.2 billion. Estimated savings from enrollment in in-person group programs, which are cost-saving after one year, continue to accrue over five years, resulting in estimated potential savings of $2.2 billion per year. Digital programs with human coaches increase costs by $220 million over a one-year time horizon, but generate potential cost savings of approximately $1.2 billion over a five-year time horizon. Preliminary analyses suggest that digital automated DPPs appear to be cost-saving at one and five years, although no published data are available (see section 6.3 for analyses based on unpublished data). Results of the potential budget impact analysis using the broader definition of prediabetes are presented in Table ES2, while results using the narrower definition can be found in section 6.3 of the full report.
Table ES2. Total Potential Budget Impact (BI) of DPPs Based on 10% Uptake at One and Five Years Using FPG of 100-125 mg/dL (n=9,366,203)*
DPP Type
1-Year Analytic Horizon 5-Year Analytic Horizon Number Enrolled
(millions)
Annual BI per
Participant ($)† Total BI (billions)
Number Enrolled (millions)
Weighted BI per Participant ($)*
Average BI per year (billions)
In-person, Individual Coaching
1.87 $1,902 $3.56 9.37 $2,793 $5.23
In-person, Group Coaching
1.87 -$455 -$0.85 9.37 -$1,146 -$2.15
Digital, Human Coaching
1.87 $117 $0.22 9.37 -$618 -$1.16
* Preliminary estimates for digital fully-automated programs are reported in separately (see section 6.3), as no published or publicly-presented data were available. †Weighted budget impact calculated by subtracting cost offsets from DPP costs for one-year horizon. For five-year horizon, DPP costs and cost offsets apportioned assuming 20% of patients in uptake target initiate therapy each year Figure ES3 demonstrates the variation in potential budget impact levels associated with different uptake assumptions when using the 100-125 mg/dL definition. Varying rates of uptake using the 110-125 mg/dL definition would result in a similar pattern (see Appendix Figure I1), but with smaller annualized costs for individual in-person programs and smaller annualized savings for in-person group and digital human-coached programs.

©Institute for Clinical and Economic Review, 2016 Page ES14 Final Evidence Report – Diabetes Prevention Programs Return to Table of Contents
Figure ES3. Potential Budget Impact Graph for DPPs Provided to Varying Proportions of the US Population with FPG 100-125 mg/dL
Note: Colored lines represent the annualized potential budget impact of different uptake patterns (percent of eligible population enrolled) for each type of DPP.
Comparative Value: Summary and Comment
With one exception,43 the consensus in the literature is that the cost-effectiveness of an in-person DPP at the individual level is well below commonly-accepted thresholds. Providing the program in a group setting appears to be cost-saving over time, with little or no apparent loss in effectiveness relative to individual coaching. Delivering the DPP via digital adaptations with human coaches also appears to be cost-effective or cost-saving, although these findings are based on fewer studies with only short-term effectiveness data available to date. We were unable to find any published evaluations of the cost-effectiveness of digital fully-automated programs for delivery of a DPP. While online adaptations are less costly than in-person DPPs, longer-term studies are needed to determine whether online versions of the DPP will provide comparable effectiveness over time. In addition, it should be noted that analyses sometimes differed in how they defined program participation (e.g., enrollment vs. completion) and in how that relates to program costs; more standardized definitions would make comparisons across program types more comparable.
Our estimates of the short-term potential budget impact of these programs were more variable and depended on using averages across relatively sparse data, especially for the digital programs. Using averages of the available data within program type and the assumptions in our analysis, in-person individual DPPs had positive annual budget impacts over five years, while in-person group and digital coached programs appear to be cost-saving in the short-term. We estimated that a digital
In-Person Individual
In-Person Group
Digital Coached
-$15
-$10
-$5
$0
$5
$10
$15
$20
$25
$30
0% 25% 50%
Annu
al B
udge
t Im
pact (
Billi
ons)
% Eligible Patients Treated
©Institute for Clinical and Economic Review, 2016 Page ES15 Final Evidence Report – Diabetes Prevention Programs Return to Table of Contents
fully-automated program was relatively budget neutral or slightly cost-saving, but available data was most limited for this category of programs.
A limitation of this analysis is that there was wide variation in the 1) sources of data and 2) the number and types of analyses performed, which may influence the comparability of results across program types. It should also be noted that this analysis was based on annual program costs that did not include development or start-up costs for these programs, which may be substantial. One area where further research would be helpful is the tabulation of such costs, as well as detailed cost and cost offset data from implementations of DPPs in different settings.
Furthermore, our estimates of levels of DPP uptake in the health care system by five years were based on arbitrary assumptions, so actual uptake may not reach these levels this quickly. In addition, the costs used in our analysis came from a specific set of programs, and so may not be representative of the costs for such programs in other settings in the US.
Finally, further data on the long-term effectiveness of these programs in maintaining weight loss and diabetes risk reductions would confirm whether these programs will actually be cost-effective or cost-saving over time. This would be especially useful for the newer, digital adaptations of the DPP. There is also a need for data on the costs and effectiveness of these programs in different populations and settings, evaluation of the efficacy of maintenance modules of the digital programs, and a need to measure the efficiency of extending these programs to lower-risk groups.
CTAF Votes on Comparative Clinical Effectiveness and Care Value
During CTAF public meetings, the CTAF Panel deliberates and votes on key questions related to the systematic review of the clinical evidence, an economic analysis of the applications of the medical technologies or treatments under examination, and the supplementary information presented. Because any judgment of evidence is strengthened by real-life clinical and patient perspectives, subject matter experts are recruited for each meeting and provide input to the CTAF Panel, serve as a resource to the Panel during their deliberation, and help form recommendations with the Panel on ways the evidence can be applied to policy and practice.
In its deliberations and voting related to value, the CTAF Panel made use of a value assessment framework with four different components of care value, a concept which represents the long-term perspective, at the individual patient level, on patient benefits and the incremental costs to achieve those benefits. The four components of care value are comparative clinical effectiveness, incremental cost per outcomes achieved, additional benefits or disadvantages, and contextual considerations regarding the illness or therapy.

©Institute for Clinical and Economic Review, 2016 Page ES16 Final Evidence Report – Diabetes Prevention Programs Return to Table of Contents
Figure ES4. Care Value Framework
CTAF Panel Voting Results
For the purposes of these voting questions, prediabetes is defined using the American Diabetes Association (ADA) criteria of HbA1c 5.7 – 6.4%, fasting plasma glucose (FPG) of 100 – 125 mg/dL, or two-hour oral glucose tolerance test (OGTT) 140 – 199 mg/dL. Usual care is defined as a discussion between a provider and patient and/or provision of educational materials regarding the risk for diabetes and recommendations to decrease weight and increase exercise.
1. For patients with prediabetes, is the evidence adequate to demonstrate that the net health benefit of participation in an in-person diabetes prevention program (DPP) with group coaching is superior to that of usual care?
CTAF Panel Vote: 12 Yes (100%) 0 No (0%)
2. Given the available evidence for patients with prediabetes, what is the care value of participation in an in-person DPP with group coaching vs. usual care?
CTAF Panel Vote a. 1 Low (8%) b. 4 Intermediate (33%) c. 7 High (58%)
3. For patients with prediabetes, is the evidence adequate to demonstrate that the net health benefit of participation in a digital DPP with human coaching is superior to that of usual care?
CTAF Panel Vote: 11 Yes (92%) 1 No (8%)
4. Given the available evidence for patients with prediabetes, what is the care value of participation in a digital DPP with human coaching vs. usual care? CTAF Panel Vote: a. 2 Low b. 6 Intermediate (50%) c. 4 High (33%)

©Institute for Clinical and Economic Review, 2016 Page ES17 Final Evidence Report – Diabetes Prevention Programs Return to Table of Contents
5. For patients with prediabetes, is the evidence adequate to demonstrate that the net health benefit of participation in a digital DPP with fully-automated coaching is superior to that of usual care?
CTAF Panel Vote: 3 Yes (25%) 9 No (75%)
6. Given the available evidence for patients with prediabetes, what is the care value of participation in a digital DPP with fully-automated coaching vs. usual care?
Vote not taken due to inadequate evidence
Key Policy Recommendations
At the June 24, 2016 public meeting, the CTAF Panel and a policy roundtable composed of clinical experts, health insurers, health policy experts, and a DPP participant discussed various policy options for improving access to and provision of diabetes prevention programs (see Table 8 in the full report for a list of policy roundtable participants). These recommendations are presented below, and additional detail is provided in Chapter 8 of the full report.
For Payers
1. Cover DPPs from CDC-recognized providers across all lines of business and products. Make them available with zero copayments to encourage participation.
2. There is no single DPP format (e.g., in-person programs delivered to a group or digital programs with human coaches) that works for everyone, so make a variety of DPPs available to support patient preference.
3. Establish pay-for-performance (P4P) contracts with DPP providers based on patient participation, retention in program, and achievement of weight loss goals.
4. Payers should encourage their clinical networks to support both active outreach and screening for prediabetes using standard blood glucose tests such as FPG and HbA1c.
For Clinicians
1. Use both opportunistic encounters and active outreach to screen patients for prediabetes risk. For patients at high risk and with a BMI ≥ 24 kg/m2 (≥ 22 kg/m2 for patients of Asian descent), conduct an FPG or HbA1c test to detect prediabetes.
2. Refer patients to a local or online DPP as soon as prediabetes is detected, since that is the time people are most motivated to participate. DPPs are more effective than usual care (physician recommendations for weight loss and exercise), and even delaying the onset of diabetes by just a few years is beneficial to and desired by patients.

©Institute for Clinical and Economic Review, 2016 Page ES18 Final Evidence Report – Diabetes Prevention Programs Return to Table of Contents
For DPP Providers
1. DPP providers should apply for and obtain CDC recognition for their programs. 2. Tailor DPPs to include culturally-appropriate curricula for America’s diverse populations. 3. Commit to pay-for-performance (P4P) contracts with purchasers and payers that base payment
on participation, retention, and weight-loss outcomes.
For Policymakers
1. Implement environmental policies that promote physical activity and healthy eating and support healthy individual choices.
For the General Public
1. Individuals who are overweight or obese should take this short survey or talk with their doctor about taking a blood test to see if they have a condition called prediabetes.
2. People with prediabetes should participate in one of the available diabetes prevention programs (DPPs). These programs come in many forms, from in-person group meetings with a human coach, to online programs with human or automated coaching. Individuals should choose a program that meets their needs.
3. Encourage policies that promote healthy environments in workplaces, schools, and community settings. This will support lifestyle changes and help people get more exercise, eat foods that are healthier, and lose weight.
For Purchasers
1. Employers should include DPPs in their suite of wellness benefits and encourage contracted health plans to cover DPPs.
2. Create a work environment that supports healthy choices in cafeterias, vending machines, office meetings, and facilities. Develop an organizational culture in which senior leadership actively supports healthy choices.
Future Research Needs
1. Because there are still critical gaps in the evidence on DPPs, larger DPP organizations should collect, analyze, and publish their own experience in peer-reviewed health journals. Smaller, community-based programs should consider partnerships with their parent organizations or local academic institutions to publish analyses of their programs.
2. Identify which patients are most likely to succeed in the various types of in-person or digital programs.
3. Identify specific program elements that are associated with participant success.

©Institute for Clinical and Economic Review, 2016 Page ES19 Final Evidence Report – Diabetes Prevention Programs Return to Table of Contents
4. Examine the role of maintenance sessions delivered after the year-long DPP curriculum ends. DPP providers should develop and test maintenance modules and ongoing support lessons in collaboration with the CDC.
5. Examine the long-term impact of DPPs on population health, diabetes prevention, and on health care utilization and costs.

©Institute for Clinical and Economic Review, 2016 Page 1 Final Evidence Report – Diabetes Prevention Programs Return to Table of Contents
1. Background 1.1 Introduction
The Centers for Disease Control and Prevention (CDC) estimates that 29.1 million Americans, or 9.3% of the population, have diabetes and 1.7 million adults are newly diagnosed with diabetes each year.49 According to the CDC National Center for Chronic Disease Prevention and Health Promotion, approximately 86 million Americans age 20 and older (37%) have prediabetes (i.e., blood glucose levels higherc than normal but not high enough to be diagnosed with type 2 diabetes) and 90% of those with prediabetes do not know they have it.1 Obesity is strongly associated with both prediabetes and diabetes. Nationally representative data for the United States (US) show that the prevalence of diabetes increases from 8% of individuals with normal weight to 15% of those who are overweight, and 23% to 43% of those who are obese.50 Similarly, the prevalence of prediabetes increases from 28% of individuals with normal weight to 36% of those who are overweight, and 40% of those who are obese.51 Interventions to prevent or delay the development of diabetes have the potential both to improve individual health and quality of life through disease avoidance (e.g., eye, kidney, and nerve damage; strokes; heart attacks) and to save the health care system substantial medical costs by reducing the incidence of diabetes and its associated complications. Without such interventions, it is estimated that 15-30% of individuals with prediabetes will develop diabetes within five years.1 Clinical guidelines developed by professional societies and the US Preventive Services Task Force (USPSTF) recommend behavioral counseling for a healthy lifestyle, a core component of such interventions, for those with prediabetes (see Appendix D).
The costs of diabetes were estimated to total $245 billion in 2012 ($176 billion for direct medical costs and $69 billion in indirect cost due to disability, lost productivity, and premature death).49 The additional medical costs associated with elevated blood glucose levels for people with prediabetes were $44 billion in 2012.52
In California, a recent study by the University of California, Los Angeles (UCLA) found that 13 million adults (age 18 or above) in the state (approximately 46% of the state adult population) have prediabetes or undiagnosed diabetes and about 2.5 million have diabetes (9%).2 The UCLA study does not include separate estimates of the number of people with prediabetes or undiagnosed diabetes, although it is noted that nationally about 3.9% of adults have undiagnosed diabetes.2,53, d
c Hemoglobin A1c (HbA1c) between 5.7 and 6.5%, fasting plasma glucose (FPG) between 100-125 mg/dL, and oral glucose tolerance test (OGTT) between 140 and 199 mg/dL. d Methodological differences are believed to account for most of the difference between the national and California prevalence rates.

©Institute for Clinical and Economic Review, 2016 Page 2 Final Evidence Report – Diabetes Prevention Programs Return to Table of Contents
This study also estimated that the economic burden for adult Californians with diabetes totals more than $27 billion ($19 billion for direct medical expenses and $8 billion for indirect costs associated with diabetes), with another $8.1 billion in direct medical care costs estimated for individuals with prediabetes ($5.3 billion) and undiagnosed diabetes ($2.8 billion).
The Diabetes Prevention Program Trial (DPP Trial) demonstrated that the incidence of diabetes could be reduced using intensive diet and lifestyle counseling for individuals at high risk for developing diabetes.3 In addition, the lifestyle intervention improved the quality of life for participants.54 Since publication of the trial results in 2002, many commercial programs have been developed to implement a scalable version of the DPP Trial intervention using fewer resources.
Scope of the Assessment
The scope for this assessment is described below using the PICOTS (Population, Intervention, Comparators, Outcomes, Timing, and Settings) framework. Evidence was culled from randomized controlled trials (RCTs) and comparative cohort studies as well as high-quality systematic reviews where available. We also included case series that met certain quality criteria (e.g., sample retention, consecutive patients, clearly-defined entry criteria, sample size thresholds, length of follow-up thresholds), and described data from these studies separately. We supplemented our review of published studies with data from regulatory documents, information submitted by vendors, and other grey literature when the evidence met ICER standards (for more information, see http://icer-review.org/methodology/icers-methods/icer-value-assessment-framework/grey-literature-policy/).
Analytic Framework
The analytic framework for this assessment is depicted in Figure 1.
Figure 1. Analytic Framework
AE: adverse event, BMI: body mass index, FPG: fasting plasma glucose, HbA1c: hemoglobin A1c, HRQOL: health-related quality of life, OGTT: oral glucose tolerance test

©Institute for Clinical and Economic Review, 2016 Page 3 Final Evidence Report – Diabetes Prevention Programs Return to Table of Contents
Populations
The population of focus for the review was adults ages 18 and older with prediabetes. We attempted to examine the impact of different definitions of prediabetes on the outcomes of interest, but there was insufficient data to perform this analysis.
Interventions
The interventions of interest included lifestyle interventions to prevent or delay the development of type 2 diabetes mellitus (DM) that have full or pending recognition from the CDC Diabetes Prevention Recognition Program (DPRP), including programs incorporating smartphone and web-assisted delivery methods. Medical and surgical therapies were not considered. ICER previously reviewed the evidence on the clinical effectiveness and value of multiple drug, device, and surgical approaches to weight loss, an outcome that is frequently used as a surrogate for diabetes prevention or delay, in a July 2015 report for CTAF.55
Comparators
Wherever possible, we sought head-to-head studies of these interventions. In the absence of head-to-head studies, the primary comparator was usual care, which in clinical practice is a discussion between a provider and patient and/or provision of educational materials regarding the risk for diabetes and recommendations to lose weight and increase exercise.
Outcomes
This review examined clinical and health care utilization outcomes related to lifestyle interventions to prevent or delay the development of diabetes that have full or pending recognition from the CDC DPRP. Listed below are the outcomes of interest:
• Incidence of type 2 DM • Hemoglobin A1c as a measure of glycemic control • Fasting plasma glucose as a measure of glycemic control • Glucose tolerance test at 2 hours as a measure of glycemic control • Change in body weight and body mass index (BMI) • Change in physical activity • Retention in program • Measures of functional status, and/or health-related quality of life • Harms (musculoskeletal, adverse events (AEs) from labeling, learning of risk, other AEs) • Costs and cost-effectiveness of diabetes prevention programs

©Institute for Clinical and Economic Review, 2016 Page 4 Final Evidence Report – Diabetes Prevention Programs Return to Table of Contents
Timing
Evidence on intervention effectiveness and harms was derived from studies of at least one year’s duration in order to capture the maintenance phase of the intervention, as many people quickly regain weight that has been lost following dieting. Information from studies greater than one year in duration also allowed for a more complete examination of important program effects on long-term clinical outcomes.
Settings
All relevant settings were considered, including telephonic, online, clinic, employer-based, community-based, and hybrid settings in the US.
In addition to conducting a review of available literature and analyzing the comparative value of diabetes prevention programs (DPPs), ICER conducted 34 semi-structured telephone interviews with key stakeholders involved in the design and delivery of interventions seeking to prevent or delay the onset of diabetes. We sought perspectives from federal and state government, public and private payers, public and private purchasers, patient advocacy organizations, and vendors. A full methodology and a list of organizations represented in interviews are available in Appendices A and B.
This report addresses several key issues related to DPPs for patients, provider organizations, payers, and other policymakers and includes: 1) a landscape analysis of available DPP approaches; 2) a comparative effectiveness evaluation of DPPs; and 3) an assessment of the costs, cost-effectiveness, and potential budget impact of DPPs.

©Institute for Clinical and Economic Review, 2016 Page 5 Final Evidence Report – Diabetes Prevention Programs Return to Table of Contents
2. The Topic in Context 2.1 National and California Landscape
As noted in Chapter 1, prediabetes refers to blood glucose levels higher than normal but not high enough to be diagnosed with type 2 diabetes. There is some controversy about how prediabetes is defined clinically, but in practice, diagnosis involves the establishment of impaired fasting glucose (IFG) through measurement of FPG, or impaired glucose tolerance (IGT), through the administration of a two-hour oral glucose tolerance test (OGTT) (see Table 1). In the US, the American Diabetes Association (ADA) defines a FPG of 100-125 mg/dL as prediabetes, and this is the definition that the CDC uses in its estimates.56,57 In contrast, the World Health Organization (WHO) definition requires a FPG of 110-125.58 Patients with a FPG of 100-109 mg/dL are at lower risk for progression to type 2 diabetes and may receive less benefit from intensive lifestyle interventions. As explained in section 6.3, use of a FPG threshold for prediabetes of 110 mg/dL rather than 100 mg/dL decreases the number of people estimated to have prediabetes by about two-thirds. HbA1c may also be used to diagnose prediabetes, though there is some disagreement regarding the appropriateness of its use. The ADA defines HbA1c values from 5.7%-6.4% as prediabetes, while the WHO does not recommend the use of HbA1c to diagnose prediabetes.56,57
Table 1. ADA and WHO Definitions of Prediabetes
Organization HbA1c FPG OGTT ADA 5.7 – 6.4% 100 – 125 mg/dL 140 – 199 mg/dL WHO N/A 110 – 125 mg/dL 140 – 199 mg/dL
HbA1c: hemoglobin A1c, FPG: fasting plasma glucose, OGTT: oral glucose tolerance test Studies have shown that 5-7% weight loss can prevent or delay the development of diabetes in people with elevated levels of blood sugar consistent with prediabetes, and many clinicians and researchers use weight loss as a surrogate measure for effective prevention of diabetes.4,5 The Diabetes Prevention Program Trial (DPP Trial) demonstrated that the incidence of diabetes could be reduced using intensive diet and lifestyle counseling for individuals with prediabetes who were at high risk for developing diabetes.3 This study randomized over 3,200 individuals with elevated glucose levels to one of three interventions: metformin plus standard lifestyle recommendations, placebo plus standard lifestyle recommendations, and an intensive lifestyle modification program. Results showed that a structured intensive behavioral counseling intervention involving a low-fat diet and increased physical activity lowered body weight by approximately 7% after one year, decreasing to a reduction of about 4% after four years; this weight loss led to a 58% reduction in the risk of progressing to type 2 diabetes over three years compared with standard lifestyle recommendations plus a placebo.3,6 The lifestyle intervention was also more effective than drug therapy with metformin, an antidiabetic agent that has also been shown to promote weight loss.3
©Institute for Clinical and Economic Review, 2016 Page 6 Final Evidence Report – Diabetes Prevention Programs Return to Table of Contents
Because the initial DPP Trial involved individual coaching and the one-year program cost was about $1,400 per participant, subsequent research and practice have focused on replicating the results with programs that could be distributed more widely at a lower cost. Several published studies have examined the effectiveness of DPPs delivered in community settings. Studies of lifestyle programs at the YMCA (now referred to as the Y) and Weight Watchers, for example, have reported significant weight loss at 12 months of 6% and 5.6%, respectively, compared to control groups who had 1.8% and 0.2% weight loss, respectively.7,8 An important cost-saving feature of these programs is the delivery of the lifestyle intervention in a group setting; the Y also uses trained lay staff rather than health care personnel. Other recent efforts have involved the use of technology (i.e., applications accessible on computers, tablets, and smartphones) to deliver lifestyle programs to even wider audiences online, again showing significant weight loss results compared to control groups.9 Omada Health reported that individuals completing four or more lessons of the curriculum using their digital DPP, Omada® (formerly called Prevent), lost 5% of their body weight after six months, 4.7% after 12 months, and 4.2% after 24 months;9 Turnaround Health, which offers a fully-automated (i.e., without human coaches) digital DPP, Alive-PD™, reported weight loss of about 3.5% over a six-month period.24
National Landscape
CDC Initiatives
The CDC developed the National Diabetes Prevention Program (NDPP), a public/private partnership working to offer evidence-based, cost-effective interventions across the US with the goals of reducing the growing problem of prediabetes and type 2 DM as well as to build on the DPP Trial results with a focus on scalability. Organizations delivering a DPP with three key components – a CDC-approved curriculume that promotes a 5-7% weight loss and increased physical activity, use of trained lifestyle coaches as facilitators, and a peer support group of program participants – can apply for CDC recognition through the DPRP. To achieve recognition, programs must submit data annually on participant weight and duration of physical activity in minutes, which are used by CDC to assess program impact on preventing or delaying the onset of type 2 DM; both in-person and digital programs are eligible for recognition. CDC-recognized lifestyle change programs must be science-based and include the following:59
• Emphasize the overarching goal of preventing type 2 DM • Focus on making lasting lifestyle changes rather than simply completing the curriculum • Build up to moderate changes in diet and physical activity that lead to 5% to 7% weight loss
in the first six months
e In addition to the DPP curriculum publicly available from the CDC, organizations offering DPPs can submit their curricula to the CDC for review. If approved, organizations can then seek CDC recognition.

©Institute for Clinical and Economic Review, 2016 Page 7 Final Evidence Report – Diabetes Prevention Programs Return to Table of Contents
• Discuss strategies for self-monitoring of diet and physical activity, building participant self-efficacy and social support to maintain lifestyle changes, and problem-solving to overcome common weight loss, physical activity, and healthy eating challenges
• Provide participant materials to support program goals
DPPs are required to submit data on weight loss, physical activity, and participant retention/class attendance. Only year-long programs are eligible for CDC recognition and under the 2015 DPRP standards, organizations must have an average session attendance of nine during months one through six and an average session attendance of three monthly sessions during months seven through 12. At least one session per month must be held in each of months seven through 12.60 In CDC-recognized DPPs, participants must be aged 18 years or older and have a BMI ≥24 kg/m2 (≥22 kg/m2 if Asian). Also, at least 50% of a program’s participants must be determined to be eligible by biometric markers such as blood test results while a maximum of 50% of participants may be determined as eligible based on the results of a seven-question prediabetes screening test (see Appendix Table C1). As shown in Table 2, the number of programs with pending or full recognition status has greatly increased since 2012, and as of March 31, 2016, there were 54 organizations with full recognition and over 780 with pending recognition.
Table 2. Number of DPPs Recognized by the CDC DPRP by Year61
Year Number of Organizations with
Pending Recognition Status†
Number of Organizations
with Full Recognition Status†
Total Organizations with
Pending/Full Recognition Status†
2012 218 N/A* 218 2013 447 N/A* 447 2014 510 9 519 2015 706 25 731 As of 03/31/16
787 54 841
*Not applicable, as the evaluation for full DPRP recognition takes at least two years
†All numbers reflect end-of-year DPRP recognition status (except for 2016) and do not account for the specific time an organization applied for recognition In March 2016, CDC released a revised curriculum, “Prevent T2,” that reflects new literature on self-efficacy, physical activity, diet, and sleep; the curriculum was developed in English at a 6th grade reading level and in Spanish at a 5th grade reading level (i.e., it was not simply translated from English to Spanish) and is available for free to anyone. The one-year program has a 26-module core curriculum that emphasizes self-monitoring, self-efficacy, and problem solving; 16 modules must be delivered in the first six months of the program and at least six of the remaining 10 modules in the next six months (see Appendix Table C3 for an overview of curriculum content). Program goals include 1) increased physical activity to at least 150 minutes per week, 2) 5% or greater weight loss within six months, and 3) maintenance of weight loss throughout the program and beyond.

©Institute for Clinical and Economic Review, 2016 Page 8 Final Evidence Report – Diabetes Prevention Programs Return to Table of Contents
With a goal of expanding access by increasing the number of DPPs, the CDC is using several grant opportunities to increase awareness of prediabetes among providers and the overall population, increase provider referrals to DPPs, and encourage coverage for DPPs through public or private insurance or through employer wellness programs. In addition to its grant-based efforts, the CDC is partnering with several other national organizations on initiatives to address prediabetes. These efforts focus on increased access to and coverage for DPPs and health care provider referral to these programs, as well as outreach to populations at high-risk of prediabetes based on race/ethnicity or income, and are discussed in further detail below.
Prevent Diabetes STAT62
The American Medical Association (AMA) and the CDC are partnering on the Prevent Diabetes STAT (Screen, Test, Act Today) program, which targets information to three audiences – patients, health care professionals, and employers/insurers. It encourages 1) patients to be screened for prediabetes and those with prediabetes to participate in a DPP, 2) providers to screen and refer patients with prediabetes to DPPs, and 3) employers/insurers to provide health insurance coverage for DPPs.
AHIP63
Four members of American’s Health Insurance Plans (AHIP) – Denver Health, EmblemHealth, Florida Blue, and Molina Healthcare – have implemented DPPs for a diverse group of populations at risk for prediabetes as part of a CDC grant. These plans have focused on expanding access to DPPs through a variety of mechanisms including engaging diverse populations through use of culturally and linguistically appropriate resources (e.g., through the use of bilingual outreach workers and coaches), and addressing the needs of low income and low literacy populations (e.g., by offering materials at 4th or 6th grade reading levels). Other areas of focus include offering DPPs in workplace settings, leveraging partnerships with physician practices to increase referrals, and using health plan retail centers (walk-in customer service locations) to increase access.
PSA Campaign64
The first national public service advertising (PSA) campaign about prediabetes was launched in January 2016 as a partnership among the CDC, the ADA, the AMA, and the Ad Council. The campaign encourages individuals to take a short online survey at DoIHavePrediabetes.org to assess their risk for prediabetes, to confirm their results with a doctor, and to participate in a CDC-recognized lifestyle change program; this website provides lifestyle tips and links to the CDC and DPPs recognized through the DPRP.

©Institute for Clinical and Economic Review, 2016 Page 9 Final Evidence Report – Diabetes Prevention Programs Return to Table of Contents
California Landscape
A number of diabetes prevention initiatives in California are being led by the California Department of Public Health (CDPH) and other entities including local health departments. CDPH has received two CDC grants to raise awareness of prediabetes and to increase the number and use of DPPs in the state; the department shares these funds with county health departments who are most knowledgeable about needs in their counties and can best implement programs to meet those needs. In addition to the grants to support statewide efforts, two California cities – Los Angeles and San Diego – received CDC grants. CDPH has also partnered with the CDC and AMA on the Prevent Diabetes STAT program and is leading the development of a statewide action plan to address prediabetes. This plan will be developed in the summer of 2016 with a planned implementation in the fall.
Prediabetes disproportionately affects some races and ethnicities in California.2 The highest proportions of the population with prediabetes or undiagnosed diabetes are Pacific Islanders (55%), American Indians (51%), and African Americans (50%); by contrast, prediabetes or undiagnosed diabetes affects 42% of Asians. While the burdens of diabetes are greatest in low-income, ethnically diverse populations, interviewees noted that there have historically been few DPPs or diabetes self-management programs available in geographic areas where the needs are greatest (see Figure 2). For example, interviewees noted that rates of prediabetes are higher in the Central Valley, but that relatively few DPPs have been located there. In contrast, more DPPs are available along the California coast, where rates of prediabetes are lower. As of May 6, 2016, the CDC has granted full or pending recognition to 32 in-person DPPs and three DPPs with in-person and digital elements in California; seven vendors of digital DPPs have their headquarters in the state and are included in Figure 2, though access to these programs is not constrained by geographic location.65 It should be noted that the location of in-person Weight Watchers programs are not included in Figure 2, since the CDC registry lists only the New York headquarters of the company. Similarly, other organizations with multiple sites whose recognition is tied to a single location would also not be fully represented in this figure.

©Institute for Clinical and Economic Review, 2016 Page 10 Final Evidence Report – Diabetes Prevention Programs Return to Table of Contents
Figure 2. Prevalence of Diagnosed Diabetes in California by County, 2012; Location of DPPs
Sources: http://www.cdc.gov/diabetes/atlas/countydata/atlas.html (left map), https://nccd.cdc.gov/DDT_DPRP/Programs.aspx (right map data, downloaded May 6, 2016) https://www.google.com/maps/d/ (right map) Although this review is restricted to the adult population, several interviewees highlighted the importance of prevention efforts targeted at children and adolescents to lower the risk of developing type 2 DM later in life, with a focus on low-income communities and early exposure to the importance of choosing healthier foods and engaging in physical activity.
2.2 Barriers and Opportunities
Scalability
As noted above, to attain the NDPP goal of scalability, the format of DPPs has evolved from individual in-person coaching in the DPP Trial to in-person group sessions, and more recently to digital programs delivered via computer, tablet, or phone; Table 3 summarizes the key features of DPPs. In addition to the considerable heterogeneity among in-person DPP delivery models, some digital programs are delivered to virtual groups that are assigned a human coach while another delivers coaching messages through a fully-automated system.

©Institute for Clinical and Economic Review, 2016 Page 11 Final Evidence Report – Diabetes Prevention Programs Return to Table of Contents
Table 3. Key Features of DPPs
Format Scalability Cost* Typical
Group Size Key
Resources Examples
In-person, individual coaching
Lowest Highest 1 Humans, facilities
DPP Trial
In-person, group coaching
Medium Medium 8-15 Humans, facilities
Weight Watchers for Prediabetes Y
Digital, human coaching (virtual interaction)
High Medium 1-24 Humans, technology
Omada® (Omada Health, Inc.) Virtual Lifestyle Management (VLM™, Canary Health, Inc.)
Digital, fully-automated coaching (based on algorithms)
Highest Lowest 1+† Technology Alive-PD™ (Turnaround Health)
*Average costs and cost-offsets by program type are available in Appendix Table I2 † No group counseling, but participants can join optional virtual teams. The team size was 10 in the published trial.10 For in-person and digital programs that use them, and regardless of whether they are health care professionals or lay personnel, human coaches must be effective facilitators and support the group processes that relate to behavior change.66 Coaches help participants develop and maintain healthy eating and physical activity habits, and further support participants through education, encouragement, and problem-solving support to address challenges or barriers that arise.66 Due to the time it takes to recruit and train lifestyle coaches, there will be limits on the ability of any platform involving human coaches to be able to reach a broad population with prediabetes in the US. While completely automated digital solutions would primarily require technology to be scaled, it is unclear if this approach will best serve all audiences.
While individual coaching has the lowest scalability and the highest cost, it was the model used in the DPP Trial and has served as the foundation for subsequent DPP implementation. Several of the initial efforts to increase scalability through in-person group coaching involving trained laypersons were led by the Y. As of January 2016, the Y had over 1,450 class locations for its DPP in 44 states.67 Weight Watchers also offers a DPP that includes an online activation video as well as in-person meetings and online tools. Some interviewees noted that social support provided by members of the group and the coach is a benefit of in-person programs, but they also mentioned that the need to attend a weekly class on a set schedule is a constraint for some participants, particularly those with inadequate access to transportation. As noted above, there is substantial variation in the in-person group programs, particularly in terms of the staff coaches. For example, the Y uses trained laypersons, while some other programs use health care professionals such as diabetes educators (i.e., DPPs delivered by organizations accredited by the American Association of Diabetes Educators [AADE]) or registered dietitian nutritionists. National organizations with many programs sites could potentially add scale to in-person DPPs relatively quickly.

©Institute for Clinical and Economic Review, 2016 Page 12 Final Evidence Report – Diabetes Prevention Programs Return to Table of Contents
All of the digital programs, which have the greatest potential for scalability, offer the flexibility of completing lessons on one’s own schedule. Digital programs also are more likely to be available any time a participant wants to enroll and begin the program, whereas there may be a wait for some in-person programs until enough participants enroll to form a group or until staff are available. Many digital programs integrate with other technology (e.g., devices or apps for tracking physical activity, electronic scales). The availability of digital programs and the larger numbers of participants they are able to reach may allow research on what approach works best for specific subpopulations to be conducted more quickly. Nearly all interviewees said that a “one size fits all” solution would not address the needs of all potential participants (i.e., some individuals would prefer a digital DPP while others would prefer an in-person DPP), while acknowledging that more needed to be learned about how to engage and activate specific populations in lifestyle change.
Sustainability
Grant funding has been the predominant means of paying for DPPs in many community-based programs. Several interviewees noted that this is not a sustainable model and that reliance on grant funding is an impediment to scaling. While insurer and purchaser coverage has not yet been extensive, there is interest and movement in this direction by some employers and plans. Coverage by health plans in particular may be accelerated if a Medicare proposal to cover DPPs is implemented and if more health plans interpret two relevant USPSTF recommendations as requiring coverage of DPPs (additional information is located in section 3.1). In California, some interviewees noted that a lack of steady payment sources has contributed to a lack of program availability statewide. Many interviewees thought that coverage of DPPs by all payers, public and private, is necessary to achieve large-scale impact. There was widespread enthusiasm for the March 2016 Medicare announcement that a proposal would be forthcoming to cover DPPs and a perception that this might be an impetus for private plans to accelerate coverage of DPPs and for more Medicaid programs to cover DPPs.
While many DPPs have relied on grant funding and/or one-on-one contracting relationships with payers, there is at least one company (Solera) that acts as an intermediary by connecting patients, payers, and clinicians with DPPs. Potential benefits of such an intermediary include: health plans can offer both in-person and digital DPPs through one vendor, eligible patients can be matched to a DPP with the format that best suits them, more enrollees can be directed to DPPs leading to a steadier revenue stream, providers can easily refer patients to a DPP, and payments can be tied to key milestones (e.g., enrollment, engagement at 4 weeks and 9 weeks, ≥ 5% weight loss).
Among the vendors offering digital programs, several indicated that they are engaged in pay-for-performance (P4P) contracts in which they are paid based on the number of people who enroll and achieve certain attendance and weight loss goals, rather than receiving a fee per health plan enrollee or employee offered the DPP. Although details of such P4P arrangements vary and are

©Institute for Clinical and Economic Review, 2016 Page 13 Final Evidence Report – Diabetes Prevention Programs Return to Table of Contents
proprietary, representatives of both private health plans and purchasers indicated that they are seeking these types of arrangements. With such risk-sharing, DPP vendors therefore have a greater financial incentive to identify participants who are ready to engage in the program; if such participants are higher-risk, it is expected that they will benefit more from the program, thereby making the return on investment (ROI) more favorable.
There has been little study of individuals who pay privately for DPPs, but it appears that this has not been a major source of revenue or a significant focus for most vendors. Individuals who are interested in purchasing a DPP on their own can do so through the Y, Weight Watchers, and various digital providers.
Additional DPP Implementation Considerations
In addition to issues related to scalability and sustainability, interviewees were asked about other factors that may limit the use of DPPs. Several of these issues and potential solutions are described below.
Data
Many interviewees noted the steep learning curve for programs seeking CDC recognition, particularly in terms of data collection and analysis. Some described the importance of having coaches who are committed to and understand the importance of analyzing data to assess program effectiveness, as the time requirements for reviewing and submitting data from food and activity logs, participant weight measurement, and attendance were substantial. Several interviewees thought there may be a role for electronic health records (EHRs) in diabetes prevention, particularly in helping providers to identify patients with HbA1c levels that meet the prediabetes criteria (5.7-6.5%) and in communicating patient results back to their health care providers. Employers were interested in data sharing that meets high security standards and that can be used to enhance communication among providers, patients, DPP vendors, and plans.
Culturally Appropriate Curricula/Strategies to Reach High-risk Populations
A recent review of the effectiveness of DPPs in community-based settings noted that, unlike in the DPP Trial, the majority of those enrolled were white, non-Hispanic, and female.68 These findings demonstrate that efforts to reach other populations, including racial/ethnic groups at higher risk of developing diabetes are necessary, and many interviewees articulated a need for better methods to reach these underserved communities. While noting the development of the new Prevent T2 curriculum in Spanish as a positive, interviewees highlighted the importance of the curriculum being available in a language that participants can understand and that is also culturally appropriate (e.g., dietary recommendations should reflect the foods most commonly consumed in ethnic subpopulations). Several interviewees noted the need for materials in a variety of Asian languages.

©Institute for Clinical and Economic Review, 2016 Page 14 Final Evidence Report – Diabetes Prevention Programs Return to Table of Contents
While agreeing that curriculum availability in other languages is an important goal, it was noted that to ensure fidelity to the DPP model, efforts to reach these populations should not deviate too far from the DPP curriculum.
In addition to language and cultural appropriateness, interviewees identified low literacy and illiteracy as another factor affecting accessibility of DPPs. It was noted that the emphasis on collecting data may be challenging for these populations because individuals who cannot track their food and physical activity may feel as though they cannot participate fully in the program, which may impact attendance and program attrition. One example was given of a pictorial version of a DPP that had not been submitted to CDC for review but could potentially meet the needs of this population.
For lower-income populations, participation and attrition were significant concerns for in-person DPP vendors. Factors that interviewees identified as potentially helpful in encouraging consistent participation were availability of child care; locations in communities that are easily accessible to participants so transportation was not a deterrent; incentives for participants such as measuring cups, food and weight scales, or raffles; and reminders to attend class via email, text, or a phone call. In terms of ability to access digital DPPs, some interviewees perceived that lower-income populations may not have as much access to computers or the internet as higher-income populations, but the extent to which this affects participation is unclear. A 2015 study by the Pew Research Center reported that 50% of American adults with annual incomes less than $30,000 and 71% of those with incomes between $30,000 and $50,000 now own a smartphone.69
Efforts to Engage Providers and Community Organizations
Several interviewees highlighted the importance of partnerships with clinicians and the role of provider referrals, as well as the need for feedback loops between DPPs and clinicians. Some interviewees felt that the best opportunity for patient engagement occurs if providers immediately refer individuals to a DPP when their blood test results indicate they have prediabetes. Even if individuals with prediabetes are made aware of their condition, providers may be hesitant to refer patients to DPPs if the programs are not covered by insurance. Some others felt that individuals referred by clinicians were more likely to participate in a DPP than those who self-referred.
Provider engagement was noted as a challenge, with a call for education about USPSTF screening recommendations, prediabetes, and the availability of DPPs, as well as increased provider referrals to DPPs overall. The need for more education in medical schools regarding diabetes prevention and prediabetes was also noted.
As noted earlier, to be eligible for CDC recognition, DPPs must enroll ≥ 50% of participants based on biometric markers such as blood glucose test results rather than on the results of a prediabetes risk-factor survey, so DPPs closely affiliated with provider groups and some health plans may have

©Institute for Clinical and Economic Review, 2016 Page 15 Final Evidence Report – Diabetes Prevention Programs Return to Table of Contents
access to blood test results for program participants and thus may be able to meet this requirement more easily. However, some interviewees from community-based programs noted that it is challenging to meet this threshold and articulated a need for better linkages and relationships between clinicians and community-based DPPs, both to increase referrals and to provide a place for participants to have biometric tests.
Representatives of in-person DPPs also identified the need to work with organizations such as faith-based organizations and others that are already enmeshed in their communities to serve as ambassadors for diabetes prevention efforts including screening and referral to DPPs. These organizations can also be the source of coaches and outreach workers.
Coach Workforce Identification, Training, and Retention
Almost all DPPs use human coaches to some extent and, as noted earlier, their availability is a rate-limiting factor to program scalability. Many interviewees articulated that extensive efforts are required to screen, identify, train, and retain skilled lifestyle program coaches who can connect to the community targeted by the DPP. For in-person programs, interviewees said that coaches who are sensitive to the culture of those enrolled in the program and involved in the community have opportunities to engage with participants outside of class (e.g., at grocery stores, schools, faith-based organizations). Digital DPPs may facilitate more efficient use of human coaches when compared to in-person DPPs since participant data can be automatically analyzed as it is entered into the system, allowing coaches to more efficiently provide customized feedback.
Importance of Prediabetes Awareness and Readiness to Change
Amongst the areas cited most often by interviewees as a challenge to more widespread access to and use of DPPs was the lack of awareness of prediabetes. Several national and statewide efforts are underway to increase awareness of prediabetes for individuals and health care providers. Some interviewees said that to encourage retention in and completion of a DPP, the role of participant readiness to change may be an important factor. Retention would be expected to be higher for individuals who understand and are prepared to make the year-long commitment for the DPP; are interested in learning about healthy eating, exercise, and stress management; and are willing to make lifestyle changes to realize the benefits of such changes.

©Institute for Clinical and Economic Review, 2016 Page 16 Final Evidence Report – Diabetes Prevention Programs Return to Table of Contents
3. Public and Private Coverage for DPPs To understand the insurance landscape for DPPs, we reviewed the publicly available coverage policies of the Centers for Medicare & Medicaid Services (CMS), California Department of Health Care Services (DHCS), Aetna, Anthem, CIGNA, Humana, UnitedHealthcare, Health Net, and Blue Shield of California. At the time of this report’s publication, none of these plans had publicly available coverage policies, though many are engaged in pilot efforts to roll out DPP benefits for their covered populations; details on these programs are available in Appendix E. In the absence of specific details on coverage policy, this section will explore the current payer and purchaser landscape as it relates to DPPs.
3.1 Health Insurance Coverage for DPPs
One of the major goals of the CDC and its NDPP partners is to increase access to DPPs by promoting health insurance coverage in both public and private settings. Information on current coverage and potential future coverage is discussed below.
Medicare and Medicaid
Medicare does not currently cover DPPs. However, the Secretary of Health & Human Services (HHS) announced in March 2016 that the DPPs tested as part of a Center for Medicare & Medicaid Innovation (CMMI) grant produced favorable health outcomes while saving money over a 15-month period. For successful service delivery models such as this, the Secretary may use a rulemaking provision in the Affordable Care Act to expand the duration and scope of the model being tested if it meets certain quality of care, spending, and coverage/benefit criteria.45
As part of this process, CMS issued a proposed rule related to the coverage of DPPs for Medicare beneficiaries on July 15, 2016, and public comments may be submitted until September 6, 2016.11 Because the information summarized below is proposed language, it is subject to revision after the public comment process closes. Referred to as the Medicare Diabetes Prevention Program (MDPP), the expanded coverage would take effect on January 1, 2018. The MDPP would be available to Medicare Part B enrollees with a BMI of at least 25 kg/m2 (or 23 kg/m2 for individuals of Asian descent) and a FPG of 110-125 mg/dL, OGTT of 140-199 mg/dL, or HbA1c between 5.7% and 6.4%. Health care providers and community organizations would be permitted to refer participants to an MDPP, and beneficiaries may self-refer if they meet the aforementioned criteria.
The benefit would cover a 12-month program using the CDC-approved curriculum that features 16 core sessions in the first six months and optional monthly core maintenance sessions in the second six months if the beneficiary achieves and maintains a minimum of 5% weight loss. Beneficiaries would be permitted to enroll in a MDPP once, though individuals who meet and sustain weight loss

©Institute for Clinical and Economic Review, 2016 Page 17 Final Evidence Report – Diabetes Prevention Programs Return to Table of Contents
goals may continue to participate in monthly maintenance sessions after the end of the 12-month program. DPPs would be required to participate in CDC’s recognition program to be eligible for reimbursement, and they must apply for status as a Medicare supplier. Reimbursement for MDPP services would be performance based, with payments for one session completed, four sessions completed, nine sessions completed, 5% weight loss achieved, and 9% weight loss achieved, for a maximum of $360 in the first six months and $90 in the second six months. Both in-person and digital DPPs are proposed to be options, and CMS plans to continue to evaluate digital DPPs to ensure they are similarly effective as in-person programs.
Currently, only one state (Montana) covers DPPs for its Medicaid beneficiaries, and it uses trained health professionals as program coaches.12 The CDC has identified two states (Maryland and Oregon) whose Medicaid programs will provide DPP coverage for beneficiaries in value-based plans (e.g., managed care plans, accountable care organizations [ACOs]) through pilot projects focused on participant engagement and retention strategies. Several interviewees noted that the Medicaid population is at higher risk for prediabetes and diabetes, and is more ethnically and racially diverse than the privately insured population. While many interviewees expressed a desire for all Medicaid beneficiaries to have access to DPPs, there was an acknowledgement that the reality of limited resources in Medicaid funding and in Medicaid managed care plan contracts would likely mean that efforts would need to be targeted to reach individuals at the highest levels of diabetes risk within this population first rather than making DPPs available to all beneficiaries who meet the criteria for prediabetes.
Private Health Plans
Among the plans we interviewed, one plan has developed its own DPP in conjunction with the CDC and the Y (though it has not yet applied for recognition through the DPRP), another pays for DPPs when claims are submitted for reimbursement, while another does not yet offer a specific DPP but is exploring options to offer its enrollees. Nationally, at least 30 private plans currently cover DPPs,13 but interviewees noted that such coverage was often in response to requests from purchasers and would likely not apply to all lines of business. Private plans we interviewed indicated that they are interested in the effectiveness of DPPs both in terms of member-centric clinical outcomes and costs; they also expressed a desire for information on populations most likely to benefit from DPPs (e.g., by age, ethnicity, clinical status, psychological readiness).
The Affordable Care Act (ACA) requires most commercial plans to cover a range of preventive services without any patient cost-sharing; by contrast, Medicare and Medicaid are not required to cover these services.70,71 There are two recent USPSTF screening recommendations with a grade of B that must be covered by private plans and are relevant to DPPs (see Table 4). Among the private plans we interviewed, there was variation in the interpretation and implementation of these recommendations, with some interpreting these recommendations to mean that DPPs should be a

©Institute for Clinical and Economic Review, 2016 Page 18 Final Evidence Report – Diabetes Prevention Programs Return to Table of Contents
covered preventive benefit with no cost-sharing. It is unknown whether this is the interpretation of all plans; it is also unknown to what extent plans will provide coverage for one or more specific DPPs vs. for any DPP that a member chooses.
Table 4. USPSTF Recommendations Pertaining to DPPs
Topic Population Recommendation* Grade Behavioral Counseling to Promote a Healthful Diet and Physical Activity for Cardiovascular Disease Prevention in Adults with Cardiovascular Risk Factors (2014)72
Adults who are overweight or obese and have additional cardiovascular disease (CVD) risk factors
The USPSTF recommends offering or referring adults who are overweight or obese and have additional CVD risk factors to intensive behavioral counseling interventions to promote a healthful diet and physical activity for CVD prevention.
B
Screening for Abnormal Blood Glucose and Type 2 Diabetes Mellitus (2015)73
Adults aged 40 to 70 years who are overweight or obese
The USPSTF recommends screening for abnormal blood glucose as part of cardiovascular risk assessment in adults aged 40 to 70 years who are overweight or obese. Clinicians should offer or refer patients with abnormal blood glucose to intensive behavioral counseling interventions to promote a healthful diet and physical activity.
B
*The USPSTF summary recommendations have been reproduced verbatim In the absence of clear guidance that DPPs represent a preventive benefit that must be covered by ACA-compliant private plans, there are several reasons these plans may be reluctant to cover DPPs. These include program costs; administrative burdens associated with evaluating the effectiveness of individual programs, establishing relationships with DPP vendors, and validating claims; the use by some programs of lay providers with whom plans do not have a billing relationship; and the year-to-year turnover of enrollees in health plans that make a longer-term ROI difficult to justify. One barrier to reimbursement was alleviated on January 1, 2016, when the AMA released a new CPT code (0403T) specifically for DPPs.74
3.2 Employer and Purchaser Coverage of DPPs
Some private and public purchasers have incorporated DPPs into their health plans or wellness programs, or as standalone benefits, but it is challenging to assess how extensive these practices are. At the state purchaser level, eight states (Colorado, Kentucky, Louisiana, Maine, Minnesota, New Hampshire, Ohio, and Washington) provided DPPs for their employees as of August 2015, and several others are considering adding DPPs as a covered health benefit.75 The local and state government purchasers in California that we interviewed expressed an interest in having DPPs as a covered benefit but indicated that current coverage of DPPs is left to the discretion of the health plans with whom they contract.
Among the private employers and business coalitions we interviewed, there was an interest in making DPPs available either through wellness programs or health plan coverage, with particular

©Institute for Clinical and Economic Review, 2016 Page 19 Final Evidence Report – Diabetes Prevention Programs Return to Table of Contents
interest in digital solutions. Employers acknowledged that DPPs are a medium- to long-term investment, and were therefore not as focused on short-term ROI as insurers. Key factors identified by purchasers in making DPPs available include program effectiveness and effective participant engagement; risk sharing and paying for results rather than paying for enrollees; capacity for data sharing with high security standards among health plans, providers, and DPPs; communication support to inform employees about the program; and CDC recognition.
Purchaser interviewees emphasized that individuals with prediabetes will differ in the type of program that best fits their need and that programs should be available to reach people in a manner (in-person or digital) that works best for the individual. One purchaser noted the importance of immediate referral to a DPP when a blood test shows prediabetes, since this is when the person is most keenly interested; in addition, it is important to pair the referral with direct human contact to make sure the person knows what steps to take next to address their condition.
Some employers that offer DPPs through their health plans are also engaging in broader efforts to improve work environments by increasing access to healthy foods (e.g., in cafeterias or vending machines, at staff meetings) and making physical activity easier (e.g., by carpeting stairs, adding walking trails).

©Institute for Clinical and Economic Review, 2016 Page 20 Final Evidence Report – Diabetes Prevention Programs Return to Table of Contents
4. Comparative Clinical Effectiveness 4.1 Overview
Three large, high-quality randomized trials begun more than 20 years ago have demonstrated that lifestyle interventions focusing on diet and exercise can decrease the progression to type 2 diabetes among individuals with prediabetes.3,76,77 Appendix Table H1 summarizes the inclusion and exclusion criteria for the three trials and details of their lifestyle interventions. The Diabetes Prevention Program Trial (DPP Trial) is the largest of the three trials and the one most relevant for the US population (Appendix Table H2).
The DPP Trial investigators randomized 3,234 individuals to the lifestyle intervention, metformin, or placebo. After approximately three years of follow-up, there was a 58% reduction in the incidence of diabetes in the lifestyle group compared with the placebo group (95% confidence interval [CI] 48% to 66%) and a 31% reduction in the metformin group compared to the placebo group. The lifestyle intervention was also significantly more effective than the metformin intervention (relative risk reduction [RRR] 39%, 95% CI: 24% to 51%). The reduction in the incidence of diabetes declined over time to 27% at 15 years, but members of the metformin and placebo groups were offered the lifestyle intervention at the end of the initial follow-up period, which may have decreased the difference in diabetes incidence between the two groups (Appendix Table H3). More than half of patients in the lifestyle intervention arms of the three trials developed diabetes after 15 years of follow-up, so it may be more appropriate to speak of a delay in diagnosis rather than prevention. In the DPP Trial, the delay in diagnosis estimated from cumulative incidence curves is approximately three years.36 Long term follow-up continues for all three trials in order to examine the impact of the interventions on diabetic microvascular disease (eye, kidney, and nerve damage) and cardiovascular disease (strokes and heart attacks). At 15 years of follow-up, there was no significant reduction in microvascular disease in the DPP Trial (risk ratio [RR] 0.91, 95% CI: 0.78 to 1.07). However, at 23 years of follow-up, there was a significant reduction in death from cardiovascular disease in the Chinese Da Qing Diabetes Prevention Study (RR 0.59, 95% CI: 0.36 to 0.96).
Since publication of the initial results of the DPP Trial, there have been more than 50 studies translating the lifestyle intervention to real-world settings. Many systematic reviews and health technology assessments have demonstrated that these programs decrease body weight, decrease FPG, improve blood pressure and cholesterol levels, and prevent or delay the onset of type 2 DM (see Appendix F).14-19,78-101 For example, Ali and colleagues14 evaluated 28 real-world implementation studies and found that the average weight loss at one year was 4-5% and that the more sessions participants attended, the more weight they lost. Neamah and colleagues19 found that participants in programs with fewer deviations from the original DPP Trial approach had

©Institute for Clinical and Economic Review, 2016 Page 21 Final Evidence Report – Diabetes Prevention Programs Return to Table of Contents
significantly greater weight loss at 12 months. Additional detail on these two systematic reviews can be found in Appendix F.
The CDC and the Community Preventive Services Task Force commissioned a systematic review of programs that promote dietary changes and physical activity to prevent or delay the development of diabetes.17 Eight reviewers evaluated more than 11,300 publications and extracted data from 53 studies describing 66 diet and activity programs for adults with prediabetes published through February 2015. They found that diet and exercise programs reduced diabetes incidence by 41% (95% CI: 34% to 48%) compared with usual care. The programs also reduced body weight by 2.2% (95% CI: 1.4% to 2.9%) and FPG by 2.2 mg/dL (95% CI: 0.9 to 3.6 mg/dL). Six studies (five randomized) compared less intensive to more intensive lifestyle interventions. The more intensive programs, such as the DPP Trial intervention, were more effective (44% to 72% greater reduction in incident diabetes).17
The CDC established the DPRP to identify programs with proven effectiveness at delivering a lifestyle intervention to prevent or delay the development of type 2 DM. The goals of the DPRP are to ensure the quality of programs designed to deliver such lifestyle interventions, to maintain a registry of such organizations, and to provide technical assistance to local DPPs.
Accordingly, our intent for this evidence review is to summarize the published literature for lifestyle interventions in the US that have full or pending recognition by the DPRP. We extended the search that was commissioned by the CDC through April 2016 but limited our review to those programs recognized by the DPRP.
4.2 Methods
Data Sources and Searches
The systematic literature search assessing the evidence on lifestyle interventions to prevent or delay the development of type 2 DM followed established best practices used for systematic review research.102 We conducted the review in accordance with the Preferred Reporting Items for Systematic Reviews and Meta-Analyses (PRISMA) guidelines.103 The PRISMA guidelines include a checklist of 27 items, further detail of which is available in Appendix Table A1.
We used the systematic review commissioned by the CDC as the foundation for our search.17 We repeated their search, limiting it to the two years prior to April 7, 2016 in order to identify studies indexed or published since the end of their search timeline (February 27, 2015). We searched MEDLINE, EMBASE, and the Cochrane Central Register of Controlled Trials. We limited each search to studies of human subjects and excluded articles indexed as guidelines, letters, editorials, narrative reviews, case reports, conference abstracts, or news items. To supplement the above searches and ensure optimal and complete literature retrieval, we performed a manual check of the

©Institute for Clinical and Economic Review, 2016 Page 22 Final Evidence Report – Diabetes Prevention Programs Return to Table of Contents
references of recent relevant reviews and meta-analyses. We also contacted the CDC and known organizations that support CDC-recognized lifestyle interventions. Further details on the search algorithm are available in Appendix Table A2.
Study Selection
We performed screening at both the abstract and full-text level. A single investigator screened all abstracts identified through electronic searches for lifestyle programs with full or pending recognition from the CDC DPRP. We did not exclude any study at abstract-level screening due to insufficient information. For example, an abstract that did not report an outcome of interest would be accepted for further review in full text.
We retrieved the citations that were accepted during abstract-level screening for full text appraisal. One investigator reviewed full papers and provided justification for exclusion of each excluded study.
Data Extraction and Quality Assessment
Our data extraction and review process is detailed in Appendix H. Summary tables are available in Appendix Tables H4 through H11. We used criteria published by the USPSTF to assess the quality of RCTs and comparative cohort studies, using the categories “good,” “fair,” or “poor.”104
Assessment of Level of Certainty in Evidence
We used the ICER Evidence Rating Matrix (see Figure 3) to evaluate the evidence for a variety of outcomes. The evidence rating reflects a joint judgment of two critical components:
a) The magnitude of the difference between a therapeutic agent and its comparator in “net health benefit” – the balance between clinical benefits and risks and/or adverse effects AND
b) The level of certainty in the best point estimate of net health benefit.105

©Institute for Clinical and Economic Review, 2016 Page 23 Final Evidence Report – Diabetes Prevention Programs Return to Table of Contents
Figure 3. ICER Evidence Rating Matrix
Data Synthesis and Statistical Analyses
Given the small numbers of studies for programs recognized by the CDC DPRP, the inclusion of case series without control groups, and the meta-analyses performed as part of prior systematic reviews that included a wider range of studies, we judged that it would not be helpful or appropriate to perform formal meta-analysis to generate pooled estimates of treatment effect. We cannot directly compare in-person to digital programs because there are no head-to-head trials or cohorts comparing programs, and there were insufficient trials with control groups to allow conduct of a network meta-analysis.

©Institute for Clinical and Economic Review, 2016 Page 24 Final Evidence Report – Diabetes Prevention Programs Return to Table of Contents
4.3 Results
Study Selection
The updated literature search for lifestyle interventions to prevent or delay the development of type 2 DM identified 1,489 potentially relevant references (see Appendix Figure A1), of which 18 publications describing 10 studies met our inclusion criteria (five RCTs and five case-series using a pre-post design).7-9,20-34 Details of the included studies are summarized in Appendix Tables H4 through H11. The original DPP Trial data are also summarized in Appendix Tables H4 through H11 to serve as a standard for comparison with the implementation trials. The studies are grouped in the tables by degree of human contact from the DPP, ranging from in-person individual coaching performed on a weekly, one-on-one basis with a trained health care professional to the Alive-PD system which is digital with fully automated coaching. Studies using in-person group coaching were the most common, and included four studies in the Y system, one supported by the Department of Public Health and Human Services in Montana, one at Weight Watchers, and one at Wake Forest University. Two of the programs (Virtual Lifestyle Management [VLM], Omada) were digital with a human coach. Finally, as noted above, one digital system was completely automated and provided no human counselor. (Alive-PD).
The study populations were remarkably similar (Appendix Table H6). The average weight of the participants was approximately 100 kg across the studies with an average BMI of approximately 34 kg/m2, and the average age in the trials ranged from 51 to 57 years. The Omada trial, which recruited participants from the Internet, was an outlier with respect to age; the average age of participants in the Omada trial was 44 years. Across the studies, two-thirds of the participants were women, with the exception of the Alive-PD study (32% female). The mean HbA1c was approximately 5.9% when reported. As in the DPP Trial, the race/ethnicity composition of the studies was diverse with the notable exception of the DEPLOY study (93% white) and the VLM study (86% white). The Alive-PD study was 25% Asian, reflecting the composition of the Bay Area population where the study was performed.
Quality of Individual Studies
The quality of the individual studies is summarized in Appendix Table H11. The original DPP Trial was a large, good-quality trial with long enough follow-up to assess the impact of the intervention on diabetes incidence.3 Three of the implementation trials were randomized trials of good quality (RAPID, Alive-PD, HELP-PD), though the Alive-PD trial has only published 6-month outcomes.21,25,30 The lifestyle changes necessary to prevent or delay the development of diabetes need to be sustained for decades, so outcomes beyond the initial intensive intervention period are preferred. The two other randomized trials (DEPLOY, Weight Watchers) were judged to be of fair quality because of baseline differences between the groups and significant loss to follow-up.7,8

©Institute for Clinical and Economic Review, 2016 Page 25 Final Evidence Report – Diabetes Prevention Programs Return to Table of Contents
Among the pre-post case series, one (Omada, formerly called Prevent) was judged to be of fair quality; although case series provide weaker evidence than RCTs, the study included a careful description of the participants, and featured adequate length and completeness of follow-up, objective outcome measures, and appropriate analysis methods.9,33 The other four were judged to be of poor quality because of the small number of participants with prediabetes, the use of self-reported outcomes, and significant loss to follow-up.26,27,32,34
Key Studies
In-person, Individual Coaching
The Diabetes Prevention Program Trial
All of the CDC-recognized DPPs attempt to implement the DPP Trial intervention in a cost-efficient and scalable approach. We describe the DPP Trial methods and results here and include the DPP Trial in all of the report and appendix tables to serve as a reference to guide the evaluation of the implementation studies. The original DPP Trial randomized 1,079 individuals to the intensive lifestyle intervention.3 All participants were required to have prediabetes defined by an OGTT at two hours between 140 and 199 mg/dL. The intervention consisted of 16 core lessons delivered weekly one-on-one with a lifestyle coach (primarily dieticians). This was followed by eight monthly individual post-core sessions to problem solve, support adherence, and to reinforce the original material. The three goals of the intervention included a 7% reduction in body weight, 150 minutes of moderate intensity exercise (brisk walking) every week, and a reduction of fat intake to less than 25% of total calories. The trial also offered group exercise classes, gym memberships, and other support to help participants in the lifestyle intervention group to reach their goals.
More than 95% of the participants attended nine or more of the 16 core sessions, and follow-up for outcomes was 98% complete at three years. At one year, participants had lost an average of 7 kg or 7% of their initial body weight. Half of the participants met the weight loss goal of 7% or more of their body weight. Over the first three years of follow-up, this translated into a 58% reduction in the incidence of diabetes (14.4% versus 28.9%). Weight loss was the primary predictor of the reduction in diabetes incidence,4,5 ranging from a 35% reduction in diabetes incidence among participants with 0-3% weight loss to an 85% reduction in diabetes incidence for participants with >10% weight loss (see Figure 4).5 Participants in the lifestyle intervention also had reductions in blood pressure and improvements in cholesterol measurements that should translate into additional benefits in the long term prevention of cardiovascular disease.35 In addition, there were significant improvements in quality of life with the lifestyle intervention compared with the placebo group using the 36-Item Short-Form Health Survey (SF-36).54 There were improvements in general health (+3.2 versus placebo, p<0.001), physical function (+3.6 versus placebo, p<0.001), bodily pain (+1.9 versus placebo, p=0.01), and vitality (+2.1 versus placebo, p=0.01).

©Institute for Clinical and Economic Review, 2016 Page 26 Final Evidence Report – Diabetes Prevention Programs Return to Table of Contents
Figure 4. Correlation of Percentage Weight Loss with Reduction in the Risk for Diabetes for Participants in the Intensive Lifestyle Intervention Arm of the DPP Trial
In-person, Group Coaching
Diabetes Education & Prevention with a Lifestyle Intervention Offered at the Y (DEPLOY)
The DEPLOY study was an early and widely-cited example of translating the DPP Trial intervention to a real-world setting and evaluating the results.7,20,22,31 In order to improve the efficiency and scalability of the program, the lifestyle curriculum was delivered in groups of 8-12 participants rather than individually. The groups met for the 16 core lessons of the DPP in weekly classroom meetings that focused on knowledge building, goal setting, self-monitoring, and problem-solving. These were followed by monthly large group meetings for additional educational sessions.
DEPLOY was a pilot cluster randomized trial at two Y facilities in Indiana, though with only two clusters, it was more akin to a cohort study. A total of 92 participants (46 at each site) were recruited on the basis of BMI ≥24 kg/m2, elevated risk for diabetes using a diabetes risk assessment tool, and a non-fasting finger stick glucose level of 110-199. The DPP curriculum was delivered by trained Y staff in 16 group meetings of 8-12 people, with goals of a 5-7% weight loss and 150 minutes per week of moderate exercise. The control group received personalized advice about their risk for diabetes and was advised that modest weight loss (5-10%) and moderate exercise 30 minutes a day were safe and effective at preventing type 2 diabetes. The control group intervention was supplemented with the Small Steps, Big Rewards educational materials from the National Diabetes Education Program (NDEP). There were important baseline differences between the lifestyle and control groups (age, 56.5 versus 60.1 years; female, 50% versus 61%; and race, 4%
0
10
20
30
40
50
60
70
80
90
100
0 to <3% 3 to < 5% 5 to <7% 7 to <10% ≥10%
Perc
enta
ge R
educ
tion
in In
cide
nce
of
Diab
etes
Weight Loss

©Institute for Clinical and Economic Review, 2016 Page 27 Final Evidence Report – Diabetes Prevention Programs Return to Table of Contents
versus 20% African American). There was substantial loss to follow-up in the study. In the lifestyle intervention group, 35/46 (76%) of the participants attended at least one session. Among participants who attended at least one session, the average attendance was 12/16 core sessions (75%). At one year, individuals in the lifestyle intervention group who were evaluated (29/46, 63%) lost an average of 6% of their baseline weight compared with 1.8% in the control group (p=0.008). Adjustment for baseline differences in the two groups did not change the magnitude or statistical significance of the difference in weight loss. At a median follow-up of 28 months, 72% of the lifestyle group returned for assessment, and the lifestyle group continued to weigh an average of 6.0% less than their baseline weight. At one year, there was a significant decrease in total cholesterol in the DPP group (-13.5 versus +11.8 mg/dL, p=0.002). There were no significant differences in change in HbA1c or systolic blood pressure.
Weight Watchers
Weight Watchers studied the impact of their standard weight management program augmented with a 45-minute activation session focused on educating participants about the meaning of prediabetes and the role of lifestyle modification in decreasing their risk for diabetes.8 The Weight Watchers core curriculum covers the same behavioral topics used in the DPP, though the materials differ. There are weekly in-person meetings at multiple sites throughout the country. The Weight Watchers intervention also comes with optional digital tools to track weight, diet, and physical activity and offers periodic tips on adherence.
Academic investigators randomized 225 participants with prediabetes to Weight Watchers or to brief coaching that consisted of personalized advice about their risk for diabetes, a goal of 5-10% weight loss via caloric restriction with moderate physical activity, and educational materials from the NDEP Small Steps, Big Rewards program. The participants in the two groups were well balanced at randomization, but there was substantial loss to follow-up that differed by group (16% in Weight Watchers group; 28% in control group). Participants in the Weight Watchers group attended an average of 21.6 group sessions over the year, and 63% used the online app at least once. At one year, the Weight Watchers group lost an average of 5.5 kg or 5.6% of their initial weight (0.2 kg and 0.25%, respectively for the control group, p<0.001 for both). The difference in mean weight loss at 12 months was 5.3% without imputation for missing values and 5.5% when multiple imputation was performed for missing weight measurements at six and 12 months. Participants also had improvements in glycemic control and other cardiovascular risk factors, but none of these changes were significantly different from the control group.

©Institute for Clinical and Economic Review, 2016 Page 28 Final Evidence Report – Diabetes Prevention Programs Return to Table of Contents
Digital, Human Coaching
Omada (Omada Health)
Omada is a DPP-based lifestyle intervention that includes an online social network of 10-15 people for group support, weekly core DPP lessons available for access at the participants’ convenience, health coaching, a wireless scale, and a pedometer. There are no in-person meetings, but there are virtual groups and an assigned health coach for each group.
The company sponsored a longitudinal pre-post study in 220 participants recruited online that followed the CDC DPRP guidelines for inclusion criteria and for data analysis.9,33 Overall, 85% of the participants competed at least four of the core lessons, and they completed an average of 13.8/16 core lessons and 3.2/9 post-core monthly lessons. A total of 70% (155/220) completed at least nine of the core lessons. The core participants lost an average of 4.9 kg or 4.8% of their baseline weight at one year and 4.2% at two years. Their HbA1c declined by an average of 0.4% at one and two years of follow-up.
Virtual Lifestyle Management (VLM, Canary Health)
VLM is a DPP-based lifestyle intervention delivered online via audio-narrated lessons.32 There are 16 weekly core lessons followed by eight monthly lessons all adapted from the CDC curriculum. Each participant receives a pedometer and a book detailing the fat and calorie content of common foods. Participants receive email prompts for pending lessons as well as prompts to weigh themselves and enter the results on the website. Each participant is assigned a nurse educator lifestyle coach who monitors the participant’s progress and writes coaching notes with support and suggestions. These notes are sent weekly for the first 16 weeks and every two weeks thereafter.
The company sponsored a single site pre-post pilot study in 50 patients from a single academic primary care practice at the University of Pittsburgh. The patients were between the ages of 18 and 80, had a BMI ≥25 kg/m2, and had at least one weight-related cardiovascular risk factor (hypertension, dyslipidemia, diabetes, or impaired fasting glucose). Only 8/50 (16%) had impaired fasting glucose or prediabetes, and their results were not reported separately. The participants completed an average of 12.8 lessons. Among participants completing the visit at month 12 (n=45, 90%), the average weight loss was 4.8 kg, and 31% lost at least 5% of their initial weight. These participants’ systolic blood pressure declined an average of 7.3 mm Hg and their diastolic blood pressure increased an average of 0.3 mm Hg. The study did not assess any measure of glycemic control.

©Institute for Clinical and Economic Review, 2016 Page 29 Final Evidence Report – Diabetes Prevention Programs Return to Table of Contents
Digital, Fully Automated Coaching
Alive-PD (Turnaround Health)
Alive-PD is an automated program that uses email, individualized web-based resources, smartphones, and interactive voice response technology to support weekly goal-setting, reminders, and tracking. Participants may join an optional virtual team of any size with other participants, and earn points through engagement and progress. Individuals and teams can compete to receive monetary rewards, with higher scores improving the likelihood of winning. There are no group sessions or personal contact from human coaches either in-person or remotely.10 The system is designed to reduce the risk for diabetes though long-term changes in physical activity and diet. A detailed history is taken at the beginning on the program and a series of goals are set based on that personal profile. Both resistance training and aerobic activity are encouraged. Weight loss is encouraged, but it is not a primary goal of the intervention. Dietary changes focus on reducing added sugars, refined carbohydrates, saturated and trans fats and increasing fruit and vegetable intake.
The company sponsored a randomized trial of 339 patients with prediabetes. All participants were given brief advice about their risk for diabetes and the value of physical activity and dietary changes to reduce their risk. Participants in the control group were waitlisted to start the Alive-PD program in six months. The characteristics of the participants were balanced at baseline. Follow-up was 86% complete at six months and similar in the two groups. At six months, the Alive-PD group had lost more weight (3.6% versus 1.3%, p<0.001) and had greater reductions in fasting plasma glucose (-7.4 versus -2.2 mg/dL, p<0.001) and in HbA1c (-0.26% versus -0.18%, p<0. 001). The decrease in HbA1c was modest but twice that observed in the DPP Trial.
Clinical Benefits
Weight Loss
Weight was measured objectively in most studies either during in-person visits or via an automated electronic scale (Appendix Table H8). There is one exception: the large observational study using administrative data in the Y (Vojta 2013)34 that did not report how weight was measured. The average percentage weight loss at six and 12 months follow up is summarized in Figures 5-7. The first set of bars in each figure represents the results from the original DPP Trial to serve as a reference. Figure 5 summarizes the weight loss results for the programs using in-person group coaching to deliver the diabetes prevention intervention. Weight loss was consistently in the 5-7% range across the studies with the DPP and the HELP-PD studies at the upper end of the range, with one exception. In the RAPID trial, a DPP-based study in the Y system, weight loss was only in the 2-3% range (estimated from other results because percentage weight is not reported), though this was greater than that observed in the control group (p<0.001). This likely reflects the design of the
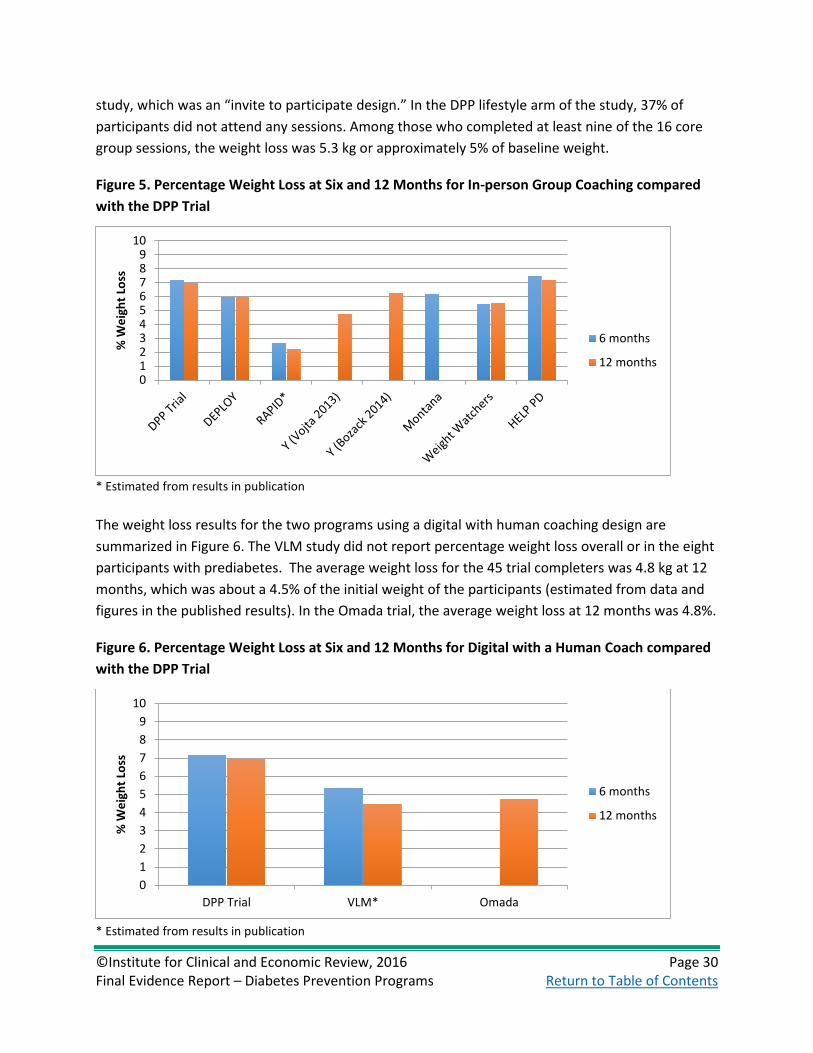
©Institute for Clinical and Economic Review, 2016 Page 30 Final Evidence Report – Diabetes Prevention Programs Return to Table of Contents
study, which was an “invite to participate design.” In the DPP lifestyle arm of the study, 37% of participants did not attend any sessions. Among those who completed at least nine of the 16 core group sessions, the weight loss was 5.3 kg or approximately 5% of baseline weight.
Figure 5. Percentage Weight Loss at Six and 12 Months for In-person Group Coaching compared with the DPP Trial
* Estimated from results in publication The weight loss results for the two programs using a digital with human coaching design are summarized in Figure 6. The VLM study did not report percentage weight loss overall or in the eight participants with prediabetes. The average weight loss for the 45 trial completers was 4.8 kg at 12 months, which was about a 4.5% of the initial weight of the participants (estimated from data and figures in the published results). In the Omada trial, the average weight loss at 12 months was 4.8%.
Figure 6. Percentage Weight Loss at Six and 12 Months for Digital with a Human Coach compared with the DPP Trial
* Estimated from results in publication
0123456789
10
% W
eigh
t Los
s
6 months
12 months
0123456789
10
DPP Trial VLM* Omada
% W
eigh
t Los
s
6 months
12 months

©Institute for Clinical and Economic Review, 2016 Page 31 Final Evidence Report – Diabetes Prevention Programs Return to Table of Contents
The weight loss results for the one program using a digital with fully automated coaching design are summarized in Figure 7. The Turnaround Health Alive-PD study reported a 3.6% weight loss at six months, which is only about half the weight loss reported in the DPP Trial at six months. This may reflect the lack of a mandatory weight loss goal-setting component in their program. Participants using Alive-PD may also continue to lose weight after six months, though this pattern of weight loss has not been observed in the DPP Trial or the other translations of the DPP.
Figure 7. Percentage Weight Loss at Six and 12 Months for Digital with Fully-automated Coaching Compared with the DPP Trial
Half of the available studies reported some measure of change in glycemic control during follow-up (see Appendix Table H9). In the original DPP Trial study, there was only a small reduction in HbA1c (~-0.1% versus ~+0.1%, p<0.001) and in FPG (~-5 mg/dL versus ~+1 mg/dL, p<0.001) at one year in the lifestyle group. In the DEPLOY and Weight Watchers studies, no significant differences were noted between intervention and control subjects in measures of glycemic control. However, the HELP-PD study reported changes in FPG (-4.5 mg/dL versus -0.6 mg/dL control, p<0.001) at 12 months.
Among the digital with a human coach programs, only the Omada study reported results, but the change in HbA1c (-0.4% at 12 months, no control) was the largest reported of any program including the original DPP Trial.
Interestingly, even though the Alive-PD program (digital with fully automated coaching) reported a relatively low percentage weight loss at six months (3.6% versus 1.3%, p<0.001), the reduction in HbA1c (-0.3% versus -0.2%, p<0.001)) and FPG (-7.4 mg/dL versus -2.2 mg/dL, p<0.001) were greater than in most of the other studies. This may reflect the greater focus on diabetes prevention and control as the primary goal of their dietary intervention rather than weight loss.
0123456789
10
DPP Trial ALIVE-PD
% W
eigh
t Los
s
6 months
12 months

©Institute for Clinical and Economic Review, 2016 Page 32 Final Evidence Report – Diabetes Prevention Programs Return to Table of Contents
Diabetes Incidence
Most of the studies were of too short a duration to assess incident diabetes. The HELP-PD study (in-person with group coaching) reported that the diabetes incidence at two years was non-significantly lower in the lifestyle group than in the usual care group (3.0% versus 8.7%, p=0.10). The study did not have sufficient statistical power to detect a difference in diabetes incidence, though the greater than 50% observed reduction is likely to be clinically significant. In the DPP Trial, the cumulative incidence of diabetes was approximately 4% in the lifestyle intervention group and 13% in the usual care group.36
Other Cardiovascular Risk Factors
The DPP Trial reported reductions in blood pressure and improvements in total and HDL-cholesterol levels (Appendix Table H10). These improvements, though small, could contribute to an overall reduction in cardiovascular disease independent of the reduction in diabetes incidence. Among the in-person group coaching programs, the DEPLOY study reported greater improvements in cholesterol than those reported in the DPP Trial. The Weight Watchers study reported similar reductions in blood pressure compared with the DPP Trial and a greater increase in HDL-cholesterol, but also a small increase in total cholesterol.
Finally, the VLM study (digital with human coaching) reported twice the reduction in systolic blood pressure compared with the DPP Trial, but a slight increase in diastolic blood pressure. None of the other digital programs reported changes in blood pressure or cholesterol levels.
Harms
There was no excess rate of adverse events or serious adverse events in participants randomized to the lifestyle intervention in any of the randomized trials. The DPP Trial and other RCTs specifically assessed myalgias, arthralgias, fractures, and other musculoskeletal complaints potentially arising from lifestyle interventions, and no significant increases were observed for participants in the lifestyle group.
Subgroup Analyses
The original DPP Trial did not find any difference in the efficacy of the intensive lifestyle intervention by sex, race, ethnicity, body mass index, or initial FPG or OGTT level. Older participants in the lifestyle group appeared to have greater weight loss and a greater reduction in incident diabetes than younger participants. In the DPP Trial, the reduction in diabetes comparing the lifestyle intervention to placebo was 48% for participants ages 25-44 years, 59% for those 45-59 years, and 71% for those ages 60 years and older. This finding was consistently reported in the subsequent implementation trials. Older participants tend to attend more sessions and lose more

©Institute for Clinical and Economic Review, 2016 Page 33 Final Evidence Report – Diabetes Prevention Programs Return to Table of Contents
weight. This is likely to translate into a greater reduction in incident diabetes. This is particularly relevant for the Medicare population, which may benefit disproportionately from such lifestyle interventions.
Controversies and Uncertainties
The original DPP Trial clearly demonstrated that an intensive lifestyle intervention is more effective than both a drug (metformin) and usual care at preventing or delaying the onset of diabetes and that weight loss was the primary mediator of diabetes prevention/delay, not physical activity. Subsequent translational studies, including those summarized above, have demonstrated that real-world lifestyle interventions can deliver significant weight loss that is sustained for a year. However, the degree of weight loss is somewhat less than that attained by participants in the DPP Trial, and long-term sustained weight loss has not yet been demonstrated in these translational studies. The primary uncertainty is whether the one-year weight loss observed in these studies will lead to a significant reduction in the incidence of diabetes in these patients and whether the reduction (or delay) in the diagnosis of diabetes will result in meaningful reductions in the complications of diabetes for these patients.
At 15 years of follow-up, there was no reduction in either microvascular disease or cardiovascular disease in the DPP Trial despite ongoing weight loss maintenance classes. Between-group differences between the lifestyle and placebo groups of the DPP Trial may be diluted because the lifestyle intervention was offered to participants in all three groups at the end of the initial three years of the trial, although it was delivered in a group setting rather than individually. The lifestyle intervention was delivered to 57% of the original placebo group, 58% of the original metformin group, and 40% of the original lifestyle group. In the Chinese Da Qing study, it took 23 years before a reduction in cardiovascular mortality was observed.
A second uncertainty arises from the definition of prediabetes. In clinical practice, patients with prediabetes are usually diagnosed by measurement of FPG. In the US, the ADA defines an FPG of 100-125 mg/dL as prediabetes, but the WHO definition requires an FPG of 110-125. Patients with an FPG of 100-109 mg/dL are at lower risk for progression to type 2 diabetes and may receive less benefit from intensive lifestyle interventions.
In addition, critics of the term “prediabetes” have raised concerns about the adverse effects of labeling patients given that those with prediabetes are at high risk for diabetes but do not yet have a diagnosed disease. A 2014 criticism published in The BMJ asserted that “pre-diabetes could be defined as a risk factor for developing a risk factor.”37 The WHO recognizes this concern and recommends that the health care community use the term “intermediate hyperglycemia” rather than prediabetes.58 Since estimates suggest that approximately one-third of US adults (86 million people) have prediabetes and the majority of those individuals will not go on to develop diabetes, the impact of even small individual harms of labeling could be substantial on a population basis.

©Institute for Clinical and Economic Review, 2016 Page 34 Final Evidence Report – Diabetes Prevention Programs Return to Table of Contents
Summary
The 10 studies of CDC-recognized programs reviewed above consistently demonstrate that intensive lifestyle interventions produce 4% to 6% weight loss, which should translate into a 40% to 50% reduction in type 2 DM over a three-year time horizon based on the DPP Trial results. In addition, the lifestyle interventions produce small improvements in blood pressure and cholesterol, which may reduce cardiovascular events. The majority of the translational programs used an in-person group coaching approach to deliver the content of the core DPP lessons, and group support may enhance the efficacy of the intervention. However, the digital approaches reported similar reductions in body weight and improvements in cardiovascular risk factors. There is not clear evidence that one approach is more efficacious than another at either weight loss or diabetes prevention.
It is also important to point out that the different types of DPP implementation that are now being used may have differential effectiveness in various groups of patients. Some patients may be more willing to enroll and stay engaged with online programs, while others may respond more positively to in-person group-based programs. A priority for the prevention community should be research into the potential for segmentation of the at-risk population and targeting of different styles of DPP, to maximize effectiveness and minimize the costs of delivering DPP in broader settings.
We judge the evidence for the CDC-recognized intensive lifestyle programs using an in-person group coaching design to provide an incremental or better (B+) net health benefit when compared to usual care for patients with prediabetes. There is no question that these programs yield modest weight loss in the short term compared with usual care. However, there is moderate certainty of a net benefit because of the uncertainties about the long-term durability of weight loss and the long-term improvements in health from the modest weight reductions demonstrated after one to two years of follow-up in the published studies.
We also judge the evidence for the CDC-recognized intensive lifestyle programs using a digital with human coach design to provide an incremental or better (B+) net health benefit when compared to usual care for patients with prediabetes. There is more uncertainty in this judgment than that for in-person group coaching because the number of studies is smaller (two) and because there are no good quality trials. However, there is clearly modest weight loss with these programs through two years compared with usual care that is similar in magnitude to that observed with the in-person group coaching programs. There is uncertainty about the long-term durability of weight loss and subsequent long-term health improvements similar to that described for the in-person group counseling programs.
We judge the evidence for the CDC-recognized intensive lifestyle programs using a digital with fully-automated coaching design to provide comparable or better (C+) net health benefit when compared to usual care for patients with prediabetes. There is greater uncertainty of a net benefit

©Institute for Clinical and Economic Review, 2016 Page 35 Final Evidence Report – Diabetes Prevention Programs Return to Table of Contents
for the fully-automated approach because there is only one trial, it only reported six-month outcomes, and the weight loss was qualitatively less than that observed in the original DPP Trial and the majority of the other translational programs. However, it was a high-quality randomized trial that showed statistically significant improvements in body weight and glycemic control compared with usual care.
We judge that there is Insufficient Evidence (I) to distinguish the efficacy of any one approach (in-person group counseling; digital with a human coach; digital with fully-automated counseling) from the others. There are no randomized trials or cohort studies that directly compare any two of the approaches, and the evidence base is currently too sparse to perform a network meta-analysis.

©Institute for Clinical and Economic Review, 2016 Page 36 Final Evidence Report – Diabetes Prevention Programs Return to Table of Contents
5. Other Benefits or Disadvantages Our reviews seek to provide information on other benefits or disadvantages offered by the intervention to the individual patient, caregivers, the delivery system, other patients, or the public that would not have been considered as part of the evidence on comparative clinical effectiveness. Examples include but are not limited to:
1. Methods of administration that improve or diminish patient acceptability and adherence 2. A public health benefit, e.g., reducing new infections 3. Treatment outcomes that reduce disparities across various patient groups 4. More rapid return to work or other positive effects on productivity (if not considered a
benefit as part of comparative clinical effectiveness) 5. New mechanisms of action for treatments of clinical conditions for which the response to
currently available treatments varies significantly among patients for unknown reasons (substantial heterogeneity of treatment effect)
The primary additional benefit would be the public health benefits that may result from decreasing the weight and increasing the physical activity of a large segment of the population. In addition to the likely reductions in diabetes and cardiovascular disease described above, there may be reductions in some of the many complications of obesity, including arthritis, sleep apnea, and esophageal reflux disease. In addition, exercise has been proposed to improve mental health and quality of life, and to decrease long-term disability. Further, the availability of DPPs in a variety of formats (in-person, digital) and increasingly, using culturally-appropriate curricula, that can be selected to best meet an individual participant’s needs may help to reduce disparities by improving access to DPPs.

©Institute for Clinical and Economic Review, 2016 Page 37 Final Evidence Report – Diabetes Prevention Programs Return to Table of Contents
6. Comparative Value 6.1 Overview
We reviewed the published literature for analyses that have examined the economic impact of diabetes prevention programs in the US with full or pending recognition from the CDC DPRP. This included studies of the cost to initiate and operate DPPs and/or specific components of such programs, analyses of the costs that are potentially offset through the use of such programs (e.g., reduced downstream medical costs), and cost-effectiveness analyses (CEAs). This section of the report summarizes what is currently known in the literature about the economic impact of DPPs and specific components of those programs, the strength and validity of that evidence, and where gaps in knowledge still exist.
We also explored the potential health system budget impact of DPPs over a shorter-term time horizon, utilizing published or otherwise publicly-available information on program planning, implementation, and ongoing treatment costs; any cost offsets; and the potential population eligible for such programs. These budget impact analyses assumed a specific program “uptake” rate over a five-year period for specific populations of interest, based on the availability of relevant data. Our analysis estimates the potential budget impact of broader implementation of DPPs and allows assessment of any need for managing the cost of such interventions. More information on ICER’s methods for estimating product uptake and calculating potential budget impacts can be found at: http://icer-review.org/wp-content/uploads/2016/02/Slides-on-value-framework-for-website-v4-13-16.pdf.
6.2 Prior Published Evidence on Costs and Cost-Effectiveness of Diabetes Prevention Programs
Cost-Effectiveness Analyses
Li et al. conducted a systematic review of economic analyses of “diet and physical activity promotion programs with at least two sessions over at least three months delivered to persons at increased risk for type 2 DM.”38 This was an update of an earlier review by Li and colleagues that compiled published CEAs of ADA-recommended interventions to prevent, delay the development of, and control diabetes, from 1985 through May 2008.106 Cost-effectiveness of these programs was assessed in 22 studies (eight of which were US-based). Overall, the median cost per quality-adjusted life-year (QALY) gained for the eight US-based analyses was $9,824, with an interquartile range of $1,930 to $41,982 per QALY gained. However, the authors noted that few studies included information on recruitment costs, or on the cost to implement and scale up these programs. In

©Institute for Clinical and Economic Review, 2016 Page 38 Final Evidence Report – Diabetes Prevention Programs Return to Table of Contents
addition, only two studies had examined the “cost-effectiveness of translational programs implemented in community and primary care settings” in the US.
Most of the cost-effectiveness analyses of DPPs in the US have been performed by the DPP Research Group that was involved with the original DPP Trial, using a simulation model based on data from the DPP Trial and other sources, though economic evaluations of several other DPP implementations have also been published. We have summarized the results of economic evaluations of the DPP Trial and other DPP types from a health care system perspective in Table 5 and in the text below. Further details, including cost-effectiveness results from a societal perspective, are reported in Appendix Table I1.

©Institute for Clinical and Economic Review, 2016 Page 39 Final Evidence Report – Diabetes Prevention Programs Return to Table of Contents
Table 5. Overview of Evaluations of DPP Cost-Effectiveness, Health-Care System Perspective
Reference Name Comparator Time Horizon Population ICER ($/QALY)
In-person, Individual Coaching DPP Research Group 2003
DPP Trial Placebo 3 years DPP Trial $32,000 Metformin Placebo 3 years DPP Trial $102,200
DPP Research Group 2012
DPPT/DPPOS Placebo 10 years DPP Trial, DPPOS $13,000 Metformin Placebo 10 years DPP Trial, DPPOS Cost-saving DPP Trial/DPPOS Metformin 10 years DPP Trial, DPPOS $14,900
Herman 2005 DPP (simulation) Placebo Lifetime Age ≥ 25 with IGT $1,100 Metformin Placebo Lifetime Age ≥ 25 with IGT $31,300
Hoerger 2007 DPP for IGT+IFG No screening Lifetime Age 45-74, BMI ≥ 25 kg/m2 $8,200 DPP for IGT or IFG No screening Lifetime Age 45-74, BMI ≥ 25 kg/m2 $9,500 DPP for IGT or IFG DPP for IGT+IFG Lifetime Age 45-74, BMI ≥ 25 kg/m2 $10,200
Eddy 2005 (Archimedes)
DPP No prevention 30 years Adults at high risk for diabetes
$143,000
In-person, Group Coaching DPP Research Group 2003
DPP Trial as group Placebo 3 years DPP Trial $9,000
DPP Research Group 2012
DPP Trial as group Placebo 10 years DPP Trial, DPPOS $1,500
Herman 2005 DPP as group (simulation)
Placebo Lifetime Age ≥ 25 with IGT Cost-saving
Hoerger 2007
DPP group for IGT+IFG
No screening Lifetime Age 45-74, BMI ≥ 25 kg/m2 Cost-saving
DPP group for IGT or IFG
No screening Lifetime Age 45-74, BMI ≥ 25 kg/m2 $267
Eddy 2005 (Archimedes)
DPP group ($217/yr) No prevention 30 years Adults at high risk for diabetes
$27,000
Hinnant 2016 claims analysis
DEPLOY Usual care 2 years Medicare beneficiaries with prediabetes
Cost-saving
Spitalnic 2016 budget impact
DEPLOY (Medicare expansion)
No Medicare expansion
Lifetime Medicare beneficiaries age 65-75
Cost-saving*
Digital, Human Coaching Su 2016 ROI analysis
Omada Usual care 10 years Adults with prediabetes & BMI ≥25kg/m2
Cost-saving (positive ROI)
Smith 2016 VLM Usual care 10 years Prediabetes (BMI ≥ 25 kg/m2
and ≥ 1 CVD risk factor) $7,800
Digital, Fully Automated Coaching (No published cost-effectiveness analyses identified) *Cost-saving if mortality effects excluded (as for Medicare certification); approximately cost-neutral if included BMI: body mass index, CVD: cardiovascular disease, IFG: impaired fasting glucose, IGT: impaired glucose tolerance, ILI: inventive lifestyle intervention, ROI: return on investment

©Institute for Clinical and Economic Review, 2016 Page 40 Final Evidence Report – Diabetes Prevention Programs Return to Table of Contents
In-person, Individual Coaching
DPP Trial
The DPP Research Group has conducted multiple analyses based on the DPP Trial. In summary, from a health system perspective, the cost per QALY for the intensive lifestyle intervention decreased as the time horizon increased, from $32,000/QALY at three years,39 to $13,000/QALY at 10 years,40,41 and $1,100/QALY using a lifetime time horizon.42 Further details on these studies are provided below.
The DPP Research Group conducted a within-trial CEA of the DPP Trial,39 comparing lifestyle intervention and metformin to placebo over a three-year time horizon. From a health system perspective (i.e., including only direct medical costs), the DPP Trial intervention was estimated to cost approximately $2,300 more and provide approximately 0.07 additional QALYs than placebo, or approximately $32,000 per QALY gained. From a societal perspective (direct medical, direct non-medical, and indirect costs included), the DPP Trial intervention was found to cost $52,300 per QALY gained. In contrast, the metformin intervention was estimated to cost approximately $102,000 per QALY gained from both the health system and societal perspectives.
In 2012 (with a 2013 erratum), the DPP Research Group conducted a 10-year within-trial CEA of the DPP and subsequent Outcomes Study (DPPOS), comparing lifestyle intervention and metformin to placebo.40,41 From a health system perspective, the DPP Trial intervention was found to cost approximately $13,000 per QALY gained compared with placebo. From a societal perspective, the DPP Trial intervention was found to cost approximately $19,800 per QALY gained. Metformin was cost-saving compared to placebo for both perspectives. The discounted incremental cost-effectiveness ratios for the DPP Trial intervention compared to metformin were approximately $14,900 and $45,900 per QALY for the health system and societal perspectives, respectively.
Herman and colleagues42 in the DPP Research Group modeled the lifetime cost-effectiveness of the DPP intervention compared to placebo in individuals age 25 and older with impaired glucose tolerance (IGT) using a Markov simulation model with inputs from data collected for the DPP Trial as well as published data. Cost-effectiveness ratios for the DPP Trial intervention were estimated to be approximately $1,100 per QALY gained from a health care perspective, and approximately $8,800 per QALY gained from a societal perspective. Cost-per-QALY ratios for the metformin intervention were approximately $31,300 and $29,900 for the health system and societal perspectives, respectively. The major limitation of this analysis is that it required the assumption that the DPP Trial intervention’s costs and effectiveness persisted over a lifetime horizon.
Hoerger et al. (2007)107 used the DPP Research Group simulation model to evaluate the lifetime cost-effectiveness of different screening strategies for prediabetes in adults age 45-74 who were overweight or obese (BMI ≥25 kg/m2) for enrollment in the DPP Trial intervention. They compared

©Institute for Clinical and Economic Review, 2016 Page 41 Final Evidence Report – Diabetes Prevention Programs Return to Table of Contents
three strategies from a health system perspective: no screening; screening followed by the DPP Trial intervention for individuals with IGT plus IFG; and screening followed by the DPP Trial intervention for individuals with IGT and/or IFG (the latter category represents broader eligibility for enrollment). They reported a cost per QALY gained of $8,181 for the strategy treating IGT plus IFG compared to no screening, and $9,511 for the strategy treating IGT and/or IFG compared to no screening. The incremental cost-effectiveness ratio for the latter strategy compared to the former was $10,167 per QALY gained. If the DPP Trial intervention was provided to groups (i.e., at lower cost), the IGT plus IFG screening strategy was estimated to be cost-saving and the IGT and/or IFG strategy to cost $267 per QALY gained.
In contrast to the above analyses, Eddy et al. conducted another CEA of the DPP Trial intervention using the Archimedes model, which simulates detailed anatomic and physiologic components of several diseases.43 This analysis compared no prevention to the DPP Trial intervention, lifestyle intervention after diagnosis of diabetes, and metformin. Over a 30-year time horizon, they estimated that the DPP Trial intervention would cost approximately $143,000 per QALY gained from a health system perspective, and approximately $62,600 per QALY from a societal perspective, and that metformin and delaying lifestyle intervention until diabetes diagnosis would be more cost-effective (at $35,500/QALY and $24,500/QALY using a health system and societal perspective, respectively). The incremental cost-effectiveness of the DPP Trial intervention compared to delayed lifestyle intervention was estimated to be approximately $201,800/QALY. In sensitivity analyses, they concluded that the DPP Trial intervention would be cost-effective (i.e., <$50,000/QALY) relative to the alternative strategies only if the program cost could be reduced to approximately $210 per person per year.
There are several explanations for the differing results found in the DPP Research Group and Eddy et al. analyses.108,109 In addition to using different types of simulation models and assumptions, Eddy et al. assumed that the clinical benefits of the DPP would diminish over time and that there would also be a lower rate of glycemic progression over time (i.e., slower progression from prediabetes to type 2 diabetes, and from type 2 diabetes diagnosis to complications). Their health system perspective analysis also assumed turnover in health plan enrollment over time, which would lead to higher estimated cost-effectiveness ratios than in the DPP Trial evaluations. This may also explain why Eddy et al. found lower cost-effectiveness ratios from a societal vs. health system perspective, as health plan turnover rates are not relevant in a societal analysis.
In-person, Group Coaching
DPP Trial
As part of the DPP Research Group’s within-trial CEA of the DPP Trial,39 the DPP as “might be implemented in routine clinical practice” (i.e., as a group rather than individual intervention, and with lower costs but equal effectiveness) was estimated to cost $4,500 per diabetes case prevented

©Institute for Clinical and Economic Review, 2016 Page 42 Final Evidence Report – Diabetes Prevention Programs Return to Table of Contents
and $9,000 per QALY gained from a health system perspective; from a societal perspective, the intervention was estimated to cost $13,200 per diabetes case delayed or prevented, and $29,100 per QALY gained. A similar group assumption was made in their 10-year evaluation of the DPP Trial/DPPOS,40,41 with resulting cost per QALY ratios of approximately $1,500 from a health system perspective and $8,400 from a societal perspective. In their evaluation of the lifetime cost-effectiveness of the DPP Trial intervention, Herman and colleagues42 also estimated the impact if costs could be reduced by implementing the lifestyle intervention in groups of 10 participants rather than one-on-one coaching, assuming equal clinical effectiveness. In that scenario, they estimated that the program would be cost-saving over a lifetime, even if effectiveness were reduced by 50%, as downstream savings from reduced diabetes incidence would still be greater than the cost of the group intervention. Finally, Eddy et al.43 also evaluated a scenario where the DPP was provided as a group intervention costing $217 per year; they estimated a cost/QALY gained of $27,000 from a health care perspective and $12,000 from a societal perspective.
Y DPP
RTI International44 conducted an evaluation of the Y DPP as part of an assessment of CMS’ Health Care Innovation Awards. The initiative aimed to provide a DPP to Medicare beneficiaries with prediabetes in community settings (17 Y centers across the US), with the objective of at least 5% weight loss and 150 minutes of physical activity per week for at least half of participants. Eighty-three percent of recruited participants enrolled; of those enrolled, 37% completed fewer than 9 sessions, 37.5% 9-16 sessions, and 25.4% 17 or more sessions. In a claims analysis using CMS’s Chronic Conditions Data Warehouse through 2014, 1,679 participants were compared to propensity score-matched Medicare beneficiaries diagnosed with prediabetes. The authors found statistically significant differences in spending (lower for the treatment group) in the first five calendar quarters of the program, with no significant differences in subsequent quarters. The overall weighted average quarterly spending differential was calculated as $455 per member per quarter. Limitations of this preliminary analysis include the reliance on ICD-9 codes in claims data to identify beneficiaries with prediabetes. In addition, it was discovered that 34% of the DPP participants actually had a previous diabetes diagnosis recorded in claims data.
Because of the lack of long-term results for most DPP implementations, the CMS Office of the Actuary developed a model to project net costs per beneficiary over a lifetime horizon of expanding the DPP to Medicare beneficiaries with BMI ≥ 25 kg/m2 and fasting plasma glucose of 110-125 mg/dL, as detailed in a Certification of Medicare DPP memorandum.45 They assumed that the program would have mean payments per participating beneficiary of $300 in year one, $150 in years two and three, and $100 in subsequent years. The model estimated net costs or savings per year from lowering the probability of progression to type 2 diabetes and thus delaying diabetes-related costs, and it assumed that the Medicare DPP expansion would be somewhat less effective than the DPP Trial because it was less intensive. Specifically, the model assumes 50% diabetes risk

©Institute for Clinical and Economic Review, 2016 Page 43 Final Evidence Report – Diabetes Prevention Programs Return to Table of Contents
reduction in year one, with a steady decrease to 20% risk reduction in years 7 and following. Their analysis estimated that near-term savings would be offset by higher Medicare spending due to lower mortality, making it unclear whether the DPP expansion would break even over a lifetime horizon. Ignoring the mortality improvement (as required in the certification process) suggested that the DPP would reduce Medicare expenditures.
Digital, Human Coaching
Omada (Omada Health)
A recent analysis examined the return on investment (ROI) of the Omada digital DPP (previously called the Prevent program).46 A Markov-based model with a 10-year time horizon was used to compare Omada DPP participants with propensity score-matched community controls with prediabetes. Their simulation found a break-even point at three years, with a positive ROI of $1,565 at five years. One limitation of this study is that it relied on only 26 weeks of weight loss data from Omada participants, which required assumptions about longer-term weight loss.
VLM (Canary Health)
Smith et al. have assessed the cost-effectiveness of the VLM DPP using a Markov model with a 10-year time horizon.47 Costs and changes in weight came from a pre-post study of the VLM intervention, which estimated an incremental cost of $458 and incremental gain of approximately 0.06 QALYs compared to usual care in a hypothetical cohort without diabetes. They estimated that the intervention would cost approximately $7,800 per QALY gained from a health system perspective and approximately $18,300 from a societal perspective. Using a $100,000 per QALY threshold, the intervention was found to be cost-effective in over 95% of model iterations in a probabilistic sensitivity analysis. However, it should be noted that these results are based on data from one study using a one-year before/after design in only 50 patients, 14 of whom already had diabetes.
Digital, Fully-automated Coaching
We were unable to locate any publicly-available CEAs or detailed costing studies examining digital DPPs with fully-automated coaching.
6.3 Potential Budget Impact
We also estimated the potential budget impact of different types of DPPs among candidate populations for such treatment in the US. Our estimates are based on those found in the published and grey literature. In general, relevant cost data were most robust for in-person individual and group programs, coming from published articles with measured costs; results for digital human-

©Institute for Clinical and Economic Review, 2016 Page 44 Final Evidence Report – Diabetes Prevention Programs Return to Table of Contents
coached programs came from a combination of models and claims-based analyses reported in published articles and conference abstracts. No published or publicly-presented data on diabetes incidence or cost offsets were available for digital fully-automated DPPs, so we used unpublished data provided by one such program in a separate scenario analysis. We combined estimates of the mean cost per participant with estimates of the prediabetes population potentially eligible for DPPs, as well as different assumed levels of uptake of such programs.
Potential Budget Impact Model: Methods
Potential budget impact was defined as the total incremental cost of DPPs for the enrolled population, calculated as the incremental health care costs of DPPs minus any health care costs that were offset in enrolled participants. All costs were undiscounted and estimated over one- and five-year time horizons. The five-year timeframe was of primary interest, given the potential for cost offsets to accrue over time. The potential budget impact analysis included the entire candidate population for DPPs in the US, which was considered to include adults with prediabetes, using the ADA definition of individuals with IFG (i.e., between 100 and 125 mg/dL). We also considered the case where prediabetes was defined using the WHO criterion of 110-125 mg/dL.
To estimate the size of the potential candidate population for DPPs, we used estimates of the prevalence of prediabetes in US adults aged 20 and older that were generated from National Health and Nutrition Examination Survey (NHANES) 2009-2010 data.48 These prevalence estimates were applied to the projected US adult population in 2016 to estimate the total number of people with prediabetes. This resulted in a candidate population size of approximately 93.7 million individuals in the US using 100 mg/dL as the cutoff, or of approximately 31.2 million individuals using 110 mg/dL.
In estimating potential budget impact, we recognized that not all individuals with prediabetes would have access to DPPs, and that not all those with access would be interested in enrolling in such programs. Therefore, our calculations assume that the utilization of such programs reaches only a relatively small fraction of the eligible population. To estimate the population size that would use DPPs, we assumed that some percentage of the eligible population would enroll in each year and that this percentage would stay constant over time (years one through five). Our assumed base case was that 10% of those eligible would enroll in and complete a DPP; we also varied these percentages to examine the potential budget impacts if 25% or 50% of eligible individuals were to utilize DPPs (see Figure 8).
The resulting population size after five years, assuming an estimated 10% uptake, was approximately 9.4 million using the 100 mg/dL criterion, and 3.1 million using the 110 mg/dL criterion. We assumed that it may take some time to ramp up the implementation of and recruitment into DPPs and assumed this would occur in equal proportions across the five-year timeframe (i.e., a 20% increase in capacity per year). For example, in the population estimated to have a 10% five-year uptake, 2% of individuals would be assumed to participate in a DPP each year.

©Institute for Clinical and Economic Review, 2016 Page 45 Final Evidence Report – Diabetes Prevention Programs Return to Table of Contents
Individuals participating in a program in year one would accrue all program costs and cost offsets over the full five years, but those initiating in other years would only accrue a proportional amount of these costs and cost offsets.
Next, we estimated the cost per participant of various types of DPPs compared to usual care. Specifically, we tabulated the average costs for DPPs that use in-person individual coaching (i.e., the original DPP Trial), in-person group coaching, and digital programs with human coaching. Preliminary estimates for digital fully-automated programs, supplied by the vendor, are reported separately, as no published data were available. Where available, annual costs and annual cost offsets for individual programs for years one through five were collected, and then an average within each of the four program types was calculated. Cost offsets included reductions in non-DPP related health care costs from any cause, including reduced diabetes incidence. The mean costs by program type, inflated to 2015 dollars, are shown in Appendix Table I2, along with sources.
The net cost per participant per year was then multiplied by the population assumed to be eligible at each uptake rate, and this was used to calculate the total potential budget impact of each type of DPP at various levels of uptake.
Potential Budget Impact Model: Results
Table 6 presents the potential budget impact at one year and five years of each DPP type in the candidate population, assuming implementation of a DPP for 10% of the eligible population at the end of five years.
Results from the potential budget impact analysis showed that, with the uptake assumptions mentioned above, approximately 1.9 million individuals would participate in a DPP in the first year. After one year, net annual costs per participant are estimated to be $1,902 for in-person individual and $117 for digital human-coached programs, with total one-year potential budget impact estimated to be approximately $3.6 billion for in-person individual and $220 million for digital coached programs. In contrast, in-person group programs were found to be cost-saving, with annual savings of $455 per person. Total one-year savings were $850 million for in-person group programs.
Over the entire five-year time horizon, 10% uptake would lead to approximately 9.4 million persons enrolled in a DPP for one or more years. Across this timeframe, the weighted potential budget impact (i.e., adjusted for differing periods of utilization and associated cost-offsets) is approximately $2,800 per participant for in-person individual programs, leading to an average annual potential budget impact of approximately $5.2 billion. Estimated savings from enrollment in in-person group programs continue to accrue over five years, resulting in estimated savings of $2.1 billion per year.
In contrast to the one-year horizon, where digital coached programs were estimated to increase budgets by $220 million, these programs became cost-saving over the longer term due to lower

©Institute for Clinical and Economic Review, 2016 Page 46 Final Evidence Report – Diabetes Prevention Programs Return to Table of Contents
program costs and higher cost offsets in subsequent years. Over five years, digital human-coached programs would generate net savings of approximately $600 per participant enrolled, leading to annual cost savings of approximately $1.2 billion. Net costs for the full five-year time horizon are described in detail in Appendix Table I3.
Table 6. Total Potential Budget Impact (BI) of DPPs Based on 10% Uptake at One and Five Years Using FPG of 100-125 mg/dL (n=9,366,203)*
DPP Type
1-year Analytic Horizon 5-year Analytic Horizon Number Enrolled
(millions)
Annual BI per
Participant ($)† Total BI
(billions)
Number Enrolled
(millions)
Weighted BI per Participant ($)*
Average BI per year (billions)
In-person, Individual Coaching
1.87 $1,902 $3.56 9.37 $2,793 $5.23
In-person, Group Coaching
1.87 -$455 -$0.85 9.37 -$1,146 -$2.15
Digital, Human Coaching
1.87 $117 $0.22 9.37 -$618 -$1.16
* Preliminary estimates for digital fully-automated programs are reported separately, as no published or publicly-presented data were available. †Weighted budget impact calculated by subtracting cost offsets from DPP costs for one-year horizon. For five-year horizon, DPP costs and cost offsets apportioned assuming 20% of patients in uptake target initiate therapy each year In the absence of robust, published results for digital automated DPPs, we performed a projection using unpublished six-month results for decreased diabetes incidence to estimate cost offsets from preventing or delaying cases of diabetes.110,111 If decreases in HbA1c are used as the criterion for determining diabetes prevention or delay, digital fully-automated DPPs would be estimated to be cost-saving, with annual savings of $24 per person (annual program costs of $66 with a cost offset of $90 per person), and total one-year savings of approximately $40 million. Over a five-year time horizon, estimated potential budget savings would be approximately $130 million per year. If diabetes status was determined using FPG measures rather than HbA1c, there would be a greater reduction in diabetes incidence at one year and therefore a larger estimated cost offset of $455 per participant (for a net annual savings of $389 per person). Under this scenario, the estimated budget impact of digital automated DPPs would be similar to that of in-person group DPPs, with one-year cost savings of approximately $728.7 million and savings of approximately $2.2 billion per year over five years. The wide range of potential budget impacts estimated using these two measures emphasizes the uncertainty around the financial impact of digital automated DPPs.
Table 7 shows the potential budget impact at one year and five years for each DPP type in the candidate population using the 110 mg/dL criterion, with the assumption that 10% of the prediabetic population would participate in a DPP at the end of five years. We estimated that approximately 624,000 individuals would participate in a DPP in the first year. After one year, total

©Institute for Clinical and Economic Review, 2016 Page 47 Final Evidence Report – Diabetes Prevention Programs Return to Table of Contents
potential budget impact is estimated to be approximately $1.2 billion for in-person individual and $70 million for digital human-coached programs. Total one-year savings of approximately $280 million with in-person group programs were estimated.
Over the entire five-year time horizon, 10% uptake in the 110 mg/dL population would lead to approximately 3.1 million persons in a DPP for one or more years (i.e., approximately one-third the population size using the 100 mg/dL threshold). Over five years, average potential budget impact per year is approximately $1.7 billion for in-person individual programs. Estimated savings from enrollment in in-person group and digital human-coached programs over five years resulted in estimated annual savings of approximately $720 million and $390 million, respectively, reflecting the smaller candidate population size using the 110 mg/dL threshold. Net costs for the full five-year time horizon are described in detail in Appendix Table I4. Using the projection methods described above for digital automated programs, average potential cost savings over five years would be approximately $45 million and $729 million based on the HbA1c and FPG approaches, respectively.
Table 7. Total Potential Budget Impact (BI) of DPPs Based on 10% Uptake at One and Five Years Using FPG of 110-125 mg/dL (n=3,122,068)*
DPP Type
1-year Analytic Horizon 5 -year Analytic Horizon Number Enrolled (millions)
Annual BI per
Participant ($)† Total BI (billions)
Number Enrolled
(millions)
Weighted BI per Participant ($)*
Average BI per year (billions)
In-person, Individual Coaching
0.62 $1,902 $1.19 3.12 $2,793 $1.74
In-person, Group Coaching
0.62 -$455 -$0.28 3.12 -$1,146 -$0.72
Digital, Human Coaching
0.62 $117 $0.07 3.12 -$618 -$0.39
*Preliminary estimates for digital fully-automated programs are reported separately, as no published or publicly-presented data were available. †Weighted budget impact calculated by subtracting cost offsets from DPP costs for one-year horizon. For five-year horizon, DPP costs and cost offsets apportioned assuming 20% of patients in uptake target initiate therapy each year Figure 8 shows the relationship between varying uptake patterns and potential budget impact for each DPP type for the US population with FPG 100-125 mg/dL. The vertical axis shows the annualized potential budget impact, and the horizontal axis represents the percentage of eligible individuals participating over a five-year period. The colored lines demonstrate how quickly the annual potential budget impact changes with increasing percentages of individuals enrolled in the four different DPP types.
As can be seen in Figure 8, for the US population with FPG 100-125 mg/dL, the annualized potential budget impact is positive for individual in-person programs, and would increase to just over $25

©Institute for Clinical and Economic Review, 2016 Page 48 Final Evidence Report – Diabetes Prevention Programs Return to Table of Contents
billion with 50% of eligible individuals participating. In contrast, annual savings for digital human-coached and in-person group programs accumulate at much higher rates, reaching approximately $5.8 billion and $10.7 billion, respectively. Assuming 50% uptake in the US population with FPG 110-125 mg/dL would result in a similar pattern (see Appendix Figure I1), but with smaller annualized cost for individual in-person programs ($8.7 billion) and smaller annualized savings for digital coached ($1.9 billion), and in-person group programs ($3.6 billion).
Figure 8. Potential Budget Impact Graph for DPPs Provided to Varying Proportions of the US Population with FPG 100-125 mg/dL
Note: Colored lines represent the annualized potential budget impact of different uptake patterns (percent of eligible population enrolled) for each type of DPP.
6.4 Summary and Comment
With one exception,43 the consensus in the literature is that findings for the cost-effectiveness of an in-person DPP at the individual level are well below commonly-accepted thresholds ($50,000 - $150,000 per QALY gained). Providing the program in a group setting appears to be cost-saving over time, with little or no apparent loss in effectiveness relative to individual coaching. Delivering the DPP via digital adaptations with human coaches also appears to be cost-effective or cost-saving, although these findings are based on fewer studies with only short-term effectiveness data. We were unable to find any published evaluations of the cost-effectiveness of digital fully-automated programs for delivery of a DPP. While online adaptations are less costly than in-person DPPs, longer-term studies are needed to determine whether online versions of the DPP will provide comparable effectiveness over time. In addition, it should be noted that analyses sometimes differed in how they defined program participation (e.g., enrollment vs. completion) and to the
In-Person Individual
In-Person Group
Digital Coached
-$15
-$10
-$5
$0
$5
$10
$15
$20
$25
$30
0% 25% 50%
Annu
al B
udge
t Im
pact (
Billi
ons)
% Eligible Patients Treated

©Institute for Clinical and Economic Review, 2016 Page 49 Final Evidence Report – Diabetes Prevention Programs Return to Table of Contents
relationship with program costs; more standardized definitions would make comparisons across program types more comparable.
Our estimates of the short-term potential budget impact of these programs were more variable and depended on using averages across relatively sparse data, especially for the digital programs. Using averages of the available data within program type and the assumptions in our analysis, in-person individual DPPs had positive annual budget impacts over five years, while in-person group and digital coached programs appear to be cost-saving in the short-term. We estimated that a digital fully-automated program was appeared to be cost-saving based on clinical extrapolations, but no published data were available for this category of programs.
A limitation of this analysis is that there was wide variation in 1) the sources of data and 2) the number and types of analyses performed, which may influence the comparability of results across program types. In addition, the definition of prediabetes introduces uncertainty into potential budget impact calculations. For one, the candidate population size is three times larger using the 100-125 mg/dL range of FPG. However, we would also expect diabetes incidence to be higher using the WHO definition (i.e., 110-125 mg/dL). While we were able to test the impact of differences in candidate population size on estimates of potential budget impact, there were unfortunately no data to distinguish program costs and performance between the two definitions of prediabetes.
It should also be noted that this analysis was based on annual program costs that did not include development or start-up costs for these programs, which may be substantial. One area where further research would be helpful is the tabulation of such costs, as well as detailed cost and cost-offset data from implementations of DPPs in different settings.
Furthermore, our estimates of levels of DPP uptake in the health care system by five years were based on arbitrary assumptions, so actual uptake may reach these levels more or less quickly. In addition, the costs used in our analysis came from a specific set of programs, and so may not be representative of the costs for such programs in other settings in the US.
Finally, further data on the long-term effectiveness of these programs in maintaining weight loss and diabetes risk reductions would confirm whether these programs will actually be cost-effective or cost-saving over time. This would be especially useful for the newer, digital adaptations of the DPP. There is also a need for data on the efficacy of maintenance modules of the digital programs, and a need to measure the efficiency of extending these programs to lower-risk groups.

©Institute for Clinical and Economic Review, 2016 Page 50 Final Evidence Report – Diabetes Prevention Programs Return to Table of Contents
7. Voting Results 7.1 About the CTAF Process
During CTAF public meetings, the CTAF Panel deliberates and votes on key questions related to the systematic review of the clinical evidence, an economic analysis of the applications of the medical technologies or treatments under examination, and the supplementary information presented. Panel members typically serve for two or more years and are intentionally selected to represent a range of expertise and diverse perspectives. To maintain the objectivity of the CTAF Panel and ground the conversation in the interpretation of the published evidence, they are not pre-selected based on the topic being addressed. Acknowledging that any judgment of evidence is strengthened by real-life clinical and patient perspectives, subject matter experts are recruited for each meeting topic and provide input to CTAF Panel members before the meeting to help clarify their understanding of the different interventions being analyzed in the evidence review. The same clinical experts serve as a resource to the CTAF Panel during their deliberation, and they help form recommendations with the CTAF Panel on ways the evidence can be applied to policy and practice.
At each meeting, after the CTAF Panel votes, a policy roundtable discussion is held with the CTAF Panel, clinical experts, and representatives from provider groups, payers, and patient groups. This is intended to bring stakeholders into the discussion on how best to apply the evidence to guide patient education, clinical practice, and coverage and public policies. Participants on policy roundtables are selected for their expertise on the specific meeting topic, are different for each meeting, and do not vote on any questions.
At the June 24, 2016 meeting, the CTAF Panel discussed issues regarding the application of the available evidence to help patients, providers, and payers address the important questions related to diabetes prevention programs (DPPs). Following the evidence presentation and public comments, the CTAF Panel voted on key questions concerning the comparative clinical effectiveness and comparative value of DPPs. These questions are developed by the ICER research team for each assessment, with input from the CTAF Advisory Board to ensure that the questions are framed to address the issues that are most important in applying the evidence to support clinical practice and medical policy decisions. The voting results are presented below, along with comments reflecting considerations mentioned by CTAF Panel members during the voting process.
In its deliberations and votes related to value, the CTAF Panel made use of a value assessment framework with four different components of care value, a concept which represents the long-term perspective, at the individual patient level, on patient benefits and the incremental costs to achieve those benefits. The four components of care value are comparative clinical effectiveness,

©Institute for Clinical and Economic Review, 2016 Page 51 Final Evidence Report – Diabetes Prevention Programs Return to Table of Contents
incremental cost per outcomes achieved, other benefits or disadvantages, and contextual considerations regarding the illness or therapy.
Figure 9. Care Value Framework
There are four elements to consider when deliberating on care value:
1. Comparative clinical effectiveness is a judgment of the overall difference in clinical outcomes between two interventions (or between an intervention and placebo), tempered by the level of certainty possible given the strengths and weaknesses of the body of evidence. CTAF uses the ICER Evidence Rating Matrix as its conceptual framework for considering comparative clinical effectiveness.
2. Incremental cost per outcomes achieved is the average per-patient incremental cost of one intervention compared to another to achieve a desired “health gain,” such as an additional stroke prevented, case of cancer diagnosed, or gain of a year of life. Alternative interventions are compared in terms of cost per unit of effectiveness, and the resulting comparison is presented as a ratio: a “cost per outcome achieved.” Relative certainty in the cost and outcome estimates continues to be a consideration. As a measure of incremental costs per outcomes achieved, ICER follows common academic and World Health Organization (WHO) standards by using cost per quality-adjusted life years (QALYs) and adopting thresholds at $100,000 per QALY and $150,000 per QALY as guides to reasonable ratios of incremental costs per outcomes achieved.
3. Other benefits or disadvantages refers to any significant benefits or disadvantages offered by the intervention to the individual patient, caregivers, the delivery system, other patients, or the public that would not have been considered as part of the evidence on comparative clinical effectiveness. Examples of other benefits include mechanisms of treatment delivery that require many fewer visits to the clinician’s office, treatments that reduce disparities across various patient groups, and new potential mechanisms of action for treating clinical conditions that have demonstrated low rates of response to currently available therapies. Other disadvantages could include increased burden of treatment on patients or their

©Institute for Clinical and Economic Review, 2016 Page 52 Final Evidence Report – Diabetes Prevention Programs Return to Table of Contents
caregivers. For each intervention evaluated, it will be open to discussion whether other benefits or disadvantages such as these are important enough to factor into the overall judgment of care value. There is no quantitative measure for other benefits or disadvantages.
4. Contextual considerations include ethical, legal, or other issues (but not cost) that influence the relative priority of illnesses and interventions. Examples of contextual considerations include whether there are currently any existing treatments for the condition, whether the condition severely affects quality of life or not, and whether the condition affects priority populations. There is no quantitative measure for the role of contextual considerations in an overall judgment of care value.
7.2 Summary of the Votes
During the June 24 public meeting, CTAF panel members discussed the considerations that factored into their votes and provided additional context in written notes. A summary of these deliberations is presented below.
For the purposes of these voting questions, prediabetes is defined using the American Diabetes Association (ADA) criteria of HbA1c 5.7 – 6.4%, fasting plasma glucose (FPG) of 100 – 125 mg/dL, or two-hour oral glucose tolerance test (OGTT) 140 – 199 mg/dL. Usual care is defined as a discussion between a provider and patient and/or provision of educational materials regarding the risk for diabetes and recommendations to decrease weight and increase exercise.
1. For patients with prediabetes, is the evidence adequate to demonstrate that the net health benefit of participation in an in-person diabetes prevention program (DPP) with group coaching is superior to that of usual care?
CTAF Panel Vote: 12 Yes (100%) 0 No (0%)
Comment: In discussions following the vote, one CTAF panel noted that the evidence on weight loss as a surrogate measure for diabetes prevention and delay is persuasive and that delaying the onset of diabetes even for a relatively short (two year) timeframe is important and valuable to patients.
2. Given the available evidence for patients with prediabetes, what is the care value of participation in an in-person DPP with group coaching vs. usual care?
CTAF Panel Vote a. 1 Low (8%) b. 4 Intermediate (33%) c. 7 High (58%)

©Institute for Clinical and Economic Review, 2016 Page 53 Final Evidence Report – Diabetes Prevention Programs Return to Table of Contents
Comment: In written comments describing their evaluation of comparative clinical effectiveness, the majority of the CTAF panel judged in-person DPPs with group coaching to provide superior net health benefits to usual care, though a minority of members determined the magnitude of benefit to be incremental. The panel unanimously found that these programs produce incremental cost-effectiveness ratios (ICERs) below $100,000 per quality-adjusted life year (QALY) gained. One panel member highlighted greater uncertainty in the current body of economic evidence compared to the clinical evidence, as most of the available cost-effectiveness analyses rely on data from trials of relatively short duration. For other benefits and disadvantages, many panel members listed the myriad health improvements that accompany weight loss beyond a reduction in diabetes incidence, including reduced rates of heart disease and depression. Panel members identified several significant contextual considerations surrounding in-person, group-based programs including concerns about potentially limited access to this program type in some geographic areas and the substantial opportunity costs of paying for an intervention targeted at such a large patient population. Other panel members noted the benefits that may accrue to the families of DPP participants who encourage their relatives to implement healthy lifestyle changes and a general sense that group-based programs improve the motivation of participants and the efficacy of the program itself. Overall, a majority of the CTAF panel determined that in-person DPPs with group coaching represent a high value to the health care system; one panel member who voted “low” remarked that weight loss in these programs is modest and may be difficult to sustain in the long-term, but that there seem to be opportunities to improve the clinical- and cost-effectiveness of these programs.
3. For patients with prediabetes, is the evidence adequate to demonstrate that the net health benefit of participation in a digital DPP with human coaching is superior to that of usual care?
CTAF Panel Vote: 11 Yes (92%) 1 No (8%)
Comment: Overall the CTAF panel judged that the evidence is adequate to demonstrate that digital DPPs with human coaches are superior to usual care. One panel member who voted “no” felt that more study is needed to confirm that the efficacy of the DPP intervention is not reduced by translation to a digital format.
4. Given the available evidence for patients with prediabetes, what is the care value of participation in a digital DPP with human coaching vs. usual care?
CTAF Panel Vote: a. 2 Low b. 6 Intermediate (50%) c. 4 High (33%)
Comment: The majority of the CTAF panel judged the comparative clinical effectiveness of digital DPPs with human coaches to be superior to usual care, with a minority determining the net health benefit to be incremental. A majority of panel members determined that digital,

©Institute for Clinical and Economic Review, 2016 Page 54 Final Evidence Report – Diabetes Prevention Programs Return to Table of Contents
human-coached programs produce incremental cost-effectiveness ratios below $100,000 per QALY gained, though some panel members highlighted greater uncertainty in these estimates due to the small number of published cost-effectiveness analyses of this digital approach. A majority of panel members identified significant other benefits and disadvantages for digital DPPs with human coaches, including the increased ease and convenience of participating in an online program and the ability of digital program vendors to rapidly collect and analyze participant data. Several panel members noted the importance of offering DPPs in digital and in-person formats to accommodate participant preference as a significant contextual consideration. Overall, a majority of the panel determined that digital DPPs with human coaches represent an intermediate care value due to uncertainty posed by the existence of fewer, lower quality studies of this approach as compared to the in-person, group-based modality.
5. For patients with prediabetes, is the evidence adequate to demonstrate that the net health benefit of participation in a digital DPP with fully-automated coaching is superior to that of usual care?
CTAF Panel Vote: 3 Yes (25%) 9 No (75%)
Comment: The majority of the CTAF panel judged that the evidence is currently inadequate to determine whether digital DPPs with algorithmic coaching are superior to usual care. In particular, the panel was swayed by the absence of long-term studies of program efficacy, as well as concerns about the generalizability of this approach to broad populations that may prefer human interaction. The panel emphasized that digital DPPs with algorithmic coaching carry many potential benefits, including the highest level of scalability at the lowest cost of all program types, but noted that further study is required to determine whether fully-algorithmic programs are similarly effective to DPPs with human coaches.
6. Given the available evidence for patients with prediabetes, what is the care value of participation in a digital DPP with fully-automated coaching vs. usual care?
Vote not taken due to inadequate evidence

©Institute for Clinical and Economic Review, 2016 Page 55 Final Evidence Report – Diabetes Prevention Programs Return to Table of Contents
8. Recommendations to Guide Policy and Practice Prior to the CTAF public meeting, ICER staff and consultants conducted semi-structured interviews with national and California-based experts to gain their perspectives on the practice and delivery of DPPs, barriers to change, and opportunities for improving program delivery. These key informants included DPP providers, professional societies, patient advocacy organizations, public health organizations, purchasers, and health plans (see Appendix B for the complete list).
The results of these interviews and research were used to inform a moderated discussion between CTAF panel members and policy roundtable participants. Clinical experts, health insurers, health policy experts, and a DPP participant discussed with panel members various policy options for improving access to and provision of diabetes prevention programs (see Table 8 for a list of policy roundtable participants). Conflict of interest information for all meeting participants can be found in Appendix J.
Table 8. Policy Roundtable Participants
Ann Albright, PhD, RD Director, Division of Diabetes Translation, Centers for Disease Control and Prevention
Tony Kuo, MD, MSHS Acting Director, Division of Chronic Disease and Injury Prevention and Director, Office of Senior Health, Los Angeles County Department of Public Health
Andrew Kuykendall, MSSW DPP Participant Elizabeth Murphy, MD, DPhil Chief, Endocrinology and Metabolism Division and Director of Diabetes Center
for High Risk Populations, San Francisco General Hospital; Professor of Clinical Medicine, UCSF
Arthur Southam, MD, MBA, MPH
Executive Vice President, Health Plan Operations, Kaiser Permanente
Tony Van Goor, MD, MMM, CPE, FACP
Senior Director, Medical Affairs, Medical Director for Policy and Technology Assessment, Blue Shield of California
Combining the insights gained from the earlier expert interviews with the votes on the evidence by CTAF (see Chapter 7 for a description of the voting process and a summary of the votes) and the ensuing policy roundtable discussion at the meeting, the following recommendations are presented to guide the implementation of diabetes prevention programs, and are organized by stakeholder audience. Additional resources are described in complementary Action Guides. Because the discussion at the meeting reflected multiple perspectives and opinions, the recommendations should not be taken as representing the views of individual members of CTAF, policy roundtable participants or the organizations they represent, or as a consensus view held by all participants. While the recommendations may use the general term “diabetes,” they pertain only to the

©Institute for Clinical and Economic Review, 2016 Page 56 Final Evidence Report – Diabetes Prevention Programs Return to Table of Contents
prevention of type 2 diabetes; type 1 diabetes is an unpreventable condition in which an auto-immune process destroys the insulin-producing cells in the pancreas, resulting in increased blood glucose levels.
For Payers
1. Cover DPPs from CDC-recognized providers across all lines of business and products. Make them available with zero copayments to encourage participation. Participants on the policy roundtable noted the myriad detrimental effects of diabetes on patients and emphasized that even a relatively short delay in the onset of diabetes is meaningful and important to patients. Payers should direct their members to programs with full or pending recognition from the CDC, as these programs are regularly evaluated and held to reporting and quality standards. Because diabetes disproportionately affects lower-income populations, payers should reduce barriers to participation, including making the programs available without copayments. Policy roundtable participants noted that a large copayment could be a disincentive to participation, particularly for individuals with limited income.
2. There is no single DPP format (e.g., in-person programs delivered to a group or digital programs with human coaches) that works for everyone, so make a variety of DPPs available to support patient preference. Policymakers on the roundtable and key informants emphasized that some patients will find success with in-person programs and some with online versions, and payers should recognize this nuance as they develop a network of DPP providers. Program network aggregators and integrators (i.e., an organization that links a broad number of DPP providers with purchasers and participants) are emerging and can aid in establishing a network of available DPP providers and in enabling beneficiary access. There is evidence that too much choice can be overwhelming for patients, so payers should consider offering a limited set of choices within each program format.
3. Establish pay-for-performance (P4P) contracts with DPP providers based on patient participation, retention in program, and achievement of weight loss goals. CDC-recognized programs are required to collect data on participation, retention through the full curriculum, and strong intermediate outcome measures such as weight reduction, and thus are well-positioned to engage in P4P contracts. Some DPP providers and aggregators/integrators have indicated they are willing to agree to contracts in which they are paid only if certain process or outcomes measures are achieved (e.g., initial enrollment, completion of four curriculum lessons, completion of nine curriculum lessons, 5% weight loss). These arrangements incentivize DPP providers to deliver effective coaching and support rather

©Institute for Clinical and Economic Review, 2016 Page 57 Final Evidence Report – Diabetes Prevention Programs Return to Table of Contents
than simply recruiting and getting paid for enrolling a large number of participants who may not be adequately prepared to implement the substantial lifestyle changes recommended by a DPP. Payers should compare beneficiary demographic information with claims from DPP providers to ensure that contracted programs do not avoid enrolling individuals from populations with challenges fully engaging with DPP programs (e.g., those with low income, low health literacy, non-English speakers).
4. Payers should encourage their clinical networks to support both active outreach and screening for prediabetes using standard blood glucose tests such as FPG and HbA1c. Identifying members with prediabetes is the first step to reducing their risk of progression to type 2 diabetes, which greatly decreases individual quality of life and increases utilization of health care services. Payers should use a combination of claims and EMR data to facilitate proactive outreach to individuals who may have prediabetes.
For Clinicians
1. Use both opportunistic encounters and active outreach to screen patients for prediabetes risk. For patients at high risk and with a BMI ≥ 24 kg/m2 (≥ 22 kg/m2 for patients of Asian descent), conduct an FPG or HbA1c test to detect prediabetes. The CDC and the American Medical Association (AMA) recommend that providers assess all patients over the age of 18 for prediabetes risk.112 Clinicians may be able to identify some patients when they come to the office for other care needs. In addition, provider groups should use electronic medical record (EMR) data to actively identify and reach out to patients who are at risk for prediabetes to encourage screening and referral. Clinicians should perform blood glucose tests for all patients at high risk for prediabetes who either exceed the aforementioned BMI thresholds or have a history of gestational diabetes mellitus. Both fasting plasma glucose (FPG) and HbA1c are reasonable and easier to perform than a two-hour glucose tolerance test. If a patient tests above the normal limit but below the threshold for diabetes (i.e., HbA1c of 5.7-6.4%, fasting plasma glucose of 100-125 mg/dL, oral glucose tolerance test results of 140-199 mg/dL), they have prediabetes and would benefit from referral to intensive counseling and coaching to lessen their risk of progression to type 2 diabetes. A recent CMS proposal to expand DPP coverage to Medicare beneficiaries uses higher BMI and FPG thresholds (BMI ≥ 25 kg/m2, ≥ 23 kg/m2 for Asians, and FPG of 110-125 mg/dL), so providers will need to be aware of the different eligibility criteria if the rule is implemented as currently written.
2. Refer patients to a local or online DPP as soon as prediabetes is detected, since that is the time people are most motivated to participate. DPPs are more effective than usual care (physician recommendations for weight loss and exercise), and even delaying the onset of diabetes by just a few years is beneficial to and desired by patients.

©Institute for Clinical and Economic Review, 2016 Page 58 Final Evidence Report – Diabetes Prevention Programs Return to Table of Contents
Key informants and policy roundtable members emphasized that individuals with prediabetes are the most motivated to change their lifestyle immediately upon learning about their increased risk for developing diabetes. It is important to use this opportunity to encourage patients with prediabetes to participate in a DPP and lead a healthy lifestyle. DPP interventions have been well-studied and tested, and they work much better than simple instructions from clinicians for individuals to lose weight, adjust diet, and exercise. DPPs are year-long programs, with the first six months involving the most intensive counseling. Additional maintenance programming after the initial one-year program ends may be necessary to help individuals maintain their weight loss, but the evidence base on these modules is still emerging. While weight loss appears to be the key factor leading to risk reduction, the desired outcome is normal glucose, so it is also important to perform a blood test after the individual completes a DPP.
For DPP Providers
1. DPP providers should apply for and obtain CDC recognition for their programs. DPP providers should use a CDC-approved curriculum, technical assistance resources, and support to start programs and maintain their efficacy. They should also apply for CDC recognition, as this is a key factor that insurers use when building provider networks. A recent draft proposal by CMS includes language that would require DPP providers to participate in the CDC recognition program to receive reimbursement from Medicare.
2. Tailor DPPs to include culturally-appropriate curricula for America’s diverse populations. While a standard curriculum is established and required for CDC recognition, the CDC has developed mechanisms for DPP providers to tailor the language and approach to the needs of communities and specific populations of participants. Culturally-appropriate curricula are likely to enhance the effectiveness of DPPs. In-person programs often recruit coaches who live in the communities they serve, and digital providers should do so as well since a strong link to the community will facilitate more culturally-relevant feedback. Key informant interviewees noted the need for curricula in languages other than English and Spanish, as well as for low-income and low-literacy populations. In-person programs should consider offering childcare and transportation support to reduce barriers to access, particularly for low-income participants.
3. Commit to pay-for-performance (P4P) contracts with purchasers and payers that base payment on participation, retention, and weight-loss outcomes. Health plans, employers, and aggregators/integrators interviewed to inform this review indicated that they strongly favor DPPs that engage in P4P arrangements. These contracts may

©Institute for Clinical and Economic Review, 2016 Page 59 Final Evidence Report – Diabetes Prevention Programs Return to Table of Contents
include a small fee for participant enrollment, but the majority of payment milestones should be structured around attendance (or engagement with online curriculum for digital DPPs) and meeting/sustaining weight-loss goals. DPPs that participate in the CDC’s recognition program are required to track these outcomes, so will be well-positioned for P4P arrangements.
For Policymakers
1. Implement environmental policies that promote physical activity and healthy eating and support healthy individual choices. DPPs should not be viewed in isolation, but rather as part of a broader effort to improve population health and the environments that participants return to after a class ends or when they turn off their digital device. For example, policies that promote the shared use of school recreational facilities, encourage farmer’s markets to set up stalls in areas that lack access to fresh fruits and vegetables, and mandate that government-owned vending machines carry only healthy foods may enhance the efficacy of DPPs. Local and state governments can also encourage healthy behaviors by implementing development and transportation policies that encourage physical activity (e.g., create protected bicycle lanes in cities, promote the use of public parks and trails). Members of the policy roundtable noted that creating a healthy environment through these types of policies may be sufficient to help individuals at the lower end of the prediabetes risk spectrum prevent their progression to type 2 diabetes, whereas a combination of environmental and individual supports may be needed for those at the higher end of the prediabetes risk spectrum.
For the General Public
1. Individuals who are overweight or obese should take this short survey or talk with their doctor about taking a blood test to see if they have a condition called prediabetes. Problems with blood sugar are very common among people who are overweight or obese, and some racial and ethnic groups (such as African Americans, American Indians, Asians, and Latinos) are at higher risk for diabetes. Some people with high blood sugar will be diagnosed with diabetes. Some people who have blood sugar that is higher than normal but not high enough to be diagnosed with diabetes will have prediabetes. Individuals with prediabetes have an increased risk of progressing to type 2 diabetes, but there are diabetes prevention programs that can help to lessen this risk.
2. People with prediabetes should participate in one of the available diabetes prevention programs (DPPs). These programs come in many forms, from in-person group meetings with a human coach, to online programs with human or automated coaching. Individuals should choose a program that meets their needs.

©Institute for Clinical and Economic Review, 2016 Page 60 Final Evidence Report – Diabetes Prevention Programs Return to Table of Contents
DPPs deliver a well-studied curriculum and can help lower the risk of progression to type 2 diabetes. These programs are increasingly covered by insurance, in many cases with little or no copayment. The goal of a DPP is to help participants lose 5% to 7% of their body weight through healthy eating, more physical activity, and by learning stress reduction and problem-solving strategies. While this may sound similar to a diet, DPPs contain lessons that are specifically tailored for people at high risk for developing diabetes.
DPPs are now available in a variety of formats, from in-person group meetings on a regular schedule, to online versions that can be accessed on a phone, tablet, or computer. Some people feel that they are more motivated to improve their health when they participate in a DPP with an in-person group. Other participants prefer the privacy and scheduling flexibility of online programs.
When choosing a DPP, it is important to select one that understands and connects with the community it serves. For example, while all programs encourage healthier food preparation (such as increasing use of fresh vegetables, avoiding fried foods), programs should tailor the information to the location and background of participants. Individuals interested in a DPP should check into the options available in their area and pick one that meets their personal preferences.
3. Encourage policies that promote healthy environments in workplaces, schools, and community settings. This will support lifestyle changes and help people get more exercise, eat foods that are healthier, and lose weight. More than one-third of America has diabetes or prediabetes, making the diabetes epidemic one of the most pressing public health concerns facing America today. One way that individuals, not just people with diabetes or prediabetes, can help everyone reduce their risk of developing diabetes is by encouraging businesses, schools, and government agencies to implement policies that promote physical activity and access to healthy food options. Individuals should ask businesses, schools, and government agencies to make healthier food available in cafeterias, vending machines, and during meetings. Employees should ask the human resources department at their workplace to support a walking group or an exercise class, or to make the stairs more attractive and easier to access so that people are encouraged to take the stairs. These types of changes will help reinforce the lessons learned in a DPP and help participants succeed.
For Purchasers
1. Employers should include DPPs in their suite of wellness benefits and encourage contracted health plans to cover DPPs.

©Institute for Clinical and Economic Review, 2016 Page 61 Final Evidence Report – Diabetes Prevention Programs Return to Table of Contents
DPPs have been well-studied and have been proven to help people with prediabetes reduce their risk of progression to type 2 diabetes through weight loss, improved nutrition, and increased physical activity. The strongest evidence is for in-person programs, but evidence is emerging for online programs as well. Healthier employees are more productive and have lower health care costs than employees in poor health. Studies on the cost-effectiveness of DPPs suggest a good return on investment for the individual, company, and society.
2. Create a work environment that supports healthy choices in cafeterias, vending machines, office meetings, and facilities. Develop an organizational culture in which senior leadership actively supports healthy choices. Employers should create a work environment that facilitates lifestyle changes to help employees in their efforts to improve their health. Some examples of environmental changes that help to amplify the effectiveness of DPPs are carpeting stairs and putting paintings in stairwells to encourage their use; and cafeteria, vending machine, and office meeting policies that support healthy food options. Policy roundtable participants emphasized the importance of senior staff leading by example (e.g., participating in a DPP, leading a walking group) to demonstrate the company’s commitment to healthy behaviors and to help motivate their employees.
Future Research Needs
1. Because there are still critical gaps in the evidence on DPPs, larger DPP organizations should collect, analyze, and publish their own experience in peer-reviewed health journals. Smaller, community-based programs should consider partnerships with their parent organizations or local academic institutions to publish analyses of their programs. Although the CTAF panel voted that DPPs are superior to usual care, panelists and policy roundtable members acknowledged that there are multiple important research gaps to fill. The remainder of the recommendations in this section provide detail on specific research questions. Larger DPP providers are likely to have the necessary resources and expertise to publish analyses of program effectiveness and innovative strategies to improve results, and smaller DPP providers should consider collaborating with local academic institutions or their parent organizations to do the same.
2. Identify which patients are most likely to succeed in the various types of in-person or digital programs. Participants on the policy roundtable agreed on the importance of making multiple program types available to participants but highlighted the difficulty in predicting whether an individual

©Institute for Clinical and Economic Review, 2016 Page 62 Final Evidence Report – Diabetes Prevention Programs Return to Table of Contents
participant will have the greatest likelihood of success in an in-person or digital program. Further research is needed to identify which participants are best suited to each DPP format, and the participant characteristics that predict success. Additional information on program effectiveness is particularly desired for racial and ethnic groups at higher risk of developing diabetes, low-income populations, and lower literacy populations. Also needed is information on how best to identify, recruit, engage, and retain high-risk populations in lifestyle change.
3. Identify specific program elements that are associated with participant success. Many experts, including key informants and members of the policy roundtable, agree that weight loss is the primary mediator in reducing or delaying the onset of diabetes. However, additional research is needed to identify program elements that are associated with the greatest reductions in blood glucose levels to further reduce participants’ risk of progression to diabetes. In addition, DPP providers should experiment with program elements to enhance the likelihood of participant adherence and success (e.g., identify the optimal group size, frequency of email or phone contact, strategies for engaging various demographic groups). Providers of digital programs are particularly well-positioned for these experiments, as they can rapidly implement and analyze the effects of different lessons, messages, and outreach strategies.
4. Examine the role of maintenance sessions delivered after the year-long DPP curriculum ends. DPP providers should develop and test maintenance modules and ongoing support lessons in collaboration with the CDC. DPPs guide participants in a difficult journey to implement lifestyle changes that need to be sustained well beyond the one-year program. In the absence of a maintenance module, the DPP participant on the policy roundtable shared the story of how he returned to a prediabetic state after completing the program. Without more effective options for sustained weight loss, he decided to re-enter the DPP from the beginning. CMS is considering the implementation of additional maintenance modules. DPP providers and the CDC should collaborate to study the optimal frequency, content, and duration of maintenance sessions. DPP providers should offer ongoing support for people who have already been through the 12-month program to ensure that the lifestyle changes are sustainable in the long-term.
5. Examine the long-term impact of DPPs on population health, diabetes prevention, and on health care utilization and costs. Much of the existing research on the DPP intervention is based on studies that delivered individual counseling to participants. As in-person, group-based programs and digital programs become more widely adopted, it will be important to confirm whether they are able to maintain the efficacy of the original intervention. While the original DPP Trial was powered to detect

©Institute for Clinical and Economic Review, 2016 Page 63 Final Evidence Report – Diabetes Prevention Programs Return to Table of Contents
reductions in the incidence of diabetes, there is comparatively limited data on this outcome from in-person programs delivered to a group or digital programs (with or without a human coach). These programs should track and publish data on glycemic control to facilitate analysis of their impact on diabetes prevention or delay. Long-term studies will also help establish the sustainability of the lifestyle changes that are necessary to prevent or delay the onset of diabetes. In addition, the current body of economic literature is heavily reliant on studies of relatively short duration and has not adequately captured the costs of screening a large patient population for prediabetes or program start-up and implementation costs.
****
This is the first CTAF review of diabetes prevention programs.

©Institute for Clinical and Economic Review, 2016 Page 64 Final Evidence Report – Diabetes Prevention Programs Return to Table of Contents
References 1. Centers for Disease Control and Prevention. Prediabetes: Could It Be You?
http://www.cdc.gov/diabetes/pubs/statsreport14/prediabetes-infographic.pdf. Accessed April 15, 2016.
2. Babey S, Wolstein J, Diamant A, Goldstein H. Prediabetes in California: Nearly Half of California Adults on Path to Diabetes. 2016.
3. Diabetes Prevention Program Research Group. Reduction in the Incidence of Type 2 Diabetes with Lifestyle Intervention or Metformin. New England Journal of Medicine. 2002;346(6):393-403.
4. Hamman R, Horton E, Barrett-Connor E, et al. Factors affecting the decline in incidence of diabetes in the Diabetes Prevention Program Outcomes Study (DPPOS). Diabetes. 2015;64(3):989-998.
5. Maruthur N, Ma Y, Delahanty L, et al. Early response to preventive strategies in the Diabetes Prevention Program. Journal of general internal medicine. 2013;28(12):1629-1636.
6. Hamman R, Wing R, Edelstein S, et al. Effect of weight loss with lifestyle intervention on risk of diabetes. Diabetes care. 2006;29(9):2102-2107.
7. Ackermann R, Finch E, Brizendine E, Zhou H, Marrero D. Translating the Diabetes Prevention Program into the community. The DEPLOY Pilot Study. American journal of preventive medicine. 2008;35(4):357-363.
8. Marrero DG, Palmer KNB, Phillips EO, Miller-Kovach K, Foster GD, Saha CK. Comparison of Commercial and Self-Initiated Weight Loss Programs in People With Prediabetes: A Randomized Control Trial. American Journal of Public Health. 2016;106(5):949-956.
9. Sepah S, Jiang L, Peters A. Long-term outcomes of a Web-based diabetes prevention program: 2-year results of a single-arm longitudinal study. Journal of medical Internet research. 2015;17(4):e92.
10. Turnaround Health. About the Program. 2016; http://turnaroundhealth.com/about-the-program/. Accessed June 2, 2016.
11. Centers for Medicare & Medicaid Services. Federal Register. In: Services DoHaH, ed. Vol 812016:46143-46148.
12. Montana Department of Public Health & Human Services. Adult Medicaid Beneficiaries Successfully Participating in an Adapted Diabetes Prevention Program. Vol 92014.
13. Centers for Disease Control and Prevention. Join Your Peers - Lead the Way. 2016; http://www.cdc.gov/diabetes/prevention/employers-insurers/join_peers.html. Accessed April 22, 2016.
14. Ali M, Echouffo-Tcheugui J, Williamson D. How effective were lifestyle interventions in real-world settings that were modeled on the Diabetes Prevention Program? Health affairs (Project Hope). 2012;31(1):67-75.
15. Johnson M, Jones R, Freeman C, et al. Can diabetes prevention programmes be translated effectively into real-world settings and still deliver improved outcomes? A synthesis of evidence. Diabetic medicine : a journal of the British Diabetic Association. 2013;30(1):3-15.
16. Aziz Z, Absetz P, Oldroyd J, Pronk N, Oldenburg B. A systematic review of real-world diabetes prevention programs: learnings from the last 15 years. Implementation science : IS. 2015;10:172.

©Institute for Clinical and Economic Review, 2016 Page 65 Final Evidence Report – Diabetes Prevention Programs Return to Table of Contents
17. Balk E, Earley A, Raman G, Avendano E, Pittas A, Remington P. Combined Diet and Physical Activity Promotion Programs to Prevent Type 2 Diabetes Among Persons at Increased Risk: A Systematic Review for the Community Preventive Services Task Force. Ann Intern Med. 2015;163(6):437-451.
18. Tabak R, Sinclair K, Baumann A, et al. A review of diabetes prevention program translations: use of cultural adaptation and implementation research. Translational behavioral medicine. 2015;5(4):401-414.
19. Neamah H, Kuhlmann A, Tabak R. Effectiveness of Program Modification Strategies of the Diabetes Prevention Program: A Systematic Review. The Diabetes educator. 2016;42(2):153-165.
20. Ackermann R, Finch E, Caffrey H, Lipscomb E, Hays L, Saha C. Long-term effects of a community-based lifestyle intervention to prevent type 2 diabetes: the DEPLOY extension pilot study. Chronic illness. 2011;7(4):279-290.
21. Ackermann R, Liss D, Finch E, et al. A Randomized Comparative Effectiveness Trial for Preventing Type 2 Diabetes. Am J Public Health. 2015;105(11):2328-2334.
22. Ackermann R, Marrero D. Adapting the Diabetes Prevention Program lifestyle intervention for delivery in the community: the YMCA model. The Diabetes educator. 2007;33(1):69, 74-65, 77-68.
23. Blackwell C, Foster K, Isom S, et al. Healthy Living Partnerships to Prevent Diabetes: recruitment and baseline characteristics. Contemporary clinical trials. 2011;32(1):40-49.
24. Block G, Azar K, Romanelli R, et al. Diabetes Prevention and Weight Loss with a Fully Automated Behavioral Intervention by Email, Web, and Mobile Phone: A Randomized Controlled Trial Among Persons with Prediabetes. Journal of medical Internet research. 2015;17(10):e240.
25. Block G, Azar K, Block T, et al. A Fully Automated Diabetes Prevention Program, Alive-PD: Program Design and Randomized Controlled Trial Protocol. JMIR research protocols. 2015;4(1):e3.
26. Bozack A, Millstein S, Garcel J, Kelly K, Ruberto R, Weiss L. Implementation and outcomes of the New York State YMCA diabetes prevention program: a multisite community-based translation, 2010-2012. Preventing chronic disease. 2014;11:E115.
27. Brokaw S, Arave D, Emerson D, Butcher M, Helgerson S, Harwell T. Intensive lifestyle intervention goals can be achieved as effectively with large groups as with small groups. Primary care diabetes. 2014;8(4):295-300.
28. Katula J, Vitolins M, Morgan T, et al. The Healthy Living Partnerships to Prevent Diabetes study: 2-year outcomes of a randomized controlled trial. American journal of preventive medicine. 2013;44(4 Suppl 4):S324-332.
29. Katula J, Vitolins M, Rosenberger E, et al. Healthy Living Partnerships to Prevent Diabetes (HELP PD): design and methods. Contemporary clinical trials. 2010;31(1):71-81.
30. Katula J, Vitolins M, Rosenberger E, et al. One-year results of a community-based translation of the Diabetes Prevention Program: Healthy-Living Partnerships to Prevent Diabetes (HELP PD) Project. Diabetes care. 2011;34(7):1451-1457.
31. Lipscomb E, Finch E, Brizendine E, Saha C, Hays L, Ackermann R. Reduced 10-year risk of coronary heart disease in patients who participated in a community-based diabetes prevention program: the DEPLOY pilot study. Diabetes care. 2009;32(3):394-396.

©Institute for Clinical and Economic Review, 2016 Page 66 Final Evidence Report – Diabetes Prevention Programs Return to Table of Contents
32. McTigue K, Conroy M, Hess R, et al. Using the internet to translate an evidence-based lifestyle intervention into practice. Telemedicine journal and e-health : the official journal of the American Telemedicine Association. 2009;15(9):851-858.
33. Sepah S, Jiang L, Peters A. Translating the Diabetes Prevention Program into an Online Social Network: Validation against CDC Standards. The Diabetes educator. 2014;40(4):435-443.
34. Vojta D, Koehler T, Longjohn M, Lever J, Caputo N. A coordinated national model for diabetes prevention: linking health systems to an evidence-based community program. American journal of preventive medicine. 2013;44(4 Suppl 4):S301-306.
35. Ratner R, Goldberg R, Haffner S, et al. Impact of intensive lifestyle and metformin therapy on cardiovascular disease risk factors in the diabetes prevention program. Diabetes care. 2005;28(4):888-894.
36. Diabetes Prevention Program Research Group. Long-term effects of lifestyle intervention or metformin on diabetes development and microvascular complications over 15-year follow-up: the Diabetes Prevention Program Outcomes Study. The Lancet Diabetes & Endocrinology. 2015;3(11):866-875.
37. Yudkin JS, Montori VM. The epidemic of pre-diabetes: the medicine and the politics. BMJ (Clinical research ed.). 2014;349:g4485.
38. Li R, Qu S, Zhang P, et al. Economic Evaluation of Combined Diet and Physical Activity Promotion Programs to Prevent Type 2 Diabetes Among Persons at Increased Risk: A Systematic Review for the Community Preventive Services Task Force. Ann Intern Med. 2015;163(6):452-460.
39. Diabetes Prevention Program Research Group. Within-trial cost-effectiveness of lifestyle intervention or metformin for the primary prevention of type 2 diabetes. Diabetes care. 2003;26(9):2518-2523.
40. Diabetes Prevention Program Research Group. The 10-year cost-effectiveness of lifestyle intervention or metformin for diabetes prevention: an intent-to-treat analysis of the DPP/DPPOS. Diabetes care. 2012;35(4):723-730.
41. Diabetes Prevention Program Research Group. Erratum: The 10-year cost-effectiveness of lifestyle intervention or metformin for diabetes prevention: an intent-to-treat analysis of the DPP/DPPOS. Diabetes Care 2012;35:723–730. Diabetes care. 2013;36(12):4172-4175.
42. Herman W, Hoerger T, Brandle M, et al. The Cost-Effectiveness of Lifestyle Modification or Metformin in Preventing Type 2 Diabetes in Adults with Impaired Glucose Tolerance. Annals of internal medicine. 2005;142(5):323-332.
43. Eddy D, Schlessinger L, Kahn R. Clinical outcomes and cost-effectiveness of strategies for managing people at high risk for diabetes. Ann Intern Med. 2005;143(4):251-264.
44. Hinnant L, Razi S, Lewis R, et al. Awardee-Level Findings: YMCA of the USA. Research Triangle Park, NC: RTI International;2016.
45. Spitalnic P. Certification of Medicare Diabetes Prevention Program. In: Centers for Medicare and Medicaid Services, ed. Department of Health and Human Services2016.
46. Su W, Chen F, Dall T, Iacobucci W, Perreault L. Return on Investment for Digital Behavioral Counseling in Patients With Prediabetes and Cardiovascular Disease. Preventing chronic disease. 2016;13:E13.
47. Smith K, Kuo S, Zgibor J, et al. Cost effectiveness of an internet-delivered lifestyle intervention in primary care patients with high cardiovascular risk. Preventive medicine. 2016;87:103-109.

©Institute for Clinical and Economic Review, 2016 Page 67 Final Evidence Report – Diabetes Prevention Programs Return to Table of Contents
48. Kahn R, Davidson MB. The Reality of Type 2 Diabetes Prevention. Diabetes care. 2014;37(4):943-949.
49. Centers for Disease Control and Prevention. National Diabetes Statistics Report: Estimates of Diabetes and Its Burden in the United States, 2014. Atlanta, GA: U.S. Department of Health and Human Services;2014.
50. Nguyen N, Nguyen X, Lane J, Wang P. Relationship between obesity and diabetes in a US adult population: findings from the National Health and Nutrition Examination Survey, 1999-2006. Obesity surgery. 2011;21(3):351-355.
51. Bullard K, Saydah S, Imperatore G, et al. Secular Changes in U.S. Prediabetes Prevalence Defined by Hemoglobin A1c and Fasting Plasma Glucose. National Health and Nutrition Examination Surveys, 1999–2010. 2013;36(8):2286-2293.
52. Dall T, Yang W, Halder P, et al. The economic burden of elevated blood glucose levels in 2012: diagnosed and undiagnosed diabetes, gestational diabetes mellitus, and prediabetes. Diabetes care. 2014;37(12):3172-3179.
53. Babey S. RE: question on prediabetes in lower-income populations. In: Shore K, ed. Email communication ed2016.
54. Florez H, Pan Q, Ackermann R, et al. Impact of lifestyle intervention and metformin on health-related quality of life: the diabetes prevention program randomized trial. Journal of general internal medicine. 2012;27(12):1594-1601.
55. Ollendorf DA, Shore KK, Cameron C, et al. Controversies in Obesity Management: A Technology Assessment. Institute for Clinical and Economic Review;2015.
56. American Diabetes Association. Diagnosing Diabetes and Learning About Prediabetes. 2015; http://www.diabetes.org/diabetes-basics/diagnosis/. Accessed April 28, 2016.
57. Centers for Disease Control and Prevention. National Diabetes Statistics Report, 2014: Data Sources, Methods, and References for Estimates of Diabetes and Its Burden in the United States. 2016.
58. World Health Organization. Definition and Diagnosis of Diabetes Mellitus and Intermediate Hyperglycemia: Report of a WHO/IDF Consultation. Geneva, Switzerland2006.
59. Centers for Disease Control and Prevention. National Diabetes Prevention Program: Curricula and Handouts. 2016; http://www.cdc.gov/diabetes/prevention/lifestyle-program/curriculum.html. Accessed June 3, 2016.
60. Centers for Disease Control and Prevention. Frequently Asked Questions about Submitting Data to the Diabetes Prevention Recognition Program. http://www.cdc.gov/diabetes/prevention/pdf/submit_data_faqs.pdf. Accessed 2016, April 25.
61. Gruss SM. RE: Question re: number of recognized DPPs over time. In: Seidner M, ed2016. 62. American Medical Association. Prevent Diabetes STAT. 2015; http://www.ama-
assn.org/sub/prevent-diabetes-stat/index.html. Accessed April 19, 2015. 63. Bocchino C. Health Plans’ Experience with the National Diabetes Prevention Program:
Considerations for Organizations Who May Offer the DPP. America's Health Insurance Plans, ; March 2016 2016.
64. Ad Council, American Diabetes Association, American Medical Association, Centers for Disease Control and Prevention. Do I Have Prediabetes? 2016; https://doihaveprediabetes.org/. Accessed April 19, 2016.

©Institute for Clinical and Economic Review, 2016 Page 68 Final Evidence Report – Diabetes Prevention Programs Return to Table of Contents
65. Centers for Disease Control and Prevention. Registry of Recognized Organizations. [Microsoft Excel spreadsheet]. 2016; https://nccd.cdc.gov/DDT_DPRP/Registry.aspx. Accessed May 6, 2016.
66. Centers for Disease Control and Prevention. Centers for Disease Control and Prevention Diabetes Prevention Recognition Program: Standards and Operating Procedures. 2015; http://www.cdc.gov/diabetes/prevention/pdf/dprp-standards.pdf. Accessed April 25, 2016.
67. YMCA. Diabetes Statistics. http://www.ymca.net/diabetes-prevention/statistics.html. Accessed April 25, 2016.
68. Chou C, Burnet D, Meltzer D, Huang E. The Effectiveness of Diabetes Prevention Programs in Community Settings. University of Chicago;2015.
69. Pew Research Center. The Smartphone Difference. 2015. 70. Kaiser Family Foundation. Preventive Services Covered by Private Health Plans under the
Affordable Care Act. 2015; http://kff.org/health-reform/fact-sheet/preventive-services-covered-by-private-health-plans/. Accessed April 15, 2016.
71. Siu A, Bibbins-Domingo K, Grossman D. Evidence-based clinical prevention in the era of the patient protection and affordable care act: The role of the us preventive services task force. JAMA. 2015;314(19):2021-2022.
72. LeFevre M, U.S. Preventive Services Task Force. Behavioral Counseling to Promote a Healthful Diet and Physical Activity for Cardiovascular Disease Prevention in Adults with Cardiovascular Risk Factors: U.S. Preventive Services Task Force Recommendation Statement. Annals of Internal Medicine. 2014;161(8):587-593.
73. Siu A, U.S. Preventive Services Task Force. Screening for Abnormal Blood Glucose and Type 2 Diabetes Mellitus: U.S. Preventive Services Task Force Recommendation Statement. Annals of Internal Medicine. 2015;163(11):861-868.
74. American Medical Association. New 2016 National Diabetes Prevention Program CPT Code: Background, description and frequently asked questions. 2016.
75. National Association of Chronic Disease Directors. Preventing Type 2 Diabetes: Health Insurance Coverage. 2015; http://www.chronicdisease.org/?NDPP_insure.
76. Pan X, Li GW, Hu Y, et al. Effects of diet and exercise in preventing NIDDM in people with impaired glucose tolerance. The Da Qing IGT and Diabetes Study. Diabetes care. 1997;20(4):537-544.
77. Tuomilehto J, Lindstrom J, Eriksson JG, et al. Prevention of type 2 diabetes mellitus by changes in lifestyle among subjects with impaired glucose tolerance. The New England journal of medicine. 2001;344(18):1343-1350.
78. Dunkley A, Bodicoat D, Greaves C, et al. Diabetes prevention in the real world: effectiveness of pragmatic lifestyle interventions for the prevention of type 2 diabetes and of the impact of adherence to guideline recommendations: a systematic review and meta-analysis. Diabetes care. 2014;37(4):922-933.
79. Aguiar EJ, Morgan PJ, Collins CE, Plotnikoff RC, Callister R. Efficacy of interventions that include diet, aerobic and resistance training components for type 2 diabetes prevention: a systematic review with meta-analysis. International Journal of Behavioral Nutrition and Physical Activity. 2014;11(1):1-10.
80. Angermayr L, Melchart D, Linde K. Multifactorial lifestyle interventions in the primary and secondary prevention of cardiovascular disease and type 2 diabetes mellitus--a systematic

©Institute for Clinical and Economic Review, 2016 Page 69 Final Evidence Report – Diabetes Prevention Programs Return to Table of Contents
review of randomized controlled trials. Annals of behavioral medicine : a publication of the Society of Behavioral Medicine. 2010;40(1):49-64.
81. Baker M, Simpson K, Lloyd B, Bauman A, Singh M. Behavioral strategies in diabetes prevention programs: a systematic review of randomized controlled trials. Diabetes research and clinical practice. 2011;91(1):1-12.
82. Cardona-Morrell M, Rychetnik L, Morrell S, Espinel P, Bauman A. Reduction of diabetes risk in routine clinical practice: are physical activity and nutrition interventions feasible and are the outcomes from reference trials replicable? A systematic review and meta-analysis. BMC public health. 2010;10:653.
83. Eaglehouse Y, Kramer M, Rockette-Wagner B, Arena V, Kriska A. Evaluation of physical activity reporting in community Diabetes Prevention Program lifestyle intervention efforts: A systematic review. Preventive medicine. 2015;77:191-199.
84. Gillett M, Royle P, Snaith A, et al. Non-pharmacological interventions to reduce the risk of diabetes in people with impaired glucose regulation: a systematic review and economic evaluation. Health technology assessment (Winchester, England). 2012;16(33):1-236, iii-iv.
85. Gillies C, Abrams K, Lambert P, et al. Pharmacological and lifestyle interventions to prevent or delay type 2 diabetes in people with impaired glucose tolerance: systematic review and meta-analysis. BMJ (Clinical research ed.). 2007;334(7588):299.
86. Glechner A, Harreiter J, Gartlehner G, et al. Sex-specific differences in diabetes prevention: a systematic review and meta-analysis. Diabetologia. 2015;58(2):242-254.
87. Hopper I, Billah B, Skiba M, Krum H. Prevention of diabetes and reduction in major cardiovascular events in studies of subjects with prediabetes: meta-analysis of randomised controlled clinical trials. European journal of cardiovascular prevention and rehabilitation : official journal of the European Society of Cardiology, Working Groups on Epidemiology & Prevention and Cardiac Rehabilitation and Exercise Physiology. 2011;18(6):813-823.
88. Jackson L. Translating the Diabetes Prevention Program into practice: a review of community interventions. The Diabetes educator. 2009;35(2):309-320.
89. Laws R, St George A, Rychetnik L, Bauman A. Diabetes prevention research: a systematic review of external validity in lifestyle interventions. American journal of preventive medicine. 2012;43(2):205-214.
90. Lin JS, O'Connor E, Evans CV, Senger CA, Rowland MG, Groom HC. Behavioral Counseling to Promote a Healthy Lifestyle in Persons With Cardiovascular Risk Factors: A Systematic Review for the U.S. Preventive Services Task ForceHealthy Lifestyle Counseling in Persons With Cardiovascular Risk Factors. Annals of Internal Medicine. 2014;161(8):568-578.
91. Lindstrom J, Wikstrom K, Maggini M, et al. Quality indicators for diabetes prevention programs in health care targeted at people at high risk. Annali dell'Istituto superiore di sanita. 2015;51(3):187-191.
92. Morris D, Khunti K, Achana F, et al. Progression rates from HbA1c 6.0-6.4% and other prediabetes definitions to type 2 diabetes: a meta-analysis. Diabetologia. 2013;56(7):1489-1493.
93. Nield L, Summerbell C, Hooper L, Whittaker V, Moore H. Dietary advice for the prevention of type 2 diabetes mellitus in adults. The Cochrane database of systematic reviews. 2008(3):Cd005102.

©Institute for Clinical and Economic Review, 2016 Page 70 Final Evidence Report – Diabetes Prevention Programs Return to Table of Contents
94. Orozco L, Buchleitner A, Gimenez-Perez G, Roque IFM, Richter B, Mauricio D. Exercise or exercise and diet for preventing type 2 diabetes mellitus. The Cochrane database of systematic reviews. 2008(3):Cd003054.
95. Samuel-Hodge C, Johnson C, Braxton D, Lackey M. Effectiveness of Diabetes Prevention Program translations among African Americans. Obesity reviews : an official journal of the International Association for the Study of Obesity. 2014;15 Suppl 4:107-124.
96. Satterfield D, Volansky M, Caspersen C, et al. Community-based lifestyle interventions to prevent type 2 diabetes. Diabetes care. 2003;26(9):2643-2652.
97. Schellenberg E, Dryden D, Vandermeer B, Ha C, Korownyk C. Lifestyle interventions for patients with and at risk for type 2 diabetes: a systematic review and meta-analysis. Ann Intern Med. 2013;159(8):543-551.
98. Taylor J, Cottrell C, Chatterton H, et al. Identifying risk and preventing progression to Type 2 diabetes in vulnerable and disadvantaged adults: a pragmatic review. Diabetic medicine : a journal of the British Diabetic Association. 2013;30(1):16-25.
99. Whittemore R. A systematic review of the translational research on the Diabetes Prevention Program. Translational behavioral medicine. 2011;1(3):480-491.
100. Yamaoka K, Tango T. Efficacy of lifestyle education to prevent type 2 diabetes: a meta-analysis of randomized controlled trials. Diabetes care. 2005;28(11):2780-2786.
101. Yates T, Khunti K, Bull F, Gorely T, Davies M. The role of physical activity in the management of impaired glucose tolerance: a systematic review. Diabetologia. 2007;50(6):1116-1126.
102. Cook D, Mulrow C, Haynes R. Systematic reviews: synthesis of best evidence for clinical decisions. Ann Intern Med. 1997;126(5):376-380.
103. Moher D, Liberati A, Tetzlaff J, Altman D. Preferred reporting items for systematic reviews and meta-analyses: the PRISMA statement. PloS Med. 2009;6.
104. Agency for Healthcare Research and Quality. U.S. Preventive Services Task Force Procedure Manual. 2008.
105. Ollendorf DA, Pearson SD. An integrated evidence rating to frame comparative effectiveness assessments for decision makers. Medical care. 2010;48(6 Suppl):S145-152.
106. Li R, Zhang P, Barker L, Chowdhury F, Zhang X. Cost-effectiveness of interventions to prevent and control diabetes mellitus: a systematic review. Diabetes care. 2010;33(8):1872-1894.
107. Hoerger T, Hicks K, Sorensen S, et al. Cost-effectiveness of screening for pre-diabetes among overweight and obese U.S. adults. Diabetes care. 2007;30(11):2874-2879.
108. Eddy D, Schlessinger L, Kahn R. Managing People at High Risk for Diabetes. Annals of Internal Medicine. 2006;144(1):67-68.
109. Herman W, Hoerger T, Hicks K, et al. Managing People at High Risk for Diabetes. Annals of Internal Medicine. 2006;144(1):66-67.
110. Block G. Response from Turnaround Health. In: Seidner M, ed. Attachment to email communication ed2016.
111. Block G. Public comments received on "Diabetes Prevention Programs: Effectiveness and Value" by May 23, 2016. 2016; 16-18. Available at: icer-review.org/wp-content/uploads/2016/06/CTAF_DPP_Public_Comment_060616.pdf.
112. Centers for Disease Control and Prevention, American Medical Association. Point-of-care prediabetes identification. [PDF]. https://download.ama-assn.org/resources/doc/prevent-diabetes-stat/point-of-care-prediabetes-identification-algorithm.pdf. Accessed July 22, 2016.

©Institute for Clinical and Economic Review, 2016 Page 71 Final Evidence Report – Diabetes Prevention Programs Return to Table of Contents
113. Garber AJ, Abrahamson MJ, Barzilay JI, et al. Consensus Statement by The American Association Of Clinical Endocrinologists And American College Of Endocrinology On The Comprehensive Type 2 Diabetes Management Algorithm – 2016 Executive Summary. Endocrine Practice. 2016;22(1):84-113.
114. American College of Obstetricians and Gynecologists. Practice Bulletin No. 137: Gestational Diabetes Mellitus. Obstetrics & Gynecology. 2013;122(2, PART 1):406-416.
115. American Diabetes Association. Standards of Medical Care in Diabetes - 2016. Diabetes care. 2016;39(Supplement 1):S36-S38.
116. Jensen M, Ryan D, Apovian C, et al. 2013 AHA/ACC/TOS Guideline for the Management of Overweight and Obesity in Adults: A Report of the American College of Cardiology/American Heart Association Task Force on Practice Guidelines and The Obesity Society. Circulation. 2013.
117. Canadian Diabetes Association Clinical Practice Guidelines Expert Committee. Canadian Diabetes Association 2013 Clinical Practice Guidelines for the Prevention and Management of Diabetes in Canada. Canadian Journal of Diabetes. 2013;37(Supplement 1):S9-S178.
118. Blumer I, Hadar E, Hadden DR, et al. Diabetes and Pregnancy: An Endocrine Society Clinical Practice Guideline. The Journal of Clinical Endocrinology & Metabolism. 2013;98(11):4227-4249.
119. Rosenzweig JL, Ferrannini E, Grundy SM, et al. Primary Prevention of Cardiovascular Disease and Type 2 Diabetes in Patients at Metabolic Risk: An Endocrine Society Clinical Practice Guideline. The Journal of Clinical Endocrinology & Metabolism. 2008;93(10):3671-3689.
120. Redmon B, Caccamo D, Flavin P, et al. Diagnosis and Management of Type 2 Diabetes Mellitus in Adults. Institute for Clinical Systems Improvement; July 2014.
121. National Institute for Health and Care Excellence. Type 2 diabetes: prevention in people at high risk (PH38). National Institute for Health and Care Excellence; July 12 2012.
122. Paulweber B, Valensi P, Lindstrom J, et al. A European evidence-based guideline for the prevention of type 2 diabetes. Hormone and metabolic research = Hormon- und Stoffwechselforschung = Hormones et metabolisme. 2010;42 Suppl 1:S3-36.
123. United States Department of Veterans Affairs, United States Department of Defense. VA/DoD Clinical Practice Guideline for the Management of Diabetes Mellitus. August 2010.
124. United States Department of Veterans Affairs, United States Department of Defense. VA/DoD Clinical Practice Guideline for the Management of Pregnancy. 2009.
125. Medicare Diabetes Prevention Act of 2015. (D-MN) SAF, trans. 114 ed2015. 126. Brokaw S, Carpenedo D, Campbell P, et al. Effectiveness of an Adapted Diabetes Prevention
Program Lifestyle Intervention in Older and Younger Adults. Journal of the American Geriatrics Society. 2015;63(6):1067-1074.
127. Aetna tests personalized lifestyle therapy on employees [press release]. October 11, 2013. 128. AHIP, Health Plans Working to Implement National Diabetes Prevention Program [press
release]. November 28 2012. 129. New Program Helps Lower Risk of Diabetes: Anthem Blue Cross and Blue Shield Offers
National Diabetes Prevention Program To All Colorado Members [press release]. August 6, 2015.
130. Anthem Blue Cross Blue Shield. Diabetes Prevention Program overview - Colorado. 2016; https://www.anthem.com/provider/co/f2/s3/t0/pw_e243542.pdf?refer=ahpprovider. Accessed June 3, 2016.

©Institute for Clinical and Economic Review, 2016 Page 72 Final Evidence Report – Diabetes Prevention Programs Return to Table of Contents
131. Cigna, BodyMedia partner to study diabetes prevention [press release]. January 24, 2013. 132. Omada Health Inc. Prevent: Humana. https://go.omadahealth.com/deployments/humana.
Accessed May 27, 2016. 133. Vojta D. Personal telephonic comminication. In: Seidner M, Shore K, Weissberg J, eds2016. 134. Health Net. Omada Health - Diabetes Prevention. 2016;
https://www.healthnet.com/portal/member/content/iwc/mysites/calpers/omada.action. Accessed March 30, 2016.
135. Health Net. Prevent by Omada. 2016; https://www.healthnet.com/portal/member/content/iwc/mysites/myaon/omada.action. Accessed March 30, 2016.
136. Lawlor M, Blackwell C, Isom S, et al. Cost of a group translation of the Diabetes Prevention Program: Healthy Living Partnerships to Prevent Diabetes. American journal of preventive medicine. 2013;44(4 Suppl 4):S381-389.
137. Zhuo X, Zhang P, Gregg E, et al. A nationwide community-based lifestyle program could delay or prevent type 2 diabetes cases and save $5.7 billion in 25 years. Health affairs (Project Hope). 2012;31(1):50-60.
138. Kaufman AB, Booth J, Kaufman ND. Return on Investment (ROI) from the Online Diabetes Prevention Program (DPP). Paper presented at: 72nd Scientific Session of the American Diabetes Association; June 8-12, 2012, 2012; Philadelphia, PA.
139. Ross K, Kaurman N. Automated Coaching: Technology Delivers Proven Weight Loss Intervention at Affordable Cost While Minimizing Personal Time. Paper presented at: Care Continuum Alliance Forum; October, 2013; Scottsdale, AZ.

©Institute for Clinical and Economic Review, 2016 Page 73 Final Evidence Report – Diabetes Prevention Programs Return to Table of Contents
APPENDICES

©Institute for Clinical and Economic Review, 2016 Page 74 Final Evidence Report – Diabetes Prevention Programs Return to Table of Contents
Appendix A. Search Strategies and Results Table A1. PRISMA 2009 Checklist
# Checklist item TITLE
Title 1 Identify the report as a systematic review, meta-analysis, or both. ABSTRACT
Structured summary 2 Provide a structured summary including, as applicable: background; objectives; data sources; study eligibility criteria, participants, and interventions; study appraisal and synthesis methods; results; limitations; conclusions and implications of key findings; systematic review registration number.
INTRODUCTION Rationale 3 Describe the rationale for the review in the context of what is already known. Objectives 4 Provide an explicit statement of questions being addressed with reference to participants, interventions, comparisons,
outcomes, and study design (PICOS). METHODS
Protocol and registration 5 Indicate if a review protocol exists, if and where it can be accessed (e.g., Web address), and, if available, provide registration information including registration number.
Eligibility criteria 6 Specify study characteristics (e.g., PICOS, length of follow-up) and report characteristics (e.g., years considered, language, publication status) used as criteria for eligibility, giving rationale.
Information sources 7 Describe all information sources (e.g., databases with dates of coverage, contact with study authors to identify additional studies) in the search and date last searched.
Search 8 Present full electronic search strategy for at least one database, including any limits used, such that it could be repeated.
Study selection 9 State the process for selecting studies (i.e., screening, eligibility, included in systematic review, and, if applicable, included in the meta-analysis).
Data collection process 10 Describe method of data extraction from reports (e.g., piloted forms, independently, in duplicate) and any processes for obtaining and confirming data from investigators.
Data items 11 List and define all variables for which data were sought (e.g., PICOS, funding sources) and any assumptions and simplifications made.
Risk of bias in individual studies
12 Describe methods used for assessing risk of bias of individual studies (including specification of whether this was done at the study or outcome level), and how this information is to be used in any data synthesis.
Summary measures 13 State the principal summary measures (e.g., risk ratio, difference in means). Synthesis of results 14 Describe the methods of handling data and combining results of studies, if done, including measures of consistency
(e.g., I2) for each meta-analysis.

©Institute for Clinical and Economic Review, 2016 Page 75 Final Evidence Report – Diabetes Prevention Programs Return to Table of Contents
Risk of bias across studies 15 Specify any assessment of risk of bias that may affect the cumulative evidence (e.g., publication bias, selective reporting within studies).
Additional analyses 16 Describe methods of additional analyses (e.g., sensitivity or subgroup analyses, meta-regression), if done, indicating which were pre-specified.
RESULTS Study selection 17 Give numbers of studies screened, assessed for eligibility, and included in the review, with reasons for exclusions at
each stage, ideally with a flow diagram. Study characteristics 18 For each study, present characteristics for which data were extracted (e.g., study size, PICOS, follow-up period) and
provide the citations. Risk of bias within studies 19 Present data on risk of bias of each study and, if available, any outcome level assessment (see item 12). Results of individual studies 20 For all outcomes considered (benefits or harms), present, for each study: (a) simple summary data for each intervention
group (b) effect estimates and confidence intervals, ideally with a forest plot. Synthesis of results 21 Present results of each meta-analysis done, including confidence intervals and measures of consistency. Risk of bias across studies 22 Present results of any assessment of risk of bias across studies (see Item 15). Additional analysis 23 Give results of additional analyses, if done (e.g., sensitivity or subgroup analyses, meta-regression [see Item 16]).
DISCUSSION Summary of evidence 24 Summarize the main findings including the strength of evidence for each main outcome; consider their relevance to key
groups (e.g., healthcare providers, users, and policy makers). Limitations 25 Discuss limitations at study and outcome level (e.g., risk of bias), and at review-level (e.g., incomplete retrieval of
identified research, reporting bias). Conclusions 26 Provide a general interpretation of the results in the context of other evidence, and implications for future research.
FUNDING Funding 27 Describe sources of funding for the systematic review and other support (e.g., supply of data); role of funders for the
systematic review. From: Moher D, Liberati A, Tetzlaff J, Altman DG. The PRISMA Group (2009). Preferred Reporting Items for Systematic Reviews and Meta-Analyses: The PRISMA Statement. PLoS Med 6(6): e1000097. doi:10.1371/journal.pmed1000097

©Institute for Clinical and Economic Review, 2016 Page 76 Final Evidence Report – Diabetes Prevention Programs Return to Table of Contents
Table A2. Search Strategies for MEDLINE, EMBASE, and the Cochrane Central Register of Controlled Trials, April 7, 2014 through April 7, 2016
The search strategy for this review was reproduced from the Balk et al., 2015 systematic review commissioned by the CDC.17 1 ("pre-diabetes" or pre-diabet* or prediabet*).af. 2 exp prediabetic state/ 3 (impaired and (fasting glucose or glucose tolerance)).af. 4 (impaired and fasting blood sugar).af. 5 ("diabetes risk" or (risk adj6 diabetes)).af. 6 or/1-5 7 (((behaviour or behavior) and modification) or behavior therapy or lifestyle or lifestyle intervention or
healthy eating or diet or weight loss or physical activity or resistance training or exercise or life style or healthy-living).af.
8 exp diet/ or diet therapy.sh. or exp exercise/ or exp exercise therapy/ or exp lifestyle/ or exp weight loss/ or exp behavior therapy/
9 *"Diabetes Mellitus"/pc [Prevention & Control] 10 or/7-9 11 (diabetes prevention program* or diabetes prevention study*).af. 12 randomized controlled trial.pt. 13 controlled clinical trial.pt. 14 randomized controlled trials/ 15 Random Allocation/ 16 Double-blind Method/ 17 Single-Blind Method/ 18 clinical trial.pt. 19 Clinical Trials.mp. or exp Clinical Trials/ 20 (clinic$ adj25 trial$).tw. 21 ((singl$ or doubl$ or trebl$ or tripl$) adj (mask$ or blind$)).tw. 22 Placebos/ 23 placebo$.tw. 24 random$.tw. 25 trial$.tw. 26 (randomized control trial or clinical control trial).sd. or program evaluation.af. 27 (latin adj square).tw. 28 Comparative Study.tw. or Comparative Study.pt. 29 exp Evaluation studies/ 30 Follow-Up Studies/ 31 Prospective Studies/ 32 (control$ or prospectiv$ or volunteer$).tw. 33 Cross-Over Studies/ 34 or/12-33 35 exp cohort studies/ or exp prospective studies/ or exp retrospective studies/ or exp epidemiologic studies/ or
exp casecontrol studies/

©Institute for Clinical and Economic Review, 2016 Page 77 Final Evidence Report – Diabetes Prevention Programs Return to Table of Contents
36 (cohort or retrospective or prospective or longitudinal or observational or follow-up or followup or registry).af.
37 case-control.af. or (case adj10 control).tw. 38 ep.fs. 39 or/35-38 40 ((6 and 10) or 11) and (34 or 39) 41 (((Non-alcoholic or nonalcoholic) and Fatty Liver Disease) or hepatitis).af. 42 40 not 41 43 remove duplicates from 42 44 meta-analysis.pt. 45 systematic$ review$.mp. [mp=ti, ab, ot, nm, hw, ps, rs, ui, tx, kw, ct] 46 (systematic$ adj9 overview$).mp. 47 (meta-analys$ or meta analys$ or metaanalys$).mp. [mp=ti, ab, ot, nm, hw, ps, rs, ui, tx, kw, ct] 48 evidence review$.mp. [mp=ti, ab, ot, nm, hw, ps, rs, ui, tx, kw, ct] 49 or/44-48 50 "pre-diabetes".af. 51 prediabetes.af. 52 impaired glucose tolerance.af. 53 impaired fasting glucose.af. 54 insulin resistance.af. 55 or/7-11 56 6 and 12 57 remove duplicates from 13 58 43 or 57

©Institute for Clinical and Economic Review, 2016 Page 78 Final Evidence Report – Diabetes Prevention Programs Return to Table of Contents
Figure A1. PRISMA flow Chart Showing Results of Literature Search for Diabetes Prevention Programs
1489 potentially relevant references screened
1340 citations excluded Population: 111 Intervention: 504 Comparator: 0 Outcomes: 48 Study Type: 0 Duplicates: 677
149 references for full text review
131 citations excluded (not DPRP program)
18 references, 10 studies - 5 RCTs - 5 Case series

©Institute for Clinical and Economic Review, 2016 Page 79 Final Evidence Report – Diabetes Prevention Programs Return to Table of Contents
Appendix B. Key Informant Interviews Table B1. List of Key Informant Organizations
Category Organization
Payer
Anthem America’s Health Insurance Plans Blue Shield of California California Department of Health Care Services Connecticut Department of Social Services UnitedHealth Group
Provider
Black Women for Wellness (Los Angeles) Canary Health Kaiser Permanente Noom, Inc. Omada Health Turnaround Health University of California, San Francisco YMCA of San Francisco YMCA of the USA Weight Watchers
Intermediary Organizations Solera
Public Health
California Health Care Foundation California Department of Public Health Centers for Disease Control and Prevention, Division of Diabetes Translation Diabetes Advocacy Alliance Diabetes Coalition of California Integrated Healthcare Association National Association of Chronic Disease Directors Los Angeles Department of Public Health, Division of Chronic Disease and Injury Prevention
Purchaser
California Public Employees’ Retirement System (CalPERS) Lowe’s Pacific Business Group on Health Silicon Valley Employers Forum
Professional Society American Diabetes Association American Association of Diabetes Educators
To develop a list of potential interviewees, we reviewed the policy literature and identified key groups of stakeholders relevant to type 2 diabetes prevention efforts. When conducting interviews with initial contacts, we sought recommendations for additional regional and national experts to include as part of our assessment. We conducted 34 30- to 60- minute telephone interviews using a

©Institute for Clinical and Economic Review, 2016 Page 80 Final Evidence Report – Diabetes Prevention Programs Return to Table of Contents
semi-structured guide (some key informant organizations participated in multiple calls). To help ensure that key barriers and solutions were included in our assessment, we performed a scan of the existing policy literature. Participation in the stakeholder interviews should not be construed as an endorsement of ICER’s findings, and interviewees are not responsible for the final contents of this report.

©Institute for Clinical and Economic Review, 2016 Page 81 Final Evidence Report – Diabetes Prevention Programs Return to Table of Contents
Appendix C: Topic in Context Supplemental Information Table C1. CDC Prediabetes Risk Assessment Questionnaire
Question Yes No Are you a woman who has had a baby weighing more than 9 pounds at birth? 1 0 Do you have a sister or brother with diabetes? 1 0 Do you have a parent with diabetes? 1 0 Find your height on the chart (see table C2). Do you weigh as much as or more than the weight listed for your height?
5 0
Are you younger than 65 years of age and get little or no exercise in a typical day? 5 0 Are you between 45 and 65 years of age? 5 0 Are you 65 years of age or older? 9 0 Total points for all “yes” responses Reproduced from http://www.cdc.gov/diabetes/prevention/pdf/dprp-standards.pdf Scores of nine or higher indicate high risk for prediabetes. Individuals with scores of three to eight points are not likely at risk for prediabetes, but are recommended to eat healthily, not smoke, be active, and lose weight if overweight.
Table C2. CDC Prediabetes At-Risk Weight Chart
Height Weight (pounds) Height Weight (pounds) 4’10” 129 5’8” 177 4’11” 133 5’9” 182 5’0” 138 5’10” 188 5’1” 143 5’11” 193 5’2” 147 6’0” 199 5’3” 152 6’1” 204 5’4” 157 6’2” 210 5’5” 162 6’3” 216 5’6” 167 6’4” 221 5’7” 172
Reproduced from http://www.cdc.gov/diabetes/prevention/pdf/dprp-standards.pdf

©Institute for Clinical and Economic Review, 2016 Page 82 Final Evidence Report – Diabetes Prevention Programs Return to Table of Contents
Table C3. Overview of Prevent T2 Curriculum
Reproduced from http://www.cdc.gov/diabetes/prevention/pdf/curriculum_toc.pdf
Topics Covered in First 6 Months
• Welcome to the Program • Be a Fat and Calorie Detective • Three Ways to Eat Less Fat and Fewer Calories • Healthy Eating • Move Those Muscles • Being Active - A way of Life • Tip the Calorie Balance • Take Charge of What's Around You • Problem Solving • Four Keys to Healthy Eating Out • Talk Back to Negative Thoughts • The Slippery Slope of Lifestyle Change • Jump Start Your Activity Plan • Make Social Cues Work for You • You Can Manage Stress • Ways to Stay Motivated
Topics Covered in Second 6 Months
• Fats - Saturated, Unsaturated, and Trans Fat • Food Preparation and Recipe Modification • Healthy Eating - Taking it One Meal at a Time • Healthy Eating with Variety and Balance • More Volume, Fewer Calories • Staying on Top of Physical Activity • Stepping up to Physical Activity • Balance Your Thoughts for Long-Term Maintenance • Handling Holidays, Vacations, and Special Events • Preventing Relapse • Stress and Time Management • Heart Health • A Closer Look at Type 2 Diabetes • Looking Back and Looking Forward

©Institute for Clinical and Economic Review, 2016 Page 83 Final Evidence Report – Diabetes Prevention Programs Return to Table of Contents
Appendix D. Clinical Guidelines American Academy of Clinical Endocrinologists (AACE) / American College of Endocrinology (ACE), 2016113
Adults with prediabetes (i.e., FPG 100-125 mg/dL, OGTT 140-199, or with metabolic syndrome) should be provided behavioral counseling on diet, physical activity, sleep, behavioral support, and smoking cessation. The guidelines note that while weight loss is the primary goal of prediabetes therapy, patients with prediabetes should also work to bring lipid and blood-pressure levels to appropriate targets through behavioral change and pharmacotherapy. Medication-assisted weight loss may be appropriate for patients who meet more than one prediabetic criteria, and the guidelines recommend metformin or acarbose as low-risk options. If neither metformin nor acarbose are effective, thiazolidinedione (TZD) or a glucagon-like peptide-1 (GLP-1) receptor agonist should be used. In some cases, bariatric surgery may be appropriate to prevent or delay the progression of prediabetes to type 2 DM.
American College of Obstetricians and Gynecologists (ACOG), 2013114
All pregnant patients should be screened for gestational diabetes mellitus (GDM). All patients who test positive should begin nutrition therapy, and medication should be used when clinically appropriate. Women with GDM should be screened for prediabetes and type 2 DM six to 12 weeks post-pregnancy, and those who test positive should be referred to preventive therapy. Follow-up screenings at least every three years are recommended for women who have had GDM and a normal screening result for post-partum prediabetes or type 2 DM.
American Diabetes Association (ADA), 2016115
Adults who are overweight or obese (BMI ≥ 25 kg/m2 or ≥ 23 kg/m2 in Asian-Americans) and all adults over age 45 should be tested for prediabetes, which is defined as HbA1c of 5.7-6.4%, impaired glucose tolerance demonstrated by OGTT levels of 140-199 mg/dL, or FPG 100-125 mg/dL. Individuals who are diagnosed with prediabetes should participate in a diet and lifestyle modification program that follows the tenets of the DPP, namely 7% body weight loss and a minimum of 150 minutes of moderate-intensity physical activity each week. Physicians should monitor their patients with prediabetes at least once per year, and should screen for and treat any modifiable risk factors for cardiovascular disease. Third-party payers are encouraged to cover DPPs due to their demonstrated cost-effectiveness. In addition, the ADA suggests that digital versions of the DPP be considered alongside in-person implementations, noting that the CDC has recently begun to recognize these electronic offerings.

©Institute for Clinical and Economic Review, 2016 Page 84 Final Evidence Report – Diabetes Prevention Programs Return to Table of Contents
The guidelines recommend that women be tested for undiagnosed type 2 DM at the first prenatal visit, and for GDM at 24 to 28 weeks of pregnancy. The ADA recommends using either a 75g OGTT or a 50g non-fasting screen followed by a 100g OGTT for those who screen positive, and notes that the latter option is easier to administer as it does not require fasting. Women with a history of GDM should be tested for prediabetes or type 2 DM at least every three years, and individuals found to have prediabetes should be referred to a lifestyle intervention program or be prescribed metformin.
The ADA notes that evidence supports the use of metformin for individuals under the age of 60 with high risk for developing type 2 DM (e.g., individuals with a history of GDM, BMI ≥ 35, increasing HbA1c despite lifestyle intervention, with severe or progressive hyperglycemia).
American Heart Association (AHA) / American College of Cardiology (ACC) / The Obesity Society (TOS), 2013116
All adults who are obese or overweight should be counseled that high BMI and waist circumference increase the risk of developing cardiovascular disease, type 2 DM, and all-cause mortality. Physicians should advise adults who are overweight or obese with cardiovascular risk factors (e.g., hyperglycemia, hypertension, and hyperlipidemia) that sustained weight loss of 3-5% reduces the risk of developing type 2 DM. To achieve this goal, physicians should refer these patients to a high-intensity (i.e., ≥ 14 sessions in six months) comprehensive lifestyle management program of at least six months’ duration to improve diet and physical activity. These programs should include counseling delivered by a trained professional at the individual or group level.
The AHA/ACC/TOS guidelines note that electronically-delivered programs may result in less weight loss compared to in-person programs, but that digital offerings are superior to no or minimal intervention. The guidelines recommend that commercially-available weight-loss programs be prescribed only if they have published, peer-reviewed evidence that demonstrates safety and efficacy. Individuals who successfully lose weight through lifestyle modification should participate in a long-term, comprehensive weight-loss maintenance program of at least one year’s duration with in-person or telephonic guidance once or more per month to promote greater than 200 minutes of physical activity per week, weight monitoring, and a reduced-calorie diet.
Canadian Diabetes Association (CDA), 2013117
Individuals over the age of 40 or at high risk should be screened for diabetes every three years, with more frequent screening recommended for individuals at very high risk or with additional risk factors. Risk factors include, but are not limited to, a family history of type 2 DM, history of prediabetes or GDM, membership in a high-risk racial or ethnic group, dyslipidemia, and hypertension. The CDA defines prediabetes as IFG demonstrated by FPG of approximately 110-124 mg/dL, IGT demonstrated by two-hour OGTT of approximately 140-198 mg/dL, or HbA1c of 6.0-

©Institute for Clinical and Economic Review, 2016 Page 85 Final Evidence Report – Diabetes Prevention Programs Return to Table of Contents
6.4%. Individuals with IFG and IGT should enter a lifestyle modification program that promotes weight loss and regular physical activity, and the use of metformin or acarbose may be appropriate for individuals with IGT.
The Endocrine Society, 2008 and 2013118,119
Providers should screen patients for metabolic syndrome at least every three years by taking measurements of blood pressure, waist circumference, fasting lipid profile, and FPG.119 Patients with prediabetes should be screened for type 2 DM every one to two years through FPG or OGTT tests. Lifestyle modification should be the first-line treatment offered to patients at increased risk for metabolic syndrome, and patients should be referred to a clinical program to reduce weight by 5-10% through a minimum of 30 minutes of physical activity five days per week, reduced caloric intake, and behavioral modification.
The Endocrine Society’s 2013 guidelines for the treatment of GDM recommend that all pregnant individuals be screened for the condition through measurement of FPG, HbA1c, or an untimed random plasma glucose test before 13 weeks of gestation and again between weeks 24 and 28.118 Women who have had GDM should take an OGTT six to 12 weeks post-pregnancy to detect prediabetes or DM, and women who receive normal results should repeat the test periodically and before subsequent pregnancies. All women who have had GDM should be counseled on lifestyle modifications to reduce the risk of developing type 2 DM.
Institute for Clinical Systems Improvement, 2014120
The Institute for Clinical Systems Improvement (ICSI) guidelines define prediabetes as one or more of HbA1c of 5.7-6.4%, FPG of 100-125 mg/dL, or OGTT of 140-199 mg/dL. Individuals who meet these criteria should be referred to a health professional (e.g., clinician, dietitian, nurse, pharmacist) for education and lifestyle modification therapy. Achievable goal-setting is encouraged, as is weight loss of 5-10% and 150 minutes per week of physical activity; ICSI recommends metformin for some patients, at least annual monitoring for the development of DM, and screening/treatment for modifiable risk factors of cardiovascular disease. Individuals found to have prediabetes should be screened for progression to type 2 DM annually.
National Institute for Health and Care Excellence (NICE, United Kingdom), 2012121
Validated, computer-based risk assessment should be conducted in all adults over the age of 40 excepting pregnant women; individuals aged 25-39 from high-risk ethnic or racial populations, again excepting pregnant women; and adults with conditions that increase the likelihood of developing type 2 DM. Health care professionals should administer FPG, OGTT, or HbA1c tests for adults who score highly on these questionnaires, and the guidelines list FPG of approximately 100-125 mg/dL or HbA1c of 6.0-6.4% as ranges indicative of high risk. Individuals with low to moderate risk should be

©Institute for Clinical and Economic Review, 2016 Page 86 Final Evidence Report – Diabetes Prevention Programs Return to Table of Contents
counseled to improve lifestyle factors to reduce risk, with brief interventions and referral to weight loss programs indicated for those with moderate risk. Those at high risk should be referred to a nearby evidence-based intensive lifestyle modification program. NICE recommends that individuals at low risk be tested every five years, those at moderate risk every three years, and those at high risk every year.
Lifestyle modification programs should include groups of 10 to 15 individuals at high risk; be developed in collaboration with communities to ensure content is delivered in a culturally-appropriate manner; ensure face-to-face contact (group, individual, or a combination) at least eight times over nine to 18 months for at least 16 cumulative hours; and should deliver lessons in a logical progression. Follow-up sessions are recommended for at least two years, and should occur at regular intervals. In terms of content, lifestyle modification programs should encourage at least 150 minutes of moderate-intensity physical activity each week, gradual weight loss to a BMI under 25 kg/m2 or under 23 kg/m2 for individuals of South Asian or Chinese descent, and a healthy diet. Metformin is considered appropriate for adults who continue to progress toward type 2 DM despite lifestyle modification or for individuals who are unable to participate in lifestyle modification programs due to disability or other medical reasons.
Primary Care Diabetes Europe (PCDE), 2010122
Screening is recommended for prediabetes or type 2 DM in Caucasians over the age of 40 and in individuals over the age of 25 from ethnic or racial groups at high risk for DM who also have at least one of the following risk factors: family history of DM, BMI greater than 25 kg/m2, large waist circumference, and treated or untreated hypertension or dyslipedemia. In addition, screening is recommended in individuals with a history of GDM or temporary diabetes, cardio- and cerebrovascular disease, severe mental health problems, a history of impaired glucose tolerance or FPG, and women with polycystic ovary syndrome and a BMI ≥ 30 kg/m2. Referral to treatment should be determined based on level of risk, and individuals with sufficient risk should enter an intensive lifestyle modification program that promotes sustained weight loss of 5-7%, at least 30 minutes of physical activity per day, and a healthy diet. Pharmacological treatment with metformin, acarbose, or orlistat is recommended as a second-line treatment for individuals with impaired glucose tolerance, and bariatric surgery may be considered for patients at high risk for type 2 DM or cardiovascular disease with a BMI ≥ 35 kg/m2.
United States Preventive Services Task Force (USPSTF), 201472,73
Adults aged 40 to 70 who are overweight or obese should be screened for abnormal blood glucose levels as part a cardiovascular risk assessment. Abnormal glucose levels are defined as HbA1c from 5.7-6.4%, FPG from 100-125 mg/dL, or OGTT from 140-199 mg/dL. Individuals who screen positive for glucose abnormalities should be referred to a behavioral counseling program to improve diet

©Institute for Clinical and Economic Review, 2016 Page 87 Final Evidence Report – Diabetes Prevention Programs Return to Table of Contents
and physical activity, and the USPSTF notes that there is insufficient evidence to demonstrate that pharmacological treatment produces the same wide-ranging benefits as behavioral modifications.
In a separate recommendation on behavioral counseling, the USPSTF recommends that all adults who are overweight or obese and have cardiovascular risk factors (e.g., impaired fasting glucose, hypertension, dyslipidemia, metabolic syndrome) be referred to intensive behavioral counseling for diet and physical activity, noting that this intervention reduces the incidence of DM.72
United States Department of Veterans Affairs (VA) / Department of Defense (DoD), 2009 and 2010123,124
Screening for prediabetes and DM is recommended in adults over age 45 and in all adults who are overweight or obese with additional risk factors (e.g., hypertension, dyslipidemia, history of GDM, sedentary lifestyle). Prediabetes is defined as FPG 100-125 mg/dL or HbA1c of ≥ 5.7% that is subsequently confirmed through FPG measurement. Individuals with prediabetes should be counseled on the implications of prediabetes and should be referred to a lifestyle modification program that promotes physical activity and weight loss of at least 5% of body weight through a reduced-calorie diet. If lifestyle modification therapy is unsuccessful, treatment with metformin or acarbose may be appropriate to delay the development of type 2 DM.
The 2009 VA/DoD guidelines for the management of pregnancy recommend that pregnant women be screened for GDM between weeks 24 and 28 of gestation via a 50g OGTT followed by a blood draw. Individuals with glucose levels between 130 and 140 mg/dL should take a three-hour, 100g OGTT to confirm the findings of the initial test. The guidelines do not include recommendations on postpartum care for women with GDM.

©Institute for Clinical and Economic Review, 2016 Page 88 Final Evidence Report – Diabetes Prevention Programs Return to Table of Contents
Appendix E. Public and Representative Private Insurer Coverage Policies Few insurers currently cover CDC-recognized DPPs across all lines of business. While many commercial payers and self-insured employers offer some form of reimbursement for wellness programs that aim to achieve some of the same goals as DPPs, we have limited our survey of coverage policies to prevention programs that are recognized by the CDC or that deliver the CDC DPP curriculum. Given the rapidly changing landscape for coverage of DPPs, the following sections should be viewed as a “snapshot” of the status at the time of the report’s publication.
Public Payers
Centers for Medicare & Medicaid Services (CMS)
We were unable to find any National Coverage Determinations or Local Coverage Determinations pertaining to California that relate to coverage of DPPs. However, on March 23, 2016 the Secretary of Health & Human Services announced that the CMS Office of the Actuary certified that the Y’s DPP reduces Medicare costs without degrading quality of care, a step that paves the way for CMS to expand coverage of the program to Medicare beneficiaries nationwide.45 The proposed rule was released for public comment in July 2016, with the expansion expected to go into effect in January 2018.11 These efforts are based on the results of a demonstration funded by a nearly $12 million CMS Health Care Innovation grant to the Y to test a DPP model based on the CDC DPP curriculum.45 This proposal closely follows the Medicare Diabetes Prevention Act of 2015 (S. 1131/H.R. 2102), which was originally introduced in March 2013 by Senator Al Franken and Representative Susan Davis to expand coverage for DPPs to eligible seniors enrolled in Medicare.125
Medi-Cal, California’s Medicaid agency, does not specifically cover DPPs using federal or state funds. The Montana Department of Public Health and Human Services is currently the only state Medicaid program to offer an adapted version of the DPP for individuals at high risk of CVD and diabetes. Results of a pre-post clinical trial demonstrated that older (>65 years) participants were significantly more likely than younger participants (<65 years) to remain active in the program, but the RR rates for CVD outcomes were similar between groups.126 Other states, including Colorado, Kentucky, Louisiana, Maine, Minnesota, New Hampshire, Ohio, and Washington, offer DPPs through employee benefits programs.75
©Institute for Clinical and Economic Review, 2016 Page 89 Final Evidence Report – Diabetes Prevention Programs Return to Table of Contents
National Private Payers
Aetna
Aetna began a pilot DPP funded by the CDC in the fall of 2013 for 500 high-risk employees with metabolic syndrome.127 The pilot program is part of a cooperative agreement with America’s Health Insurance Plans (AHIP), along with other member organizations including EmblemHealth, Florida Blue, and Molina Healthcare, to implement the NDPP in four states over four years.128
Anthem
Anthem launched a DPP in collaboration with Solera Health, Inc. (formerly Viridian Health Management) in April 2015 to offer the program as a preventive benefit for its members in Colorado enrolled in ACA-compliant plans.129,130
Cigna
Cigna does not specifically cover any CDC-recognized DPPs. However, in 2013 Cigna launched a pilot program in partnership with BodyMedia, a company that produces an armband that tracks physiological data, to study the use of a fitness tracker as a tool to help prevent or delay the development of type 2 DM. An RCT will also be conducted, though we could not identify an associated trial on clinicaltrials.gov.131
Humana
Humana does not specifically cover any CDC-recognized DPPs. However, in partnership with Omada Health, Humana sponsored a study of 490 Medicare Advantage beneficiaries enrolled in the digitally-based Omada program,132 which was designed to help patients reduce their risk of chronic diseases, including diabetes and heart disease.
UnitedHealth Group
UnitedHealth Group (UHG) was the first health plan to offer a DPP as a nationally covered preventive benefit. Beginning in 2010, UHG and the Y partnered with the CDC to test whether the Y’s DPP could be delivered to a larger number of participants, at a lower cost, and with comparable outcomes to the DPP Trial. The program is a group-based lifestyle management intervention that is offered free-of-charge to eligible participants in both in-person and online formats.
Building on lessons learned from this experience and in partnership with Comcast and NBC, UHG developed its own DPP (Real Appeal®) that is delivered via a reality-based program format in which participants were filmed going through the program. Individuals who are overweight with a prediabetes risk factor or obese are eligible for the program (i.e., they do not need to have

©Institute for Clinical and Economic Review, 2016 Page 90 Final Evidence Report – Diabetes Prevention Programs Return to Table of Contents
prediabetes as determined by a risk survey or blood glucose results). Once participants are enrolled in the program, those who have prediabetes receive a full curriculum, while those who are not receive a less-intensive program.133
Regional Private Payers
Health Net
Health Net of California, Inc. offers the Omada program in partnership with Omada Health as a preventive service benefit for select plan members, including CalPERS (which covers public employees, retirees, and their families) and Aon Active Health Exchange participants.134,135
Blue Shield of California (BSCA)
We were unable to find any publicly available information that mentioned BSCA’s coverage of programs specifically intended to prevent or delay the development of type 2 DM.

©Institute for Clinical and Economic Review, 2016 Page 91 Final Evidence Report – Diabetes Prevention Programs Return to Table of Contents
Appendix F. Previous Systematic Reviews and Technology Assessments We found three technology assessments and 11 previous systematic reviews evaluating DPPs, and have summarized the publications most relevant to this review below. Systematic reviews were restricted to those primarily reviewing the effectiveness of US-based DPPs subsequent to the passing of legislation in 2010 granting the CDC authority to manage the implementation and evaluation of these programs. The majority of these reviews were concerned with the real-world applications of the DPP Trial, some of which were strictly qualitative in nature.
Technology Assessments
US Preventive Services Task Force (USPSTF)
Lin JS, O'Connor E, Evans CV, Senger CA, Rowland MG, Groom HC. Behavioral counseling to promote a healthy lifestyle in persons with cardiovascular risk factors: A systematic review for the US Preventive Services Task Force. Annals of Internal Medicine. 2014;161(8):568-578.
The Agency for Healthcare Research and Quality (AHRQ) expanded on a prior systematic review for the USPSTF to update recommendation statements on the benefits of lifestyle behavioral counseling for individuals with one or more cardiovascular risk factors, including metabolic syndrome, dyslipidemia, obesity, hypertension, and impaired blood glucose. The authors concluded that medium- (between 30 minutes to six hours of total contact with providers) and high-intensity (>6 hours of contact) behavioral counseling which includes diet and physical activity consistently reduced important CVD risk factors for up to two years. In the longer term, high-intensity lifestyle change interventions also reduced the incidence of diabetes.
National Institute for Health and Care Excellence (NICE)
Johnson M, Jones R, Freeman C, et al. Can diabetes prevention programmes be translated effectively into real-world settings and still deliver improved outcomes? A synthesis of evidence. Diabetic Medicine: A Journal of the British Diabetic Association. 2013;30(1):3-15.
A NICE-funded systematic review evaluated studies that included interventions based on the DPP Trial and the Finnish Diabetes Prevention study. The primary objective was to determine the real-world applicability of DPPs outside of RCTs. Of the 17 translational studies included, 16 showed greater weight loss of at least 4% in the intervention groups across all study types; differences in blood glucose and weight circumference were inconsistent, however. Although the authors acknowledge that there is limited evidence of sustainable weight loss beyond three years, those

©Institute for Clinical and Economic Review, 2016 Page 92 Final Evidence Report – Diabetes Prevention Programs Return to Table of Contents
programs that followed the aims and content of the US or Finnish DPP can achieve significant weight loss for participants with less intensity (i.e., reducing the number of contacts) to increase accessibility in a range of settings.
National Institute for Health Research (NIHR)
Gillett M, Royle P, Snaith A, et al. Non-pharmacological interventions to reduce the risk of diabetes in people with impaired glucose regulation: A systematic review and economic evaluation. Health technology assessment (Winchester, England). 2012;16(33):1-236, iii-iv.
A systematic review of nine RCTs found that in patients with intermediate hyperglycemia, defined as having IFG or IGT, non-pharmacological interventions that focused on diet and exercise were more effective than standard lifestyle advice. Those studies with the highest compliance also showed the greatest benefit with lifestyle intervention. An economic assessment of structured lifestyle change interventions demonstrated that these programs are highly cost-effective and may be cost-saving in some situations.
Systematic Reviews
Ali MK, Echouffo-Tcheugui J, Williamson DF. How effective were lifestyle interventions in real-world settings that were modeled on the Diabetes Prevention Program? Health Affairs. 2012;31(1):67-75.
A systematic review and meta-analysis conducted by Ali et al. evaluated 28 studies that applied the DPP curricula in real-world settings. After 12 months, the mean weight loss was 4-5%, which was considered clinically significant, and these results were consistent across studies with nonmedical staff, including nutritionists, behavioral psychologists, and exercise physiologists, or untrained members of the community. Importantly, the authors noted that for every additional session attended, weight was further reduced by 0.26% (95% CI, −0.54 to 0.01; p=N/R). Six of the identified studies also evaluated costs associated with the intervention; differences in costs of providing these programs were primarily attributable to staffing differences (i.e., clinically trained versus lay educators).
Aziz Z, Absetz P, Oldroyd J, Pronk NP, Oldenburg B. A systematic review of real-world diabetes prevention programs: Learnings from the last 15 years. Implementation Science: IS. 2015;10:172.
Aziz et al. focused their systematic review on identifying those components of DPPs that may be associated with successful implementation in real-world settings according to the PIPE (Penetration, Implementation, Participation, and Effectiveness) Impact Matrix elements. All 32 studies identified reported implementation (i.e., program intensity), the majority of which also included data on program adherence. Although higher-intensity programs may be associated with better weight loss
©Institute for Clinical and Economic Review, 2016 Page 93 Final Evidence Report – Diabetes Prevention Programs Return to Table of Contents
outcomes, those low-intensity programs with high participation rates can still have an impact on lowering diabetes risk.
Cardona-Morrell M, Rychetnik L, Morrell SL, Espinel PT, Bauman A. Reduction of diabetes risk in routine clinical practice: Are physical activity and nutrition interventions feasible and are the outcomes from reference trials replicable? A systematic review and meta-analysis. BMC Public Health. 2010;10:653.
A systematic review of RCTs, pre-post evaluations, cohort studies, and grey literature evaluated programs that primarily focused on preventing type 2 diabetes in high-risk patients with the objective of determining if lifestyle change interventions could be adapted in routine clinical practice settings, including outpatient hospital or health clinics. Of the 12 studies identified, four RCTs were meta-analyzed; these results demonstrated that the mean weight loss in both the DPP Trial (5.6kg) and Finnish DPS (4.2kg) trial were superior to the pooled results for weight loss in the DPP cohorts across these studies (1.82kg) after 12 months of follow-up. Although all 12 included studies demonstrated significant effects of modified DPPs on weight loss across all study types, the authors concluded that DPPs in routine clinical practice may not produce clinically-meaningful weight loss in high-risk patients with IGT, metabolic syndrome, or obesity, alone or in combination; these results were limited by the short duration of follow-up in most studies. Longer-term studies need to be conducted in order to determine if achieving clinically significant weight loss is possible in routine clinical care settings beyond one year of follow-up.
Eaglehouse YL, Kramer MK, Rockette-Wagner B, Arena VC, Kriska AM. Evaluation of physical activity reporting in community Diabetes Prevention Program lifestyle intervention efforts: A systematic review. Preventive Medicine. 2015;77:191-199.
In a systematic review evaluating the role that physical activity plays in modified DPPs, Eaglehouse et al. identified 57 translational interventions for adults with prediabetes or at high risk of developing CVD. Although increasing physical activity to a minimum of 150 minutes per week was a primary objective of the DPPs, only 60% of studies reported these outcomes. Among those studies providing physical activity results, only 26% included the number of patients meeting this goal. Given that increasing physical activity has been shown to improve metabolic health, the authors suggested that future research needs to focus on reporting physical activity results to fully comprehend how translational programs impact health outcomes.
Neamah HH, Kuhlmann AK, Tabak RG. Effectiveness of Program Modification Strategies of the Diabetes Prevention Program: A Systematic Review. The Diabetes Educator. 2016;42(2):153-165.
In an effort to characterize the more frequently implemented modifications of DPPs, Neamah et al. examined five program components of 28 modified interventions using bivariate analyses to determine the odds of their influencing particular outcomes. Among those modification types,

©Institute for Clinical and Economic Review, 2016 Page 94 Final Evidence Report – Diabetes Prevention Programs Return to Table of Contents
including format, timeline, or dosage (i.e., reducing the number of sessions or timeline for delivery), implementation staff, contents, or implementation setting, none were individually associated with reductions in weight or BMI. However, the authors noted the programs with fewer modifications overall were associated with significantly greater weight loss after 12 months (p<0.01) or at the last point of follow up (p=0.02). There were also significantly better results for weight loss for programs that included a maintenance component at the last point of follow-up (p=0.02).
Whittemore R. A systematic review of the translational research on the Diabetes Prevention Program. Translational Behavioral Medicine. 2011;1(3):480-491.
Among the 16 translational studies identified for this systematic review, four different settings could be identified among programs implementing a modified DPP curriculum: primary care, community, hospital outpatient, and work or church. The populations in all studies were considered heterogeneous, with the most diversity being represented in the work or church setting. A majority of the programs included specialized providers, including exercise physiologists, health coaches, and diabetes educators. Across all translational studies, percent weight loss ranged from 2.7% to 6%. Weight loss appeared to the be greatest in hospital outpatient (7.7kg) and primary care programs (8.7kg), which also had the highest attendance rates (80–96%); there was otherwise no association between the number of sessions attended and outcomes across the other settings.

©Institute for Clinical and Economic Review, 2016 Page 95 Final Evidence Report – Diabetes Prevention Programs Return to Table of Contents
Appendix G. Ongoing US Studies
Title/ Trial Sponsor Study Design
Comparators Patient Population Primary Outcomes Estimated
Completion Date
Diabetes prevention programs
Getting in Balance: A Workplace Diabetes Prevention Intervention Trial (GIBW) Kaiser Permanente NCT02589873
RCT In-person DPP (YMCA) Online DPP (Canary Health VLM)
N = 240 Age ≥ 18 Men and women BMI ≥ 25 kg/m2, ≥23 kg/m2 if of Asian descent Score of ≥ 9 on CDC prediabetes risk assessment screen Must be able to speak, read, and understand English Internet access required No type 1 or 2 DM No systolic blood pressure (BP) ≥ 180 mm/Hg or diastolic BP ≥ 100 mm/Hg on 1+ occasions in previous year No inability to exercise No concurrent use of appetite- or weight-affecting medications, enrollment in weight loss program No plans for bariatric surgery during study period
Percent and amount of body weight loss on average over 12 months and at 6 and 12 months compared to baseline
July 2017
Evaluation of Prevent in Underserved Populations (PUP) Omada Health, Inc. NCT02664064
Non-RCT Online DPP (Omada, formerly called Prevent) No intervention (matched control)
N = 300 Age 18-75 Men and women Prediabetes confirmed through lab test Uninsured, Medicaid insured, or safety-net health plan insured Ability to speak, read English or Spanish at 5th grade level BMI ≥ 24 Internet access required No inability to exercise No type 1 or 2 DM No concurrent insulin, metformin, or hypoglycemic agent use No current pregnancy or plans for pregnancy
Percent weight loss from baseline at 6 and 12 months
April 2017

©Institute for Clinical and Economic Review, 2016 Page 96 Final Evidence Report – Diabetes Prevention Programs Return to Table of Contents
Title/ Trial Sponsor Study Design
Comparators Patient Population Primary Outcomes Estimated
Completion Date A Pharmacist-Coordinated Implementation of the Diabetes Prevention Program University of California, Los Angeles NCT02384109
Open-label RCT
Pharmacist referral to YMCA DPP or metformin prescription Usual care
N = 700 Age ≥ 18 Men and women BMI > 24 kg/m2, > 22 kg/m2 if of Asian descent Prediabetes defined as IFG of 100-125 mg/dL, HbA1c 5.7-6.4%, or ICD-9 billing code of 790.21 or 790.22 No HbA1c values > 6.5% No ICD-9 billing codes of 250.xx No use of antiglycemic medication No current or past DPP participation
Uptake of evidence-based diabetes prevention intervention (metformin or Y DPP) Secondary Outcomes Weight change at 12 months Change in HbA1c Change in systolic blood pressure
June 2019
Minnesota Medicaid Incentives to Prevent Chronic Disease (MMIPCD) Minnesota Department of Human Services NCT02422420
Open-label RCT
YMCA DPP with individual financial incentive YMCA DPP with group financial incentive YMCA DPP with minimal financial incentive
N = 1,500 Ages 18-75 Men and women Must be enrolled in Medical Assistance, Prepaid Medical Assistance Program (PMAP), or MinnesotaCare BMI ≥ 25 kg/m2, ≥22 kg/m2 if of Asian decent Current prediabetes or history of GDM No type 1 or 2 DM No pregnancy at time of enrollment No gastric bypass surgery planned in next year
DPP attendance at 12 months Weight change at 12 months
September 2016

©Institute for Clinical and Economic Review, 2016 Page 97 Final Evidence Report – Diabetes Prevention Programs Return to Table of Contents
Title/ Trial Sponsor Study Design
Comparators Patient Population Primary Outcomes Estimated
Completion Date The Reach and Effectiveness of Technology-enhanced Diabetes Prevention Programs (DiaBEAT-it) Virginia Polytechnic Institute and State University NCT02162901
Hybrid preference and randomized controlled trial
Preference arm: 1. Class with interactive virtual response (IVR) calls 2. DVD with IVR calls RCT arm: 3. Class with IVR calls 4. DVD with IVR calls 5. Class only
N = 600 Age ≥ 18 Men and women BMI ≥ 25 kg/m2 No diagnosis of DM, congestive heart failure, or coronary artery disease No pregnancy during trial No contraindication to physical activity or weight loss Must have access to telephone Must be able to read and speak English
Body weight at baseline and 12 months
February 2017
Gestational diabetes mellitus Lifestyle Intervention Program for Women With Gestational Diabetes of Gestational Impaired Glucose Tolerance (APPLES) Kaiser Permanente NCT01489163
RCT Adapted online DPP curriculum Usual care
N = 350 Women ages 20-45 Pregnancy with high glucose levels No DM prior to pregnancy No uncontrolled hypertension or active thyroid disease during pregnancy No severe cardiopulmonary disease No cancer diagnosis No conditions that lead to diet change No addiction to alcohol, drugs No current corticosteroid use
Body weight 24 months postpartum
June 2016

©Institute for Clinical and Economic Review, 2016 Page 98 Final Evidence Report – Diabetes Prevention Programs Return to Table of Contents
Title/ Trial Sponsor Study Design
Comparators Patient Population Primary Outcomes Estimated
Completion Date Diabetes Prevention Strategies in Women With Gestational Diabetes Mellitus (GDM) Kaiser Permanente NCT01344278
RCT Adapted telephonic and online DPP No intervention
N = 2,480 Age ≥ 18 Women only All women with gestational diabetes between March 2011 and 2012 Must have access to telephone or cell phone No overt diabetes prior to pregnancy
Meeting weight goals through 12 months postpartum
December 2015
Source: www.ClinicalTrials.gov (NOTE: studies listed on site include both clinical trials and observational studies)

©Institute for Clinical and Economic Review, 2016 Page 99 Final Evidence Report – Diabetes Prevention Programs Return to Table of Contents
Appendix H. Comparative Clinical Effectiveness Supplemental Information We performed screening at both the abstract and full-text level. A single investigator screened all abstracts identified through electronic searches according to the inclusion and exclusion criteria described earlier. We did not exclude any study at abstract-level screening due to insufficient information. For example, an abstract that did not report an outcome of interest would be accepted for further review in full text. We retrieved the citations that were accepted during abstract-level screening for full text appraisal. One investigator reviewed full papers and provided justification for exclusion of each excluded study.
We used criteria published by the US Preventive Services Task Force (USPSTF) to assess the quality of RCTs and comparative cohort studies, using the categories “good,” “fair,” or “poor” (see Appendix Table H11).104 Guidance for quality ratings using these criteria is presented below, as is a description of any modifications we made to these ratings specific to the purposes of this review.
Good: Meets all criteria: Comparable groups are assembled initially and maintained throughout the study; reliable and valid measurement instruments are used and applied equally to the groups; interventions are spelled out clearly; all important outcomes are considered; and appropriate attention is paid to confounders in analysis. In addition, intention to treat analysis is used for RCTs.
Fair: Studies were graded "fair" if any or all of the following problems occur, without the fatal flaws noted in the "poor" category below: Generally comparable groups are assembled initially but some question remains whether some (although not major) differences occurred with follow-up; measurement instruments are acceptable (although not the best) and generally applied equally; some but not all important outcomes are considered; and some but not all potential confounders are addressed. Intention to treat analysis is done for RCTs.
Poor: Studies were graded "poor" if any of the following fatal flaws exists: Groups assembled initially are not close to being comparable or maintained throughout the study; unreliable or invalid measurement instruments are used or not applied equally among groups (including not masking outcome assessment); and key confounders are given little or no attention. For RCTs, intention to treat analysis is lacking.
Note that case series are not considered under this rating system – because of the lack of comparator, these are generally considered to be of poor quality. Nevertheless, we restricted our use of case series to those that met specific criteria, including a minimum of six months follow-up, clearly defined entry criteria, and use of consecutive samples of patient

©Institute for Clinical and Economic Review, 2016 Page 100 Final Evidence Report – Diabetes Prevention Programs Return to Table of Contents
Table H1. Key Design Elements of the Diabetes Prevention Trials with Long Follow-up (20-25 years)
US: Diabetes Prevention Program Trial
(DPP Trial) Finnish DPS China Da Qing DPS
Inclusion Criteria
Age ≥ 25 years BMI ≥ 24 kg/m2 / 22 if Asian FPG 95-125 mg/dL (except American Indians any FPG) OGTT 140-199 mg/dL
Age 40-65 years BMI ≥ 25 kg/m2 FPG < 140 mg/dL OGTT 140-199 mg/dL
Age ≥ 25 years OGTT 140-199 mg/dL
Exclusion Criteria
Short life expectancy Hospitalized with CHD in past 6 months or class 2 or greater symptoms Aortic stenosis SBP > 180 mm Hg Cancer treated in past 5 years Pregnancy or planned pregnancy Major psychiatric disorder Alcoholism On medication affecting glucose Thiazide diuretic Beta blocker Niacin Corticosteroids Medications for weight loss
Life expectancy < 6 years Unlikely to follow study protocol
None
Lifestyle Intervention
Target weight reduction ≥ 7% Target exercise ≥ 150 minutes per week moderate intensity (Brisk walking) 16 lessons in 24 weeks one-on-one with trained case manager Diet Exercise Behavior modification Two supervised group exercise sessions per week 4- to 6-week group courses offered quarterly during maintenance phase
Target weight reduction ≥ 5% Target exercise ≥ 30 minutes per day moderate intensity (Brisk walking) 7 sessions one-on-one with nutritionist in 1st year, then once every 3 months Supervised, individualized, resistance exercise circuit training offered (50-85% participation)
Target BMI 23 kg/m2 Target exercise 1-2 units per day 1 unit = 30 minutes slow walking; 20 minutes brisk walking, 10 minutes slow running. Counseling weekly x 1 month, then monthly x 3 months, then every 3 months for 6 years.
BMI: body mass index, CHD: congestive heart disease, FPG: fasting plasma glucose, OGTT: oral glucose tolerance test;

©Institute for Clinical and Economic Review, 2016 Page 101 Final Evidence Report – Diabetes Prevention Programs Return to Table of Contents
Table H2. Baseline Characteristics of Participants in the Diabetes Prevention Trials with Long Follow-up (20-25 years)
US: Diabetes
Prevention Program Trial (DPP Trial)
Finnish DPS China Da Qing DPS
N 3234 522 577 Age, years 51 (11) 55 (7) 45 (9) Sex, %F 68 67 47 Weight, kg 94 (20) BMI, kg/m2 34.0 (6.7) 31 (5) 26 (4) FPG 106 (8.3) 109 (14) 101 (15) HbA1c 5.9 (0.5) OGTT, 2 hours 165 (17) 159 (27) 162 (16) BP 140 (18) /86 (9) Total-C 215 (37) Triglycerides 154 (72) HDL-C 46 (12) LDL-C Family History DM (%) 69
History GDM (%) 16
Race (%) White African American Hispanic American Indian Asian
55 20 16 5.3 4.4
100 0 0 0 0
0 0 0 0 100
Physical activity (MET-hr/week)
16.3
Note: Numbers in parentheses are standard deviations BMI: body mass index, BP: blood pressure, FPG: fasting plasma glucose, GDM: gestational diabetes mellitus, OGTT: oral glucose tolerance test, Total-C: total cholesterol

©Institute for Clinical and Economic Review, 2016 Page 102 Final Evidence Report – Diabetes Prevention Programs Return to Table of Contents
Table H3. Selected Outcomes for Participants in the Lifestyle Arms of the Diabetes Prevention Trials with Long Follow-up (20-25 years)
US: Diabetes Prevention Program Trial (DPP Trial)
Finnish DPS China Da Qing DPS
N 1079 265 438 One year outcomes Retention, % 95% 97% >94% Weight change, kg -6.8 -4.2 Weight change, % -7.2 -4.7 At least 5% weight loss, % >50% 43% At least 7% weight loss Change exercise (MET-hr/week) +7 Change FPG -5 -4 Change HbA1c -0.1 Change OGTT, 2 hours -15 Type 2 DM diagnosis 1% Diabetes diagnosis % (RRR [95% CI]) 1 year 1% (58% [48-66]) 5% 5-year 23% 27% 35% (51% [27-67]) 10-year 41% 40% 53% 15-year 55% (27% [17-35]) 60% (39% [21-52]) 65% 20-year 73% [43% [19-59]) Microvascular disease RR [95% CI]
0.91 (0.78-1.07) p=0.28 at 15 years
N/R
Cardiovascular disease, RR (95% CI)
• 1st event • Mortality
N/R N/R
N/R N/R
0.98 (0.71-1.37) 0.59 (0.36-0.96) At 23 years
FPG: fasting plasma glucose, OGTT: oral glucose tolerance test, RR: risk ratio, RRR: relative risk reduction, MET-hr/week: metabolic equivalent task hours per week, N/R: not reported

©Institute for Clinical and Economic Review, 2016 Page 103 Final Evidence Report – Diabetes Prevention Programs Return to Table of Contents
Table H4. Overview of Studies Implementing the DPP: Study Design
Reference Name Organization Design Control Inclusion Exclusion N in lifestyle
group Follow-up,
months Notes
Reference Study: In-person, Individual Coaching DPP Research Group 2002
DPP NIH RCT 27 centers
Usual care Age ≥ 25 BMI≥ 24 OGTT 140-199
Chronic disease limiting participation
1079 180 Reference trial
In-person, Group Coaching Ackerman 2008
DEPLOY Y Cluster RCT 2 sites
Brief coaching
Adults BMI≥24 Random BG 110-199 ≥ 2 RF for DM ADA risk assessment score ≥ 10
Exercise unsafe 46 12
Ackerman 2015
RAPID Y RCT 9 sites
Brief coaching
18+ BMI ≥ 24 FPG 100-125 OGTT 140-199 HbA1c 5.7-6.9
Pregnant Non-English speaking
257 12
Vojta 2013 - Y Pre-post - Age 18+ Participating in YMCA DPP
Exercise unsafe 2369 12 Administrative data
Bozack 2014 - Y Pre-post - Age 18+ Participating in NY State YMCA DPP
Exercise unsafe 254 10
Brokaw 2015 - Montana DPH&HS
Pre-post 15 sites
- Age 18+ BMI ≥ 25 A1c 5.7-6.4 GDM
Exercise unsafe 3804 10

©Institute for Clinical and Economic Review, 2016 Page 104 Final Evidence Report – Diabetes Prevention Programs Return to Table of Contents
Reference Name Organization Design Control Inclusion Exclusion N in lifestyle
group Follow-up,
months Notes
Marrero 2015
Weight Watchers
RCT NDEP Your Game Plan
Age 18+ BMI ≥ 24 ADA Risk assessment score ≥ 5 HbA1c 5.7-6.5
Pregnancy CVD event in past 6 months Medications affecting glucose
112 12
Katula 2011 HELP PD Wake Forest RCT Single center
Two individual sessions with nutritionist plus monthly newsletter
Age 21+ BMI 25-40 FPG 95-125 English speaking
Pregnancy Recent CVD events
151 24
Digital, Human Coaching McTigue 2009
VLM Canary Health
Pre-Post Single site
- PCP referral Ages 18-80 BMI ≥ 25 1 RF CVD Internet access
Pregnancy Exercise unsafe
50 12 Web based Only 16% with prediabetes
Sepah 2014 Omada Omada Health
Pre-Post Online
- Ages 18+ BMI ≥ 24 Able to exercise
- 220 12 Online recruitment
Digital, Fully-automated Coaching Block 2015 Alive-PD Turnaround
Health RCT Multispecialty practice
Usual care Ages 30-69 BMI > 27 English speaking Internet access FPG 100-125 or HbA1c 5.7-6.4
163 6 Fully automated
BMI: body mass index, BG: blood glucose, BP: blood pressure, FPG: fasting plasma glucose, GDM: gestational diabetes mellitus, OGTT: oral glucose tolerance test, PCP: primary care provider

©Institute for Clinical and Economic Review, 2016 Page 105 Final Evidence Report – Diabetes Prevention Programs Return to Table of Contents
Table H5. Overview of Studies Implementing the DPP: Program Elements
Reference Name Organization 16 core lessons weekly
8 monthly maintenance
lessons
Weight loss goal
Exercise goal
minutes per
week
1-on-1 health coach
Group Web Handheld Scale Pedometer
Reference Study: In-person, Individual Coaching DPP Research Group 2002
DPP NIH 1-on-1, in person
1-on-1, in person
7% 150 In person Yes No No No No
In-person, Group Coaching Ackerman 2008
DEPLOY YMCA Group Group 5-7% 150 No Yes No No No No
Ackerman 2015
RAPID YMCA Group Group 5-7% 150 No Yes No No No No
Vojta 2013 - YMCA Group Group 7% 150 No Yes No No No No Bozack 2014
- YMCA Group Group 5-7% 150 No Yes No No No No
Brokaw 2015
- Montana DPH&HS
Group Group 7% 150 No Yes No No No No
Marrero 2015
Weight Watchers
Group. Weight Watchers curriculum contains core content
No, weekly Weight Watchers meetings
7% N/R No Yes Yes Yes No No
Katula 2011
HELP PD Wake Forest 24 weekly groups
18 monthly groups
5-7% 180 Yes x 3 sessions
Yes No No No No
Digital, Human Coaching McTigue 2009
VLM Canary Health
Online Online N/R N/R Electronic messages
Moderated chat room
Yes No No Yes

©Institute for Clinical and Economic Review, 2016 Page 106 Final Evidence Report – Diabetes Prevention Programs Return to Table of Contents
Reference Name Organization 16 core lessons weekly
8 monthly maintenance
lessons
Weight loss goal
Exercise goal
minutes per
week
1-on-1 health coach
Group Web Handheld Scale Pedometer
Sepah 2014
Omada Omada Health
Yes, online 9 online N/R N/R Online and phone
Virtual, asynchronous
Yes Yes Wireless Yes
Digital, Fully-automated Coaching Block 2015 Alive-PD Turnaround
Health Weekly tailored goal setting mapped to DPP curriculum
Yes, every 2 weeks after 1st 6 months
No 150-300 No Team messaging option
Yes Yes No No

©Institute for Clinical and Economic Review, 2016 Page 107 Final Evidence Report – Diabetes Prevention Programs Return to Table of Contents
Table H6. Overview of Studies Implementing the DPP: Baseline Characteristics
Reference Name Organization Age % F College +,
% Family history
DM,% BMI,
kg/m2 Weight,
kg HbA1c,
% FPG,
mg/dL Race/Ethnicity
Reference Study: In-person, Individual Coaching DPP Research Group 2002
DPP NIH 51 68 N/R 70 34 94 5.9 106 White: 55 AA: 20 Hispanic: 16 AI: 5 Asian: 4
In-person, Group Coaching Ackerman 2008 DEPLOY Y 56 50 N/R N/R 32 94 5.5 N/R White: 93
AA: 4 Hispanic: 2 AI: Asian:
Ackerman 2015 RAPID Y 51 71 N/R 57 37 102 6.0 N/R White: 35 AA: 57 Hispanic: 3 AI: Asian:
Vojta 2013 - Y 50% >55
76 N/R N/R N/R N/R N/R N/R N/R
Bozack 2014 - Y 57 70 45 N/R 35 97 N/R N/R White: 78 AA: 15 Hispanic: 4 AI: Asian:
Brokaw 2015 - Montana DPH&HS
52 82 N/R N/R 36 N/R N/R N/R N/R

©Institute for Clinical and Economic Review, 2016 Page 108 Final Evidence Report – Diabetes Prevention Programs Return to Table of Contents
Marrero 2015 - Weight Watchers 52 83 54 N/R 37 101 5.9 108 White: 63 AA: 29 Hispanic: AI: Asian: 5
Katula 2011 HELP PD Wake Forest 57 58 56 N/R 33 94 N/R 105 White: 74 Black: 26 Hispanic: AI: Asian:
Digital, Human Coaching McTigue 2009 VLM Canary Health 52 76 68 N/R 36 ~102 N/R N/R White: 86
AA: 8 Hispanic: 0 AI: Asian: 4
Sepah 2014 Omada Omada Health 44 83 52 N/R 37 101 6.0 N/R White: 50 AA: 29 Hispanic: 11 AI: Asian:
Digital, Fully-automated Coaching Block 2015 Alive-PD Turnaround
Health 55 32 84 N/R 31 94 5.6 110 White: 67
AA: Hispanic: 4 AI: Asian: 25
AA: African American, AI: American Indian, BMI: body mass index, FPG: fasting plasma glucose

©Institute for Clinical and Economic Review, 2016 Page 109 Final Evidence Report – Diabetes Prevention Programs Return to Table of Contents
Table H7. Overview of Studies Implementing the DPP: Retention
Reference Name Organization 16 weeks 6 months 12 months % invited ≥9 sessions Reference Study: In-person, Individual Coaching DPP Research Group 2002
DPP NIH 95% all 16 97% 98% N/R >95%
In-person, Group Coaching Ackerman 2008 DEPLOY Y Mean 9.1
12 among n=35 attending 1 session
85% 63% 70% N/R
Ackerman 2015 RAPID Y 1 session 63% Mean 9.5
83% 63% 40%
Vojta 2013 - Y 4 sessions 89% 9 sessions 73% Mean 12.4
N/R N/R N/R 73%
Bozack 2014 - Y Mean 10.6 N/R N/R N/R 72% Brokaw 2015 - Montana DPH&HS 13.7/16 4.4/6 75% N/R Marrero 2015 Weight Watchers N/R 92% 84%
21.6 meetings NA NA
Katula 2011 HELP PD Wake Forest N/R 92% 89% 92% N/R Digital, Human Coaching McTigue 2009 VLM Canary Health 4 sessions >82
9 sessions 66% Mean 12.8
N/R 90% N/R 66%
Sepah 2014 Omada Omada Health 4 sessions 85% 9 sessions 70% Mean 13.8 core
N/R 74% with weight measured
N/R 70%
Digital, Fully-automated Coaching Block 2015 Alive-PD Turnaround Health 4 sessions 87%
17/24 sessions in 1st 6 months
86% N/R N/R NA

©Institute for Clinical and Economic Review, 2016 Page 110 Final Evidence Report – Diabetes Prevention Programs Return to Table of Contents
Table H8. Overview of Studies Implementing the DPP: Weight Loss
Reference Name Organization 16 weeks, % weight lost
6 months, % weight
lost
12 months, % weight
lost
>5% at 12
months
>7% at 12
months
Change in weight 12
months, kg
Change in BMI 12 months
>5% at 6 months
Reference Study: In-person, Individual Coaching DPP Research Group 2002
DPP NIH -6.9 -7.2 ~7 N/R 50% ~-7 N/R 65%
In-person, Group Coaching Ackerman 2008
DEPLOY Y -6.0 -6.0 -6.0 N/R N/R -5.7 -6.7 N/R
Ackerman 2015
RAPID Y N/R N/R N/R 32% N/R -2.3 N/R N/R
Vojta 2013 - Y N/R N/R -4.8 N/R N/R N/R N/R N/R Bozack 2014 - Y -4.2 - 6.3 61% 48% -6.0 N/R 40% Brokaw 2015 - Montana
DPH&HS N/R -6.2 N/R N/R N/R N/R N/R 50%
Marrero 2015 Weight Watchers
N/R -5.5 -5.6 OR 4.7 OR 5.0 -5.5 -2.1 OR 6.9
Katula 2011 HELP PD Wake Forest N/R -7.5 -7.2 59% N/R -7.0 -2.3 N/R Digital, Human Coaching McTigue 2009 VLM Canary Health N/R N/R N/R 31% 18% -4.8
(n=45/50) -4.9 (LOCF)
N/R
Sepah 2014 Omada Omada -5.0 (n=187/220) -4.1 (LOCF)
N/R -4.8 (n=187/220) -4.0 (LOCF)
N/R N/R -4.9 (n=187/220) N/R (LOCF)
N/R N/R
Digital, Fully-automated Coaching Block 2015 Alive-PD Turnaround
Health N/R -3.6 N/R N/R N/R N/R N/R 35%
All studies used an objective measure of body weight except Vojta 2013 (not described) and McTigue 2009 (self report). LOCF: last observation carried forward, N/R: not reported, OR: odds ratio
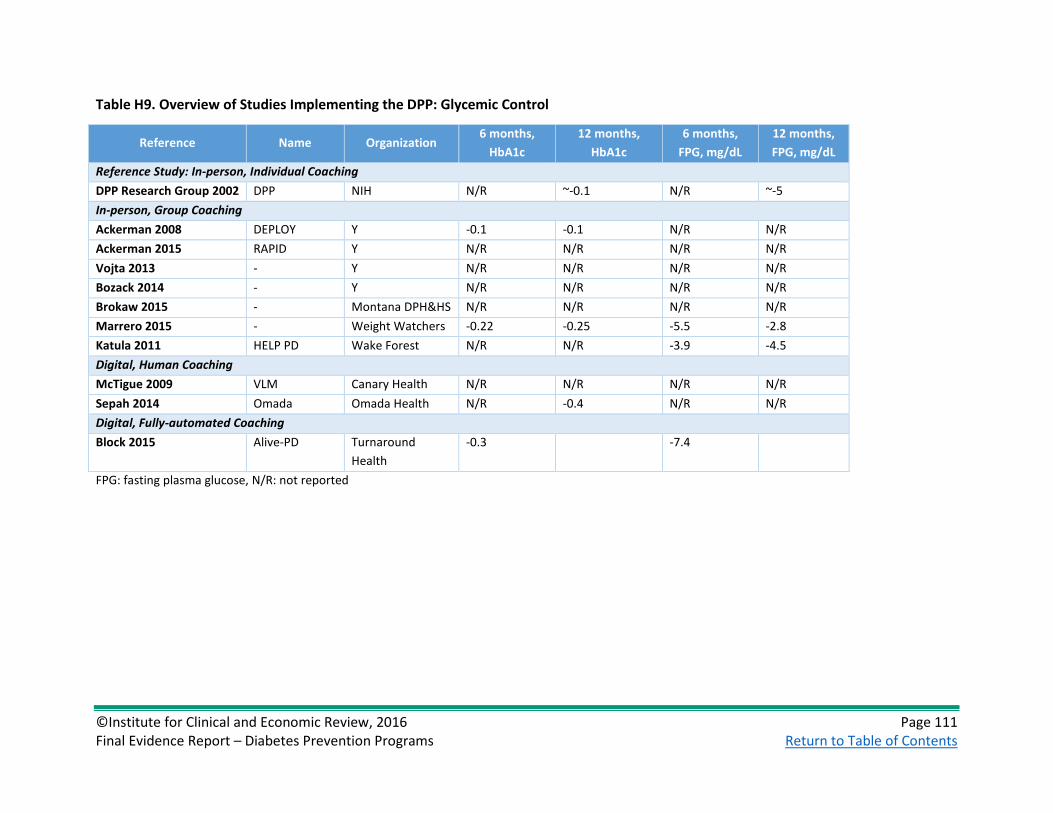
©Institute for Clinical and Economic Review, 2016 Page 111 Final Evidence Report – Diabetes Prevention Programs Return to Table of Contents
Table H9. Overview of Studies Implementing the DPP: Glycemic Control
Reference Name Organization 6 months,
HbA1c 12 months,
HbA1c 6 months,
FPG, mg/dL 12 months, FPG, mg/dL
Reference Study: In-person, Individual Coaching DPP Research Group 2002 DPP NIH N/R ~-0.1 N/R ~-5 In-person, Group Coaching Ackerman 2008 DEPLOY Y -0.1 -0.1 N/R N/R Ackerman 2015 RAPID Y N/R N/R N/R N/R Vojta 2013 - Y N/R N/R N/R N/R Bozack 2014 - Y N/R N/R N/R N/R Brokaw 2015 - Montana DPH&HS N/R N/R N/R N/R Marrero 2015 - Weight Watchers -0.22 -0.25 -5.5 -2.8 Katula 2011 HELP PD Wake Forest N/R N/R -3.9 -4.5 Digital, Human Coaching McTigue 2009 VLM Canary Health N/R N/R N/R N/R Sepah 2014 Omada Omada Health N/R -0.4 N/R N/R Digital, Fully-automated Coaching Block 2015 Alive-PD Turnaround
Health -0.3 -7.4
FPG: fasting plasma glucose, N/R: not reported

©Institute for Clinical and Economic Review, 2016 Page 112 Final Evidence Report – Diabetes Prevention Programs Return to Table of Contents
Table H10. Overview of Studies Implementing the DPP: Change in Physical activity and Other Outcomes at 12 Months
Reference Name Organization Physical
activity, MET-hr/wk
SBP, mm Hg DBP, mm Hg Total
cholesterol, mg/dL
HDL cholesterol, mg/dL
Reference Study: In-person, Individual Coaching DPP Research Group 2002 DPP NIH ~+7.5 -3.4 -3.6 -4.7 +1.0 In-person, Group Coaching Ackerman 2008 DEPLOY Y N/R -1.6 N/R -13.5 +1.9 Ackerman 2015 RAPID Y N/R N/R N/R N/R N/R Vojta 2013 - Y N/R N/R N/R N/R N/R Bozack 2014 - Y N/R N/R N/R N/R N/R Brokaw 2015 - Montana DPH&HS N/R N/R N/R N/R N/R Marrero 2015 Weight Watchers N/R -3.3 -5.4 +0.4 +6.3 Katula 2011 HELP PD Wake Forest N/R N/R N/R N/R N/R Digital, Human Coaching McTigue 2009 VLM Canary Health N/R -7.3 +0.4 N/R N/R Sepah 2014 Omada Omada Health N/R N/R N/R N/R N/R Digital, Fully-automated Coaching Block 2015 Alive-PD Turnaround
Health N/R N/R N/R N/R N/R
DBP: diastolic blood pressure, MET-hr/week: metabolic equivalent task hours per week, SBP: systolic blood pressure,

©Institute for Clinical and Economic Review, 2016 Page 113 Final Evidence Report – Diabetes Prevention Programs Return to Table of Contents
Table H11. Overview of Studies Implementing the DPP: Quality Assessment*
Reference Name Organization Design Comparable at Initiation
Maintenance of
comparability
Measurements equal and
valid
Clear definition of intervention
Key outcomes assessed
Analysis appropriate
Quality
Reference Study: In-person, Individual Coaching DPP Research Group 2002
DPP NIH RCT Yes Yes Yes Yes Yes Yes Good
In-person, Group Coaching Ackerman 2008
DEPLOY YMCA RCT No Age, sex, race
No 37% lost F/U
Yes Yes Yes Yes Fair
Ackerman 2015
RAPID YMCA RCT Yes Yes Yes Yes Yes Yes Good
Vojta 2013 - YMCA Pre-post
N/A N/A Unclear Yes No Yes Poor
Bozack 2014 - YMCA Pre-post
N/A N/A 26% lost F/U
Self-reported Yes Yes Yes Poor
Brokaw 2015 - Montana DPH&HS
Pre-post
N/A N/A 25% lost F/U
Yes Yes Yes Yes Poor
Marrero 2015 - Weight Watchers
RCT Yes No 28% lost F/U
Yes Yes Yes Yes Fair
Katula 2011 HELP PD Wake Forest RCT Yes Yes Yes Yes Yes Yes Good Digital, Human Coaching McTigue 2009 VLM Canary Health Pre-
post N/A N/A Self-reported Yes Yes Yes Poor
Sepah 2014 Omada Omada Pre-post
N/A N/A Yes Yes Yes Yes Fair
Digital, Fully Automated Coaching Block 2015 Alive-PD Turnaround
Health RCT Yes Yes Yes Yes Yes Yes Good
*Using USPSTF Quality Rating Criteria

©Institute for Clinical and Economic Review, 2016 Page 114 Final Evidence Report – Diabetes Prevention Programs Return to Table of Contents
Appendix I. Comparative Value Supplemental Information Table I1. Overview of Studies Implementing the DPP: Evaluations of Cost-Effectiveness from Health System and Societal Perspectives
Reference Name Comparator Time
Horizon Population Net Costs QALYS Gained
ICER (Health System)
ICER (Societal)
In-person, Individual Coaching
DPP Research Group 2003
DPP Trial Placebo 3 years DPP Trial $2,269 (2000 USD)
0.072 $32,000 $52,300
Metformin Placebo 3 years DPP Trial $2,191 0.022 $102,200 $101,700
DPP Research Group 2012
DPPT/DPPOS Placebo 10 years DPP Trial, DPPOS $1,748 (2010)
0.14 $13,000 $19,800
Metformin Placebo 10 years DPP Trial, DPPOS -$105 0.01 Cost-saving Cost-saving DPP Trial/DPPOS Metformin 10 years DPP Trial, DPPOS $1,853 0.12 $14,900 $45,900
Herman 2005 DPP (simulation) Placebo Lifetime ≥ 25 yrs old with IGT $635
(2000) 0.57 $1,100 $8,800
Metformin Placebo Lifetime ≥ 25 yrs old with IGT $3,922 0.13 $31,300 $29,900
Hoerger 2007
DPP for IGT+IFG No screening Lifetime 45-74 yrs old with BMI ≥ 25 kg/m2
$329 (2001)
0.040 $8,200 $16,345
DPP for IGT or IFG No screening Lifetime 45-74 yrs old with BMI ≥ 25kg/m2
$1,122 0.118 $9,500 $18,777
DPP for IGT or IFG DPP for IGT+IFG
Lifetime 45-74 yrs old with BMI ≥ 25 kg/m2
$793 0.078 $10,200 N/R
Eddy 2005 (Archimedes)
DPP No prevention 30 years Adults at high risk for diabetes
$9,969 (2000 USD)
0.159 $143,000 $62,600
Metformin No prevention 30 years Adults at high risk for diabetes
$4,018 0.113 N/R $35,500
Lifestyle intervention post-diabetes
No prevention 30 years Adults at high risk for diabetes
$3,066 0.125 N/R $24,500
Eddy 2005 cont’d DPP ILI post-diabetes
30 years Adults at high risk for diabetes
$6,903 0.034 N/R $201,800

©Institute for Clinical and Economic Review, 2016 Page 115 Final Evidence Report – Diabetes Prevention Programs Return to Table of Contents
Reference Name Comparator Time
Horizon Population Net Costs QALYS Gained
ICER (Health System)
ICER (Societal)
In-person, Group Coaching DPP Research Group 2003
DPP Trial as group Placebo 3 years DPP Trial N/R N/R $9,000 $29,100
DPP Research Group 2012
DPP Trial as group Placebo 10 years DPP Trial, DPPOS $201 0.14 $1,500 $8,400
Herman 2005 DPP as group (simulation)
Placebo Lifetime ≥ 25 yrs old with IGT -$3,696 0.57 Cost-saving
Hoerger 2007
DPP group for IGT+IFG No screening Lifetime 45-74 yrs old with BMI ≥ 25 kg/m2
N/R 0.040 Cost-saving N/R
DPP group for IGT or IFG
No screening Lifetime 45-74 yrs old with BMI ≥ 25 kg/m2
N/R 0.118 $267 N/R
Eddy 2005 (Archimedes)
DPP group ($217/yr) No prevention 30 years Adults at high risk for diabetes
N/R N/R $27,000 $12,000
Hinnant 2016 claims analysis
DEPLOY Usual care 2 years Medicare beneficiaries with prediabetes
-$1,820 (2014 USD)
Not measured Cost-saving N/R
Spitalnic 2016 budget impact
DEPLOY (Medicare expansion)
No Medicare expansion
Lifetime Medicare beneficiaries 65-75 yrs old
N/R Not measured Cost-saving* N/R
Digital, Human Coaching Su 2016 ROI analysis
Omada Usual care 10 years Adults with prediabetes & BMI ≥25kg/m2
-$12,026 N/R Cost-saving (positive ROI)
N/R
Smith 2016 VLM Usual care 10 years Prediabetes (BMI ≥ 25 kg/m2 & ≥ 1 CVD risk factor)
$458 (2010) 0.0589 $7,800 $18,300
Digital, Fully Automated Coaching (No cost-effectiveness analyses identified) *Cost-saving if mortality effects excluded (as for Medicare certification); approximately cost-neutral if included BMI: body mass index, CVD: cardiovascular disease, IFG: impaired fasting glucose, IGT: impaired glucose tolerance, ILI: inventive lifestyle intervention, ROI: return on investment, USD: United States Dollars

©Institute for Clinical and Economic Review, 2016 Page 116 Final Evidence Report – Diabetes Prevention Programs Return to Table of Contents
Table I2. Average Costs and Cost Offsets per Year by Program Type in 2015 Dollars*
Program Costs ($) Cost Offsets ($) Year 1 Year 2 Year 3 Year 4 Year 5 Year 1 Year 2 Year 3 Year 4 Year 5 In-person, individual coaching41
$2,100 $1,020 $1,052 $199 $145 $198 $37 $610 $446 $461
In-person, group coaching22,41,44,136,137
$752 $350 $367 $127 $100 $1,207 $783 $610 $446 $461
Digital, human coaching46,47,138,139
$619 $362 $311 $311 $311 $501 $752 $462 $866 $866
*Unpublished data indicate annual program costs of $66 per person for one digital automated DPP, with estimated annual cost offsets from reduced diabetes incidence of $90 per year (using HbA1c criterion) or $455 per year (using FPG criterion)110,111 Table I3. Undiscounted Potential Budget Impact Cost per Participant from 1 to 5 years, Prediabetes defined as FPG 100-125 mg/dL: Payer Perspective
Time Horizon In-Person Individual Coaching In-person, Group Coaching Digital, Human Coaching
Annual Total BI Annual BI/ Participant Annual Total BI Annual BI/ Participant Annual Total BI Annual BI/ Participant
1 year $3,563,824,621 $1,902 ($851,606,567) ($455) $219,877,054 $117 2 years $5,406,067,698 $1,443 ($1,663,498,085) ($444) ($509,824,017) ($136) 3 years $6,235,615,751 $1,110 ($2,117,394,850) ($377) ($792,509,542) ($141) 4 years $5,772,361,644 $770 ($2,714,577,187) ($362) ($1,832,628,826) ($245) 5 years $5,179,827,320 $553 ($3,390,404,989) ($362) ($2,872,748,110) ($307)

©Institute for Clinical and Economic Review, 2016 Page 117 Final Evidence Report – Diabetes Prevention Programs Return to Table of Contents
Table I4. Undiscounted Potential Budget Impact Cost per Participant from 1 to 5 years, Prediabetes defined as FPG 110-125 mg/dL: Payer Perspective
Time Horizon In-Person, Individual Coaching In-person, Group Coaching Digital, Human Coaching
Annual Total BI Annual BI/ Participant Annual Total BI Annual BI/ Participant Annual Total BI Annual BI/ Participant
1 year $1,187,942,174 $1,902 ($283,869,007) ($455) $73,292,390 $117 2 years $1,802,023,528 $1,443 ($554,499,658) ($444) ($169,941,430) ($136) 3 years $2,078,539,693 $1,110 ($705,798,660) ($377) ($264,169,988) ($141) 4 years $1,924,121,575 $770 ($904,859,545) ($362) ($610,876,601) ($245) 5 years $1,726,610,029 $553 ($1,130,135,600) ($362) ($957,583,214) ($307)

©Institute for Clinical and Economic Review, 2016 Page 118 Final Evidence Report – Diabetes Prevention Programs Return to Table of Contents
Figure I1. Potential Budget Impact Graph for DPPs Provided to Varying Proportions of the US Population with FPG 110-125 mg/dL
Note: Colored lines represent the annualized potential budget impact of different uptake patterns (percent of eligible population enrolled) for each type of DPP.
In-Person Individual
In-Person GroupDigital Coached
-$10
-$5
$0
$5
$10
$15
$20
$25
$30
0% 25% 50%
Annu
al B
udge
t Im
pact (
Billi
ons)
% Eligible Patients Treated

©Institute for Clinical and Economic Review, 2016 Page 119 Final Evidence Report – Diabetes Prevention Programs Return to Table of Contents
Appendix J. Conflict of Interest Disclosures Tables J1 through J3 contain conflict of interest (COI) disclosures for all participants at the June 24, 2016 public meeting of the California Technology Assessment Forum.
Table H1. ICER Staff and Consultant COI Disclosures
Name Organization COI Rick Chapman, PhD, MS ICER None Daniel Ollendorf, PhD ICER None Steven Pearson, MD, MSc ICER None Celia Segel, MPH ICER None Matt Seidner, BS ICER None Karen Shore, PhD Transform Health None Jeff Tice, MD UCSF None Jed Weissberg, MD ICER None Table H2. CTAF Panel Member COI Disclosures
Name Organization COI Christine Castano, MD HealthCare Partners Medical Group * Robert Collyar Patient Advocates in Research * Meg Durbin, MD Canopy Health * Rena Fox, MD UCSF * Luanda Grazette, MD, MPH, FACC USC * Kimberly Gregory, MD, MPH Cedars-Sinai Medical Center * Jeff Klingman, MD The Permanente Medical Group * Joy Melnikow, MD, MPH UC Davis * Robert E. Rentschler, MD Beaver Medical Group * Rita F. Redberg, MD, MSc, FACC UCSF * Michael Steinberg, MD UCLA * Daniel J. Ullyot, MD (Chair) Retired, UCSF † Gerald R. Winslow, PhD Loma Linda University Medical Center * * No conflicts of interest to disclose, defined as more than $10,000 in health care company stock or more than $5,000 in honoraria or consultancies during the previous year from relevant health care manufacturers or insurers †Recused from voting for this meeting; a relative works as a principal in a venture capital firm that has provided financial support to one of the companies providing DPP services included in this review.

©Institute for Clinical and Economic Review, 2016 Page 120 Final Evidence Report – Diabetes Prevention Programs Return to Table of Contents
Table H3. Policy Roundtable Participant Conflict of Interest Disclosures
Name Position and Organization COI Ann Albright, PhD, RD
Director, Division of Diabetes Translation, Centers for Disease Control and Prevention
None declared.
Tony Kuo, MD, MSHS
Acting Director, Division of Chronic Disease and Injury Prevention and Director, Office of Senior Health, Los Angeles County Department of Public Health
None declared.
Andrew Kuykendall, MSSW
DPP Participant No financial conflicts of interest. A relative works as a program coordinator for a community-based DPP in Los Angeles.
Elizabeth Murphy, MD, DPhil
Chief, Endocrinology and Metabolism Division and Director of Diabetes Center for High Risk Populations, San Francisco General Hospital; Professor of Clinical Medicine, UCSF
None declared.
Arthur Southam, MD, MBA, MPH
Executive Vice President, Health Plan Operations, Kaiser Permanente
Full-time employee and executive of Kaiser Foundation Health Plans and Hospitals; board member of CHRISTUS Health; owns shares of health care and pharmaceutical stock valued >$10,000; on board of directors of Council for Affordable Quality Health Care.
Tony Van Goor, MD, MMM, CPE, FACP
Senior Director, Medical Affairs, Medical Director for Policy and Technology Assessment, Blue Shield of California
Full-time employee of Blue Shield of California.