DIABETES IN PREGNANCY BY DR. SHUMAILA ZIA. DIABETES IN PREGNANCY INCIDENCE -- 34/1000 pregnancy.
Diabetes in Pregnancy in CMDHB
Trends Over Time, a 2011 Snapshot
and Service Implications
Doone Winnard and Pip Anderson,
in collaboration with
Lesley MacLennan, Kara Okesene-Gafa,
March 2013
2
Acknowledgements
This report was prepared by Drs Doone Winnard and Philippa Anderson, Public Health Medicine
Physicians, Counties Manukau District Health Board, working closely with Lesley MacLennan,
Diabetes Midwife and Kara Okesene-Gafa, Consultant Obstetrician.
We would like to acknowledge the data support from our analyst Dean Papa. Donna Harvey,
Community Liaison Co-ordinator Women’s Health, also provided data on postnatal follow up of
women with gestational diabetes. Fawsia Saleem, Decision Support, provided an extract on a cohort
of women attending diabetes in pregnancy clinics.
Helpful review was provided by members of the Diabetes in Pregnancy and Diabetes services –
namely Carl Eagleton, Isabella Smart, Elaine Chong, Caran Barratt-Boyes, Brandon Orr-Walker.
Disclaimer
This report should be considered a ‘work in progress’, which will need to be modified and updated
as new information comes to hand. Its development was an iterative process, arising from the
Population Health Review undertaken by CMDHB during 2012 and it is acknowledged it raises as
many questions as it answers. Feedback is welcomed; please direct that to Doone Winnard at
Every effort has been made to ensure that the information in this report is correct. Counties
Manukau District Health Board and the authors do not accept any responsibility for information
which is incorrect and where action has been taken as a result of the information in this report.
3
Executive Summary Diabetes in pregnancy (DIP), which includes both Gestational Diabetes (GDM) and pre-existing
diabetes, represents a significant risk for poorer pregnancy outcomes and has implications for the
future health of both mother and baby. Concern has been expressed locally and internationally
about the increasing prevalence of diabetes in pregnancy. This paper summarises and compares
data about diabetes in pregnancy for both the CMDHB resident population and the population
delivering at CMDHB facilities, to attempt to quantify and better understand the ‘current state’ for
CMDHB. It draws on National Minimum Data Set (NMDS) and CMDHB DIP service data. Results of
analyses have been discussed with leaders of the CMDHB Diabetes in Pregnancy service to ensure
they are consistent with observations in clinical practice and to consider the implications for service
planning and delivery.
The screening and management pathways for diabetes in pregnancy are currently somewhat in a
state of flux, with national guidelines about GDM under current review and differential
implementation of an early pregnancy screening pathway across the Auckland region. This impacts
on comparisons over time and between DHBs but nevertheless this report has identified some
important overarching concerns:
While the total number of deliveries (8,500) and the number and proportion of deliveries by
age for CMDHB women over the last six years has remained fairly constant, using the
National Minimum Data Set (NMDS) the number of deliveries for CMDHB women identified
with GDM has almost doubled over the six years from 2006/07 (225) to 2011/12 (407).
The crude rate of deliveries identified with GDM for CMDHB women has correspondingly
increased from 2.7% to 4.8%. The highest rates are in Indian (9.6%), Chinese (8.6%) and
other Asian women (7.7%), but the largest volume of cases continues to be women of Pacific
ethnicities (154 in 2011/12). [Note: The differences by ethnicity across a range of
parameters in relation to diabetes in pregnancy highlight the need, as for other areas, to
disaggregate data so that the issues for different groups can be adequately explored].
The total number of deliveries with pre-existing diabetes has also increased over the last six
years (106 in 2011/12), with the biggest proportionate increases being for Pacific, Indian and
other Asian women, although numbers are small for Indian and other Asian groups.
Young women with Type 2 diabetes, with co-morbidities not usually expected until later in
life, are of principle concern for staff of the DIP service. In their experience young women
with diabetes frequently seem to have very limited understanding of the risks to their
pregnancy and the future health of their child from poorly controlled diabetes.
Overall the volume of deliveries complicated by diabetes in 2011/12 was over 500,
representing a crude rate of 6% of all deliveries for women resident in CMDHB.
Looking at the overall group of CMDHB resident women (eligible to deliver at CMDHB) with
either GDM or pre-existing diabetes in 2011, the percentage delivering at CMDHB facilities
was very high for Maaori (90%), Pacific (95%) and Indian (82%) women. It was 70% or over
4
for women of European/Other and non-Indian/non-Chinese Asian groups but much lower
for Chinese women (30%), who were more likely to deliver at ADHB facilities.
In 2011 there were also 36 women from other DHBs who delivered at CMDHB facilities who
were identified as having diabetes in pregnancy. 72% of these women were of Pacific or
Indian ethnicity and 55% were from Otahuhu.
If the trends of overall rates of diabetes in pregnancy of the past six years continue, with no
change in definition of GDM or screening practices and a stable birth cohort size, there
would be an expected increase of nearly 25% (8% per annum) on 2011/12 volumes of
CMDHB women needing to be managed by diabetes in pregnancy services by 2014/15.
Although not all of these women will be managed by the CMDHB service, there are also
women from other DHBs who deliver at CMDHB and require care under the CMDHB service.
These projections may overestimate or underestimate future demand depending on
changes in the ethnic mix of the CMDHB population, the rates of obesity in women of
childbearing age and potential changes in screening and diagnostic pathways for DIP.
However the expected changes in all of these drivers are likely to be upward rather than
downward.
According to the National Women’s Annual report, in 2011 approximately 11% of women
who birthed at NW were reported as diagnosed with GDM; i.e. nearly twice the prevalence
identified in this report for CMDHB women. Although the delivery population at ADHB
facilities is considerably older than the CMDHB population, which increases their risk of
GDM, age specific rates by ethnicity were higher across all age groups than CMDHB rates.
Discussion with CMDHB clinicians suggests this is related to screening and diagnostic
pathways, but the differences become material for service planning and/or research which
extends across the region, and warrant further discussion with relevant clinicians. It also
raises questions about the appropriateness of polycose screening, which is not weight-
adjusted, for the CMDHB population with concern that is resulting in false negatives in the
CMDHB population so that women are not receiving further (appropriate) investigation.
However, there are also concerns by CMDHB clinicians about further overloading the DIP
service by diagnosing more women with GDM at the mild end of the spectrum rather than
addressing the higher risk patients and diluting their care before there is an adequate
pathway for those currently being diagnosed.
Screening and Postnatal Follow Up
Close to three quarters (73%) of CMDHB woman without pre-existing diabetes were
screened by a polycose test for GDM and a further 7-8% underwent GGT. Maaori women
had the lowest rate of polycose screening at 61%, and this lower screening rate needs to be
addressed, whatever decisions are made about screening pathways going forward.
Overall, if the women who weren’t screened and/or tested had the same GDM rates as
those who were, there may have been approximately 70 women and infants in 2011 (based
on current practice) whose outcomes could have been impacted by undiagnosed GDM.
5
Women with GDM have a significant risk of future Type 2 diabetes and improving postnatal
screening for underlying diabetes in women with GDM has been an area of significant
attention in recent years in CMHDB. In 2011 63% of CMDHB resident women identified with
GDM had a GGT or HbA1c within six months of delivery. This means there is still a significant
proportion of women with GDM who are not currently followed up postnatally as
recommended in guidelines, despite efforts to improve this. Importantly there are
interventions to reduce their risk of future diabetes but not a robust pathway to support this
at present.
There has been a recent regional discussion about the possibility of using HbA1c at 12 weeks
postpartum as an alternative to the currently recommended 75gm OGTT at six weeks post-
partum for diabetes screening as it is anticipated this change would improve postnatal
screening rates.
There is also potential for a GDM register to support robust more screening and
intervention.
In summary, diabetes in pregnancy is a significant issue for the current and future generations of the
CMDHB population and creates considerable health system demand; increased efforts to both
prevent and better diagnose and manage DIP need to be an important feature of population health
activity for CMDHB.
6
Table of Contents
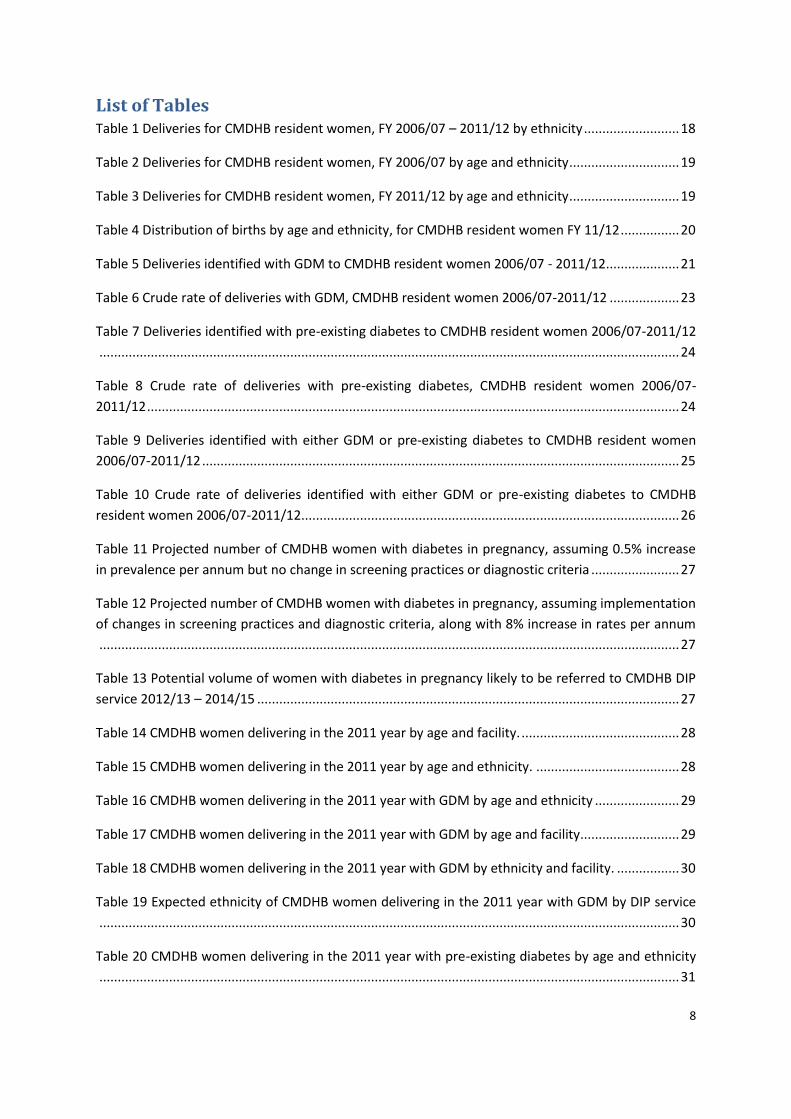
List of Tables ........................................................................................................................................... 8
List of Figures ........................................................................................................................................ 11
Introduction and purpose ..................................................................................................................... 13
Methods ................................................................................................................................................ 15
National Minimum Data Set analysis ................................................................................................ 15
Diabetes in Pregnancy Service analysis ............................................................................................ 17
Trends over time ................................................................................................................................... 18
Context .............................................................................................................................................. 18
Deliveries complicated by gestational diabetes ............................................................................... 21
Deliveries complicated by pre-existing diabetes .............................................................................. 24
Overall deliveries complicated by diabetes ...................................................................................... 25
Projections of future growth for service planning ............................................................................ 27
2011 Snapshot (based on NMDS) ......................................................................................................... 28
Context .............................................................................................................................................. 28
Women with gestational diabetes .................................................................................................... 29
Women with pre-existing diabetes ................................................................................................... 31
Women with either gestational or pre-existing diabetes ................................................................. 32
Comparison with data from the CMDHB Diabetes in Pregnancy service database ......................... 34
Clinical parameters of women seen at the CMDHB Diabetes in Pregnancy service ............................ 39
HbA1c levels at referral ..................................................................................................................... 39
BMIs .................................................................................................................................................. 40
Mode of delivery ............................................................................................................................... 43
Birth weight ....................................................................................................................................... 44
Screening for GDM ................................................................................................................................ 47
Postnatal Follow-up .............................................................................................................................. 50

7
Other comparisons ............................................................................................................................... 52
Discussion.............................................................................................................................................. 54
References ............................................................................................................................................ 59
Appendix One: Current screening and diagnostic criteria for Diabetes in Pregnancy, as used in
CMDHB (from November 2010) ............................................................................................................ 61
Appendix Two: ICD codes for diabetes in pregnancy ........................................................................... 61
8
List of Tables Table 1 Deliveries for CMDHB resident women, FY 2006/07 – 2011/12 by ethnicity .......................... 18
Table 2 Deliveries for CMDHB resident women, FY 2006/07 by age and ethnicity .............................. 19
Table 3 Deliveries for CMDHB resident women, FY 2011/12 by age and ethnicity .............................. 19
Table 4 Distribution of births by age and ethnicity, for CMDHB resident women FY 11/12 ................ 20
Table 5 Deliveries identified with GDM to CMDHB resident women 2006/07 - 2011/12 .................... 21
Table 6 Crude rate of deliveries with GDM, CMDHB resident women 2006/07-2011/12 ................... 23
Table 7 Deliveries identified with pre-existing diabetes to CMDHB resident women 2006/07-2011/12
.............................................................................................................................................................. 24
Table 8 Crude rate of deliveries with pre-existing diabetes, CMDHB resident women 2006/07-
2011/12 ................................................................................................................................................. 24
Table 9 Deliveries identified with either GDM or pre-existing diabetes to CMDHB resident women
2006/07-2011/12 .................................................................................................................................. 25
Table 10 Crude rate of deliveries identified with either GDM or pre-existing diabetes to CMDHB
resident women 2006/07-2011/12....................................................................................................... 26
Table 11 Projected number of CMDHB women with diabetes in pregnancy, assuming 0.5% increase
in prevalence per annum but no change in screening practices or diagnostic criteria ........................ 27
Table 12 Projected number of CMDHB women with diabetes in pregnancy, assuming implementation
of changes in screening practices and diagnostic criteria, along with 8% increase in rates per annum
.............................................................................................................................................................. 27
Table 13 Potential volume of women with diabetes in pregnancy likely to be referred to CMDHB DIP
service 2012/13 – 2014/15 ................................................................................................................... 27
Table 14 CMDHB women delivering in the 2011 year by age and facility. ........................................... 28
Table 15 CMDHB women delivering in the 2011 year by age and ethnicity. ....................................... 28
Table 16 CMDHB women delivering in the 2011 year with GDM by age and ethnicity ....................... 29
Table 17 CMDHB women delivering in the 2011 year with GDM by age and facility........................... 29
Table 18 CMDHB women delivering in the 2011 year with GDM by ethnicity and facility. ................. 30
Table 19 Expected ethnicity of CMDHB women delivering in the 2011 year with GDM by DIP service
.............................................................................................................................................................. 30
Table 20 CMDHB women delivering in the 2011 year with pre-existing diabetes by age and ethnicity
.............................................................................................................................................................. 31
9
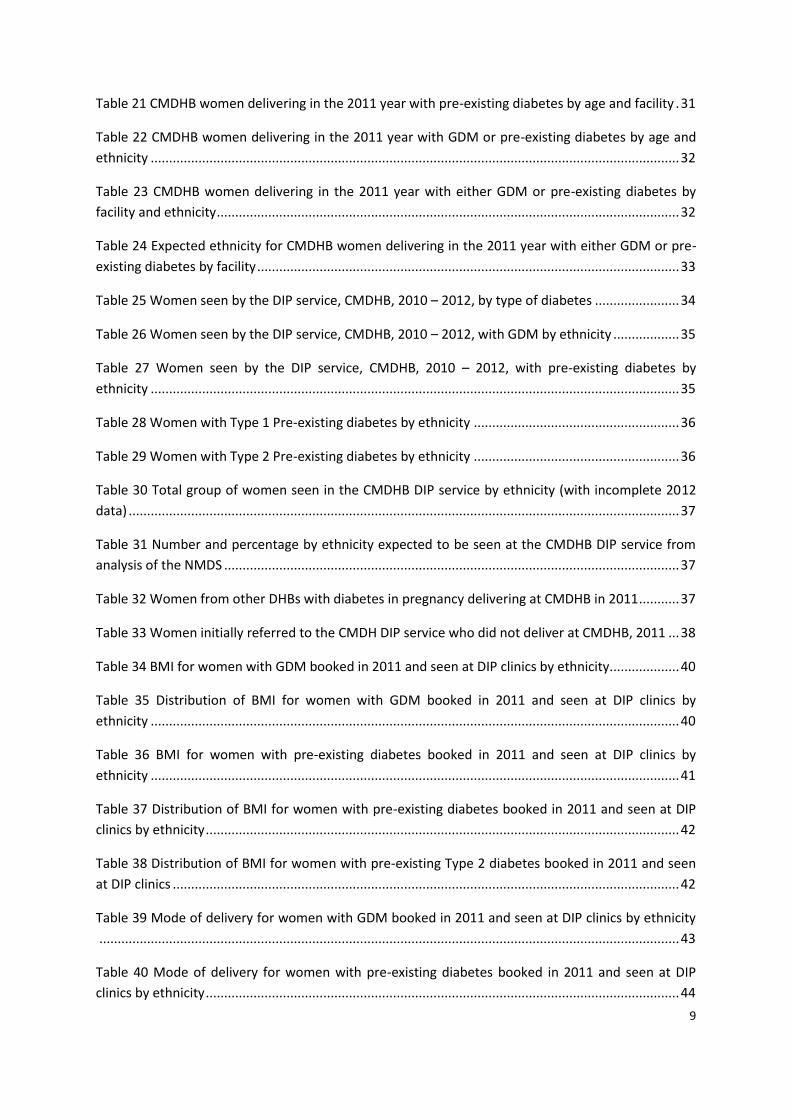
Table 21 CMDHB women delivering in the 2011 year with pre-existing diabetes by age and facility . 31
Table 22 CMDHB women delivering in the 2011 year with GDM or pre-existing diabetes by age and
ethnicity ................................................................................................................................................ 32
Table 23 CMDHB women delivering in the 2011 year with either GDM or pre-existing diabetes by
facility and ethnicity .............................................................................................................................. 32
Table 24 Expected ethnicity for CMDHB women delivering in the 2011 year with either GDM or pre-
existing diabetes by facility ................................................................................................................... 33
Table 25 Women seen by the DIP service, CMDHB, 2010 – 2012, by type of diabetes ....................... 34
Table 26 Women seen by the DIP service, CMDHB, 2010 – 2012, with GDM by ethnicity .................. 35
Table 27 Women seen by the DIP service, CMDHB, 2010 – 2012, with pre-existing diabetes by
ethnicity ................................................................................................................................................ 35
Table 28 Women with Type 1 Pre-existing diabetes by ethnicity ........................................................ 36
Table 29 Women with Type 2 Pre-existing diabetes by ethnicity ........................................................ 36
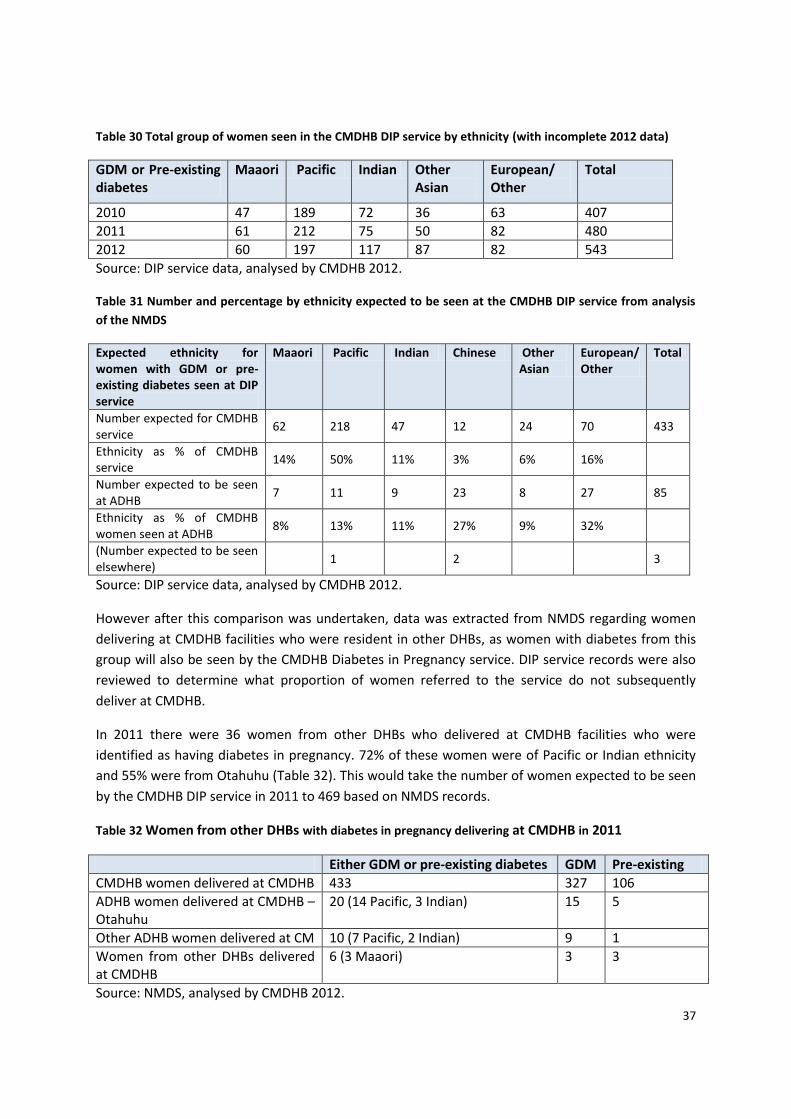
Table 30 Total group of women seen in the CMDHB DIP service by ethnicity (with incomplete 2012
data) ...................................................................................................................................................... 37
Table 31 Number and percentage by ethnicity expected to be seen at the CMDHB DIP service from
analysis of the NMDS ............................................................................................................................ 37
Table 32 Women from other DHBs with diabetes in pregnancy delivering at CMDHB in 2011 ........... 37
Table 33 Women initially referred to the CMDH DIP service who did not deliver at CMDHB, 2011 ... 38
Table 34 BMI for women with GDM booked in 2011 and seen at DIP clinics by ethnicity................... 40
Table 35 Distribution of BMI for women with GDM booked in 2011 and seen at DIP clinics by
ethnicity ................................................................................................................................................ 40
Table 36 BMI for women with pre-existing diabetes booked in 2011 and seen at DIP clinics by
ethnicity ................................................................................................................................................ 41
Table 37 Distribution of BMI for women with pre-existing diabetes booked in 2011 and seen at DIP
clinics by ethnicity ................................................................................................................................. 42
Table 38 Distribution of BMI for women with pre-existing Type 2 diabetes booked in 2011 and seen
at DIP clinics .......................................................................................................................................... 42
Table 39 Mode of delivery for women with GDM booked in 2011 and seen at DIP clinics by ethnicity
.............................................................................................................................................................. 43
Table 40 Mode of delivery for women with pre-existing diabetes booked in 2011 and seen at DIP
clinics by ethnicity ................................................................................................................................. 44
10
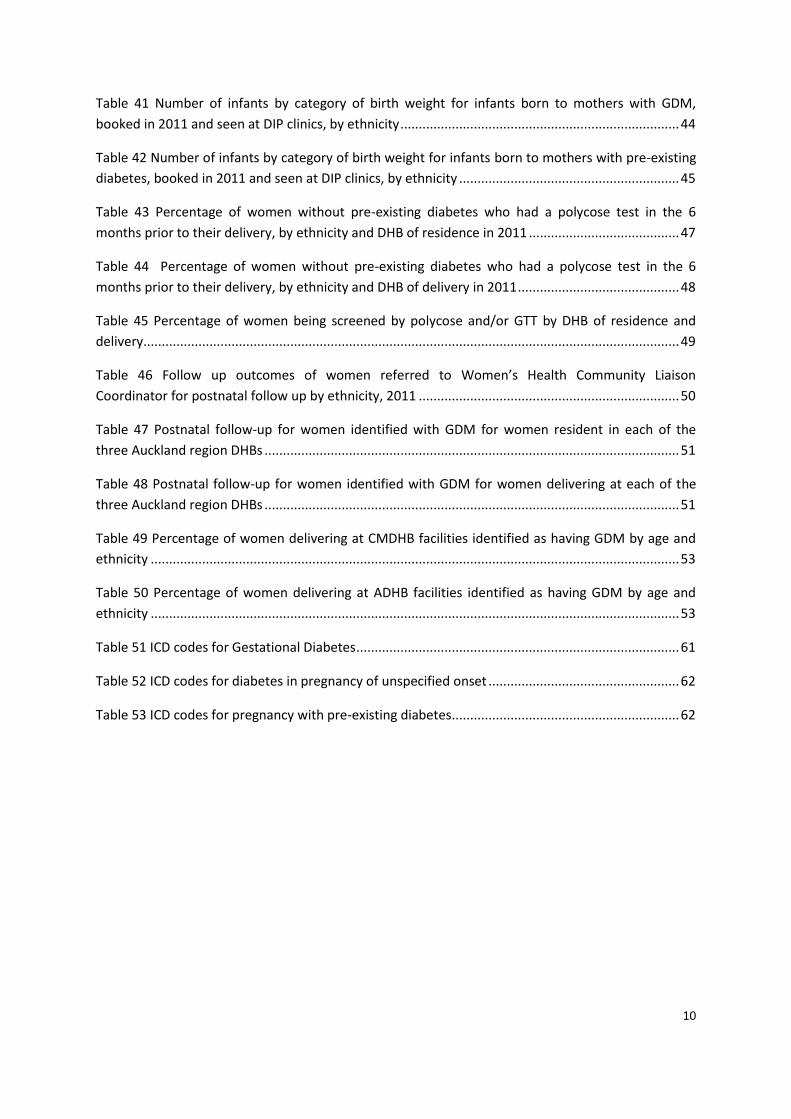
Table 41 Number of infants by category of birth weight for infants born to mothers with GDM,
booked in 2011 and seen at DIP clinics, by ethnicity ............................................................................ 44
Table 42 Number of infants by category of birth weight for infants born to mothers with pre-existing
diabetes, booked in 2011 and seen at DIP clinics, by ethnicity ............................................................ 45
Table 43 Percentage of women without pre-existing diabetes who had a polycose test in the 6
months prior to their delivery, by ethnicity and DHB of residence in 2011 ......................................... 47
Table 44 Percentage of women without pre-existing diabetes who had a polycose test in the 6
months prior to their delivery, by ethnicity and DHB of delivery in 2011 ............................................ 48
Table 45 Percentage of women being screened by polycose and/or GTT by DHB of residence and
delivery .................................................................................................................................................. 49
Table 46 Follow up outcomes of women referred to Women’s Health Community Liaison
Coordinator for postnatal follow up by ethnicity, 2011 ....................................................................... 50
Table 47 Postnatal follow-up for women identified with GDM for women resident in each of the
three Auckland region DHBs ................................................................................................................. 51
Table 48 Postnatal follow-up for women identified with GDM for women delivering at each of the
three Auckland region DHBs ................................................................................................................. 51
Table 49 Percentage of women delivering at CMDHB facilities identified as having GDM by age and
ethnicity ................................................................................................................................................ 53
Table 50 Percentage of women delivering at ADHB facilities identified as having GDM by age and
ethnicity ................................................................................................................................................ 53
Table 51 ICD codes for Gestational Diabetes ........................................................................................ 61
Table 52 ICD codes for diabetes in pregnancy of unspecified onset .................................................... 62
Table 53 ICD codes for pregnancy with pre-existing diabetes .............................................................. 62
11
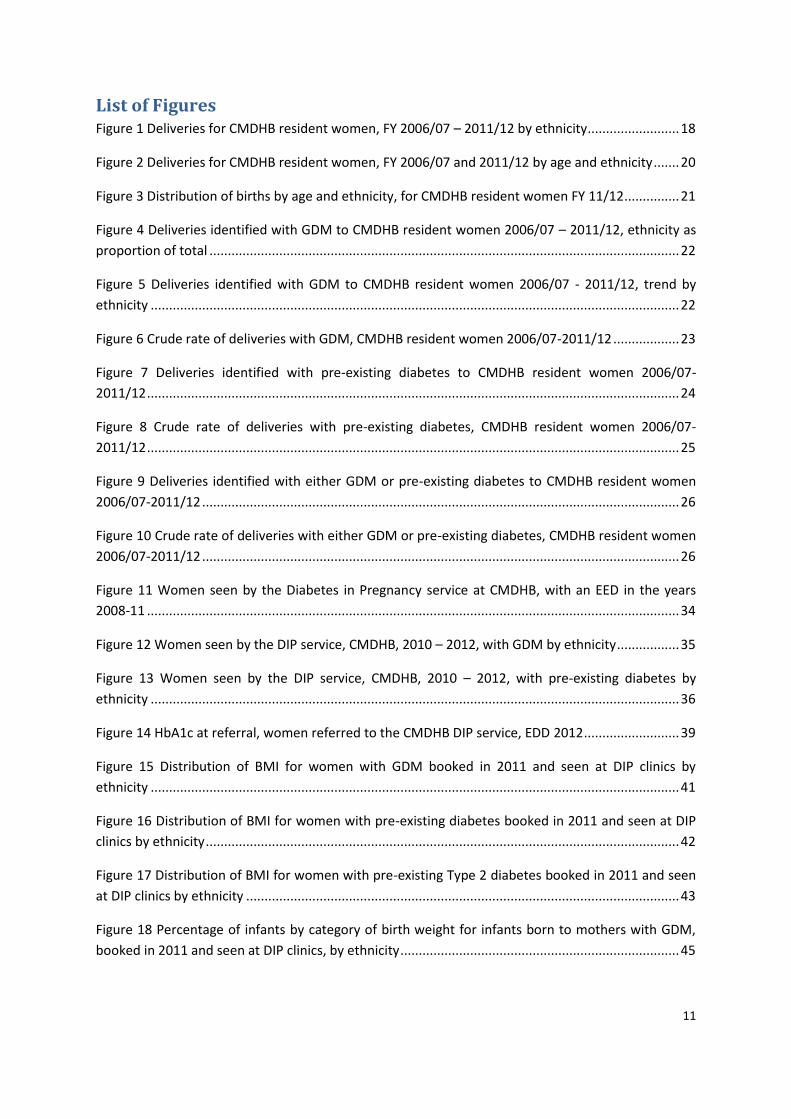
List of Figures Figure 1 Deliveries for CMDHB resident women, FY 2006/07 – 2011/12 by ethnicity ......................... 18
Figure 2 Deliveries for CMDHB resident women, FY 2006/07 and 2011/12 by age and ethnicity ....... 20
Figure 3 Distribution of births by age and ethnicity, for CMDHB resident women FY 11/12 ............... 21
Figure 4 Deliveries identified with GDM to CMDHB resident women 2006/07 – 2011/12, ethnicity as
proportion of total ................................................................................................................................ 22
Figure 5 Deliveries identified with GDM to CMDHB resident women 2006/07 - 2011/12, trend by
ethnicity ................................................................................................................................................ 22
Figure 6 Crude rate of deliveries with GDM, CMDHB resident women 2006/07-2011/12 .................. 23
Figure 7 Deliveries identified with pre-existing diabetes to CMDHB resident women 2006/07-
2011/12 ................................................................................................................................................. 24
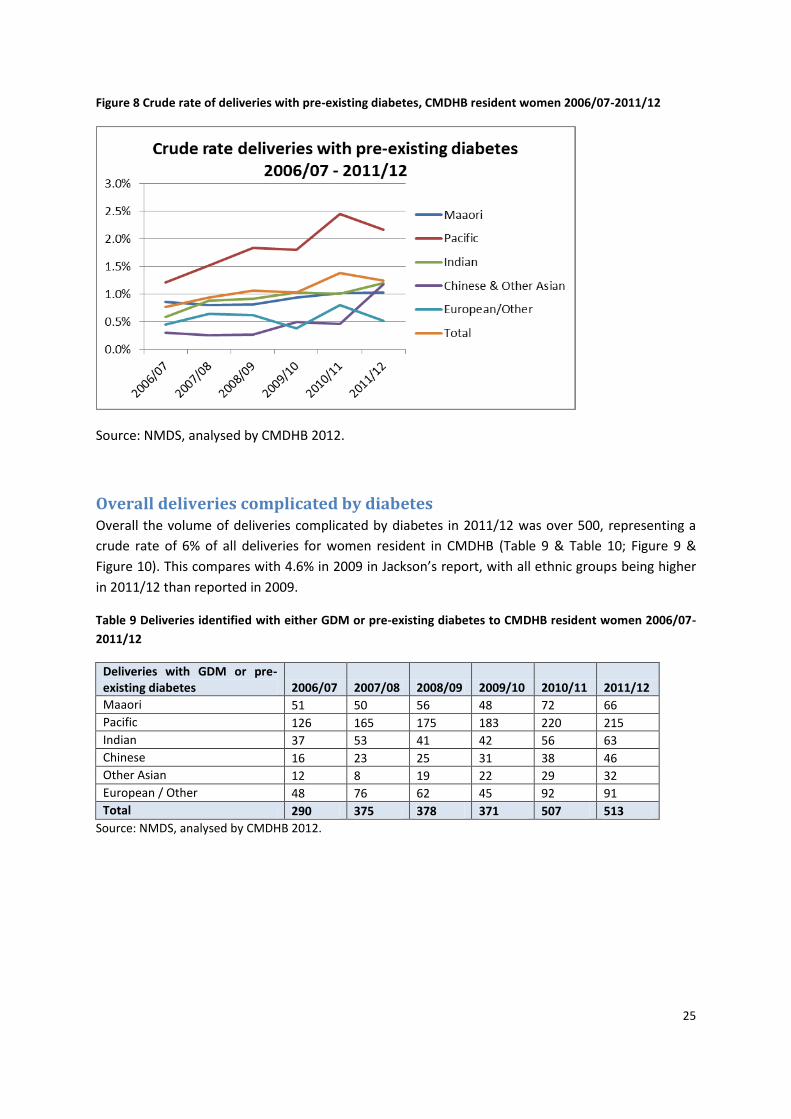
Figure 8 Crude rate of deliveries with pre-existing diabetes, CMDHB resident women 2006/07-
2011/12 ................................................................................................................................................. 25
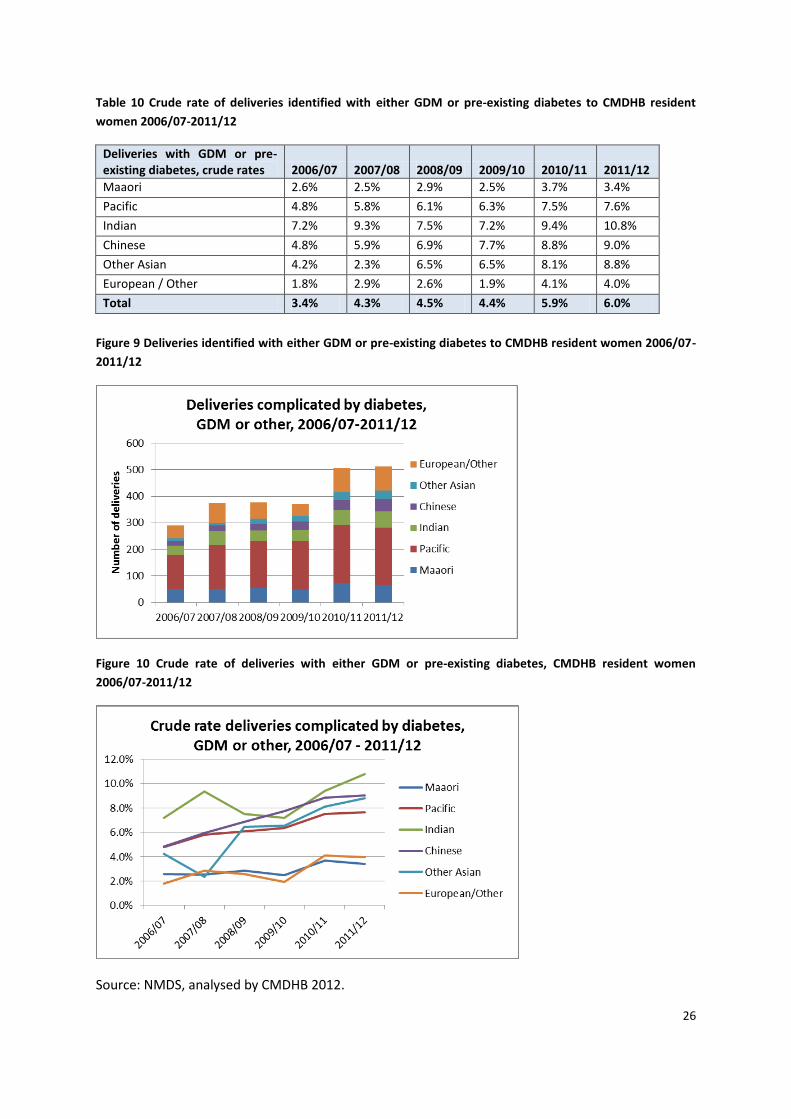
Figure 9 Deliveries identified with either GDM or pre-existing diabetes to CMDHB resident women
2006/07-2011/12 .................................................................................................................................. 26
Figure 10 Crude rate of deliveries with either GDM or pre-existing diabetes, CMDHB resident women
2006/07-2011/12 .................................................................................................................................. 26
Figure 11 Women seen by the Diabetes in Pregnancy service at CMDHB, with an EED in the years
2008-11 ................................................................................................................................................. 34
Figure 12 Women seen by the DIP service, CMDHB, 2010 – 2012, with GDM by ethnicity ................. 35
Figure 13 Women seen by the DIP service, CMDHB, 2010 – 2012, with pre-existing diabetes by
ethnicity ................................................................................................................................................ 36
Figure 14 HbA1c at referral, women referred to the CMDHB DIP service, EDD 2012 .......................... 39
Figure 15 Distribution of BMI for women with GDM booked in 2011 and seen at DIP clinics by
ethnicity ................................................................................................................................................ 41
Figure 16 Distribution of BMI for women with pre-existing diabetes booked in 2011 and seen at DIP
clinics by ethnicity ................................................................................................................................. 42
Figure 17 Distribution of BMI for women with pre-existing Type 2 diabetes booked in 2011 and seen
at DIP clinics by ethnicity ...................................................................................................................... 43
Figure 18 Percentage of infants by category of birth weight for infants born to mothers with GDM,
booked in 2011 and seen at DIP clinics, by ethnicity ............................................................................ 45

12
Figure 19 Percentage of infants by category of birth weight for infants born to mothers with pre-
existing diabetes, booked in 2011 and seen at DIP clinics, by ethnicity ............................................... 46
13
Introduction and purpose Diabetes in pregnancy, which includes both Gestational Diabetes and pre-existing diabetes,
represents a significant risk for poorer pregnancy outcomes and has implications for future health,
for both mother and baby.
There is increasing evidence that early life environmental factors influence the development of
chronic disease and obesity, with the period of importance being from embryo to early childhood.
The importance of addressing both prevention and management of diabetes in pregnancy is seen as
an integral part of influencing the peri-conceptual and in utero environments to prevent future ‘non-
communicable diseases’ (NCDs, including diabetes, CVD and cancer), and as such is strongly
promoted by the Prime Minister’s Chief Scientific Advisor, Professor Peter Gluckman (e.g. Gluckman
& Hanson, 2012). It is suggested that this emphasis on early life means it is still important to
encourage good nutrition and an active lifestyle for people of all ages, but an acceptance that
prevention efforts in adulthood may have limited success because of epigenetic factors which are
determined in early life (Hanson & Gluckman, 2011). This has been highlighted as part of the current
Population Health review in CMDHB.
In addition, the 2011 Perinatal Mortality in Counties Manukau report identified diabetes in
pregnancy as a significant factor contributing to the increased stillbirth rate in CMDHB (Jackson,
2011). The importance of diabetes in pregnancy was reiterated in the 2012 external review of
maternity services in CMDHB (Paterson et al, 2012).
Women who are older, those of non-Caucasian ethnicities and those who are obese are at increased
risk of both GDM and pre-existing diabetes (Wijayaratna, 2011). Concern has been expressed locally
and internationally about the increasing prevalence of diabetes in pregnancy. This paper attempts to
quantify that for CMDHB to better understand the ‘current state’ and inform future service planning.
It builds on three previous, relatively recent, local reports which gave some indication of local
epidemiology of diabetes in pregnancy based on information in health datasets:
- Smith J, Papa D, Jackson G (2008) Diabetes in CMDHB and the northern region: Estimation
using routinely collected data. Counties Manukau District Health Board.
- Wijayaratna A (2011) An overview of diabetes in pregnancy in the Counties Manukau District
Health Board area. Counties Manukau: Diabetes Projects Trust
- Jackson C (2011) Perinatal mortality in Counties Manukau. Counties Manukau District Health
Board.
The 2008 report of Smith et al identified 498 women with diagnosis codes for new diabetes in
pregnancy over a period of two years (2006-2007). 44% of these women were Pacific, 25% Asian,
15% Maaori and 17% European/Other ethnicities. Wijayaratna cited the work of Smith et al and also
noted the potential for increasing prevalence of diabetes in pregnancy due to the obesity rates and
ethnic mix of the CMDHB population. Jackson found a prevalence of gestational diabetes, pre-
existing diabetes, and/or previous gestational diabetes in pregnant women in CMDHB in 2009 of
4.6% (95% CI: 4.2-5.1) which was significantly higher than the national prevalence at 3.7% (95% CI:
3.5-3.8). She noted that the higher prevalence of pre-existing or gestational diabetes in CMDHB
14
women was driven by significantly higher rates than the New Zealand rates for CMDHB women aged
25-34 years and 35 years and older.
Historically there has also been concern expressed that clinical coding and information in the
hospital and national information systems does not accurately reflect the rates of diabetes in
pregnancy. However there has been work done to improve this and it is anticipated that various data
sources should now be more consistent.
This report summarises three pieces of work
analysis of encrypted, National Minimum Data Set records for deliveries for women resident in CMDHB,
analysis of records from the CMDHB Diabetes in Pregnancy service database, and
analysis of an extract from the DHB record system PIMS of information about patients booked and seen by at diabetes in pregnancy clinics at CMDHB.
The NMDS analysis includes two components, trends over the last six financial years (so as to include
the most current complete year of data), and a snapshot of the calendar year 2011, so as to try to
align with a calendar years’ worth of DIP service data.
Although there has not been work to formally match data, an attempt has been made to compare
the NMDS and DIP service data for 2011 to understand how well the information in the NMDS
currently correlates with the DIP service data for the CMDHB population. Using several different
sources of data was considered important to get a more robust picture of the current situation,
given it was initially unclear how well the different sources would align. Results were discussed with
leaders of the CMDHB Diabetes in Pregnancy service to consider the implications for service
planning and delivery. These aspects are further outlined in a discussion section on P 46.
15
Methods It is important to understand that the three pieces of work summarised in this paper each have
different ‘denominators’, populations of pregnant women whose health records are being analysed.
These are described further below. Note that for each denominator, it is the number of deliveries
rather than infants born that is being considered; because of multiple births, the number of infants
born is higher than then number of deliveries. Because this paper is about a maternal condition, it
focuses on the number of deliveries.
National Minimum Data Set analysis Data is entered into the NMDS retrospectively, after the utilisation event has taken place, so
deliveries are counted in the year in which they took place. For the trend analysis, records were
extracted for deliveries recorded for women resident in CMDHB in the National Minimum Data Set
(NMDS) in the last six financial years, 2006/07 – 2011/12, stratified by age and ethnicity.
Comparisons of volumes and rates across those six years assume the definition of gestational
diabetes has not changed across that time period. There has been a national group looking at the
diagnostic criteria for GDM for the past three years and it is likely there will be decisions made about
this in late 2013 which will affect future analysis of trends. Work by LabTests in 2010 suggested
proposed changes to diagnostic criteria could identify an additional 150 cases of GDM each year for
CMDHB women based on prevalence rates at that time. In 2009 the College of Midwives updated
their consensus statement about Gestational Diabetes in response to recommendations from the
National GDM Technical Working Part at the time (Simmons et al, 2008) and this may have raised
awareness among College members about screening and management implications related to
diabetes in pregnancy; this is pertinent for the analyses in this paper and that has been noted in the
relevant sections.
Recently there has been regional development of an algorithm to improve early identification of pre-
existing diabetes in pregnancy, which has been implemented in Waitemata and Auckland DHBs in
late 2010 but not yet in CMDHB. Analysis of the implications for CMDHB suggests implementation
could identify an additional 160-170 women with pre-existing diabetes in pregnancy from the
CMDHB population each year because of the high rate of risk factors such as obesity and non-
Caucasian ethnicities in the CMDHB population. It was planned to implement this algorithm in
CMDHB from the beginning of 2013 but instead it has been decided to wait until the release of the
Guidelines for screening, diagnosis and management of gestational diabetes in New Zealand, due to
be released in November 2013. This again will have implications for future analyses as well as service
planning. Current screening and diagnostic criteria used in CMDHB as described in Appendix One.
For the snapshot analysis, records were extracted for deliveries recorded for women resident in
CMDHB in the National Minimum Data Set (NMDS) in the 2011 calendar year, stratified by age,
ethnicity, and facility of delivery. Analysis by facility allows an analysis of how many of these women
would be expected to be under the care of the Diabetes in Pregnancy Service at CMDHB (those
booked to deliver at a CMDHB facility) and how many might be attending services in other DHBs
(primarily those booked to deliver at ADHB).
16
Delivery outside CMDHB is usually because of the DHB at which a woman’s Lead Maternity Carer has
an access agreement; a small number of women are referred to ADHB because of fetal anomalies.
Some women initially booked to deliver at CMDHB and registered with the DIP service at CMDHB
move residence during pregnancy and deliver at a non-CMDHB facility (personal communication,
Lesley MacLennan, Diabetes Midwife); this is discussed further under the methods section for
Diabetes in Pregnancy Service analysis below.
After comparison of the NMDS data for women resident in CMDHB with the numbers of women
referred to the CMDHB Diabetes in Pregnancy service at CMDHB, data was also extracted for women
delivering at CMDHB facilities who were resident in other DHBs; women with diabetes from this
group will also be seen by the CMDHB Diabetes in Pregnancy service.
Deliveries were identified as being complicated by Gestational Diabetes (GDM) if in the year of their
delivery record they had an ICD code ‘Diabetes arising in pregnancy’. These codes are detailed in
Table 51 Appendix One. Of note, traditionally GDM was seen as a condition usually arising in the
second trimester, secondary to acquired insulin resistance and resulting carbohydrate intolerance.
However current practice in the Auckland region and Australasia is for diabetes detected at any
stage of a pregnancy, where there is not a clear history of pre-existing diabetes, to be labelled as
‘Arising in pregnancy’ or GDM. This is important in relation to implementation of HbA1c at booking
for women at risk of diabetes as per the regional algorithm discussed above. Women with an HbA1c
elevated to the level suggesting diabetes, but without a pre-existing diagnosis will be labelled as
GDM, whereas in reality they most likely have pre-existing diabetes. The fact that ADHB and WDHB
have implemented the algorithm but CMDHB has not could be impacting differentially on the
number of women identified as having ‘GDM’ across the DHBs.
There were a small number of deliveries (1-9 per year) with an ICD code of diabetes in pregnancy
with unspecified onset (as per the ICD codes in Table 52 in Appendix Two). These were counted with
the GDM records.
Women with pre-existing diabetes were identified as those with the ICD codes for pre-existing
diabetes in pregnancy (as per Table 53 in Appendix Two) or diabetes as a stand-alone coded
diagnosis (ICD codes also in Table 53 in Appendix Two) in the year of their delivery, or some other
admission in the previous five years; i.e. pre-existing diabetes, recorded in relation to pregnancy or
some other admission in the last 5 years.
It is recognised that some women with GDM may have unrecognised pre-existing diabetes; these
women will be correctly reclassified postpartum with a postpartum OGTT or HbA1c, providing this is
actually undertaken. However this reclassification will not be captured in the NMDS, as the birth
event is coded within a week or two of mother’s discharge and not updated by a postpartum
diagnosis. This is a general limitation of NMDS data in relation to post-discharge diagnoses, not
limited to diabetes in pregnancy.
There were a small number of women who had both a code consistent with GDM at their recent
delivery, and a code indicating pre-existing diabetes. For this analysis these women have been
categorised as having pre-existing diabetes and subtracted from the GDM numbers.
17
Diabetes in Pregnancy Service analysis
The Diabetes in Pregnancy (DIP) service data is stored by Expected Date of Delivery (EDD) at referral.
The data extracted for 2012 included bookings up until early Oct (when the work on this report first
commenced) which means the majority of those who have an EDD in 2012 would be identified, but
there will be some further cases referred so the data needs to be considered incomplete.
Communication 7 November: A further 6 cases have been referred since the data was extracted and
another two or so cases could be expected before the end of the year based on previous years’
referrals.
As noted previously, some women who are initially booked to deliver at CMDHB and registered with
the DIP service at CMDHB
move residence during pregnancy and deliver at a non-CMDHB facility
come under the care of an LMC who has an access agreement at another DHB so change to
the DIP service and deliver at another DHB
are transferred to ADHB because of fetal anomalies
miscarry after being seen in early pregnancy.
Women referred to the CMDHB DIP service in 2011 and coming under these categories totalled 28 in
2011.
Occasionally women deliver at home or on route to the hospital who have been under the care of
the DIP service; these women would be recorded as having an unplanned home birth, and
discharged from the hospital they were booked at, so would be coded as having diabetes in
pregnancy.
Data was extracted by Lesley MacLennan, Diabetes Midwife. Ethnicity recording in the DIP service
database prior to 2010 is not comparable with current data so figures for 2010 – 2012 were
extracted, stratified by GDM or pre-existing diabetes and ethnicity.
A spreadsheet was also available from Fawsia Saleem, Decision Support analyst for women’s health,
detailing diagnosis (GDM or other), ethnicity, age, BMI (not complete), mode of delivery and infant
birth weight for women booked between January and December 2011 who had diabetes clinic visits.
18
Trends over time
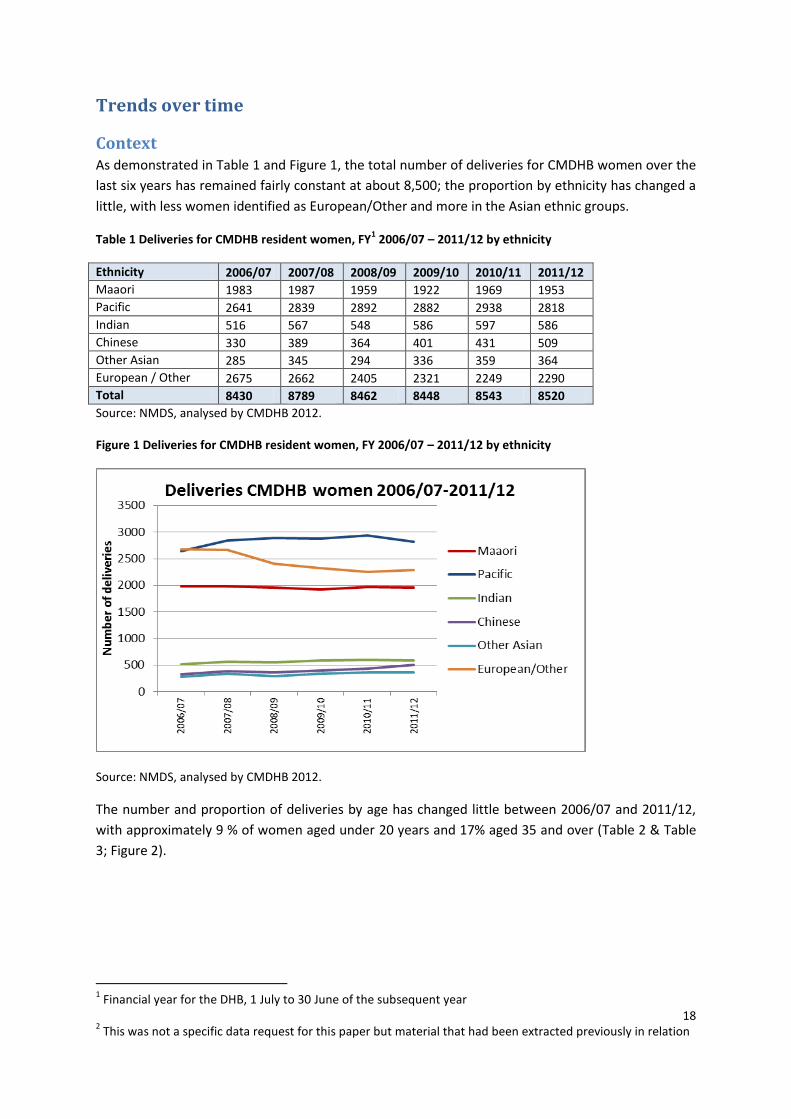
Context As demonstrated in Table 1 and Figure 1, the total number of deliveries for CMDHB women over the
last six years has remained fairly constant at about 8,500; the proportion by ethnicity has changed a
little, with less women identified as European/Other and more in the Asian ethnic groups.
Table 1 Deliveries for CMDHB resident women, FY1 2006/07 – 2011/12 by ethnicity
Ethnicity 2006/07 2007/08 2008/09 2009/10 2010/11 2011/12
Maaori 1983 1987 1959 1922 1969 1953
Pacific 2641 2839 2892 2882 2938 2818
Indian 516 567 548 586 597 586
Chinese 330 389 364 401 431 509
Other Asian 285 345 294 336 359 364
European / Other 2675 2662 2405 2321 2249 2290
Total 8430 8789 8462 8448 8543 8520
Source: NMDS, analysed by CMDHB 2012.
Figure 1 Deliveries for CMDHB resident women, FY 2006/07 – 2011/12 by ethnicity
Source: NMDS, analysed by CMDHB 2012.
The number and proportion of deliveries by age has changed little between 2006/07 and 2011/12,
with approximately 9 % of women aged under 20 years and 17% aged 35 and over (Table 2 & Table
3; Figure 2).
1 Financial year for the DHB, 1 July to 30 June of the subsequent year
2 This was not a specific data request for this paper but material that had been extracted previously in relation
19
Table 2 Deliveries for CMDHB resident women, FY 2006/07 by age and ethnicity
Deliveries for CMDHB resident women
< 20 20-24 25-29 30-34 35-39 40 and over
Total Ethnicity as % of total deliveries
Maaori 407 557 480 319 181 39 1983 23.5%
Pacific 222 697 730 576 329 87 2641 31.3%
Indian 8 117 211 136 38 6 516 6.1%
Chinese 5 42 89 108 60 26 330 3.9%
Other Asian 11 52 89 72 41 20 285 3.4%
European / Other 144 353 635 896 545 102 2675 31.7%
Total 797 1818 2234 2107 1194 280 8430
Age group as % of total deliveries 9.5% 21.6% 26.5% 25.0% 14.2% 3.3%
Source: NMDS, analysed by CMDHB 2012.
Table 3 Deliveries for CMDHB resident women, FY 2011/12 by age and ethnicity
Deliveries for CMDHB resident women
< 20 20-24 25-29 30-34 35-39 40 and over
Total Ethnicity as % of total deliveries
Maaori 338 677 436 284 161 57 1953 22.9%
Pacific 273 757 736 592 335 125 2818 33.1%
Indian 12 88 229 175 71 11 586 6.9%
Chinese 4 41 184 180 76 24 509 6.0%
Other Asian 8 34 117 129 59 17 364 4.3%
European / Other 96 317 580 743 456 98 2290 26.9%
Total 731 1914 2282 2103 1158 332 8520
Age group as % of total deliveries 8.6% 22.5% 26.8% 24.7% 13.6% 3.9%
Source: NMDS, analysed by CMDHB 2012.
20
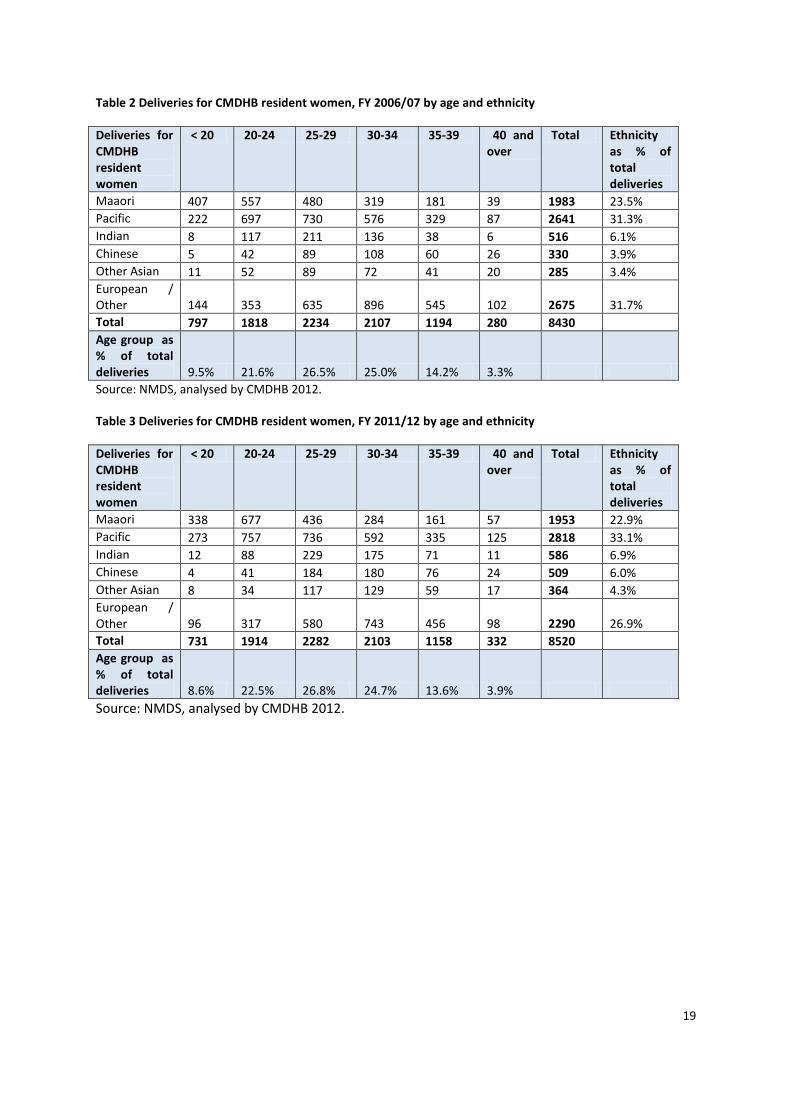
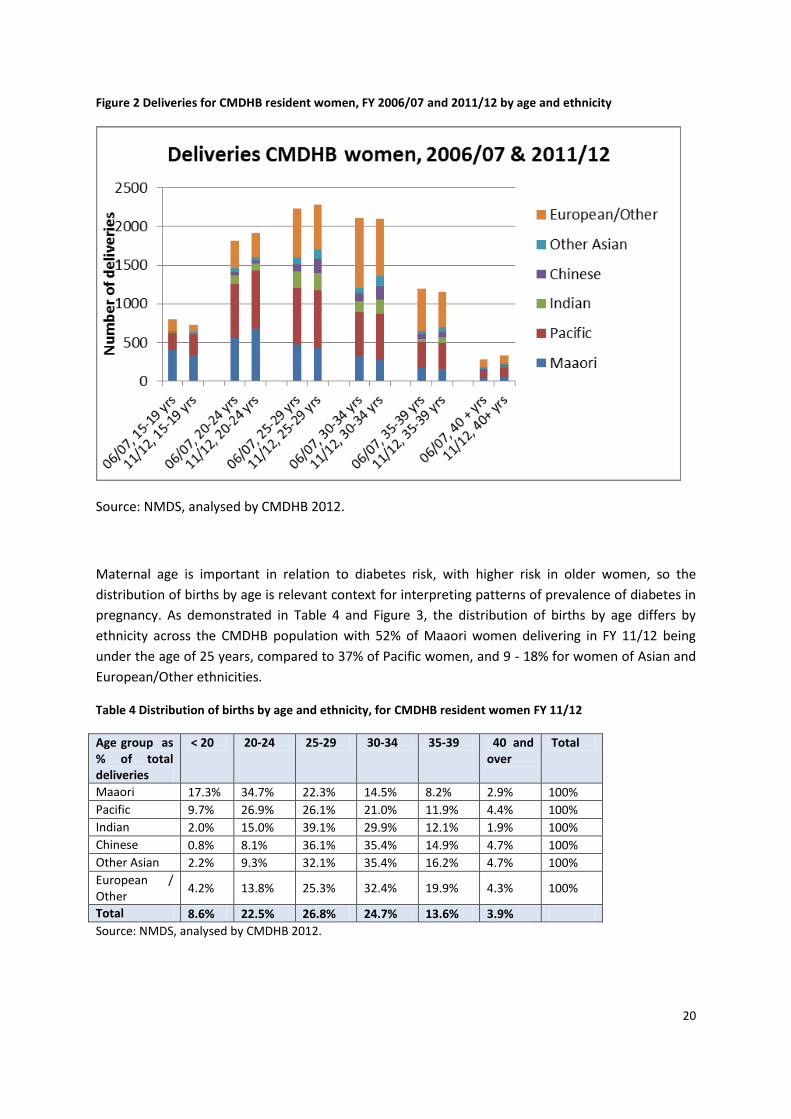
Figure 2 Deliveries for CMDHB resident women, FY 2006/07 and 2011/12 by age and ethnicity
Source: NMDS, analysed by CMDHB 2012.
Maternal age is important in relation to diabetes risk, with higher risk in older women, so the
distribution of births by age is relevant context for interpreting patterns of prevalence of diabetes in
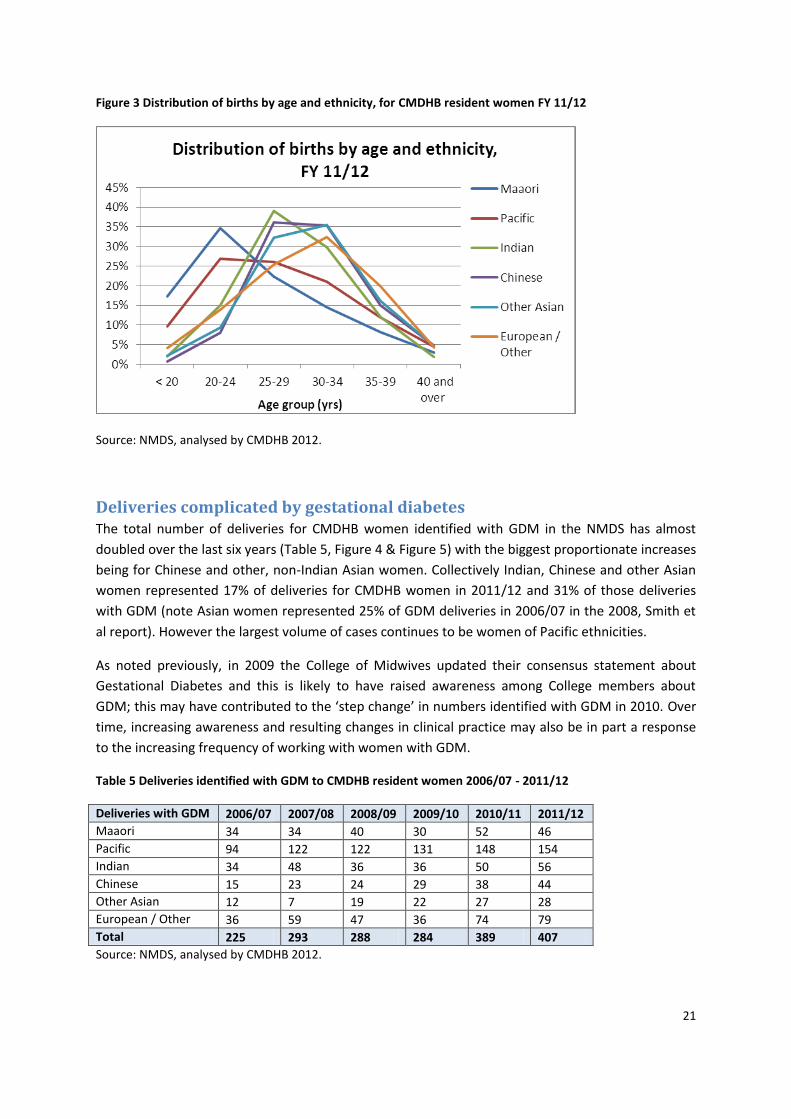
pregnancy. As demonstrated in Table 4 and Figure 3, the distribution of births by age differs by
ethnicity across the CMDHB population with 52% of Maaori women delivering in FY 11/12 being
under the age of 25 years, compared to 37% of Pacific women, and 9 - 18% for women of Asian and
European/Other ethnicities.
Table 4 Distribution of births by age and ethnicity, for CMDHB resident women FY 11/12
Age group as % of total deliveries
< 20 20-24 25-29 30-34 35-39 40 and over
Total
Maaori 17.3% 34.7% 22.3% 14.5% 8.2% 2.9% 100%
Pacific 9.7% 26.9% 26.1% 21.0% 11.9% 4.4% 100%
Indian 2.0% 15.0% 39.1% 29.9% 12.1% 1.9% 100%
Chinese 0.8% 8.1% 36.1% 35.4% 14.9% 4.7% 100%
Other Asian 2.2% 9.3% 32.1% 35.4% 16.2% 4.7% 100%
European / Other
4.2% 13.8% 25.3% 32.4% 19.9% 4.3% 100%
Total 8.6% 22.5% 26.8% 24.7% 13.6% 3.9%
Source: NMDS, analysed by CMDHB 2012.
21
Figure 3 Distribution of births by age and ethnicity, for CMDHB resident women FY 11/12
Source: NMDS, analysed by CMDHB 2012.
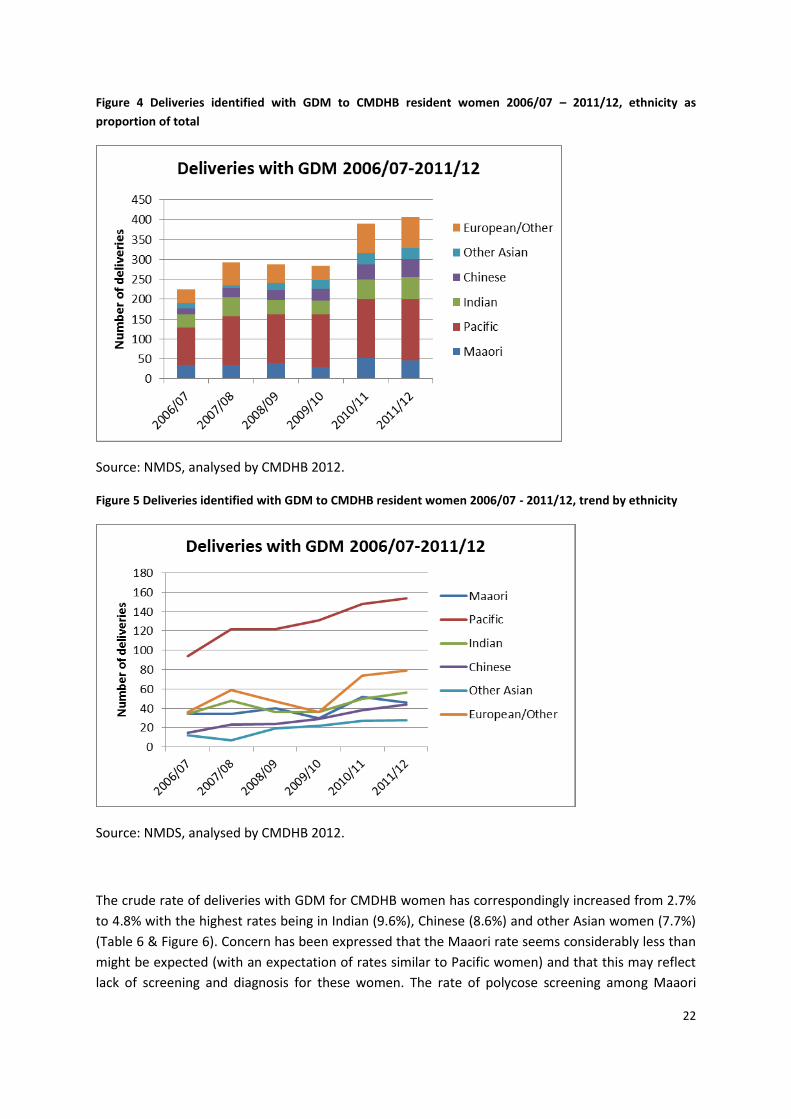
Deliveries complicated by gestational diabetes The total number of deliveries for CMDHB women identified with GDM in the NMDS has almost
doubled over the last six years (Table 5, Figure 4 & Figure 5) with the biggest proportionate increases
being for Chinese and other, non-Indian Asian women. Collectively Indian, Chinese and other Asian
women represented 17% of deliveries for CMDHB women in 2011/12 and 31% of those deliveries
with GDM (note Asian women represented 25% of GDM deliveries in 2006/07 in the 2008, Smith et
al report). However the largest volume of cases continues to be women of Pacific ethnicities.
As noted previously, in 2009 the College of Midwives updated their consensus statement about
Gestational Diabetes and this is likely to have raised awareness among College members about
GDM; this may have contributed to the ‘step change’ in numbers identified with GDM in 2010. Over
time, increasing awareness and resulting changes in clinical practice may also be in part a response
to the increasing frequency of working with women with GDM.
Table 5 Deliveries identified with GDM to CMDHB resident women 2006/07 - 2011/12
Deliveries with GDM 2006/07 2007/08 2008/09 2009/10 2010/11 2011/12
Maaori 34 34 40 30 52 46
Pacific 94 122 122 131 148 154
Indian 34 48 36 36 50 56
Chinese 15 23 24 29 38 44
Other Asian 12 7 19 22 27 28
European / Other 36 59 47 36 74 79
Total 225 293 288 284 389 407
Source: NMDS, analysed by CMDHB 2012.
22
Figure 4 Deliveries identified with GDM to CMDHB resident women 2006/07 – 2011/12, ethnicity as
proportion of total
Source: NMDS, analysed by CMDHB 2012.
Figure 5 Deliveries identified with GDM to CMDHB resident women 2006/07 - 2011/12, trend by ethnicity
Source: NMDS, analysed by CMDHB 2012.
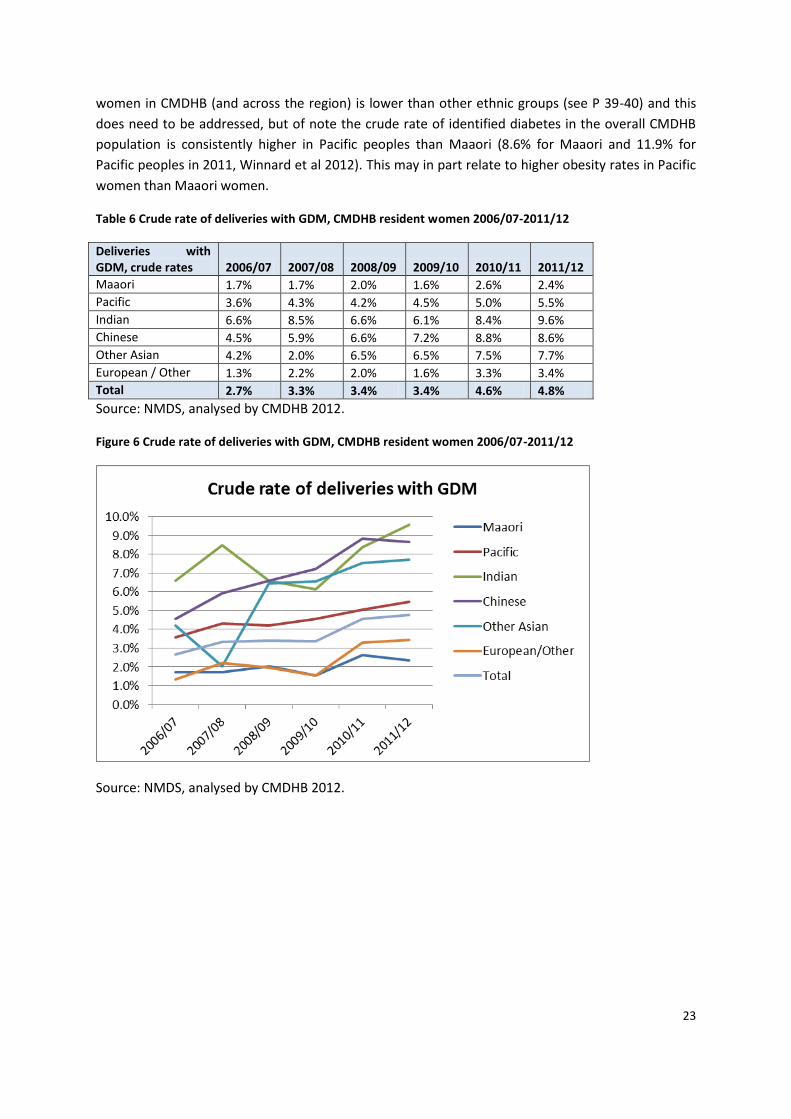
The crude rate of deliveries with GDM for CMDHB women has correspondingly increased from 2.7%
to 4.8% with the highest rates being in Indian (9.6%), Chinese (8.6%) and other Asian women (7.7%)
(Table 6 & Figure 6). Concern has been expressed that the Maaori rate seems considerably less than
might be expected (with an expectation of rates similar to Pacific women) and that this may reflect
lack of screening and diagnosis for these women. The rate of polycose screening among Maaori
23
women in CMDHB (and across the region) is lower than other ethnic groups (see P 39-40) and this
does need to be addressed, but of note the crude rate of identified diabetes in the overall CMDHB
population is consistently higher in Pacific peoples than Maaori (8.6% for Maaori and 11.9% for
Pacific peoples in 2011, Winnard et al 2012). This may in part relate to higher obesity rates in Pacific
women than Maaori women.
Table 6 Crude rate of deliveries with GDM, CMDHB resident women 2006/07-2011/12
Deliveries with GDM, crude rates 2006/07 2007/08 2008/09 2009/10 2010/11 2011/12
Maaori 1.7% 1.7% 2.0% 1.6% 2.6% 2.4%
Pacific 3.6% 4.3% 4.2% 4.5% 5.0% 5.5%
Indian 6.6% 8.5% 6.6% 6.1% 8.4% 9.6%
Chinese 4.5% 5.9% 6.6% 7.2% 8.8% 8.6%
Other Asian 4.2% 2.0% 6.5% 6.5% 7.5% 7.7%
European / Other 1.3% 2.2% 2.0% 1.6% 3.3% 3.4%
Total 2.7% 3.3% 3.4% 3.4% 4.6% 4.8%
Source: NMDS, analysed by CMDHB 2012.
Figure 6 Crude rate of deliveries with GDM, CMDHB resident women 2006/07-2011/12
Source: NMDS, analysed by CMDHB 2012.
24
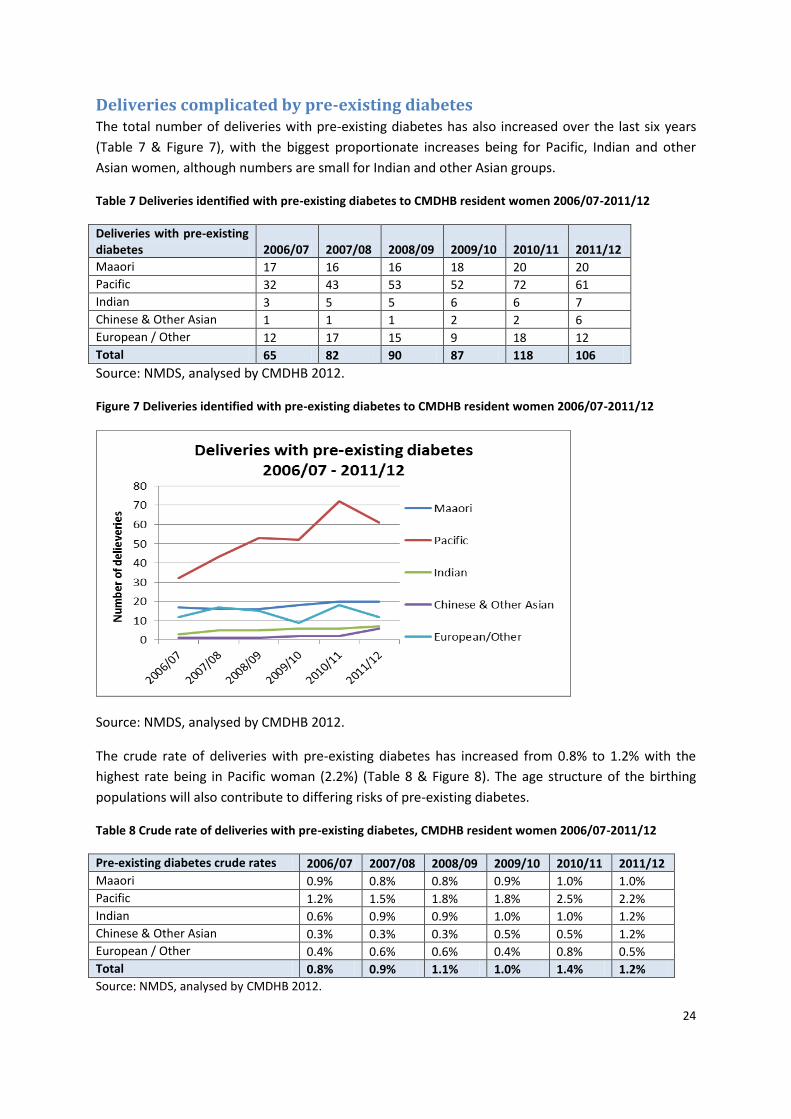
Deliveries complicated by pre-existing diabetes The total number of deliveries with pre-existing diabetes has also increased over the last six years
(Table 7 & Figure 7), with the biggest proportionate increases being for Pacific, Indian and other
Asian women, although numbers are small for Indian and other Asian groups.
Table 7 Deliveries identified with pre-existing diabetes to CMDHB resident women 2006/07-2011/12
Deliveries with pre-existing diabetes 2006/07 2007/08 2008/09 2009/10 2010/11 2011/12
Maaori 17 16 16 18 20 20
Pacific 32 43 53 52 72 61
Indian 3 5 5 6 6 7
Chinese & Other Asian 1 1 1 2 2 6
European / Other 12 17 15 9 18 12
Total 65 82 90 87 118 106
Source: NMDS, analysed by CMDHB 2012.
Figure 7 Deliveries identified with pre-existing diabetes to CMDHB resident women 2006/07-2011/12
Source: NMDS, analysed by CMDHB 2012.
The crude rate of deliveries with pre-existing diabetes has increased from 0.8% to 1.2% with the
highest rate being in Pacific woman (2.2%) (Table 8 & Figure 8). The age structure of the birthing
populations will also contribute to differing risks of pre-existing diabetes.
Table 8 Crude rate of deliveries with pre-existing diabetes, CMDHB resident women 2006/07-2011/12
Pre-existing diabetes crude rates 2006/07 2007/08 2008/09 2009/10 2010/11 2011/12
Maaori 0.9% 0.8% 0.8% 0.9% 1.0% 1.0%
Pacific 1.2% 1.5% 1.8% 1.8% 2.5% 2.2%
Indian 0.6% 0.9% 0.9% 1.0% 1.0% 1.2%
Chinese & Other Asian 0.3% 0.3% 0.3% 0.5% 0.5% 1.2%
European / Other 0.4% 0.6% 0.6% 0.4% 0.8% 0.5%
Total 0.8% 0.9% 1.1% 1.0% 1.4% 1.2%
Source: NMDS, analysed by CMDHB 2012.
25
Figure 8 Crude rate of deliveries with pre-existing diabetes, CMDHB resident women 2006/07-2011/12
Source: NMDS, analysed by CMDHB 2012.
Overall deliveries complicated by diabetes Overall the volume of deliveries complicated by diabetes in 2011/12 was over 500, representing a
crude rate of 6% of all deliveries for women resident in CMDHB (Table 9 & Table 10; Figure 9 &
Figure 10). This compares with 4.6% in 2009 in Jackson’s report, with all ethnic groups being higher
in 2011/12 than reported in 2009.
Table 9 Deliveries identified with either GDM or pre-existing diabetes to CMDHB resident women 2006/07-
2011/12
Deliveries with GDM or pre-existing diabetes 2006/07 2007/08 2008/09 2009/10 2010/11 2011/12
Maaori 51 50 56 48 72 66
Pacific 126 165 175 183 220 215
Indian 37 53 41 42 56 63
Chinese 16 23 25 31 38 46
Other Asian 12 8 19 22 29 32
European / Other 48 76 62 45 92 91
Total 290 375 378 371 507 513
Source: NMDS, analysed by CMDHB 2012.
26
Table 10 Crude rate of deliveries identified with either GDM or pre-existing diabetes to CMDHB resident
women 2006/07-2011/12
Deliveries with GDM or pre-existing diabetes, crude rates 2006/07 2007/08 2008/09 2009/10 2010/11 2011/12
Maaori 2.6% 2.5% 2.9% 2.5% 3.7% 3.4%
Pacific 4.8% 5.8% 6.1% 6.3% 7.5% 7.6%
Indian 7.2% 9.3% 7.5% 7.2% 9.4% 10.8%
Chinese 4.8% 5.9% 6.9% 7.7% 8.8% 9.0%
Other Asian 4.2% 2.3% 6.5% 6.5% 8.1% 8.8%
European / Other 1.8% 2.9% 2.6% 1.9% 4.1% 4.0%
Total 3.4% 4.3% 4.5% 4.4% 5.9% 6.0%
Figure 9 Deliveries identified with either GDM or pre-existing diabetes to CMDHB resident women 2006/07-
2011/12
Figure 10 Crude rate of deliveries with either GDM or pre-existing diabetes, CMDHB resident women
2006/07-2011/12
Source: NMDS, analysed by CMDHB 2012.
27
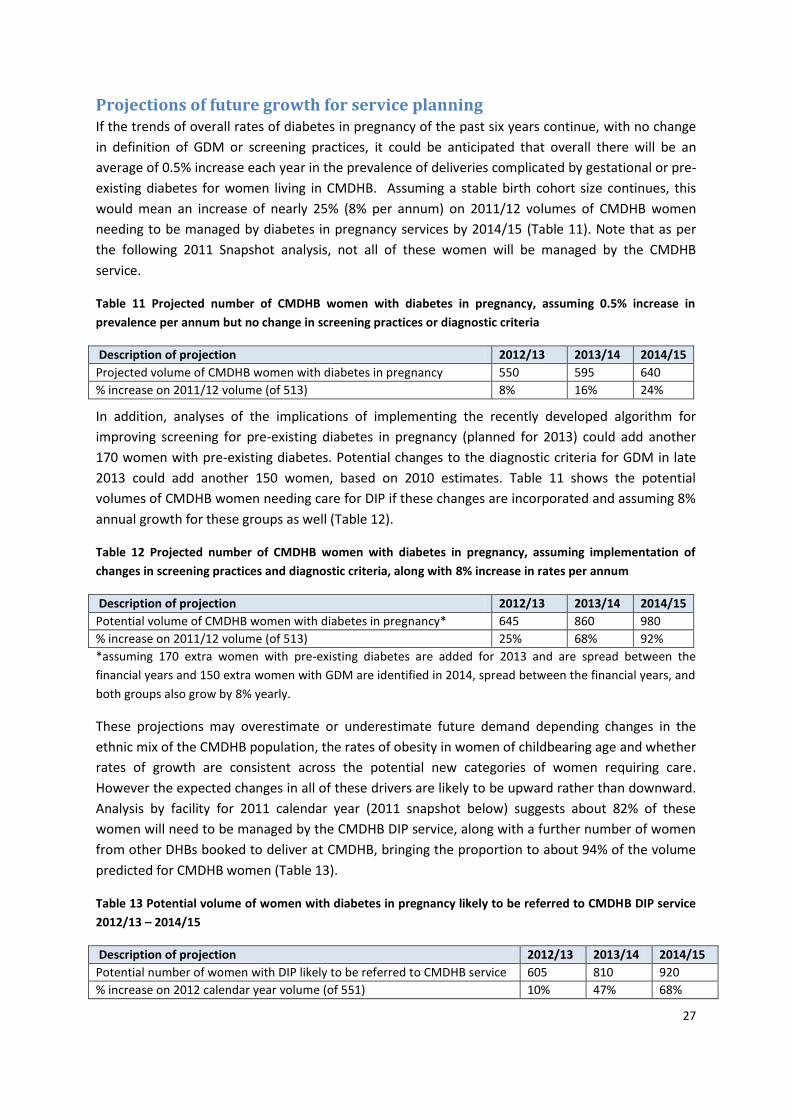
Projections of future growth for service planning If the trends of overall rates of diabetes in pregnancy of the past six years continue, with no change
in definition of GDM or screening practices, it could be anticipated that overall there will be an
average of 0.5% increase each year in the prevalence of deliveries complicated by gestational or pre-
existing diabetes for women living in CMDHB. Assuming a stable birth cohort size continues, this
would mean an increase of nearly 25% (8% per annum) on 2011/12 volumes of CMDHB women
needing to be managed by diabetes in pregnancy services by 2014/15 (Table 11). Note that as per
the following 2011 Snapshot analysis, not all of these women will be managed by the CMDHB
service.
Table 11 Projected number of CMDHB women with diabetes in pregnancy, assuming 0.5% increase in
prevalence per annum but no change in screening practices or diagnostic criteria
Description of projection 2012/13 2013/14 2014/15
Projected volume of CMDHB women with diabetes in pregnancy 550 595 640
% increase on 2011/12 volume (of 513) 8% 16% 24%
In addition, analyses of the implications of implementing the recently developed algorithm for
improving screening for pre-existing diabetes in pregnancy (planned for 2013) could add another
170 women with pre-existing diabetes. Potential changes to the diagnostic criteria for GDM in late
2013 could add another 150 women, based on 2010 estimates. Table 11 shows the potential
volumes of CMDHB women needing care for DIP if these changes are incorporated and assuming 8%
annual growth for these groups as well (Table 12).
Table 12 Projected number of CMDHB women with diabetes in pregnancy, assuming implementation of
changes in screening practices and diagnostic criteria, along with 8% increase in rates per annum
Description of projection 2012/13 2013/14 2014/15
Potential volume of CMDHB women with diabetes in pregnancy* 645 860 980
% increase on 2011/12 volume (of 513) 25% 68% 92%
*assuming 170 extra women with pre-existing diabetes are added for 2013 and are spread between the
financial years and 150 extra women with GDM are identified in 2014, spread between the financial years, and
both groups also grow by 8% yearly.
These projections may overestimate or underestimate future demand depending changes in the
ethnic mix of the CMDHB population, the rates of obesity in women of childbearing age and whether
rates of growth are consistent across the potential new categories of women requiring care.
However the expected changes in all of these drivers are likely to be upward rather than downward.
Analysis by facility for 2011 calendar year (2011 snapshot below) suggests about 82% of these
women will need to be managed by the CMDHB DIP service, along with a further number of women
from other DHBs booked to deliver at CMDHB, bringing the proportion to about 94% of the volume
predicted for CMDHB women (Table 13).
Table 13 Potential volume of women with diabetes in pregnancy likely to be referred to CMDHB DIP service
2012/13 – 2014/15
Description of projection 2012/13 2013/14 2014/15
Potential number of women with DIP likely to be referred to CMDHB service 605 810 920
% increase on 2012 calendar year volume (of 551) 10% 47% 68%
28
2011 Snapshot (based on NMDS)
As previously noted, records were extracted from the NMDS for deliveries recorded in the 2011
calendar year for women resident in CMDHB and were analysed by facility as well as age and
ethnicity, to allow an analysis of how many of these women would be expected to be under the care
of the Diabetes in Pregnancy Service at CMDHB/ Middlemore Hospital.
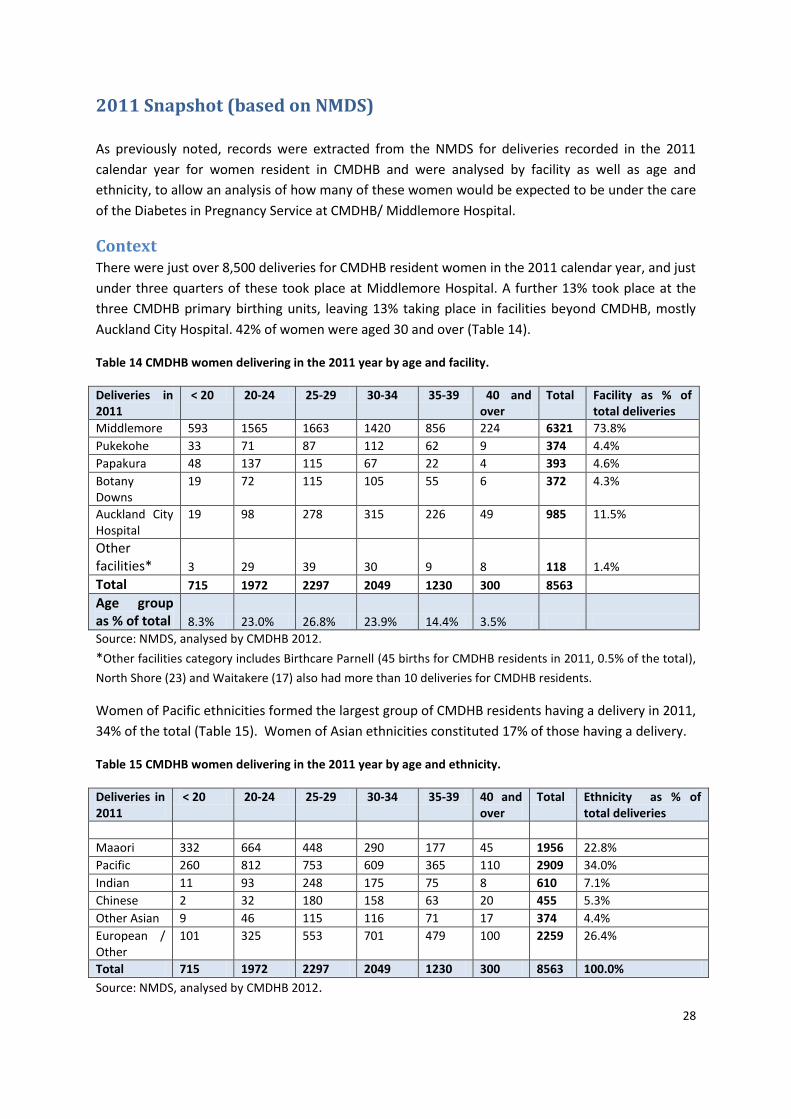
Context There were just over 8,500 deliveries for CMDHB resident women in the 2011 calendar year, and just
under three quarters of these took place at Middlemore Hospital. A further 13% took place at the
three CMDHB primary birthing units, leaving 13% taking place in facilities beyond CMDHB, mostly
Auckland City Hospital. 42% of women were aged 30 and over (Table 14).
Table 14 CMDHB women delivering in the 2011 year by age and facility.
Deliveries in 2011
< 20 20-24 25-29 30-34 35-39 40 and over
Total Facility as % of total deliveries
Middlemore 593 1565 1663 1420 856 224 6321 73.8%
Pukekohe 33 71 87 112 62 9 374 4.4%
Papakura 48 137 115 67 22 4 393 4.6%
Botany Downs
19 72 115 105 55 6 372 4.3%
Auckland City Hospital
19 98 278 315 226 49 985 11.5%
Other facilities* 3 29 39 30 9 8 118 1.4%
Total 715 1972 2297 2049 1230 300 8563
Age group as % of total 8.3% 23.0% 26.8% 23.9% 14.4% 3.5%
Source: NMDS, analysed by CMDHB 2012.
*Other facilities category includes Birthcare Parnell (45 births for CMDHB residents in 2011, 0.5% of the total),
North Shore (23) and Waitakere (17) also had more than 10 deliveries for CMDHB residents.
Women of Pacific ethnicities formed the largest group of CMDHB residents having a delivery in 2011,
34% of the total (Table 15). Women of Asian ethnicities constituted 17% of those having a delivery.
Table 15 CMDHB women delivering in the 2011 year by age and ethnicity.
Deliveries in 2011
< 20 20-24 25-29 30-34 35-39 40 and over
Total Ethnicity as % of total deliveries
Maaori 332 664 448 290 177 45 1956 22.8%
Pacific 260 812 753 609 365 110 2909 34.0%
Indian 11 93 248 175 75 8 610 7.1%
Chinese 2 32 180 158 63 20 455 5.3%
Other Asian 9 46 115 116 71 17 374 4.4%
European / Other
101 325 553 701 479 100 2259 26.4%
Total 715 1972 2297 2049 1230 300 8563 100.0%
Source: NMDS, analysed by CMDHB 2012.
29
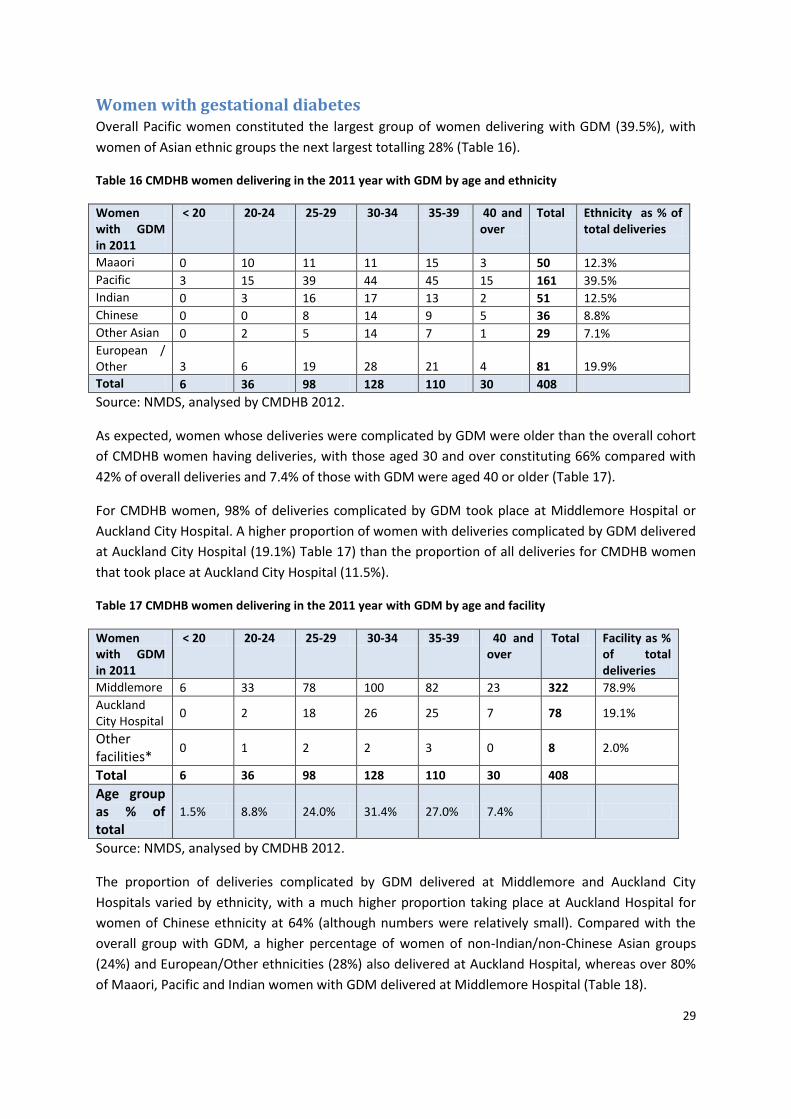
Women with gestational diabetes Overall Pacific women constituted the largest group of women delivering with GDM (39.5%), with
women of Asian ethnic groups the next largest totalling 28% (Table 16).
Table 16 CMDHB women delivering in the 2011 year with GDM by age and ethnicity
Women with GDM in 2011
< 20 20-24 25-29 30-34 35-39 40 and over
Total Ethnicity as % of total deliveries
Maaori 0 10 11 11 15 3 50 12.3%
Pacific 3 15 39 44 45 15 161 39.5%
Indian 0 3 16 17 13 2 51 12.5%
Chinese 0 0 8 14 9 5 36 8.8%
Other Asian 0 2 5 14 7 1 29 7.1%
European / Other 3 6 19 28 21 4 81 19.9%
Total 6 36 98 128 110 30 408
Source: NMDS, analysed by CMDHB 2012.
As expected, women whose deliveries were complicated by GDM were older than the overall cohort
of CMDHB women having deliveries, with those aged 30 and over constituting 66% compared with
42% of overall deliveries and 7.4% of those with GDM were aged 40 or older (Table 17).
For CMDHB women, 98% of deliveries complicated by GDM took place at Middlemore Hospital or
Auckland City Hospital. A higher proportion of women with deliveries complicated by GDM delivered
at Auckland City Hospital (19.1%) Table 17) than the proportion of all deliveries for CMDHB women
that took place at Auckland City Hospital (11.5%).
Table 17 CMDHB women delivering in the 2011 year with GDM by age and facility
Women with GDM in 2011
< 20 20-24 25-29 30-34 35-39 40 and over
Total Facility as % of total deliveries
Middlemore 6 33 78 100 82 23 322 78.9%
Auckland City Hospital
0 2 18 26 25 7 78 19.1%
Other facilities*
0 1 2 2 3 0 8 2.0%
Total 6 36 98 128 110 30 408
Age group as % of total
1.5% 8.8% 24.0% 31.4% 27.0% 7.4%
Source: NMDS, analysed by CMDHB 2012.
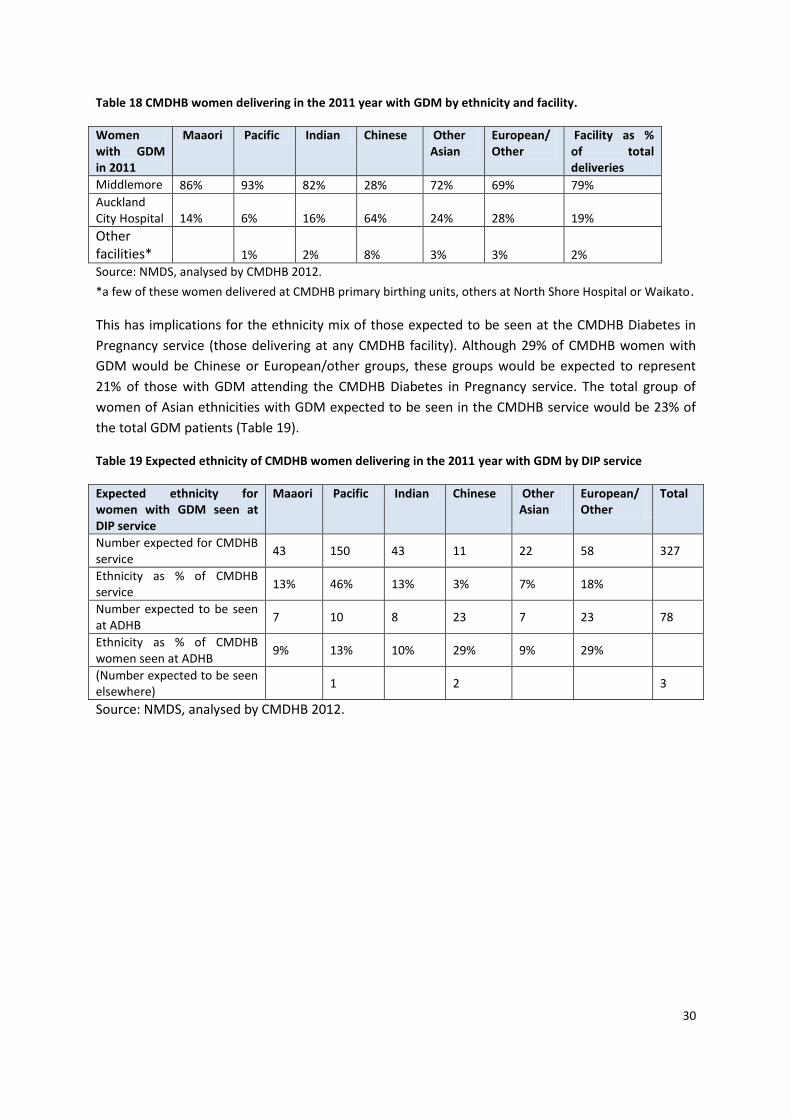
The proportion of deliveries complicated by GDM delivered at Middlemore and Auckland City
Hospitals varied by ethnicity, with a much higher proportion taking place at Auckland Hospital for
women of Chinese ethnicity at 64% (although numbers were relatively small). Compared with the
overall group with GDM, a higher percentage of women of non-Indian/non-Chinese Asian groups
(24%) and European/Other ethnicities (28%) also delivered at Auckland Hospital, whereas over 80%
of Maaori, Pacific and Indian women with GDM delivered at Middlemore Hospital (Table 18).
30
Table 18 CMDHB women delivering in the 2011 year with GDM by ethnicity and facility.
Women with GDM in 2011
Maaori Pacific Indian Chinese Other Asian
European/ Other
Facility as % of total deliveries
Middlemore 86% 93% 82% 28% 72% 69% 79%
Auckland City Hospital 14% 6% 16% 64% 24% 28% 19%
Other facilities* 1% 2% 8% 3% 3% 2%
Source: NMDS, analysed by CMDHB 2012.
*a few of these women delivered at CMDHB primary birthing units, others at North Shore Hospital or Waikato.
This has implications for the ethnicity mix of those expected to be seen at the CMDHB Diabetes in
Pregnancy service (those delivering at any CMDHB facility). Although 29% of CMDHB women with
GDM would be Chinese or European/other groups, these groups would be expected to represent
21% of those with GDM attending the CMDHB Diabetes in Pregnancy service. The total group of
women of Asian ethnicities with GDM expected to be seen in the CMDHB service would be 23% of
the total GDM patients (Table 19).
Table 19 Expected ethnicity of CMDHB women delivering in the 2011 year with GDM by DIP service
Expected ethnicity for women with GDM seen at DIP service
Maaori Pacific Indian Chinese Other Asian
European/ Other
Total
Number expected for CMDHB service
43 150 43 11 22 58 327
Ethnicity as % of CMDHB service
13% 46% 13% 3% 7% 18%
Number expected to be seen at ADHB
7 10 8 23 7 23 78
Ethnicity as % of CMDHB women seen at ADHB
9% 13% 10% 29% 9% 29%
(Number expected to be seen elsewhere)
1 2 3
Source: NMDS, analysed by CMDHB 2012.
31
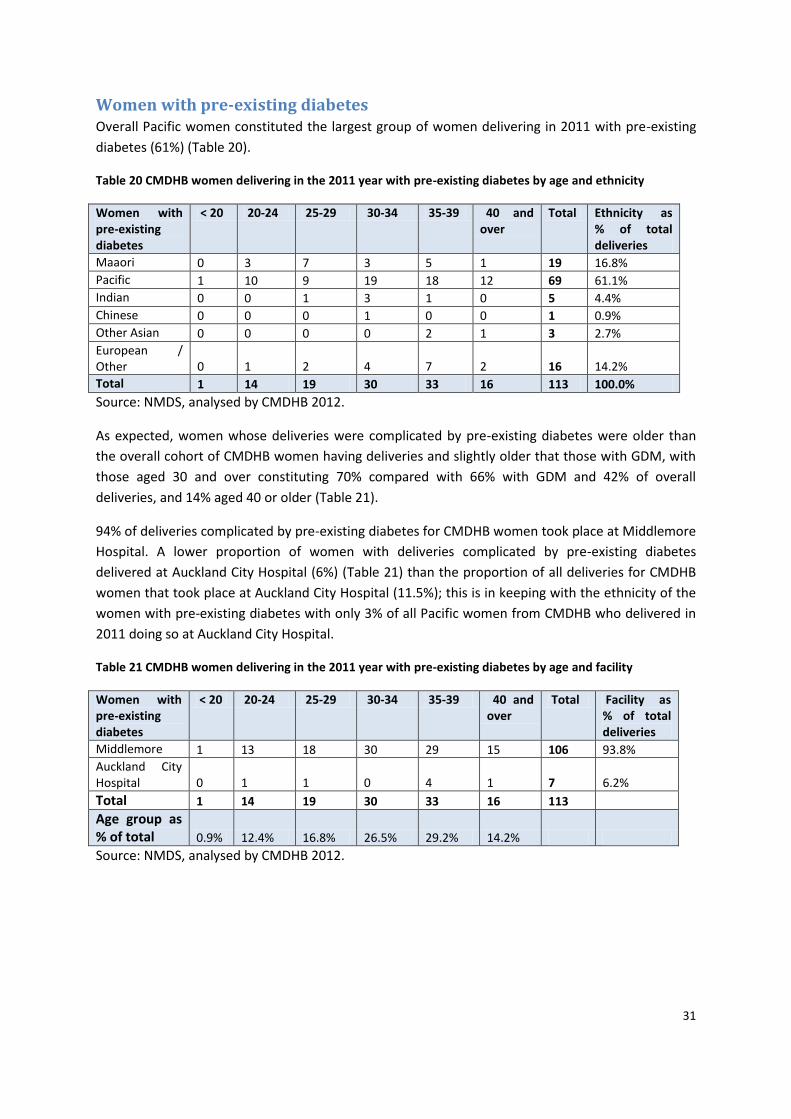
Women with pre-existing diabetes Overall Pacific women constituted the largest group of women delivering in 2011 with pre-existing
diabetes (61%) (Table 20).
Table 20 CMDHB women delivering in the 2011 year with pre-existing diabetes by age and ethnicity
Women with pre-existing diabetes
< 20 20-24 25-29 30-34 35-39 40 and over
Total Ethnicity as % of total deliveries
Maaori 0 3 7 3 5 1 19 16.8%
Pacific 1 10 9 19 18 12 69 61.1%
Indian 0 0 1 3 1 0 5 4.4%
Chinese 0 0 0 1 0 0 1 0.9%
Other Asian 0 0 0 0 2 1 3 2.7%
European / Other 0 1 2 4 7 2 16 14.2%
Total 1 14 19 30 33 16 113 100.0%
Source: NMDS, analysed by CMDHB 2012.
As expected, women whose deliveries were complicated by pre-existing diabetes were older than
the overall cohort of CMDHB women having deliveries and slightly older that those with GDM, with
those aged 30 and over constituting 70% compared with 66% with GDM and 42% of overall
deliveries, and 14% aged 40 or older (Table 21).
94% of deliveries complicated by pre-existing diabetes for CMDHB women took place at Middlemore
Hospital. A lower proportion of women with deliveries complicated by pre-existing diabetes
delivered at Auckland City Hospital (6%) (Table 21) than the proportion of all deliveries for CMDHB
women that took place at Auckland City Hospital (11.5%); this is in keeping with the ethnicity of the
women with pre-existing diabetes with only 3% of all Pacific women from CMDHB who delivered in
2011 doing so at Auckland City Hospital.
Table 21 CMDHB women delivering in the 2011 year with pre-existing diabetes by age and facility
Women with pre-existing diabetes
< 20 20-24 25-29 30-34 35-39 40 and over
Total Facility as % of total deliveries
Middlemore 1 13 18 30 29 15 106 93.8%
Auckland City Hospital 0 1 1 0 4 1 7 6.2%
Total 1 14 19 30 33 16 113
Age group as % of total 0.9% 12.4% 16.8% 26.5% 29.2% 14.2%
Source: NMDS, analysed by CMDHB 2012.
32
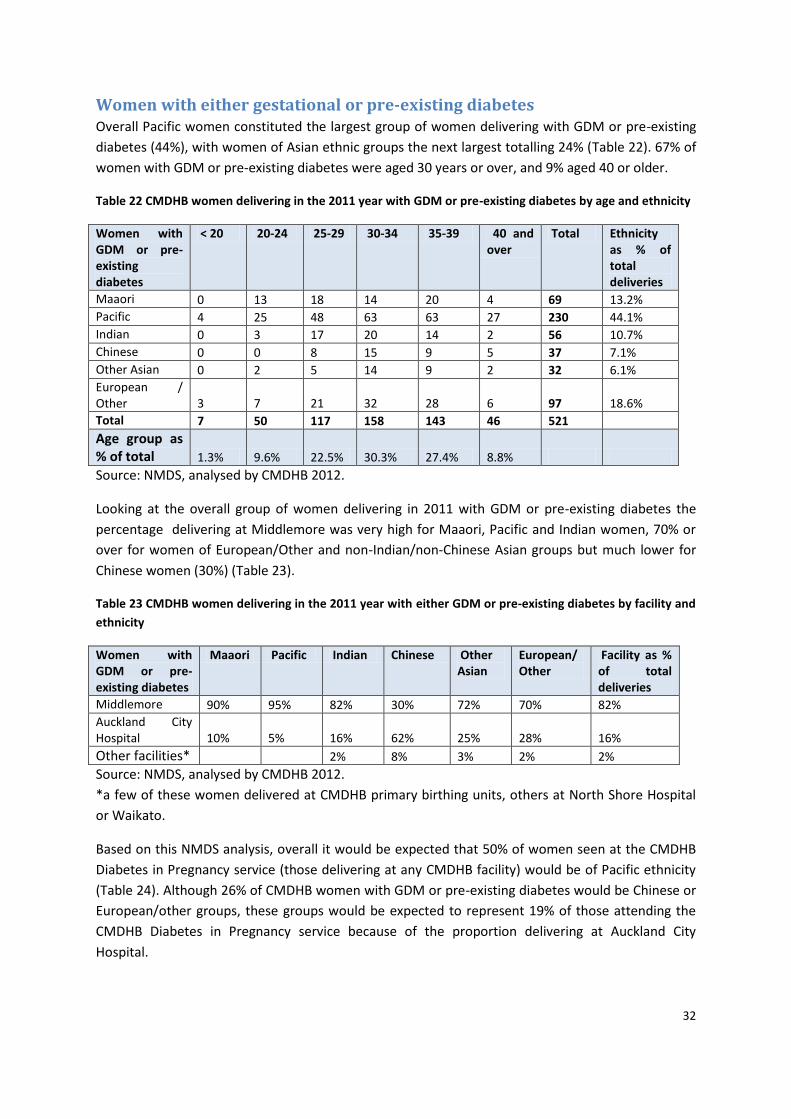
Women with either gestational or pre-existing diabetes Overall Pacific women constituted the largest group of women delivering with GDM or pre-existing
diabetes (44%), with women of Asian ethnic groups the next largest totalling 24% (Table 22). 67% of
women with GDM or pre-existing diabetes were aged 30 years or over, and 9% aged 40 or older.
Table 22 CMDHB women delivering in the 2011 year with GDM or pre-existing diabetes by age and ethnicity
Women with GDM or pre-existing diabetes
< 20 20-24 25-29 30-34 35-39 40 and over
Total Ethnicity as % of total deliveries
Maaori 0 13 18 14 20 4 69 13.2%
Pacific 4 25 48 63 63 27 230 44.1%
Indian 0 3 17 20 14 2 56 10.7%
Chinese 0 0 8 15 9 5 37 7.1%
Other Asian 0 2 5 14 9 2 32 6.1%
European / Other 3 7 21 32 28 6 97 18.6%
Total 7 50 117 158 143 46 521
Age group as % of total 1.3% 9.6% 22.5% 30.3% 27.4% 8.8%
Source: NMDS, analysed by CMDHB 2012.
Looking at the overall group of women delivering in 2011 with GDM or pre-existing diabetes the
percentage delivering at Middlemore was very high for Maaori, Pacific and Indian women, 70% or
over for women of European/Other and non-Indian/non-Chinese Asian groups but much lower for
Chinese women (30%) (Table 23).
Table 23 CMDHB women delivering in the 2011 year with either GDM or pre-existing diabetes by facility and
ethnicity
Women with GDM or pre-existing diabetes
Maaori Pacific Indian Chinese Other Asian
European/ Other
Facility as % of total deliveries
Middlemore 90% 95% 82% 30% 72% 70% 82%
Auckland City Hospital 10% 5% 16% 62% 25% 28% 16%
Other facilities* 2% 8% 3% 2% 2%
Source: NMDS, analysed by CMDHB 2012.
*a few of these women delivered at CMDHB primary birthing units, others at North Shore Hospital
or Waikato.
Based on this NMDS analysis, overall it would be expected that 50% of women seen at the CMDHB
Diabetes in Pregnancy service (those delivering at any CMDHB facility) would be of Pacific ethnicity
(Table 24). Although 26% of CMDHB women with GDM or pre-existing diabetes would be Chinese or
European/other groups, these groups would be expected to represent 19% of those attending the
CMDHB Diabetes in Pregnancy service because of the proportion delivering at Auckland City
Hospital.
33
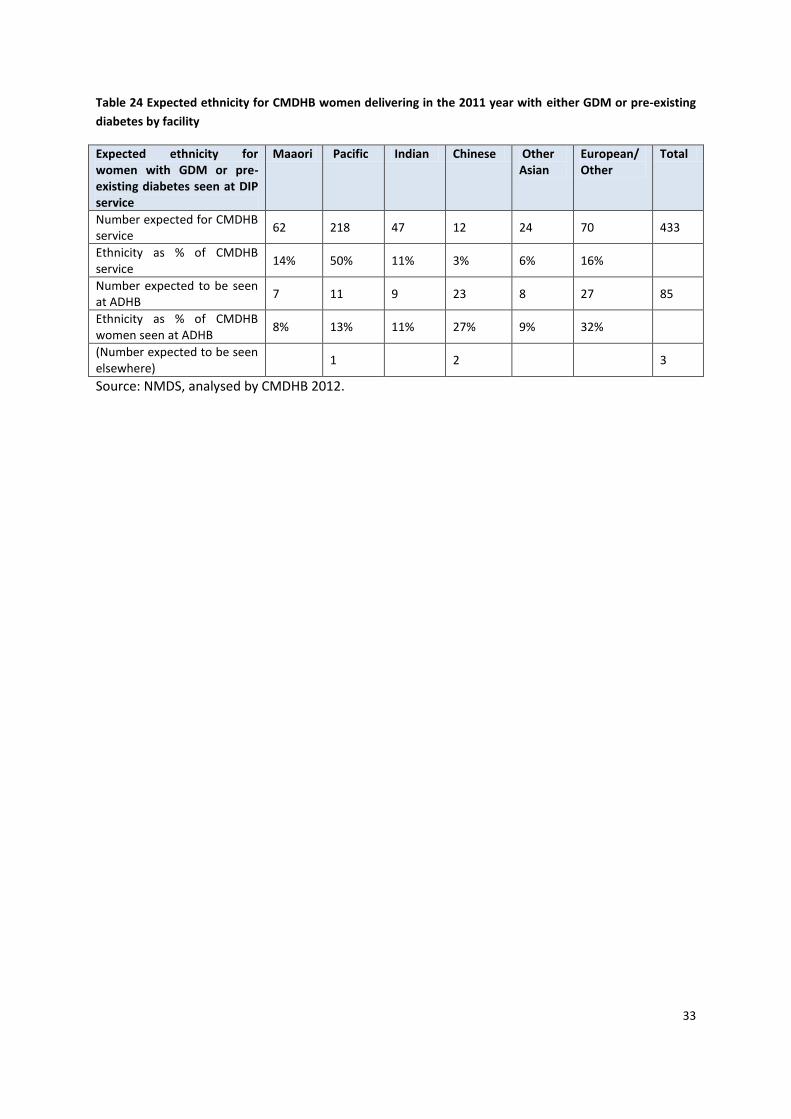
Table 24 Expected ethnicity for CMDHB women delivering in the 2011 year with either GDM or pre-existing
diabetes by facility
Expected ethnicity for women with GDM or pre-existing diabetes seen at DIP service
Maaori Pacific Indian Chinese Other Asian
European/ Other
Total
Number expected for CMDHB service
62 218 47 12 24 70 433
Ethnicity as % of CMDHB service
14% 50% 11% 3% 6% 16%
Number expected to be seen at ADHB
7 11 9 23 8 27 85
Ethnicity as % of CMDHB women seen at ADHB
8% 13% 11% 27% 9% 32%
(Number expected to be seen elsewhere)
1 2 3
Source: NMDS, analysed by CMDHB 2012.
34
Comparison with data from the CMDHB Diabetes in Pregnancy service
database As noted previously, the Diabetes in Pregnancy (DIP) service data is stored by Expected Date of
Delivery (EDD) at referral. This means data extracted for a calendar year not be a matching group to
those who deliver in that year. However with a stable birth cohort number overall, it is likely that a
similar number will deliver outside of the year in which their EDD is each year so figures are likely to
be roughly comparable.
As noted, data extracted for 2012 includes bookings up until early Oct which means the majority of
those who have an EDD in 2012 would be identified, but there will be some further cases referred so
the 2012 data in Table 25 is incomplete. A further 6 cases have been referred since the data was
extracted and another two or so cases could be expected based on previous years referrals (personal
communication, Lesley MacLennan); this would bring the 2012 total to approximately 551.
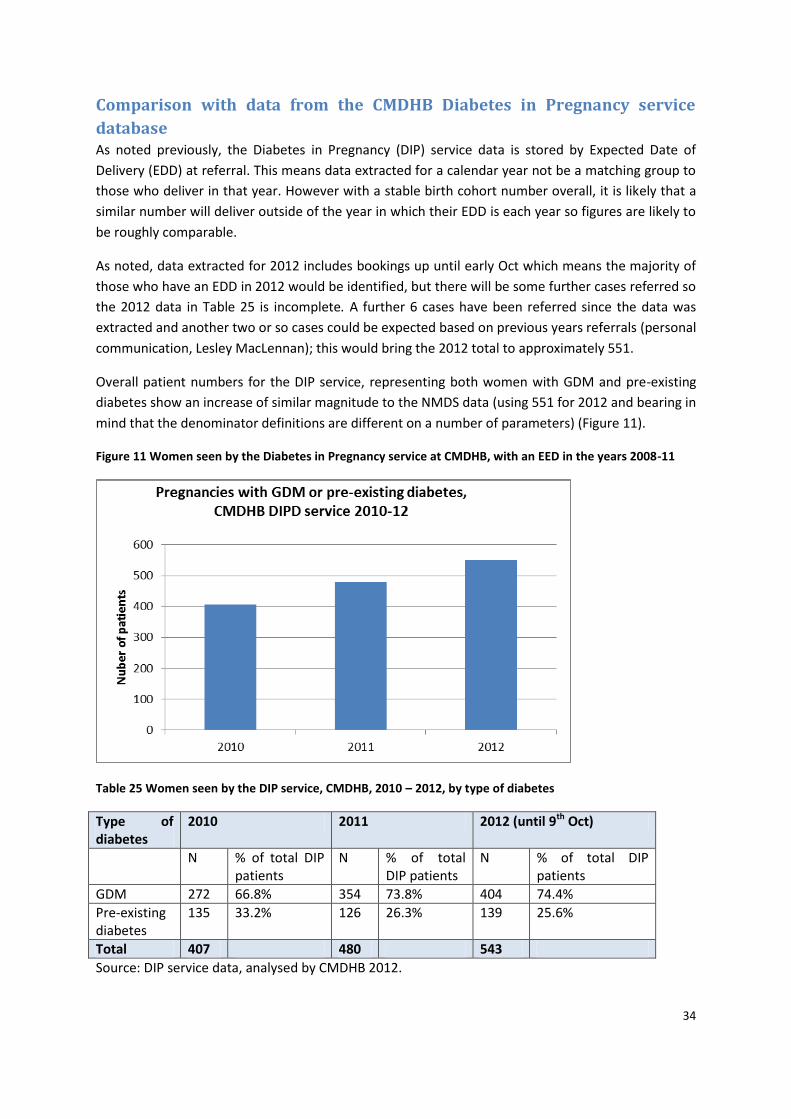
Overall patient numbers for the DIP service, representing both women with GDM and pre-existing
diabetes show an increase of similar magnitude to the NMDS data (using 551 for 2012 and bearing in
mind that the denominator definitions are different on a number of parameters) (Figure 11).
Figure 11 Women seen by the Diabetes in Pregnancy service at CMDHB, with an EED in the years 2008-11
Table 25 Women seen by the DIP service, CMDHB, 2010 – 2012, by type of diabetes
Type of diabetes
2010 2011 2012 (until 9th Oct)
N % of total DIP patients
N % of total DIP patients
N % of total DIP patients
GDM 272 66.8% 354 73.8% 404 74.4%
Pre-existing diabetes
135 33.2% 126 26.3% 139 25.6%
Total 407 480 543
Source: DIP service data, analysed by CMDHB 2012.
35
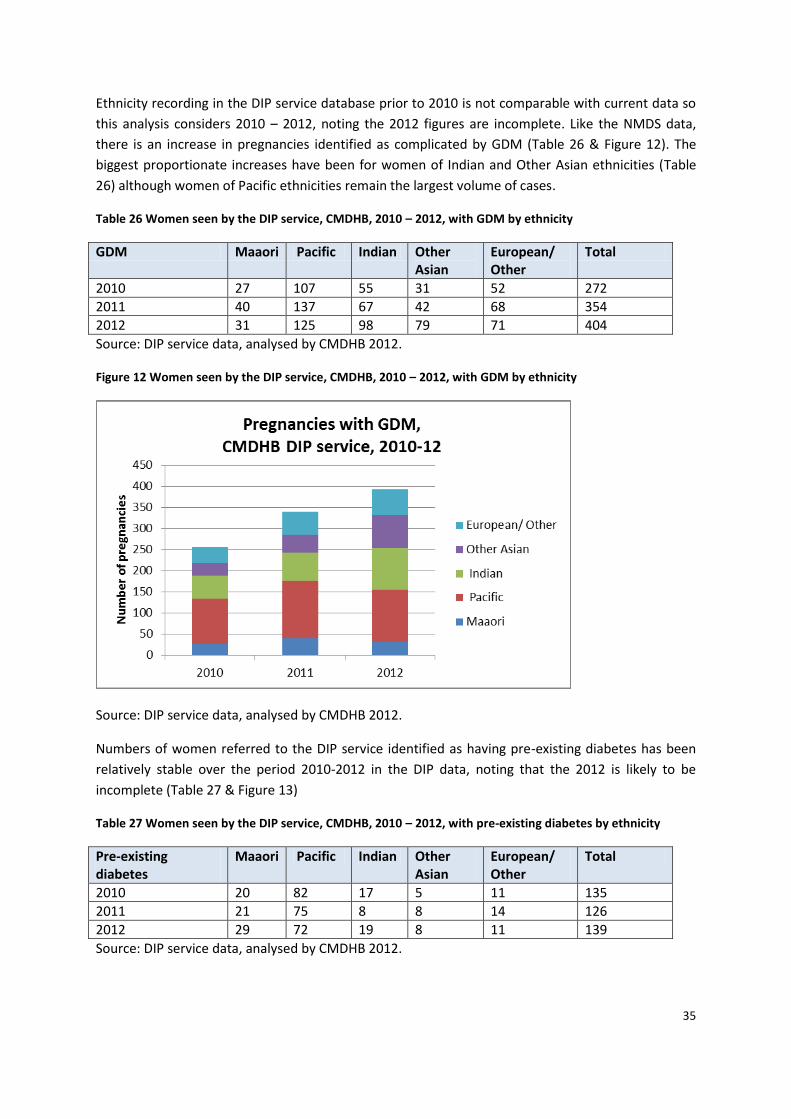
Ethnicity recording in the DIP service database prior to 2010 is not comparable with current data so
this analysis considers 2010 – 2012, noting the 2012 figures are incomplete. Like the NMDS data,
there is an increase in pregnancies identified as complicated by GDM (Table 26 & Figure 12). The
biggest proportionate increases have been for women of Indian and Other Asian ethnicities (Table
26) although women of Pacific ethnicities remain the largest volume of cases.
Table 26 Women seen by the DIP service, CMDHB, 2010 – 2012, with GDM by ethnicity
GDM Maaori Pacific Indian Other Asian
European/ Other
Total
2010 27 107 55 31 52 272
2011 40 137 67 42 68 354
2012 31 125 98 79 71 404
Source: DIP service data, analysed by CMDHB 2012.
Figure 12 Women seen by the DIP service, CMDHB, 2010 – 2012, with GDM by ethnicity
Source: DIP service data, analysed by CMDHB 2012.
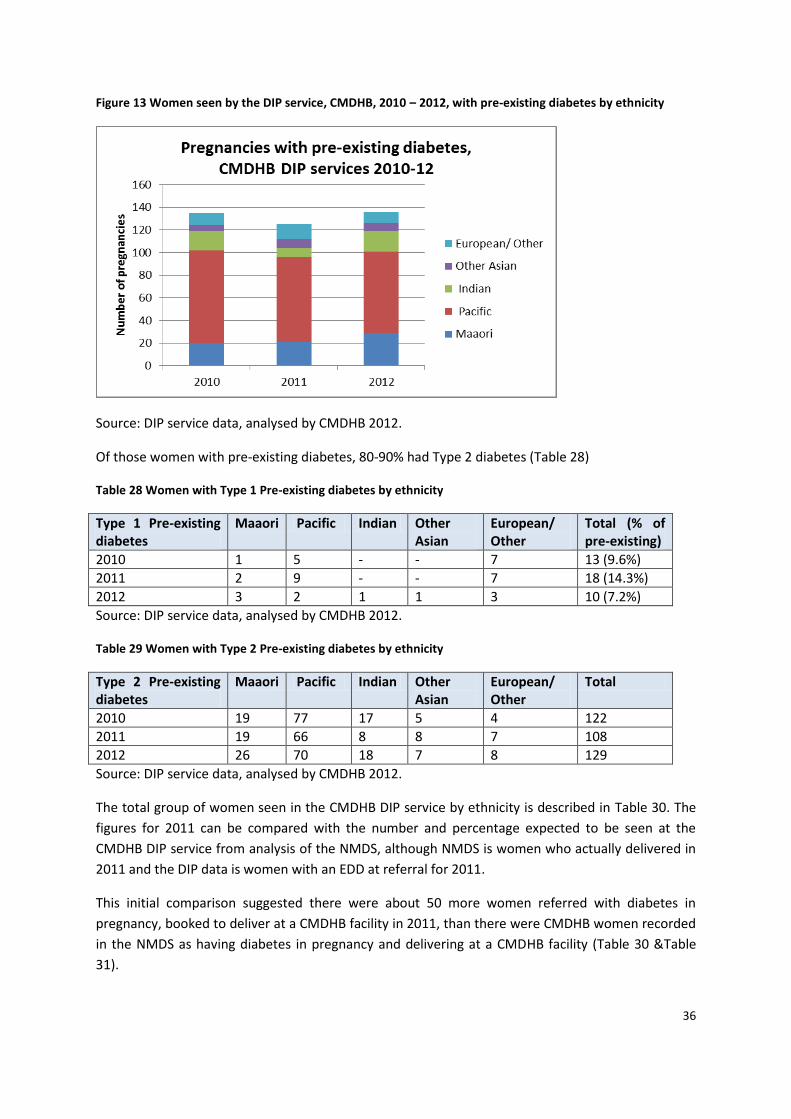
Numbers of women referred to the DIP service identified as having pre-existing diabetes has been
relatively stable over the period 2010-2012 in the DIP data, noting that the 2012 is likely to be
incomplete (Table 27 & Figure 13)
Table 27 Women seen by the DIP service, CMDHB, 2010 – 2012, with pre-existing diabetes by ethnicity
Pre-existing diabetes
Maaori Pacific Indian Other Asian
European/ Other
Total
2010 20 82 17 5 11 135
2011 21 75 8 8 14 126
2012 29 72 19 8 11 139
Source: DIP service data, analysed by CMDHB 2012.
36
Figure 13 Women seen by the DIP service, CMDHB, 2010 – 2012, with pre-existing diabetes by ethnicity
Source: DIP service data, analysed by CMDHB 2012.
Of those women with pre-existing diabetes, 80-90% had Type 2 diabetes (Table 28)
Table 28 Women with Type 1 Pre-existing diabetes by ethnicity
Type 1 Pre-existing diabetes
Maaori Pacific Indian Other Asian
European/ Other
Total (% of pre-existing)
2010 1 5 - - 7 13 (9.6%)
2011 2 9 - - 7 18 (14.3%)
2012 3 2 1 1 3 10 (7.2%)
Source: DIP service data, analysed by CMDHB 2012.
Table 29 Women with Type 2 Pre-existing diabetes by ethnicity
Type 2 Pre-existing diabetes
Maaori Pacific Indian Other Asian
European/ Other
Total
2010 19 77 17 5 4 122
2011 19 66 8 8 7 108
2012 26 70 18 7 8 129
Source: DIP service data, analysed by CMDHB 2012.
The total group of women seen in the CMDHB DIP service by ethnicity is described in Table 30. The
figures for 2011 can be compared with the number and percentage expected to be seen at the
CMDHB DIP service from analysis of the NMDS, although NMDS is women who actually delivered in
2011 and the DIP data is women with an EDD at referral for 2011.
This initial comparison suggested there were about 50 more women referred with diabetes in
pregnancy, booked to deliver at a CMDHB facility in 2011, than there were CMDHB women recorded
in the NMDS as having diabetes in pregnancy and delivering at a CMDHB facility (Table 30 &Table
31).
37
Table 30 Total group of women seen in the CMDHB DIP service by ethnicity (with incomplete 2012 data)
GDM or Pre-existing diabetes
Maaori Pacific Indian Other Asian
European/ Other
Total
2010 47 189 72 36 63 407
2011 61 212 75 50 82 480
2012 60 197 117 87 82 543
Source: DIP service data, analysed by CMDHB 2012.
Table 31 Number and percentage by ethnicity expected to be seen at the CMDHB DIP service from analysis
of the NMDS
Expected ethnicity for women with GDM or pre-existing diabetes seen at DIP service
Maaori Pacific Indian Chinese Other Asian
European/ Other
Total
Number expected for CMDHB service
62 218 47 12 24 70 433
Ethnicity as % of CMDHB service
14% 50% 11% 3% 6% 16%
Number expected to be seen at ADHB
7 11 9 23 8 27 85
Ethnicity as % of CMDHB women seen at ADHB
8% 13% 11% 27% 9% 32%
(Number expected to be seen elsewhere)
1 2 3
Source: DIP service data, analysed by CMDHB 2012.
However after this comparison was undertaken, data was extracted from NMDS regarding women
delivering at CMDHB facilities who were resident in other DHBs, as women with diabetes from this
group will also be seen by the CMDHB Diabetes in Pregnancy service. DIP service records were also
reviewed to determine what proportion of women referred to the service do not subsequently
deliver at CMDHB.
In 2011 there were 36 women from other DHBs who delivered at CMDHB facilities who were
identified as having diabetes in pregnancy. 72% of these women were of Pacific or Indian ethnicity
and 55% were from Otahuhu (Table 32). This would take the number of women expected to be seen
by the CMDHB DIP service in 2011 to 469 based on NMDS records.
Table 32 Women from other DHBs with diabetes in pregnancy delivering at CMDHB in 2011
Either GDM or pre-existing diabetes GDM Pre-existing
CMDHB women delivered at CMDHB 433 327 106
ADHB women delivered at CMDHB – Otahuhu
20 (14 Pacific, 3 Indian) 15 5
Other ADHB women delivered at CM 10 (7 Pacific, 2 Indian) 9 1
Women from other DHBs delivered at CMDHB
6 (3 Maaori) 3 3
Source: NMDS, analysed by CMDHB 2012.
38
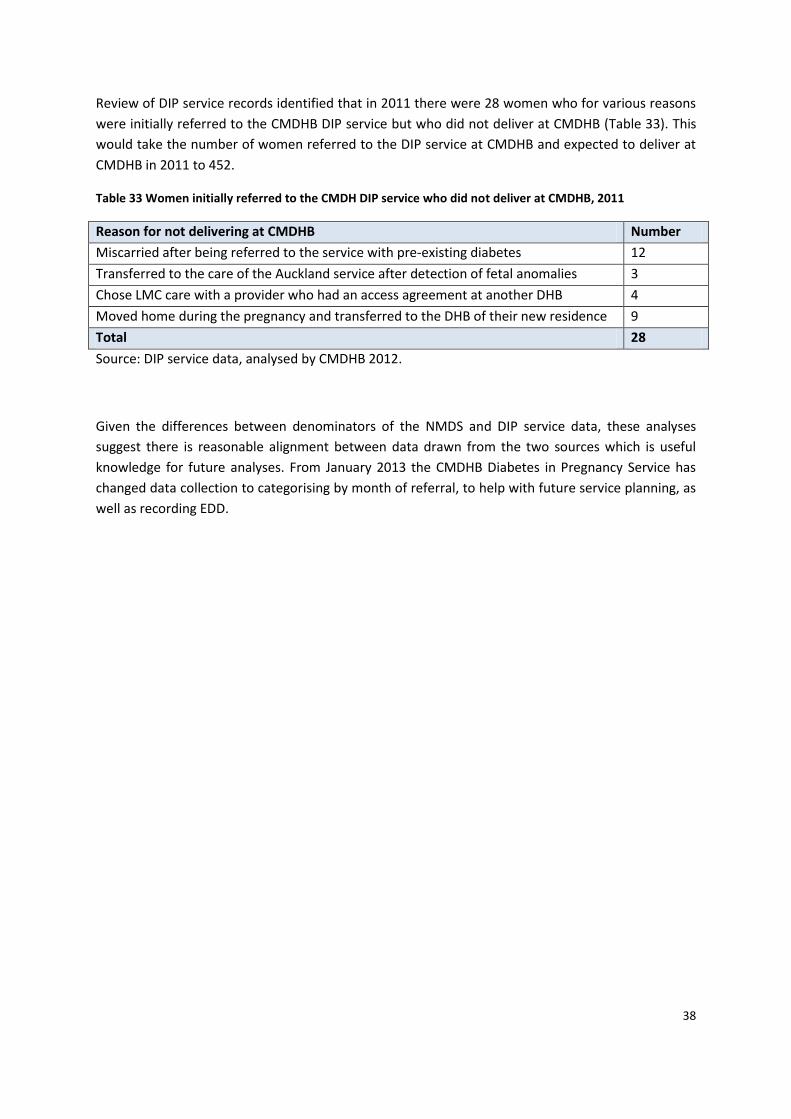
Review of DIP service records identified that in 2011 there were 28 women who for various reasons
were initially referred to the CMDHB DIP service but who did not deliver at CMDHB (Table 33). This
would take the number of women referred to the DIP service at CMDHB and expected to deliver at
CMDHB in 2011 to 452.
Table 33 Women initially referred to the CMDH DIP service who did not deliver at CMDHB, 2011
Reason for not delivering at CMDHB Number
Miscarried after being referred to the service with pre-existing diabetes 12
Transferred to the care of the Auckland service after detection of fetal anomalies 3
Chose LMC care with a provider who had an access agreement at another DHB 4
Moved home during the pregnancy and transferred to the DHB of their new residence 9
Total 28
Source: DIP service data, analysed by CMDHB 2012.
Given the differences between denominators of the NMDS and DIP service data, these analyses
suggest there is reasonable alignment between data drawn from the two sources which is useful
knowledge for future analyses. From January 2013 the CMDHB Diabetes in Pregnancy Service has
changed data collection to categorising by month of referral, to help with future service planning, as
well as recording EDD.
39
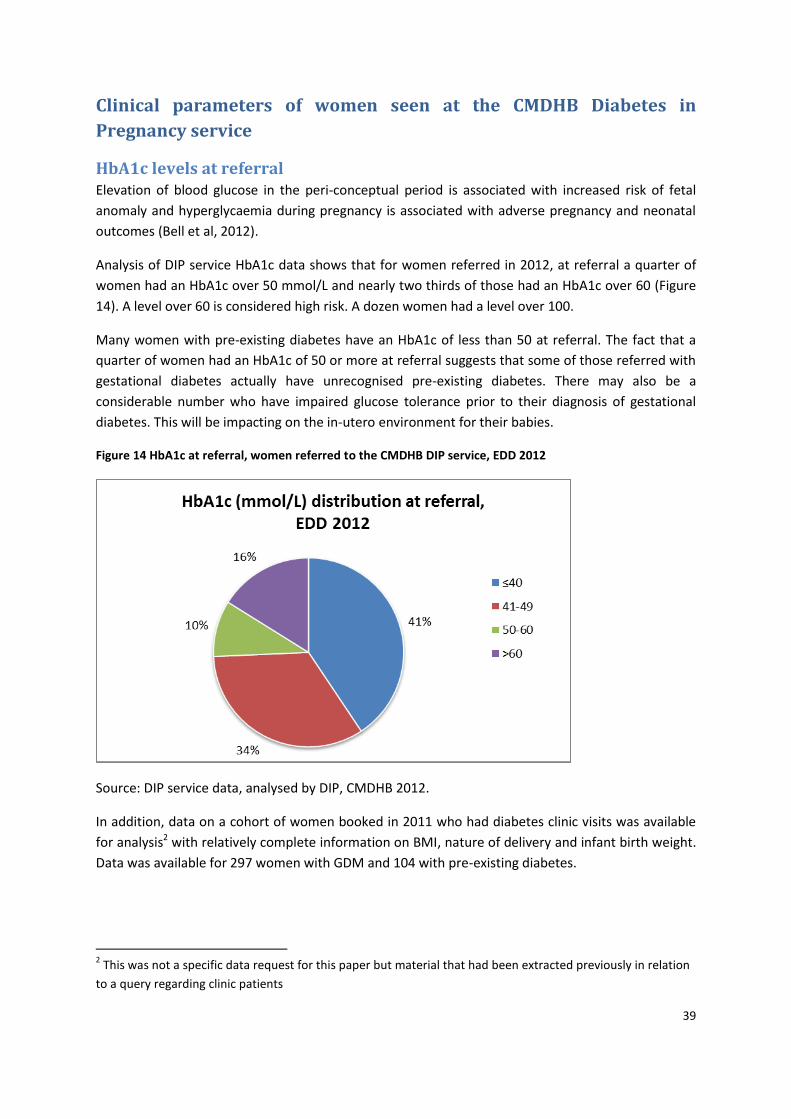
Clinical parameters of women seen at the CMDHB Diabetes in
Pregnancy service
HbA1c levels at referral Elevation of blood glucose in the peri-conceptual period is associated with increased risk of fetal
anomaly and hyperglycaemia during pregnancy is associated with adverse pregnancy and neonatal
outcomes (Bell et al, 2012).
Analysis of DIP service HbA1c data shows that for women referred in 2012, at referral a quarter of
women had an HbA1c over 50 mmol/L and nearly two thirds of those had an HbA1c over 60 (Figure
14). A level over 60 is considered high risk. A dozen women had a level over 100.
Many women with pre-existing diabetes have an HbA1c of less than 50 at referral. The fact that a
quarter of women had an HbA1c of 50 or more at referral suggests that some of those referred with
gestational diabetes actually have unrecognised pre-existing diabetes. There may also be a
considerable number who have impaired glucose tolerance prior to their diagnosis of gestational
diabetes. This will be impacting on the in-utero environment for their babies.
Figure 14 HbA1c at referral, women referred to the CMDHB DIP service, EDD 2012
Source: DIP service data, analysed by DIP, CMDHB 2012.
In addition, data on a cohort of women booked in 2011 who had diabetes clinic visits was available
for analysis2 with relatively complete information on BMI, nature of delivery and infant birth weight.
Data was available for 297 women with GDM and 104 with pre-existing diabetes.
2 This was not a specific data request for this paper but material that had been extracted previously in relation
to a query regarding clinic patients
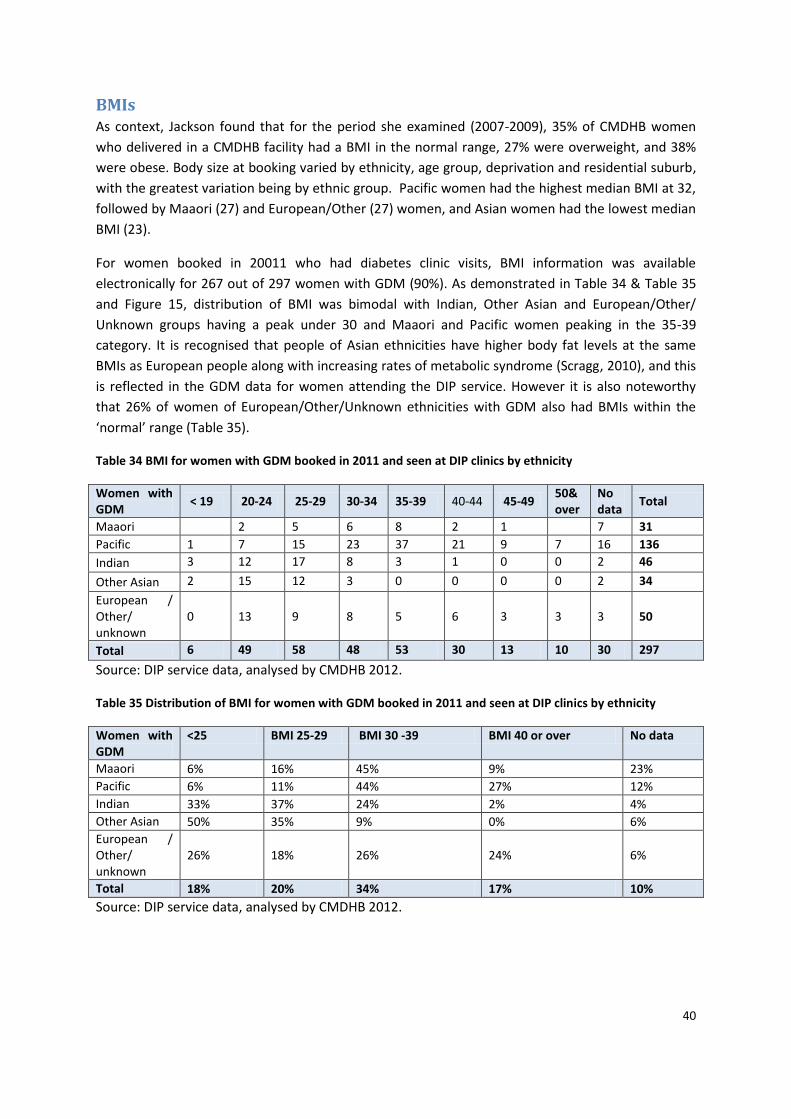
40
BMIs As context, Jackson found that for the period she examined (2007-2009), 35% of CMDHB women
who delivered in a CMDHB facility had a BMI in the normal range, 27% were overweight, and 38%
were obese. Body size at booking varied by ethnicity, age group, deprivation and residential suburb,
with the greatest variation being by ethnic group. Pacific women had the highest median BMI at 32,
followed by Maaori (27) and European/Other (27) women, and Asian women had the lowest median
BMI (23).
For women booked in 20011 who had diabetes clinic visits, BMI information was available
electronically for 267 out of 297 women with GDM (90%). As demonstrated in Table 34 & Table 35
and Figure 15, distribution of BMI was bimodal with Indian, Other Asian and European/Other/
Unknown groups having a peak under 30 and Maaori and Pacific women peaking in the 35-39
category. It is recognised that people of Asian ethnicities have higher body fat levels at the same
BMIs as European people along with increasing rates of metabolic syndrome (Scragg, 2010), and this
is reflected in the GDM data for women attending the DIP service. However it is also noteworthy
that 26% of women of European/Other/Unknown ethnicities with GDM also had BMIs within the
‘normal’ range (Table 35).
Table 34 BMI for women with GDM booked in 2011 and seen at DIP clinics by ethnicity
Women with GDM
< 19 20-24 25-29 30-34 35-39 40-44 45-49 50& over
No data
Total
Maaori 2 5 6 8 2 1 7 31
Pacific 1 7 15 23 37 21 9 7 16 136
Indian 3 12 17 8 3 1 0 0 2 46
Other Asian 2 15 12 3 0 0 0 0 2 34
European / Other/ unknown
0 13 9 8 5 6 3 3 3 50
Total 6 49 58 48 53 30 13 10 30 297
Source: DIP service data, analysed by CMDHB 2012.
Table 35 Distribution of BMI for women with GDM booked in 2011 and seen at DIP clinics by ethnicity
Women with GDM
<25 BMI 25-29 BMI 30 -39 BMI 40 or over No data
Maaori 6% 16% 45% 9% 23%
Pacific 6% 11% 44% 27% 12%
Indian 33% 37% 24% 2% 4%
Other Asian 50% 35% 9% 0% 6%
European / Other/ unknown
26% 18% 26% 24% 6%
Total 18% 20% 34% 17% 10%
Source: DIP service data, analysed by CMDHB 2012.
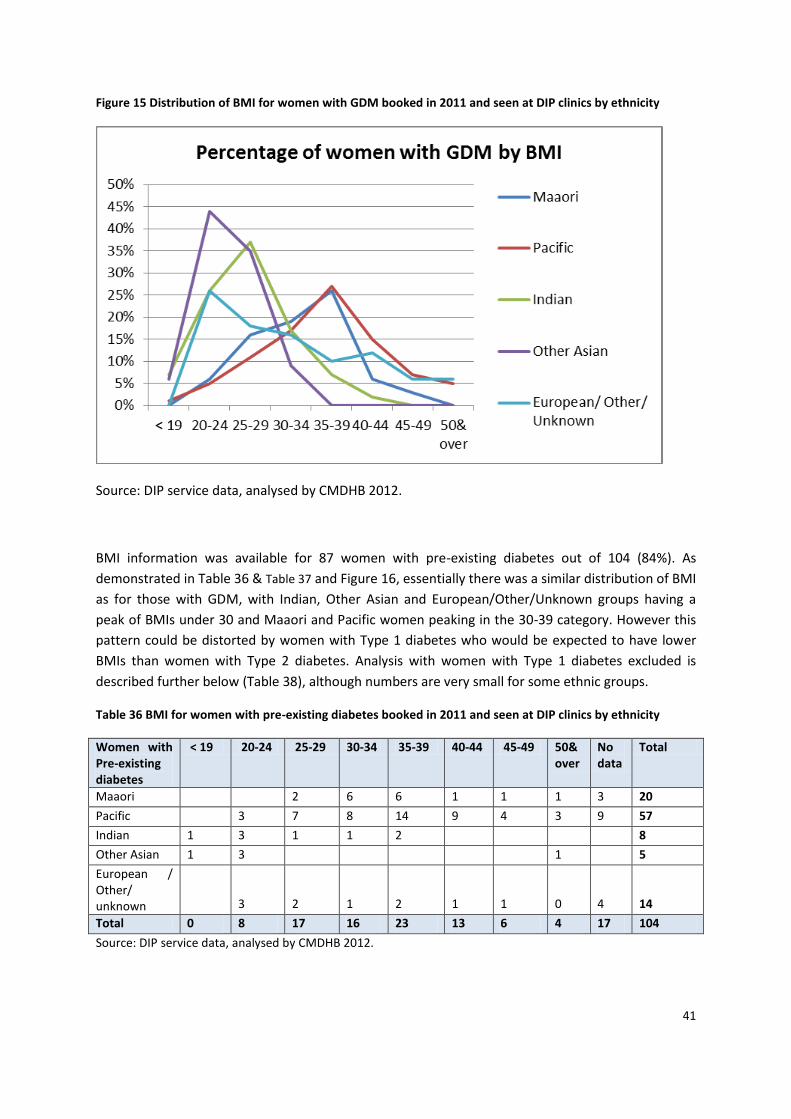
41
Figure 15 Distribution of BMI for women with GDM booked in 2011 and seen at DIP clinics by ethnicity
Source: DIP service data, analysed by CMDHB 2012.
BMI information was available for 87 women with pre-existing diabetes out of 104 (84%). As
demonstrated in Table 36 & Table 37 and Figure 16, essentially there was a similar distribution of BMI
as for those with GDM, with Indian, Other Asian and European/Other/Unknown groups having a
peak of BMIs under 30 and Maaori and Pacific women peaking in the 30-39 category. However this
pattern could be distorted by women with Type 1 diabetes who would be expected to have lower
BMIs than women with Type 2 diabetes. Analysis with women with Type 1 diabetes excluded is
described further below (Table 38), although numbers are very small for some ethnic groups.
Table 36 BMI for women with pre-existing diabetes booked in 2011 and seen at DIP clinics by ethnicity
Women with Pre-existing diabetes
< 19 20-24 25-29 30-34 35-39 40-44 45-49 50& over
No data
Total
Maaori 2 6 6 1 1 1 3 20
Pacific 3 7 8 14 9 4 3 9 57
Indian 1 3 1 1 2 8
Other Asian 1 3 1 5
European / Other/ unknown 3 2 1 2 1 1 0 4 14
Total 0 8 17 16 23 13 6 4 17 104
Source: DIP service data, analysed by CMDHB 2012.
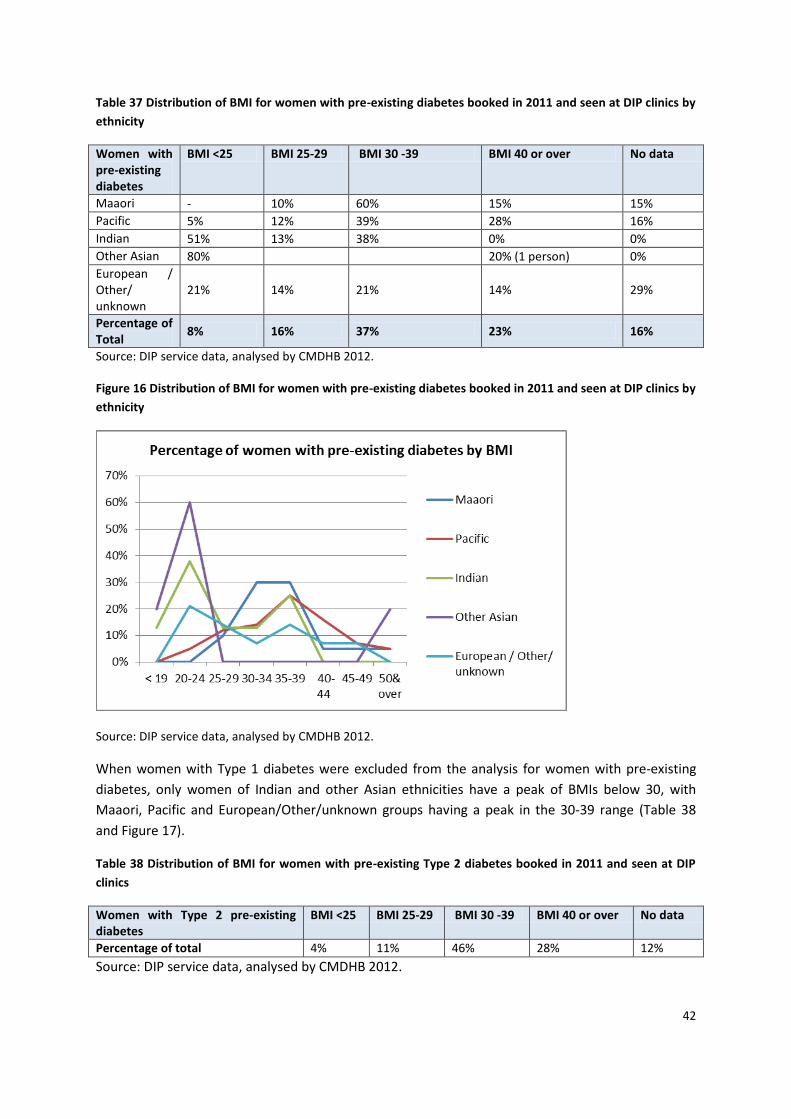
42
Table 37 Distribution of BMI for women with pre-existing diabetes booked in 2011 and seen at DIP clinics by
ethnicity
Women with pre-existing diabetes
BMI <25 BMI 25-29 BMI 30 -39 BMI 40 or over No data
Maaori - 10% 60% 15% 15%
Pacific 5% 12% 39% 28% 16%
Indian 51% 13% 38% 0% 0%
Other Asian 80% 20% (1 person) 0%
European / Other/ unknown
21% 14% 21% 14% 29%
Percentage of Total
8% 16% 37% 23% 16%
Source: DIP service data, analysed by CMDHB 2012.
Figure 16 Distribution of BMI for women with pre-existing diabetes booked in 2011 and seen at DIP clinics by
ethnicity
Source: DIP service data, analysed by CMDHB 2012.
When women with Type 1 diabetes were excluded from the analysis for women with pre-existing
diabetes, only women of Indian and other Asian ethnicities have a peak of BMIs below 30, with
Maaori, Pacific and European/Other/unknown groups having a peak in the 30-39 range (Table 38
and Figure 17).
Table 38 Distribution of BMI for women with pre-existing Type 2 diabetes booked in 2011 and seen at DIP
clinics
Women with Type 2 pre-existing diabetes
BMI <25 BMI 25-29 BMI 30 -39 BMI 40 or over No data
Percentage of total 4% 11% 46% 28% 12%
Source: DIP service data, analysed by CMDHB 2012.
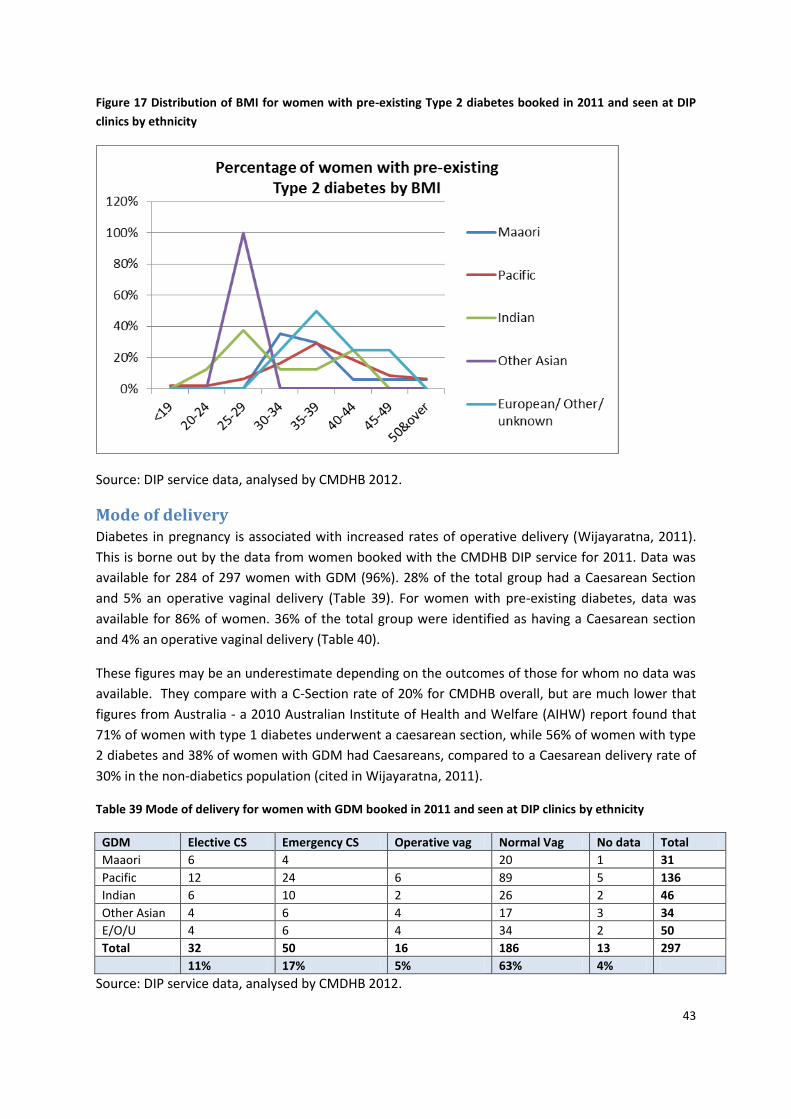
43
Figure 17 Distribution of BMI for women with pre-existing Type 2 diabetes booked in 2011 and seen at DIP
clinics by ethnicity
Source: DIP service data, analysed by CMDHB 2012.
Mode of delivery Diabetes in pregnancy is associated with increased rates of operative delivery (Wijayaratna, 2011).
This is borne out by the data from women booked with the CMDHB DIP service for 2011. Data was
available for 284 of 297 women with GDM (96%). 28% of the total group had a Caesarean Section
and 5% an operative vaginal delivery (Table 39). For women with pre-existing diabetes, data was
available for 86% of women. 36% of the total group were identified as having a Caesarean section
and 4% an operative vaginal delivery (Table 40).
These figures may be an underestimate depending on the outcomes of those for whom no data was
available. They compare with a C-Section rate of 20% for CMDHB overall, but are much lower that
figures from Australia - a 2010 Australian Institute of Health and Welfare (AIHW) report found that
71% of women with type 1 diabetes underwent a caesarean section, while 56% of women with type
2 diabetes and 38% of women with GDM had Caesareans, compared to a Caesarean delivery rate of
30% in the non-diabetics population (cited in Wijayaratna, 2011).
Table 39 Mode of delivery for women with GDM booked in 2011 and seen at DIP clinics by ethnicity
GDM Elective CS Emergency CS Operative vag Normal Vag No data Total
Maaori 6 4 20 1 31
Pacific 12 24 6 89 5 136
Indian 6 10 2 26 2 46
Other Asian 4 6 4 17 3 34
E/O/U 4 6 4 34 2 50
Total 32 50 16 186 13 297
11% 17% 5% 63% 4%
Source: DIP service data, analysed by CMDHB 2012.
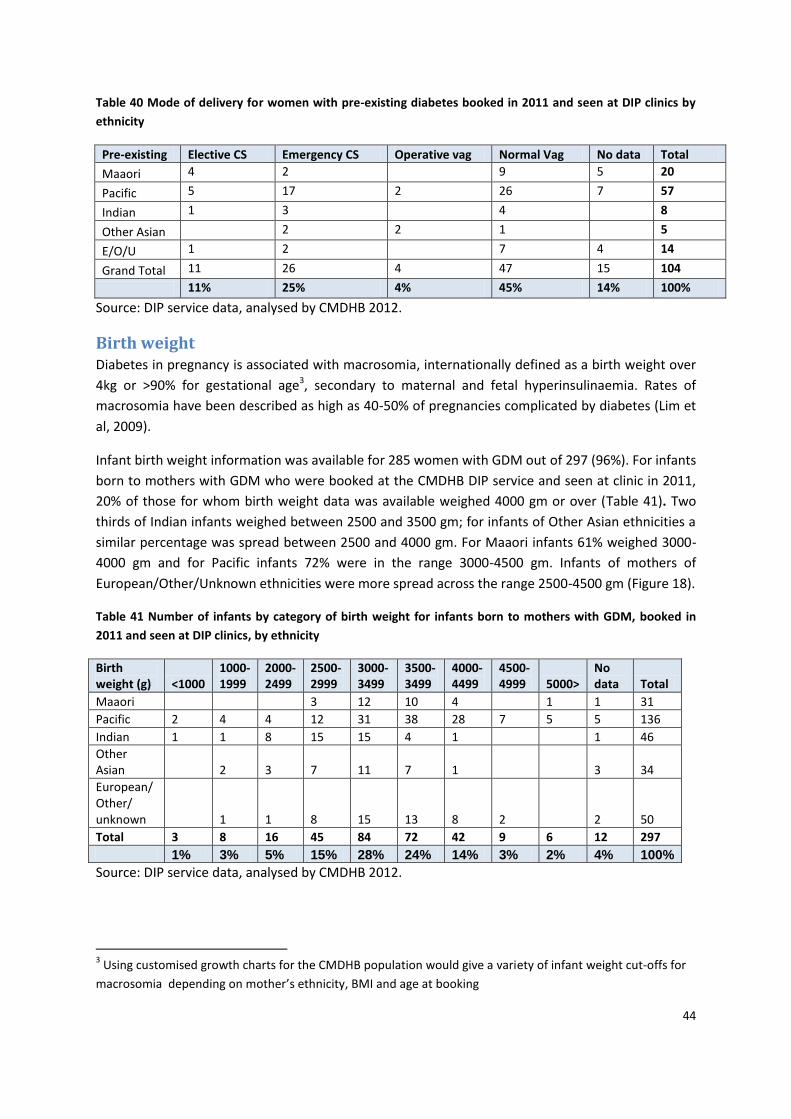
44
Table 40 Mode of delivery for women with pre-existing diabetes booked in 2011 and seen at DIP clinics by
ethnicity
Pre-existing Elective CS Emergency CS Operative vag Normal Vag No data Total
Maaori 4 2 9 5 20
Pacific 5 17 2 26 7 57
Indian 1 3 4 8
Other Asian 2 2 1 5
E/O/U 1 2 7 4 14
Grand Total 11 26 4 47 15 104
11% 25% 4% 45% 14% 100%
Source: DIP service data, analysed by CMDHB 2012.
Birth weight Diabetes in pregnancy is associated with macrosomia, internationally defined as a birth weight over
4kg or >90% for gestational age3, secondary to maternal and fetal hyperinsulinaemia. Rates of
macrosomia have been described as high as 40-50% of pregnancies complicated by diabetes (Lim et
al, 2009).
Infant birth weight information was available for 285 women with GDM out of 297 (96%). For infants
born to mothers with GDM who were booked at the CMDHB DIP service and seen at clinic in 2011,
20% of those for whom birth weight data was available weighed 4000 gm or over (Table 41). Two
thirds of Indian infants weighed between 2500 and 3500 gm; for infants of Other Asian ethnicities a
similar percentage was spread between 2500 and 4000 gm. For Maaori infants 61% weighed 3000-
4000 gm and for Pacific infants 72% were in the range 3000-4500 gm. Infants of mothers of
European/Other/Unknown ethnicities were more spread across the range 2500-4500 gm (Figure 18).
Table 41 Number of infants by category of birth weight for infants born to mothers with GDM, booked in
2011 and seen at DIP clinics, by ethnicity
Birth weight (g) <1000
1000-1999
2000-2499
2500-2999
3000-3499
3500-3499
4000-4499
4500-4999 5000>
No data Total
Maaori 3 12 10 4 1 1 31
Pacific 2 4 4 12 31 38 28 7 5 5 136
Indian 1 1 8 15 15 4 1 1 46
Other Asian 2 3 7 11 7 1 3 34
European/ Other/ unknown 1 1 8 15 13 8 2 2 50
Total 3 8 16 45 84 72 42 9 6 12 297
1% 3% 5% 15% 28% 24% 14% 3% 2% 4% 100%
Source: DIP service data, analysed by CMDHB 2012.
3 Using customised growth charts for the CMDHB population would give a variety of infant weight cut-offs for
macrosomia depending on mother’s ethnicity, BMI and age at booking
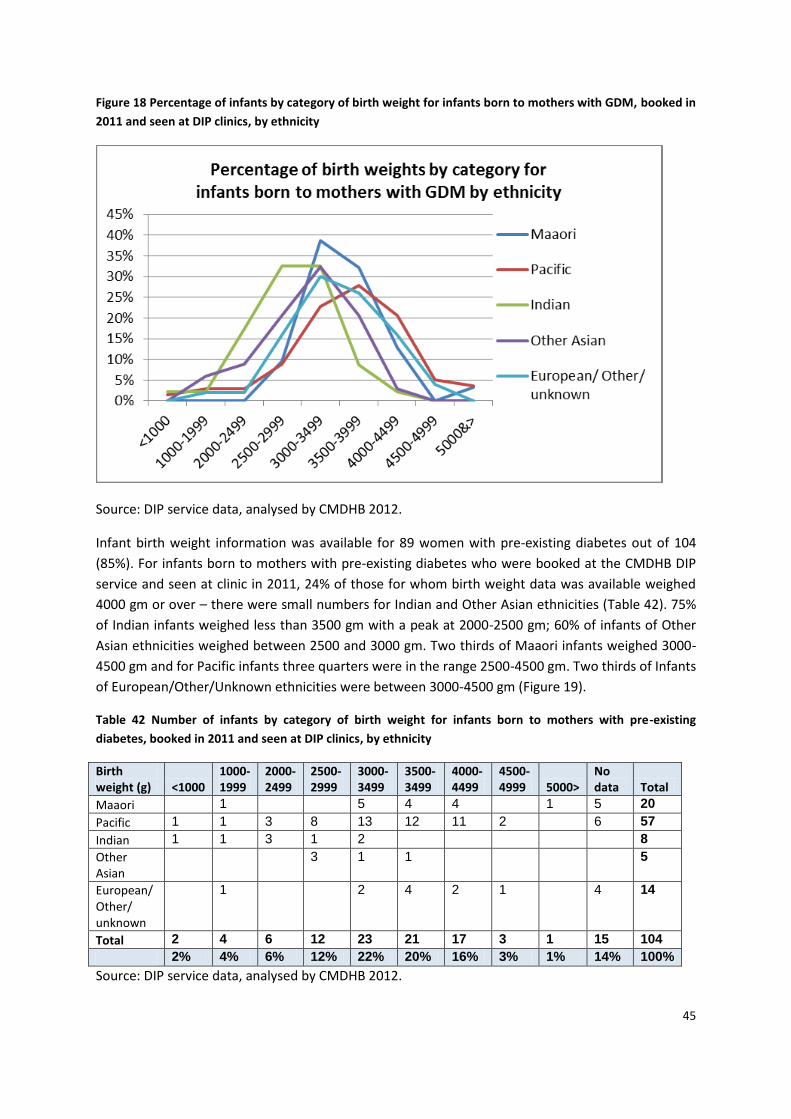
45
Figure 18 Percentage of infants by category of birth weight for infants born to mothers with GDM, booked in
2011 and seen at DIP clinics, by ethnicity
Source: DIP service data, analysed by CMDHB 2012.
Infant birth weight information was available for 89 women with pre-existing diabetes out of 104
(85%). For infants born to mothers with pre-existing diabetes who were booked at the CMDHB DIP
service and seen at clinic in 2011, 24% of those for whom birth weight data was available weighed
4000 gm or over – there were small numbers for Indian and Other Asian ethnicities (Table 42). 75%
of Indian infants weighed less than 3500 gm with a peak at 2000-2500 gm; 60% of infants of Other
Asian ethnicities weighed between 2500 and 3000 gm. Two thirds of Maaori infants weighed 3000-
4500 gm and for Pacific infants three quarters were in the range 2500-4500 gm. Two thirds of Infants
of European/Other/Unknown ethnicities were between 3000-4500 gm (Figure 19).
Table 42 Number of infants by category of birth weight for infants born to mothers with pre-existing
diabetes, booked in 2011 and seen at DIP clinics, by ethnicity
Birth weight (g) <1000
1000-1999
2000-2499
2500-2999
3000-3499
3500-3499
4000-4499
4500-4999 5000>
No data Total
Maaori 1 5 4 4 1 5 20
Pacific 1 1 3 8 13 12 11 2 6 57
Indian 1 1 3 1 2 8
Other Asian
3 1 1 5
European/ Other/ unknown
1 2 4 2 1 4 14
Total 2 4 6 12 23 21 17 3 1 15 104
2% 4% 6% 12% 22% 20% 16% 3% 1% 14% 100%
Source: DIP service data, analysed by CMDHB 2012.
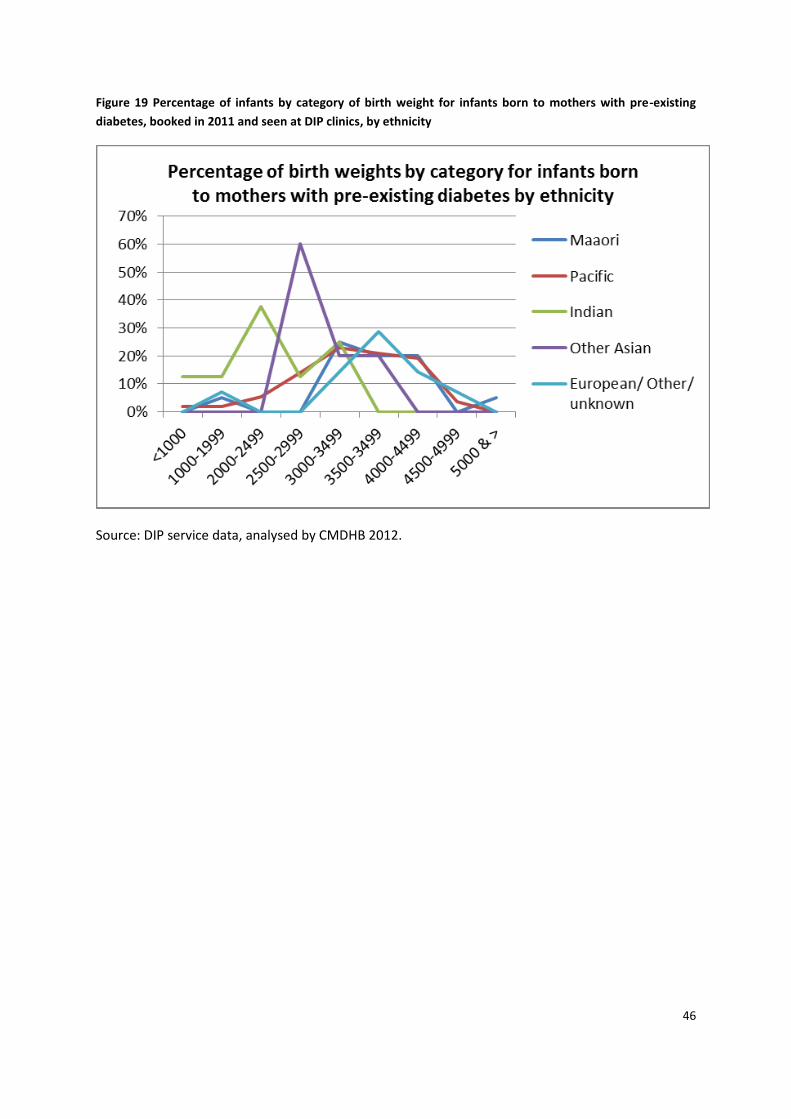
46
Figure 19 Percentage of infants by category of birth weight for infants born to mothers with pre-existing
diabetes, booked in 2011 and seen at DIP clinics, by ethnicity
Source: DIP service data, analysed by CMDHB 2012.
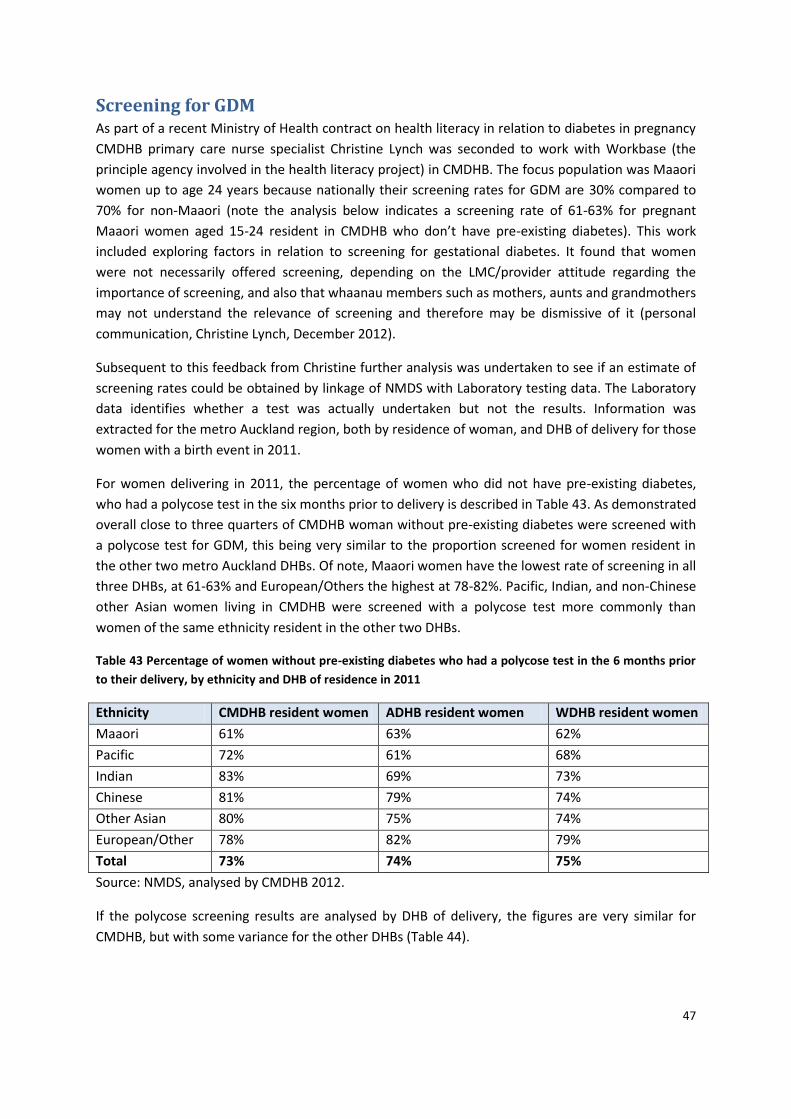
47
Screening for GDM As part of a recent Ministry of Health contract on health literacy in relation to diabetes in pregnancy
CMDHB primary care nurse specialist Christine Lynch was seconded to work with Workbase (the
principle agency involved in the health literacy project) in CMDHB. The focus population was Maaori
women up to age 24 years because nationally their screening rates for GDM are 30% compared to
70% for non-Maaori (note the analysis below indicates a screening rate of 61-63% for pregnant
Maaori women aged 15-24 resident in CMDHB who don’t have pre-existing diabetes). This work
included exploring factors in relation to screening for gestational diabetes. It found that women
were not necessarily offered screening, depending on the LMC/provider attitude regarding the
importance of screening, and also that whaanau members such as mothers, aunts and grandmothers
may not understand the relevance of screening and therefore may be dismissive of it (personal
communication, Christine Lynch, December 2012).
Subsequent to this feedback from Christine further analysis was undertaken to see if an estimate of
screening rates could be obtained by linkage of NMDS with Laboratory testing data. The Laboratory
data identifies whether a test was actually undertaken but not the results. Information was
extracted for the metro Auckland region, both by residence of woman, and DHB of delivery for those
women with a birth event in 2011.
For women delivering in 2011, the percentage of women who did not have pre-existing diabetes,
who had a polycose test in the six months prior to delivery is described in Table 43. As demonstrated
overall close to three quarters of CMDHB woman without pre-existing diabetes were screened with
a polycose test for GDM, this being very similar to the proportion screened for women resident in
the other two metro Auckland DHBs. Of note, Maaori women have the lowest rate of screening in all
three DHBs, at 61-63% and European/Others the highest at 78-82%. Pacific, Indian, and non-Chinese
other Asian women living in CMDHB were screened with a polycose test more commonly than
women of the same ethnicity resident in the other two DHBs.
Table 43 Percentage of women without pre-existing diabetes who had a polycose test in the 6 months prior
to their delivery, by ethnicity and DHB of residence in 2011
Ethnicity CMDHB resident women ADHB resident women WDHB resident women
Maaori 61% 63% 62%
Pacific 72% 61% 68%
Indian 83% 69% 73%
Chinese 81% 79% 74%
Other Asian 80% 75% 74%
European/Other 78% 82% 79%
Total 73% 74% 75%
Source: NMDS, analysed by CMDHB 2012.
If the polycose screening results are analysed by DHB of delivery, the figures are very similar for
CMDHB, but with some variance for the other DHBs (Table 44).
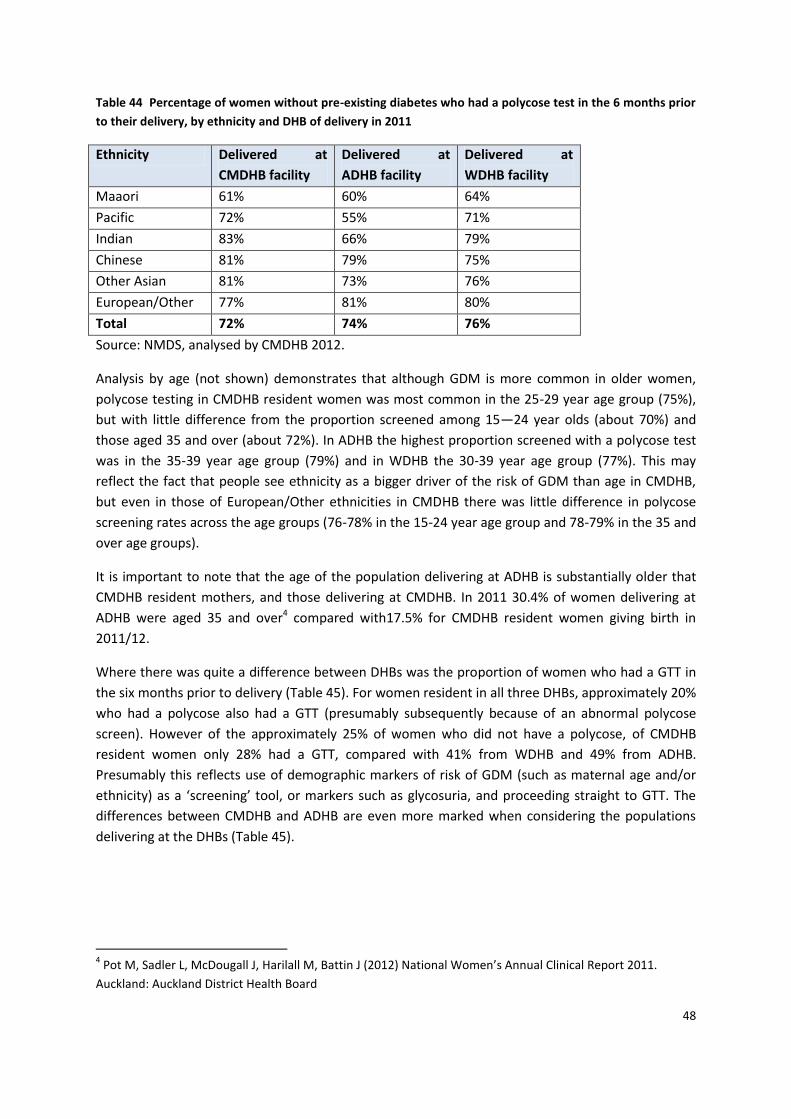
48
Table 44 Percentage of women without pre-existing diabetes who had a polycose test in the 6 months prior
to their delivery, by ethnicity and DHB of delivery in 2011
Ethnicity Delivered at
CMDHB facility
Delivered at
ADHB facility
Delivered at
WDHB facility
Maaori 61% 60% 64%
Pacific 72% 55% 71%
Indian 83% 66% 79%
Chinese 81% 79% 75%
Other Asian 81% 73% 76%
European/Other 77% 81% 80%
Total 72% 74% 76%
Source: NMDS, analysed by CMDHB 2012.
Analysis by age (not shown) demonstrates that although GDM is more common in older women,
polycose testing in CMDHB resident women was most common in the 25-29 year age group (75%),
but with little difference from the proportion screened among 15—24 year olds (about 70%) and
those aged 35 and over (about 72%). In ADHB the highest proportion screened with a polycose test
was in the 35-39 year age group (79%) and in WDHB the 30-39 year age group (77%). This may
reflect the fact that people see ethnicity as a bigger driver of the risk of GDM than age in CMDHB,
but even in those of European/Other ethnicities in CMDHB there was little difference in polycose
screening rates across the age groups (76-78% in the 15-24 year age group and 78-79% in the 35 and
over age groups).
It is important to note that the age of the population delivering at ADHB is substantially older that
CMDHB resident mothers, and those delivering at CMDHB. In 2011 30.4% of women delivering at
ADHB were aged 35 and over4 compared with17.5% for CMDHB resident women giving birth in
2011/12.
Where there was quite a difference between DHBs was the proportion of women who had a GTT in
the six months prior to delivery (Table 45). For women resident in all three DHBs, approximately 20%
who had a polycose also had a GTT (presumably subsequently because of an abnormal polycose
screen). However of the approximately 25% of women who did not have a polycose, of CMDHB
resident women only 28% had a GTT, compared with 41% from WDHB and 49% from ADHB.
Presumably this reflects use of demographic markers of risk of GDM (such as maternal age and/or
ethnicity) as a ‘screening’ tool, or markers such as glycosuria, and proceeding straight to GTT. The
differences between CMDHB and ADHB are even more marked when considering the populations
delivering at the DHBs (Table 45).
4 Pot M, Sadler L, McDougall J, Harilall M, Battin J (2012) National Women’s Annual Clinical Report 2011.
Auckland: Auckland District Health Board
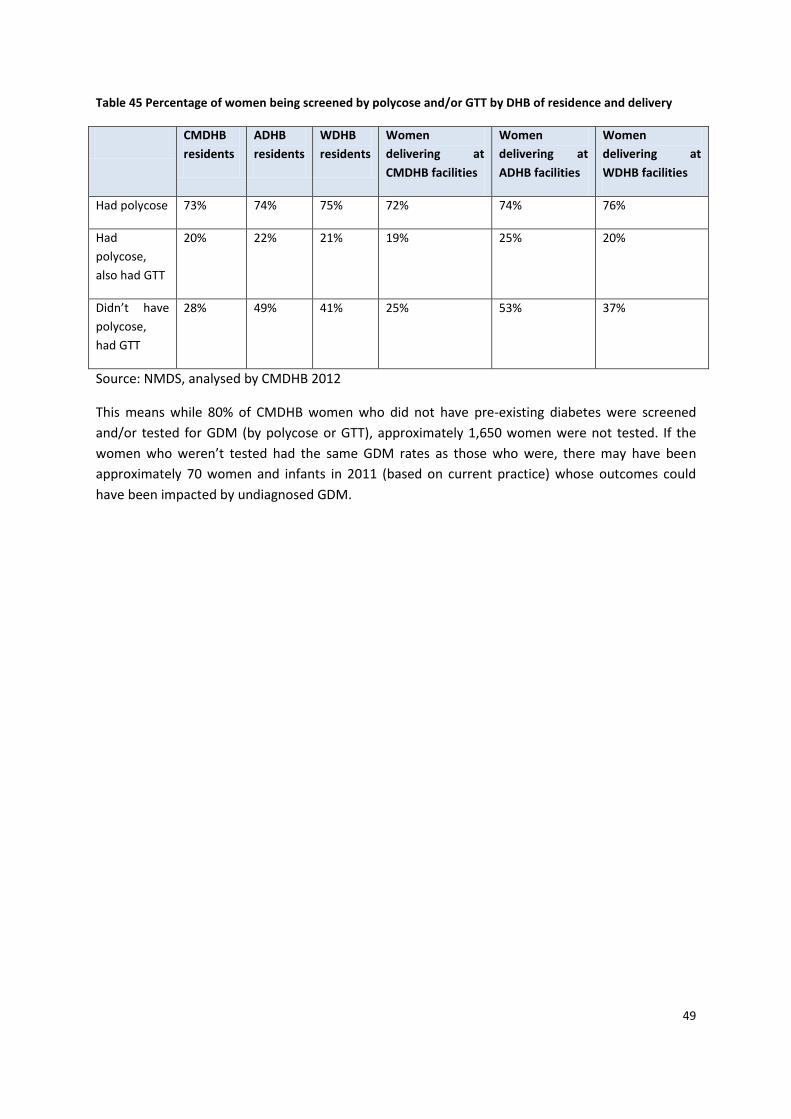
49
Table 45 Percentage of women being screened by polycose and/or GTT by DHB of residence and delivery
CMDHB
residents
ADHB
residents
WDHB
residents
Women
delivering at
CMDHB facilities
Women
delivering at
ADHB facilities
Women
delivering at
WDHB facilities
Had polycose 73% 74% 75% 72% 74% 76%
Had
polycose,
also had GTT
20% 22% 21% 19% 25% 20%
Didn’t have
polycose,
had GTT
28% 49% 41% 25% 53% 37%
Source: NMDS, analysed by CMDHB 2012
This means while 80% of CMDHB women who did not have pre-existing diabetes were screened
and/or tested for GDM (by polycose or GTT), approximately 1,650 women were not tested. If the
women who weren’t tested had the same GDM rates as those who were, there may have been
approximately 70 women and infants in 2011 (based on current practice) whose outcomes could
have been impacted by undiagnosed GDM.
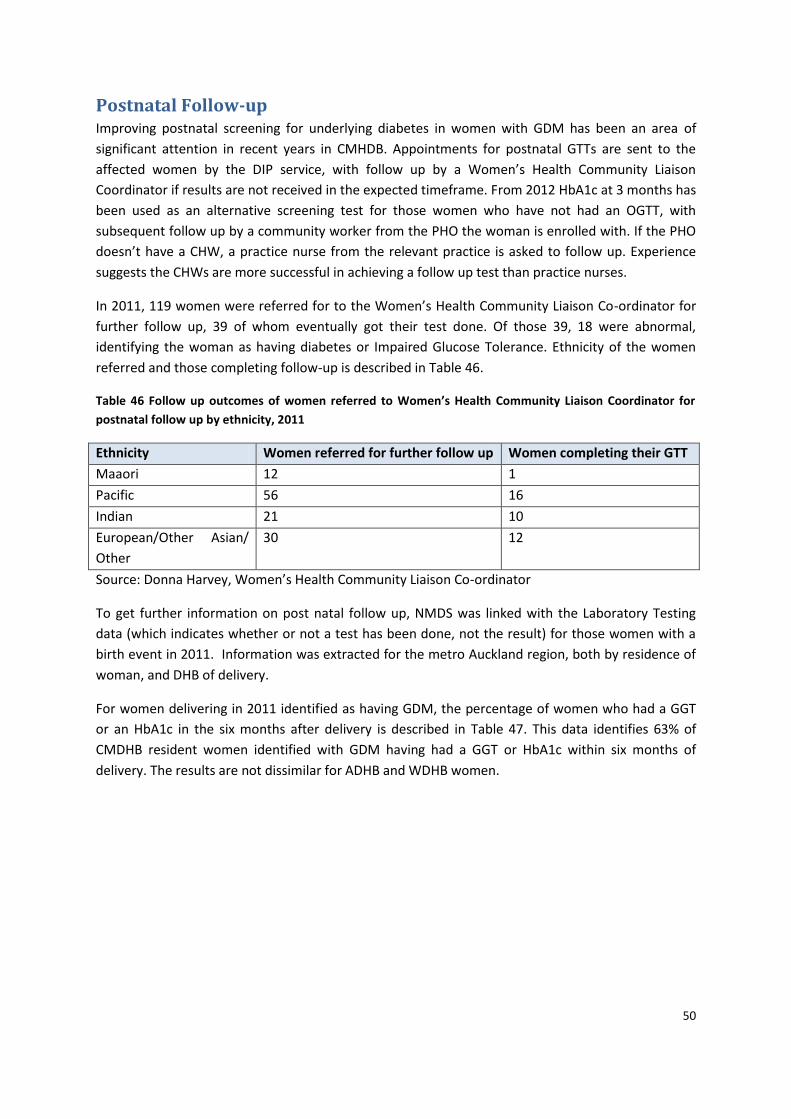
50
Postnatal Follow-up Improving postnatal screening for underlying diabetes in women with GDM has been an area of
significant attention in recent years in CMHDB. Appointments for postnatal GTTs are sent to the
affected women by the DIP service, with follow up by a Women’s Health Community Liaison
Coordinator if results are not received in the expected timeframe. From 2012 HbA1c at 3 months has
been used as an alternative screening test for those women who have not had an OGTT, with
subsequent follow up by a community worker from the PHO the woman is enrolled with. If the PHO
doesn’t have a CHW, a practice nurse from the relevant practice is asked to follow up. Experience
suggests the CHWs are more successful in achieving a follow up test than practice nurses.
In 2011, 119 women were referred for to the Women’s Health Community Liaison Co-ordinator for
further follow up, 39 of whom eventually got their test done. Of those 39, 18 were abnormal,
identifying the woman as having diabetes or Impaired Glucose Tolerance. Ethnicity of the women
referred and those completing follow-up is described in Table 46.
Table 46 Follow up outcomes of women referred to Women’s Health Community Liaison Coordinator for
postnatal follow up by ethnicity, 2011
Ethnicity Women referred for further follow up Women completing their GTT
Maaori 12 1
Pacific 56 16
Indian 21 10
European/Other Asian/
Other
30 12
Source: Donna Harvey, Women’s Health Community Liaison Co-ordinator
To get further information on post natal follow up, NMDS was linked with the Laboratory Testing
data (which indicates whether or not a test has been done, not the result) for those women with a
birth event in 2011. Information was extracted for the metro Auckland region, both by residence of
woman, and DHB of delivery.
For women delivering in 2011 identified as having GDM, the percentage of women who had a GGT
or an HbA1c in the six months after delivery is described in Table 47. This data identifies 63% of
CMDHB resident women identified with GDM having had a GGT or HbA1c within six months of
delivery. The results are not dissimilar for ADHB and WDHB women.
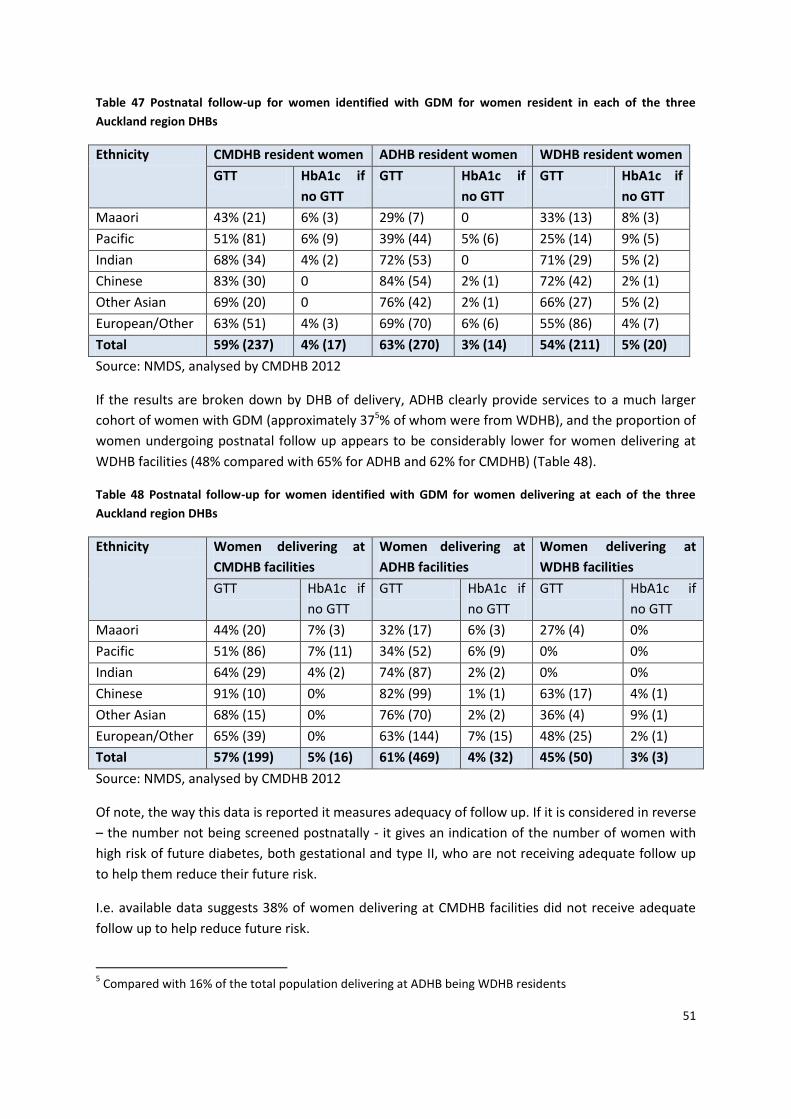
51
Table 47 Postnatal follow-up for women identified with GDM for women resident in each of the three
Auckland region DHBs
Ethnicity CMDHB resident women ADHB resident women WDHB resident women
GTT HbA1c if
no GTT
GTT HbA1c if
no GTT
GTT HbA1c if
no GTT
Maaori 43% (21) 6% (3) 29% (7) 0 33% (13) 8% (3)
Pacific 51% (81) 6% (9) 39% (44) 5% (6) 25% (14) 9% (5)
Indian 68% (34) 4% (2) 72% (53) 0 71% (29) 5% (2)
Chinese 83% (30) 0 84% (54) 2% (1) 72% (42) 2% (1)
Other Asian 69% (20) 0 76% (42) 2% (1) 66% (27) 5% (2)
European/Other 63% (51) 4% (3) 69% (70) 6% (6) 55% (86) 4% (7)
Total 59% (237) 4% (17) 63% (270) 3% (14) 54% (211) 5% (20)
Source: NMDS, analysed by CMDHB 2012
If the results are broken down by DHB of delivery, ADHB clearly provide services to a much larger
cohort of women with GDM (approximately 375% of whom were from WDHB), and the proportion of
women undergoing postnatal follow up appears to be considerably lower for women delivering at
WDHB facilities (48% compared with 65% for ADHB and 62% for CMDHB) (Table 48).
Table 48 Postnatal follow-up for women identified with GDM for women delivering at each of the three
Auckland region DHBs
Ethnicity Women delivering at
CMDHB facilities
Women delivering at
ADHB facilities
Women delivering at
WDHB facilities
GTT HbA1c if
no GTT
GTT HbA1c if
no GTT
GTT HbA1c if
no GTT
Maaori 44% (20) 7% (3) 32% (17) 6% (3) 27% (4) 0%
Pacific 51% (86) 7% (11) 34% (52) 6% (9) 0% 0%
Indian 64% (29) 4% (2) 74% (87) 2% (2) 0% 0%
Chinese 91% (10) 0% 82% (99) 1% (1) 63% (17) 4% (1)
Other Asian 68% (15) 0% 76% (70) 2% (2) 36% (4) 9% (1)
European/Other 65% (39) 0% 63% (144) 7% (15) 48% (25) 2% (1)
Total 57% (199) 5% (16) 61% (469) 4% (32) 45% (50) 3% (3)
Source: NMDS, analysed by CMDHB 2012
Of note, the way this data is reported it measures adequacy of follow up. If it is considered in reverse
– the number not being screened postnatally - it gives an indication of the number of women with
high risk of future diabetes, both gestational and type II, who are not receiving adequate follow up
to help them reduce their future risk.
I.e. available data suggests 38% of women delivering at CMDHB facilities did not receive adequate
follow up to help reduce future risk.
5 Compared with 16% of the total population delivering at ADHB being WDHB residents
52
Other comparisons National Women’s Hospital Annual Report
The National Women’s Hospital Annual Report for 2011 was available for comparison. Data for the
report was drawn from the National Women’s Healthware clinical database. The HealthWare data
for non-NW LMCs is entered by a specific administrator for women delivering at ADHB, and so is
considerably more complete that CMDHB HealthWare data, while NW clerks and midwives enter the
data for NW patients. Data is cleaned in various ways to improve data quality.
The report describes a total number of 7493 women birthing at National Women’s in 2011 and a
further 33 birthing before arrival (giving a total of 7523 birth outcomes). The Caesarean rate was
32.5% and 11% were operative vaginal deliveries. 30.4% of mothers were aged 35 or more and 6.1%
were aged 40 or more. The percentage aged 35 or more was significantly greater than the mean for
Women’s Hospitals Australasia6 of 23.4%. 69% of women delivering at NW were ADHB residents. In
2011, 7.9% of mothers giving birth at NW were prioritised as Maaori, 13.5% Pacific, 7.3% Indian,
20.3% Chinese and Other Asian, 50.9% European/Other.
In 2011 approximately 11% of women who birthed at NW were reported as diagnosed with GDM
and 1.3% with pre-existing diabetes. The GDM rate had gone up considerably from previous years -
rates for 2008-2010 were 6-7%. Discussion with CMDHB clinicians suggests this may coincide with
increased use of HbA1c screening in early pregnancy in ADHB from late 2010.
The Caesarean Section rate for women with GDM was approximately 36% and operative vaginal
delivery approximately 11%. 58% of women were reported to have a postnatal GTT (480 women).
This was a decrease from previous levels of testing of 67-68% for 2008-2010, and 72-78% for 2003-
2007. 78% of the GTTs in 2011 were normal and 3.1% diabetic.
Further unpublished analysis of GDM rates by ethnicity demonstrated considerable differences by
ethnicity – 5.5% for European mothers, 10.2% Maaori, 16.% Pacific and 22% Indian (personal
communication Lesley McCowan).
National Women’s population compared with the population delivering at CMDHB
The population of CMDHB women giving birth in 2011 was very much younger than the population
delivering at NW – only 17.5% of women were aged 35 or more and 3.9% aged 40 or more. The
ethnicity mix is quite different with much higher proportions of Maaori and Pacific women in
CMHDB. These factors are important in interpreting GDM rates.
The metro Auckland NMDS extract undertaken for this paper to consider GDM screening and
postnatal follow-up has GDM rates for ADHB facilities consistent with the Healthware derived rates
in the NW Annual report – 10.4% overall, 6% European/Other, 9.1% for Maaori, 15.5% for Pacific,
21.8% for Indian. These GDM rates are considerably higher than the rates for the CMDHB population
and the population delivering at CMDHB facilities, especially the rates for non-European/Other
women. To explore how much of this difference was due to the difference between the age
6 Benchmarking group for contributing New Zealand and Australian maternity units with level 3 neonatal ICUs
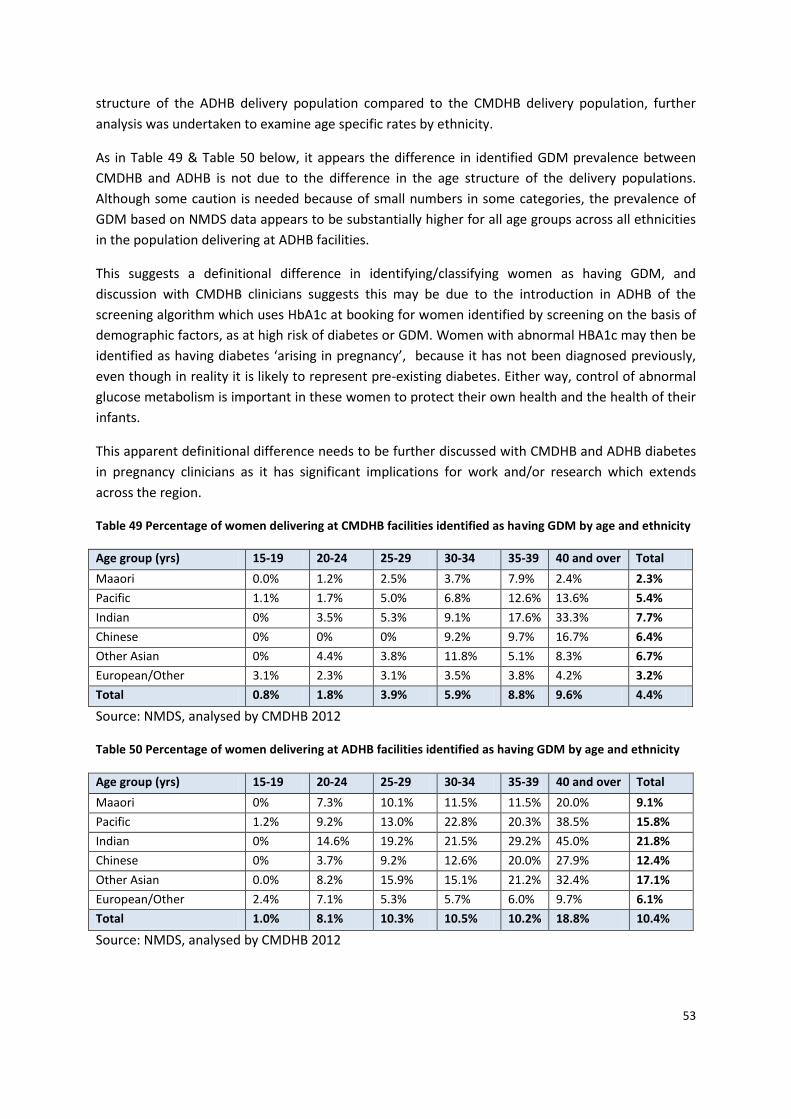
53
structure of the ADHB delivery population compared to the CMDHB delivery population, further
analysis was undertaken to examine age specific rates by ethnicity.
As in Table 49 & Table 50 below, it appears the difference in identified GDM prevalence between
CMDHB and ADHB is not due to the difference in the age structure of the delivery populations.
Although some caution is needed because of small numbers in some categories, the prevalence of
GDM based on NMDS data appears to be substantially higher for all age groups across all ethnicities
in the population delivering at ADHB facilities.
This suggests a definitional difference in identifying/classifying women as having GDM, and
discussion with CMDHB clinicians suggests this may be due to the introduction in ADHB of the
screening algorithm which uses HbA1c at booking for women identified by screening on the basis of
demographic factors, as at high risk of diabetes or GDM. Women with abnormal HBA1c may then be
identified as having diabetes ‘arising in pregnancy’, because it has not been diagnosed previously,
even though in reality it is likely to represent pre-existing diabetes. Either way, control of abnormal
glucose metabolism is important in these women to protect their own health and the health of their
infants.
This apparent definitional difference needs to be further discussed with CMDHB and ADHB diabetes
in pregnancy clinicians as it has significant implications for work and/or research which extends
across the region.
Table 49 Percentage of women delivering at CMDHB facilities identified as having GDM by age and ethnicity
Age group (yrs) 15-19 20-24 25-29 30-34 35-39 40 and over Total
Maaori 0.0% 1.2% 2.5% 3.7% 7.9% 2.4% 2.3%
Pacific 1.1% 1.7% 5.0% 6.8% 12.6% 13.6% 5.4%
Indian 0% 3.5% 5.3% 9.1% 17.6% 33.3% 7.7%
Chinese 0% 0% 0% 9.2% 9.7% 16.7% 6.4%
Other Asian 0% 4.4% 3.8% 11.8% 5.1% 8.3% 6.7%
European/Other 3.1% 2.3% 3.1% 3.5% 3.8% 4.2% 3.2%
Total 0.8% 1.8% 3.9% 5.9% 8.8% 9.6% 4.4%
Source: NMDS, analysed by CMDHB 2012
Table 50 Percentage of women delivering at ADHB facilities identified as having GDM by age and ethnicity
Age group (yrs) 15-19 20-24 25-29 30-34 35-39 40 and over Total
Maaori 0% 7.3% 10.1% 11.5% 11.5% 20.0% 9.1%
Pacific 1.2% 9.2% 13.0% 22.8% 20.3% 38.5% 15.8%
Indian 0% 14.6% 19.2% 21.5% 29.2% 45.0% 21.8%
Chinese 0% 3.7% 9.2% 12.6% 20.0% 27.9% 12.4%
Other Asian 0.0% 8.2% 15.9% 15.1% 21.2% 32.4% 17.1%
European/Other 2.4% 7.1% 5.3% 5.7% 6.0% 9.7% 6.1%
Total 1.0% 8.1% 10.3% 10.5% 10.2% 18.8% 10.4%
Source: NMDS, analysed by CMDHB 2012
54
Discussion Data pulled together for this paper has highlighted a number of key issues for the Diabetes in
Pregnancy service at CMDHB and for the wider work to strengthen the CMDHB population health
approach which includes prioritising interventions that can improve outcomes related to the ‘First
2000 Days’ (from peri-conception to age five years).
1. While the number of births per year for the CMDHB resident population has remained relatively
stable in recent years, the crude prevalence of diabetes in pregnancy, both gestational and pre-
existing diabetes has increased. This is likely due to the changing ethnicity mix of the population and
high obesity rates. Assuming a stable birth cohort size continues, if these increases continue, this
would mean an increase of nearly 25% (8% per annum) on 2011/12 volumes of CMDHB women
needing to be managed by diabetes in pregnancy services by 2014/15. Although not all of these
women will be managed by the CMDHB service, there are also women from other DHBs who deliver
at CMDHB and require care under the CMDHB DIP service.
A change to the algorithm for screening for pre-existing diabetes in early pregnancy, and potential
changes to the diagnostic criteria for GDM would further increase the potential volumes for the DIP
service. The potential extra volumes suggest that by 2014/15 there could be up to 80% more women
needing to be seen than the numbers referred to the service in the 2011/12 financial year. This has
major implications for the multidisciplinary work force involved in the Diabetes in Pregnancy service
and model of care planning.
2. Data about the rates of polycose and GTT testing suggest that approximately 20% of pregnant
CMDHB resident women are not currently being tested for GDM by either method. Rates of polycose
testing are lowest for Maaori women. In 2011 overall this potentially resulted in approximately 70
women and their infants whose outcomes could have been impacted by undiagnosed GDM.
In addition, GDM rates based on NMDS coding are considerably higher for the population delivering
at ADHB than the rates for the CMDHB resident population and the population delivering at CMDHB
facilities, especially the rates for non-European/Other women. Age specific rates by ethnicity,
although needing to be interpreted with caution because of small numbers in some categories,
suggest this is not just due to the much older cohort of women delivering at ADHB, as rates were
higher for the ADHB population across all age groups. This suggests a definitional difference and
discussion with CMDHB clinicians suggests this may be due to the introduction in ADHB of the
screening algorithm which uses HbA1c at booking for women at high risk of diabetes or GDM.
Further discussion with regional clinicians may be useful to ensure common understanding of the
interpretation of HbA1c in pregnancy. It would seem likely that a significant proportion of those
being detected by HbA1c actually have pre-existing diabetes rather than GDM, although current
practice in Australasia is to identify this situation as GDM (Nankervis et al, 2013). This needs to be
further discussed with diabetes in pregnancy clinicians as it has significant implications for work
and/or research which extends across the region.
55
There is also a perception among CMDHB midwifery and obstetric staff that polycose screening,
which is not weight-adjusted and seems a relatively small carbohydrate load compared with normal
consumption for many women in CMDHB, may not be an adequate screening test in the CMDHB
population. It would be helpful to review the sensitivity and specificity of polycose as a screening
test and how adequately it has been validated for populations such as that of CMDHB. Of note the
recently released Australasian Diabetes In Pregnancy Society (ADIPS) guidelines for testing and
diagnosis of GDM in Australia recommends the use of OGTT rather than polycose, stating ‘the
glucose challenge test lacks both sensitivity and specificity and is no longer part of the diagnostic
algorithm’ (Nankervis et al, 2013). Presumably this recommendation will considered by the group
working on the New Zealand guidelines.
3. To provide continuity of primary maternity care and address capacity issues for the DIP service, it
is important that LMCs and general practice teams involved in shared care are equipped to provide
high quality primary maternity care for women with diabetes in pregnancy, in collaboration with the
specialised care provided by the DIP service. The interface of the DIP service with these groups is an
area where the service sees significant opportunity for improvement. To address safety concerns for
primary care providers there needs to be a clear framework for accountability and information
sharing; this relates to both to referral to the service and communication between various members
of the service team and primary providers when women are under the care of the service.
There is also a need for consistent messages about nutrition and self-care across LMCs and the
Diabetes in Pregnancy service team members. For example while obesity and excess gestational
weight gain are significant issues for the CMDHB population, anecdotally women from some cultural
backgrounds may ‘starve themselves’ or restrict their diets to very low carbohydrate intake for fear
of taking medication in pregnancy (personal communication, Elaine Chong, dietitian for the DIP
service). The potential negative impacts of this kind of nutrition on the baby developing in utero are
recognised and communicated during antenatal visits but could be further reinforced by all health
professionals involved in the care of women with diabetes in pregnancy.
4. Dietetic services are an important component of the Diabetes in Pregnancy service model of care.
Over the years of increasing patient numbers through the service there has not been any increase in
dietitian time dedicated to the service but use of resources has been maximised by initiating group
education sessions to complement individual sessions with the dietitian, and a triaging system. The
group sessions have been well received patients and feedback from other members of the Diabetes
in Pregnancy team who see the women subsequently suggests they are effective at engaging women
in increased self-care of the diabetes and overall nutrition (Chong, 2008). This is consistent with
experience of group education in smoking cessation support, where group education has been
shown to be more effective than on-on-one intervention (Brose et al, 2011).
5. The biggest increases in the prevalence of diabetes in pregnancy in recent years for women
resident in CMDHB have been in women of Indian and other Asian ethnicities. However for the DIP
56
service at CMDHB, this increase has been masked to some extent because for various reasons only
30% of CMDHB Chinese women with diabetes in pregnancy deliver at CMDHB facilities; most of the
rest deliver at ADHB.
Indian women have the highest prevalence of diabetes in pregnancy at just under 11% in 2011/12.
Under the protocol for the collection and use of ethnicity data for the health sector (Ministry of
Health, 2004) Fijian Indian women are classified as Indian. However experience from working with
these women in the DIP service suggests that many of them have a culture related to nutrition and
physical activity that is more like their Pacific neighbours than traditional Indian patterns. If possible,
it would be useful to explore the numbers of women identified as Fijian Indian among CMDHB
residents identified as having DIP as well as those from other DHBs under the care of CMDHB, so as
to plan appropriate management and preventive services for them. If this data is not currently
available, efforts could be made over the next year to improve identification of this group to support
service planning.
6. The risk of gestational diabetes increases with increasing body weight. However it is noteworthy
that from data from the CMDHB DIP service, 26% of women referred to the service who were of
European/Other/Unknown ethnicities with GDM had BMIs within the ‘normal’ range (<25)
(assuming accurate ethnicity coding). This has implications for the use of risk factor criteria for GDM
screening which relate to body weight.
7. While women with GDM represent 75% of those referred to the DIP service at CMDHB, issues
related to pre-existing diabetes in pregnancy are of principle concern for staff of the DIP service. In
their experience young women with diabetes frequently seem to have very limited understanding of
the risks to their pregnancy and the future health of their child from poorly controlled, pre-existing
diabetes. This is important information to feed back to the primary care community in CMDHB. DIP
staff observe that some of these women may live in extended family situations and have limited
influence over the food and drink available to themselves and the household. Hence a whole
household/family approach, which is culturally tailored, is important to try to effect change. Poverty
and the easy accessibility of cheap, high fat, high energy foods are also seen as important factors.
Many pregnancies are unplanned – there is no data on this in relation to women with diabetes
specifically but the Growing Up in New Zealand study found that 50% of pregnancies to CMDHB
women in their cohort were unplanned (Morton et al, 2010). Together these factors result in lost
opportunities to improve the peri-conceptual environment by optimising diabetes control prior to
pregnancy. This is an area where improvements could be made by working with primary care
providers and the communities of CMDHB. Localities developments give the opportunity to link DIP
specialist midwives to general practice clusters to support training and availability for advice.
8. Women with GDM have a significant risk of future Type 2 diabetes, with a Lancet review
concluding that women with GDM have a seven fold increase in developing Type 2 diabetes
57
compared with women who are normoglycaemic in pregnancy (Bellamy et al, 2009). There have
been recent regional discussions about using HbA1c at 12 weeks postpartum as an alternative to the
currently recommended 75gm OGTT at six weeks for post-partum diabetes screening. This would
align with the use of HbA1c instead of the OGTT in the general population, and as it is much easier
for women to do this test than an OGTT, it is anticipated this change would improve postnatal
screening rates.
Currently available data suggests 38% of women delivering in CMDHB facilities are not getting
adequate follow up postnatally to optimally help them manage their future risk. There are important
opportunities to prevent future gestational and non-gestational diabetes in working with women
with gestational diabetes and their families, and a current project exploring this is underway, funded
from the previous ‘HEHA’ funding. This area needs further review as part of the development of the
‘First 2000 Days’ population health approach. Again a whole of household/family approach will be
key and has potential to maximise impacts.
9. There is regional interest in developing a registry for women with gestational diabetes to improve
follow up and be able to track outcomes. At present this would need manual registration, but there
is potential in the future for some degree of automation using the TestSafe database. Use of
TestSafe would also offer potential to explore how to intervene in a more systematic manner
postnatally and to evaluate interventions trialled.
10. It is recognised that poor health literacy is a major barrier to improving health outcomes for the
CMDHB population (Winnard et al, 2012). The DIP service has attempted to use innovative methods
to support health education for women with diabetes in pregnancy, implementing group education
and revision of nutrition information to better reflect population food preferences. The service
would also be keen to explore use of social media such as You-tube, nutrition related applications
for Smartphones and web-based technologies as means to improve community understanding about
diabetes in pregnancy but it would be important to understand which groups in our community this
would actually reach so as not to increase rather than decrease inequalities.

58
59
References Bell R, Tennant P, Bilous R, Rank J (2012) Peri-conception hyperglycaemia and nephropathy are
associated with risk of congenital anomaly in women with pre-existing diabetes: A population-based
cohort study. Diabetologia, 55(4): 936-947
Bellamy L, Casas JP, Hingorani AD, Williams D (2009) Type 2 diabetes mellitus after gestational
diabetes: a systematic review and meta-analysis. Lancet 373(9677):1773-9
Brose, L.S., et al (2011) What makes for an effective stop-smoking service? Thorax 66(10): p. 924-6.
Chong, E (2008) Evaluation report. Group Education trial for new diabetes and pregnancy patients.
Dietetics Services, CMDHB.
Gluckman P, Hanson M (2012) Fat Fate & Disease. Why exercise and diet are not enough. Oxford:
Oxford University Press
Hanson & Gluckman (2011) Developmental origins of noncommunicable disease: population and
public health implications. American Journal of Clinical Nutrition 94(suppl):1754S–8S
Jackson C (2011) Perinatal mortality in Counties Manukau. Auckland: CMDHB.
Nankervis A, McIntyre HD, Moses R, Ross GP, Callaway L, Porter C, Jeffries W, Boorman C, De Vries B for the Australasian Diabetes in Pregnancy Society (2013) Australasian Diabetes In Pregnancy Society (ADIPS) Consensus Guidelines for the Testing and Diagnosis of Gestational Diabetes Mellitus in Australia. ADIPS: Australia. Available from http://www.adips.org/news.asp
Lim EL, Burden T, Marshall SM, Davison JM, et al (2009) Intrauterine growth rate in pregnancies
complicated by type 1, type 2 and gestational diabetes. Obstetric Medicine 2(1)21-25
Ministry of Health (2004) Ethnicity data protocols for the health and disability sector. Wellington:
Ministry of Health.
Morton SMB, et al (2010) Report 1: Before we are born. Growing Up in New Zealand. Auckland:
University of Auckland.
Paterson, R., Candy, A., Lilo, S., McCowan, L., Naden, R. & O’Brien, M (2012) External Review of Maternity Care in the Counties Manukau District: Counties Manukau District Health Board Scragg R (2010) Asian health in Aotearoa 2006-2007. Trends since 2002-2003. Auckland: Northern District Support Agency. Simmons D, Rowan J, Reid R, & Campbell N (2008) Screening, diagnosis and services for women with
gestational diabetes mellitus (GDM) in New Zealand: a technical report from the National GDM
Technical Working Party. The New Zealand Medical Journal. 121(1270), 74-86.
Wijayaratna A (2011) An overview of diabetes in pregnancy in the Counties Manukau District health
Board area. Counties Manukau: Diabetes Projects Trust
60
Winnard D, Anderson P, Paraone C (2012) A Strengthened Population Health Approach for CMDHB.
Discussion paper for ELT. Appendix Six, Health Literacy.
Winnard D, Chan WC, Wang K, Papa D (2012) Diabetes prevalence in CMDHB – Update. Unpublished
Memo.
Yapa M, Simmons D (2000). Screening for gestational diabetes mellitus in a multiethnic population in
New Zealand. Diabetes Research and Clinical Practice 48(3):217-223
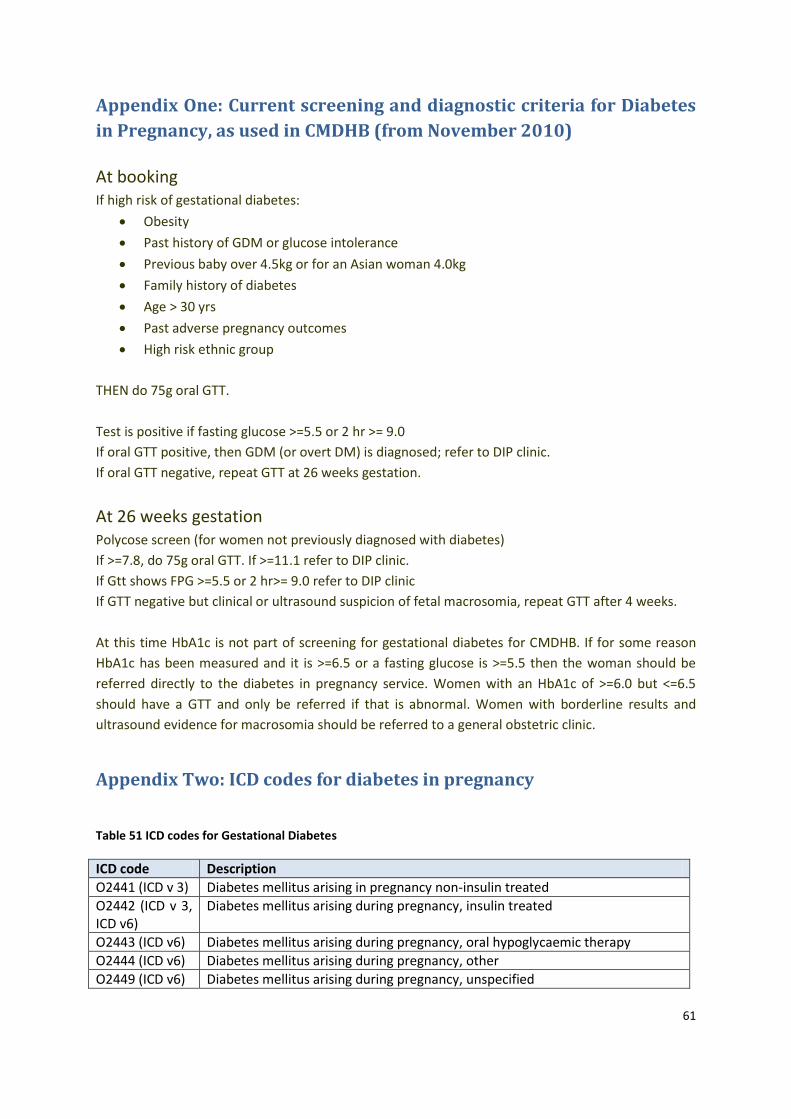
61
Appendix One: Current screening and diagnostic criteria for Diabetes
in Pregnancy, as used in CMDHB (from November 2010)
At booking If high risk of gestational diabetes:
Obesity
Past history of GDM or glucose intolerance
Previous baby over 4.5kg or for an Asian woman 4.0kg
Family history of diabetes
Age > 30 yrs
Past adverse pregnancy outcomes
High risk ethnic group
THEN do 75g oral GTT.
Test is positive if fasting glucose >=5.5 or 2 hr >= 9.0
If oral GTT positive, then GDM (or overt DM) is diagnosed; refer to DIP clinic.
If oral GTT negative, repeat GTT at 26 weeks gestation.
At 26 weeks gestation Polycose screen (for women not previously diagnosed with diabetes)
If >=7.8, do 75g oral GTT. If >=11.1 refer to DIP clinic.
If Gtt shows FPG >=5.5 or 2 hr>= 9.0 refer to DIP clinic
If GTT negative but clinical or ultrasound suspicion of fetal macrosomia, repeat GTT after 4 weeks.
At this time HbA1c is not part of screening for gestational diabetes for CMDHB. If for some reason
HbA1c has been measured and it is >=6.5 or a fasting glucose is >=5.5 then the woman should be
referred directly to the diabetes in pregnancy service. Women with an HbA1c of >=6.0 but <=6.5
should have a GTT and only be referred if that is abnormal. Women with borderline results and
ultrasound evidence for macrosomia should be referred to a general obstetric clinic.
Appendix Two: ICD codes for diabetes in pregnancy
Table 51 ICD codes for Gestational Diabetes
ICD code Description
O2441 (ICD v 3) Diabetes mellitus arising in pregnancy non-insulin treated
O2442 (ICD v 3, ICD v6)
Diabetes mellitus arising during pregnancy, insulin treated
O2443 (ICD v6) Diabetes mellitus arising during pregnancy, oral hypoglycaemic therapy
O2444 (ICD v6) Diabetes mellitus arising during pregnancy, other
O2449 (ICD v6) Diabetes mellitus arising during pregnancy, unspecified
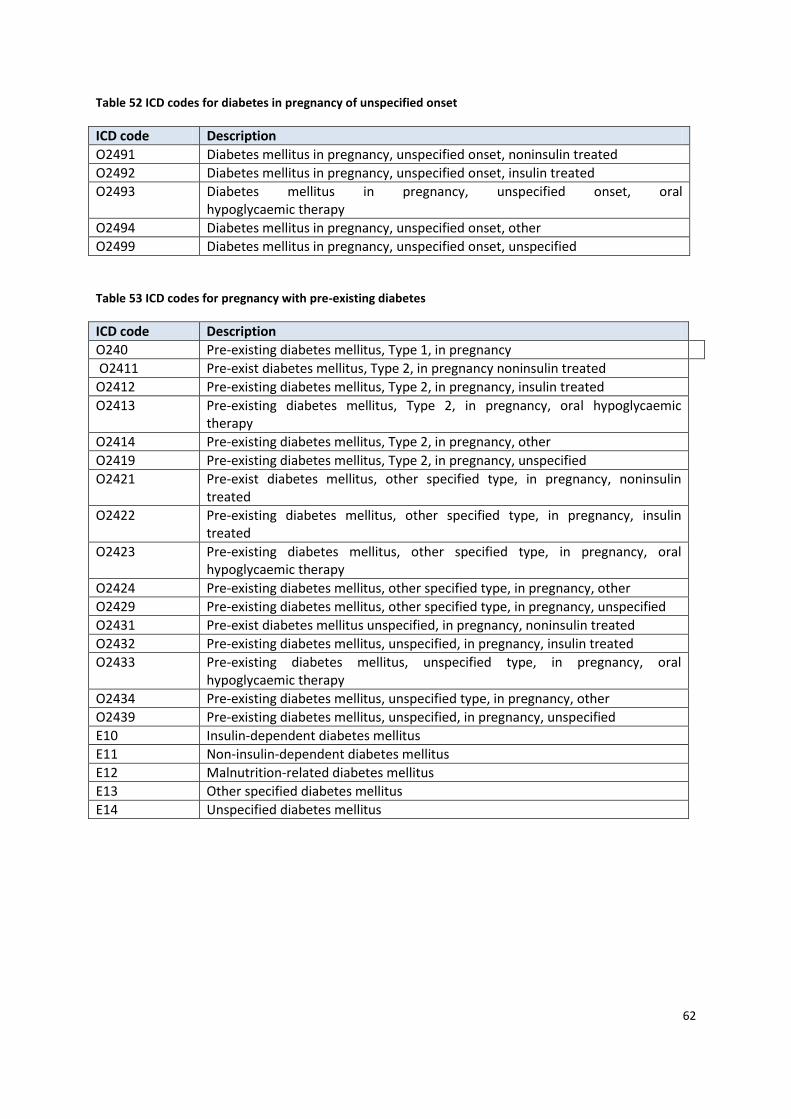
62
Table 52 ICD codes for diabetes in pregnancy of unspecified onset
ICD code Description
O2491 Diabetes mellitus in pregnancy, unspecified onset, noninsulin treated
O2492 Diabetes mellitus in pregnancy, unspecified onset, insulin treated
O2493 Diabetes mellitus in pregnancy, unspecified onset, oral hypoglycaemic therapy
O2494 Diabetes mellitus in pregnancy, unspecified onset, other
O2499 Diabetes mellitus in pregnancy, unspecified onset, unspecified
Table 53 ICD codes for pregnancy with pre-existing diabetes
ICD code Description
O240 Pre-existing diabetes mellitus, Type 1, in pregnancy
O2411 Pre-exist diabetes mellitus, Type 2, in pregnancy noninsulin treated
O2412 Pre-existing diabetes mellitus, Type 2, in pregnancy, insulin treated
O2413 Pre-existing diabetes mellitus, Type 2, in pregnancy, oral hypoglycaemic therapy
O2414 Pre-existing diabetes mellitus, Type 2, in pregnancy, other
O2419 Pre-existing diabetes mellitus, Type 2, in pregnancy, unspecified
O2421 Pre-exist diabetes mellitus, other specified type, in pregnancy, noninsulin treated
O2422 Pre-existing diabetes mellitus, other specified type, in pregnancy, insulin treated
O2423 Pre-existing diabetes mellitus, other specified type, in pregnancy, oral hypoglycaemic therapy
O2424 Pre-existing diabetes mellitus, other specified type, in pregnancy, other
O2429 Pre-existing diabetes mellitus, other specified type, in pregnancy, unspecified
O2431 Pre-exist diabetes mellitus unspecified, in pregnancy, noninsulin treated
O2432 Pre-existing diabetes mellitus, unspecified, in pregnancy, insulin treated
O2433 Pre-existing diabetes mellitus, unspecified type, in pregnancy, oral hypoglycaemic therapy
O2434 Pre-existing diabetes mellitus, unspecified type, in pregnancy, other
O2439 Pre-existing diabetes mellitus, unspecified, in pregnancy, unspecified
E10 Insulin-dependent diabetes mellitus
E11 Non-insulin-dependent diabetes mellitus
E12 Malnutrition-related diabetes mellitus
E13 Other specified diabetes mellitus
E14 Unspecified diabetes mellitus


![Diabetes In Pregnancy[1]](https://static.fdocuments.us/doc/165x107/55a74aa61a28ab66248b46b1/diabetes-in-pregnancy1.jpg)