Diabetes Center Hippokration Hospital B. Karamanos 2011 Gestational Diabetes in the Mediterranean...
24
B. Karamanos 2011 Diabetes Center Hippokration Hospital Gestational Diabetes in the Mediterranean Region Risk factors, pregnancy outcome, nutritional contributors Nutritional aspects B. Karamanos MD, PhD Athens, Greece 11 April 2011 Morocco
-
Upload
marilynn-benson -
Category
Documents
-
view
221 -
download
4
Transcript of Diabetes Center Hippokration Hospital B. Karamanos 2011 Gestational Diabetes in the Mediterranean...
B. Karamanos 2011
Diabetes CenterHippokration Hospital
Gestational Diabetes in the Mediterranean RegionRisk factors, pregnancy outcome, nutritional
contributors
Nutritional aspects
B. Karamanos MD, PhDAthens, Greece
11 April 2011Morocco

B. Karamanos 2011
Diabetes CenterHippokration Hospital
European Journal of Clinical Nutrition (2002) 56, 983–991
Diabetologia (2004) 47:367–376
European Journal of Clinical Nutrition (2006) 60, 1376–1383
Diabetes Care 26:302–307, 2003

B. Karamanos 2011
Diabetes CenterHippokration Hospital
Comparison of subjects with newly diagnosed diabetes or IFG, by fasting
glucose, with matched controls
DM p Control IFG p Control
Fat % 34,7 0,035 30,4 30,6 NS 32,1
Diabetes Care 26:302–307, 2003

B. Karamanos 2011
Diabetes CenterHippokration Hospital
Aim of the study
To explore if GDM incidence is
associated with dietary factors

B. Karamanos 2011
Diabetes CenterHippokration Hospital
Subjects and Methods
• 1254 pregnant women, in 11 Mediterranean
countries participated to the main study
• 947 pregnant women, in 9 Mediterranean
countries participated to the nutrition part
of the study
• 834 pregnant women had valid dietary
questionnaires and were included in the
present analysis
B. Karamanos 2011
Diabetes CenterHippokration Hospital
B. Karamanos 2011
Diabetes CenterHippokration Hospital
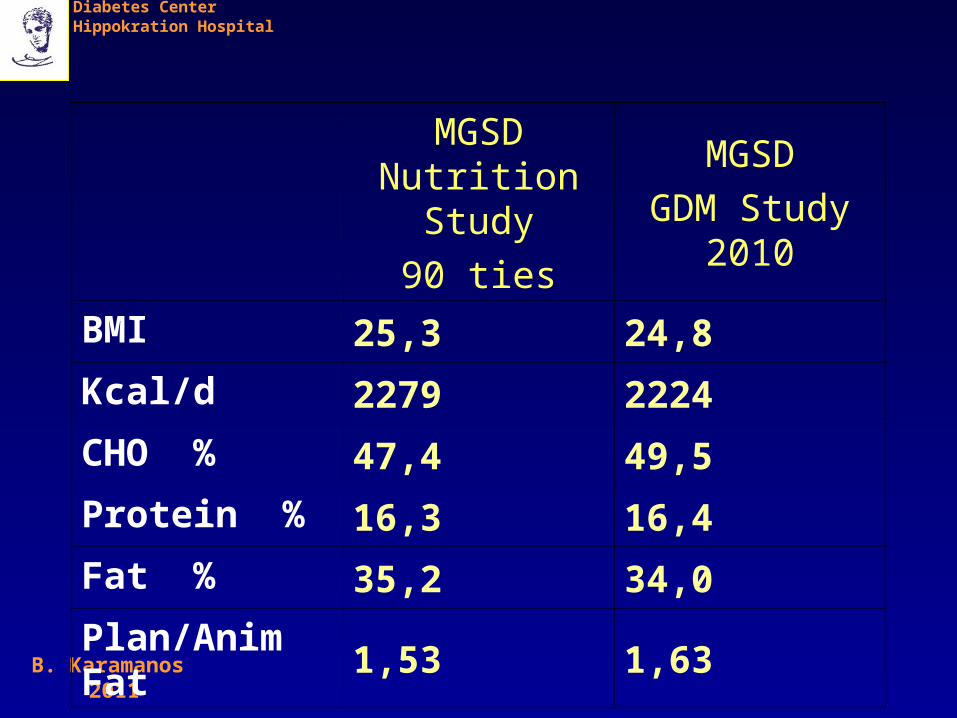
MGSD Nutrition Study
90 ties
MGSD
GDM Study 2010
BMI 25,3 24,8
Kcal/d 2279 2224
CHO % 47,4 49,5
Protein % 16,3 16,4
Fat % 35,2 34,0
Plan/Anim Fat 1,53 1,63

B. Karamanos 2011
Diabetes CenterHippokration Hospital
Evaluation of the OGTT
• Fasting PG > 5,3 mm/L
• 1 Hour PG > 10,0 mm/L
• 2 Hour PG > 8,6 mm/L
• Two abnormal values needed for the diagnosis of GDM
GDM Incidence
9,7%

B. Karamanos 2011
Diabetes CenterHippokration Hospital
GDM + GDM -
AGE 32,1 *** 30,0
BMI 26,6 *** 24,5
Kcal/d 2093 2238
CHO g/d 262,0 281,8
PROTEIN g/d 84,6 ** 92,8
FAT g/d 82,0 86,6

B. Karamanos 2011
Diabetes CenterHippokration Hospital
GDM + GDM -
FIBRE g/d 22,2 23,2
ANIMAL FAT g/d 26,6 24,5
ANIMAL PROT g/d 33,7 36,5
SAFA g/d 33,0 36,0
PUFA g/d 9,3 ** 10,5
RATIO VEG/ANIM 1,7 1,6
Olive oil g/d 21,1 *** 15,2

B. Karamanos 2011
Diabetes CenterHippokration Hospital
GDM + GDM -
CHO % 48,7 49,6
FAT % 35,0 33,9
PROTEIN % 16,2 16,5
ANIMAL FAT % 14,3 14,4
PLANT FAT % 20,0 18,7
SAFA % 13,7 13,8

B. Karamanos 2011
Diabetes CenterHippokration Hospital
GDM + GDM -
FOLATE 239 244
NIACIN 34,9 * 37,9
RIBOFLAVIN 1,73 1,84
THIAMINE 1,24 1,29
VITAMINE A 603 * 693
VITAMINE C 92,4 87,4
B. Karamanos 2011
Diabetes CenterHippokration Hospital
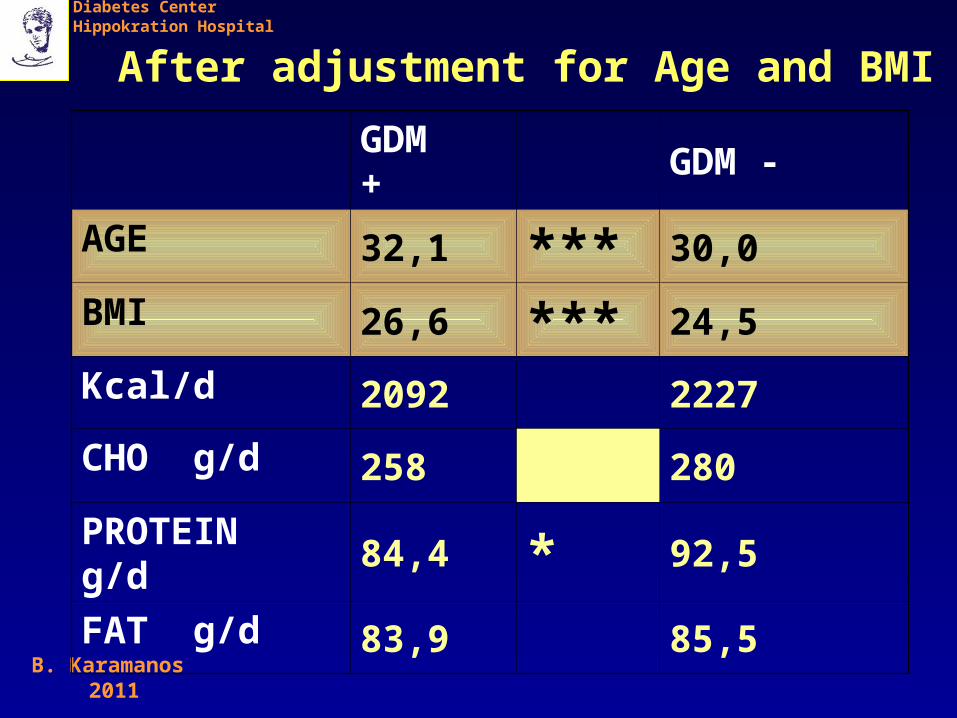
GDM + GDM -
AGE 32,1 *** 30,0
BMI 26,6 *** 24,5
Kcal/d 2092 2227
CHO g/d 258 * 280
PROTEIN g/d 84,4 * 92,5
FAT g/d 83,9 85,5
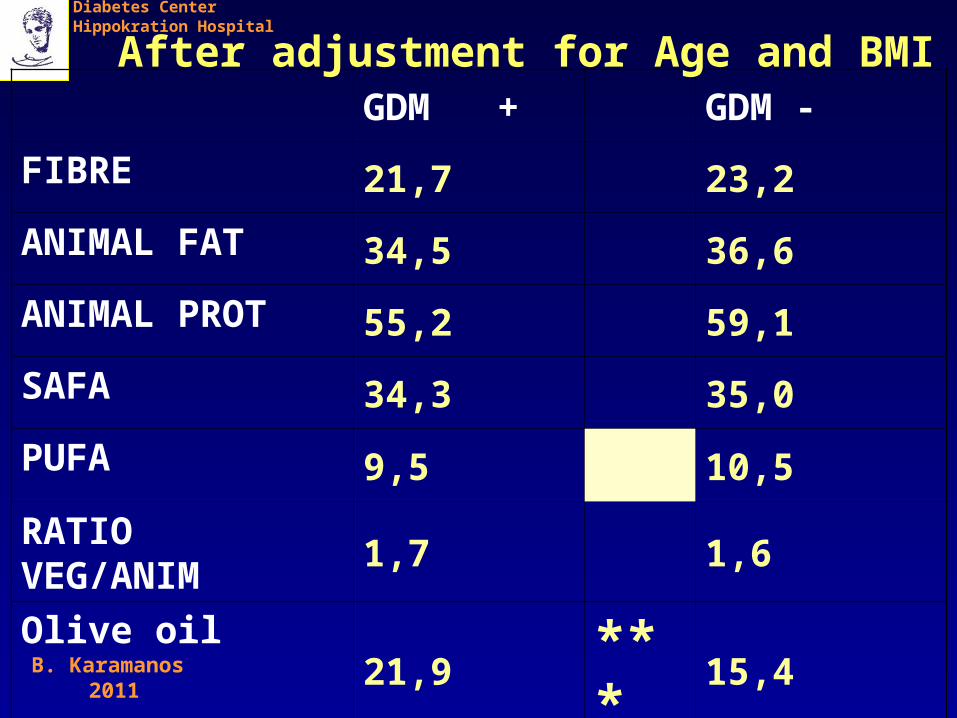
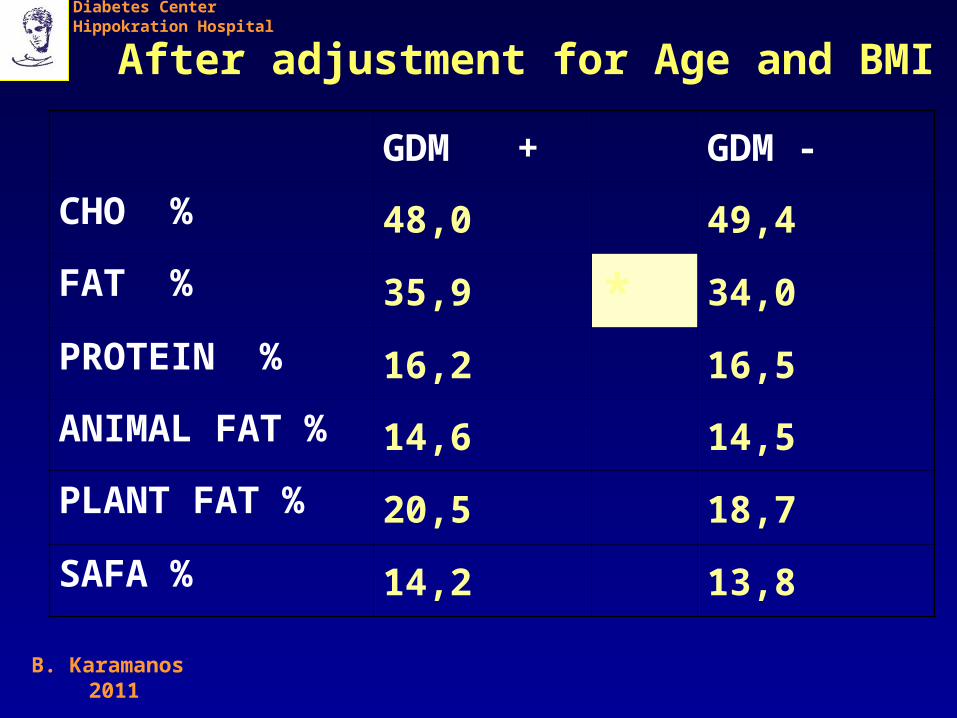
After adjustment for Age and BMI
B. Karamanos 2011
Diabetes CenterHippokration Hospital
GDM + GDM -
FIBRE 21,7 23,2
ANIMAL FAT 34,5 36,6
ANIMAL PROT 55,2 59,1
SAFA 34,3 35,0
PUFA 9,5 10,5
RATIO VEG/ANIM 1,7 1,6
Olive oil 21,9 *** 15,4
After adjustment for Age and BMI
B. Karamanos 2011
Diabetes CenterHippokration Hospital
GDM + GDM -
CHO % 48,0 49,4
FAT % 35,9 * 34,0
PROTEIN % 16,2 16,5
ANIMAL FAT % 14,6 14,5
PLANT FAT % 20,5 18,7
SAFA % 14,2 13,8
After adjustment for Age and BMI

B. Karamanos 2011
Diabetes CenterHippokration Hospital
GDM + GDM -
FOLATE 235 244
NIACIN 34,6 37,6
RIBOFLAVIN 1,7 1,8
THIAMINE 1,22 1,28
VITAMINE A 602 691
VITAMINE C 94,9 88,0
After adjustment for Age and BMI
B. KARAMANOS 2011
Diabetes CentreHippokration HospitalAthens, Greece
B. KARAMANOS 2011
Diabetes CentreHippokration HospitalAthens, Greece
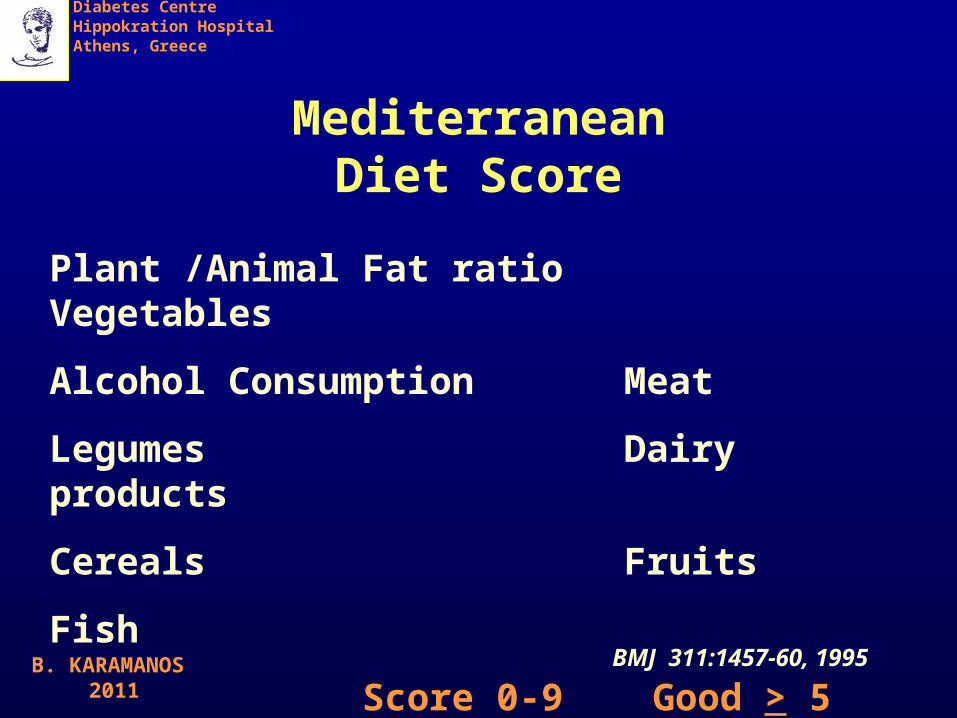
MediterraneanDiet Score
Plant /Animal Fat ratio Vegetables
Alcohol Consumption Meat
Legumes Dairy products
Cereals Fruits
Fish
Score 0-9 Good > 5BMJ 311:1457-60, 1995
B. KARAMANOS 2011
Diabetes CentreHippokration HospitalAthens, Greece
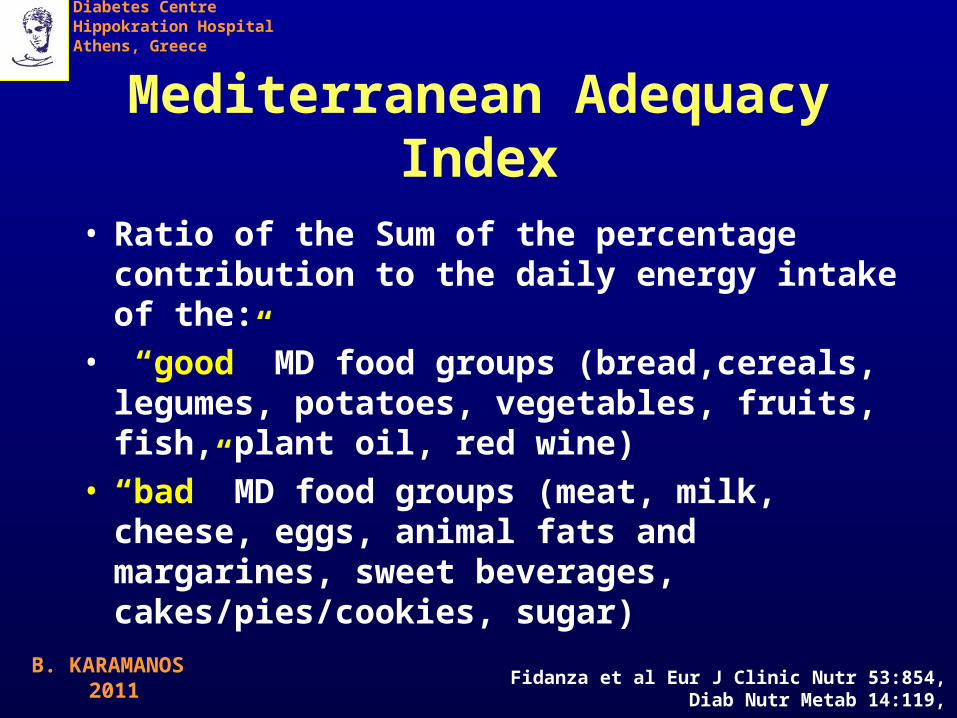
Mediterranean Adequacy Index
• Ratio of the Sum of the percentage contribution to the daily energy intake of the:
• “good” MD food groups (bread,cereals, legumes, potatoes, vegetables, fruits, fish, plant oil, red wine)
• “bad” MD food groups (meat, milk, cheese, eggs, animal fats and margarines, sweet beverages, cakes/pies/cookies, sugar)
Fidanza et al Eur J Clinic Nutr 53:854, 1990Diab Nutr Metab 14:119, 2001
B. KARAMANOS 2011
Diabetes CentreHippokration HospitalAthens, Greece
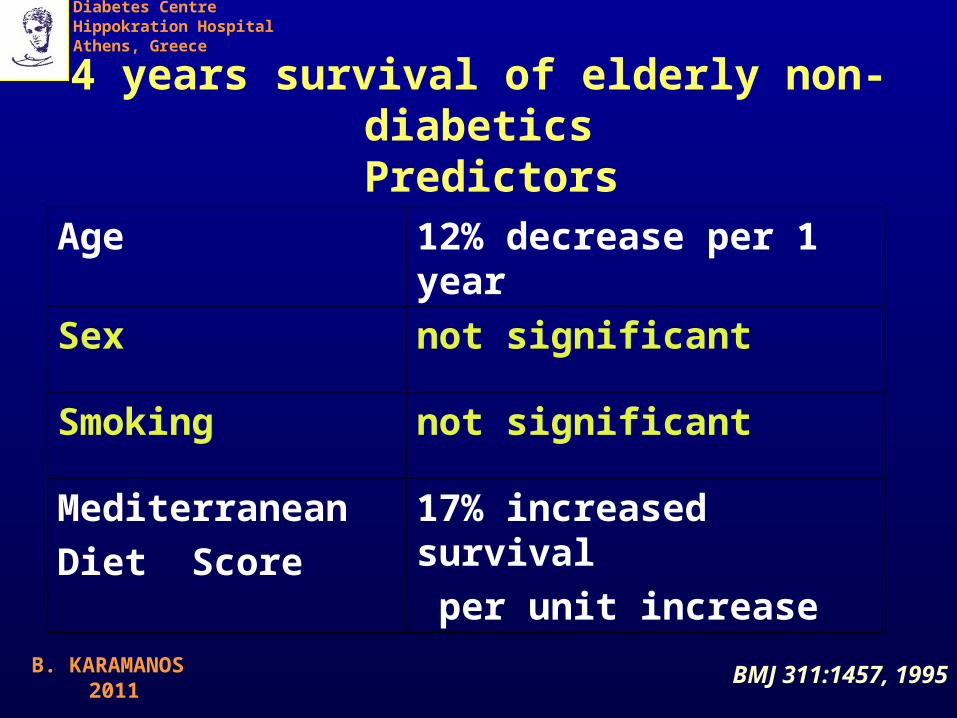
4 years survival of elderly non-diabetics Predictors
Age 12% decrease per 1 year
Sex not significant
Smoking not significant
Mediterranean
Diet Score
17% increased survival
per unit increase
BMJ 311:1457, 1995

B. Karamanos 2011
Diabetes CenterHippokration Hospital
GDM + GDM -
CHO g/d 258 * 280
Protein g/d 84,4 * 92,5
Fat % 35,9 * 34,0
Olive oil g/d 21,9 *** 15,4
Medi Diet Index
5,53 * 5,98
Significant differences after adjustment for Age and BMI
B. Karamanos 2011
Diabetes CenterHippokration Hospital
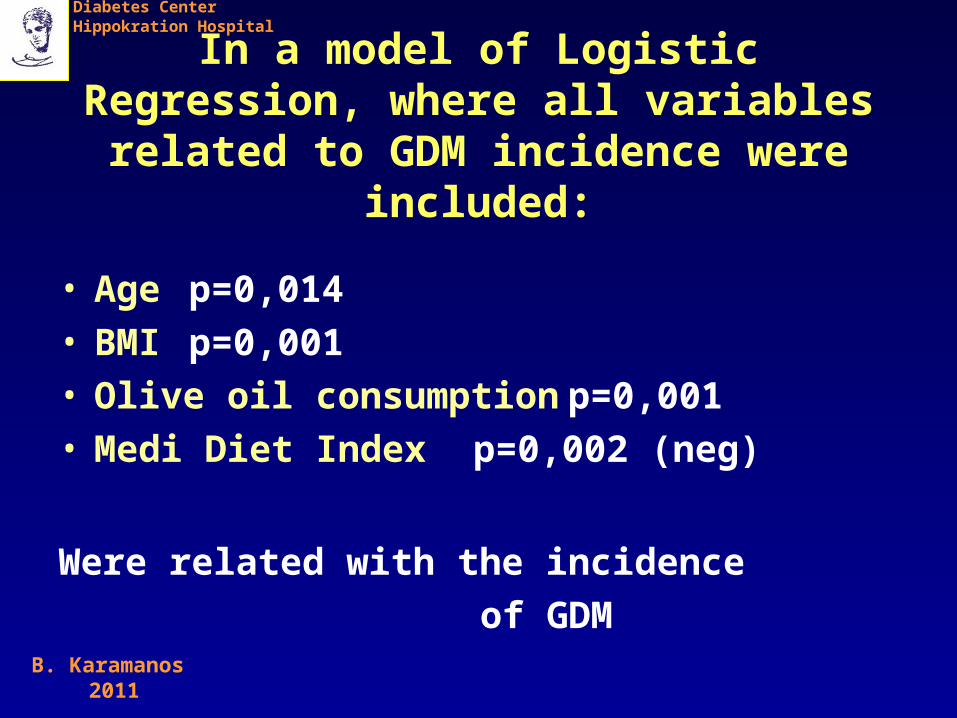
In a model of Logistic Regression, where all variables related to GDM
incidence were included:
• Age p=0,014• BMI p=0,001• Olive oil consumption p=0,001• Medi Diet Index p=0,002 (neg)
Were related with the incidence
of GDM

B. Karamanos 2011
Diabetes CenterHippokration Hospital
Incidence of GDMaccording to Mediterranean Diet Index
Med Diet
Goodp
Med Diet
Bad
GDM
Incidence7,9 % 0,03 12,6 %
Relative Risk
0,60 (CI 0,38 – 0,95)

B. Karamanos 2011
Diabetes CenterHippokration Hospital
Conclusions
The incidence of Gestational diabetes is related with:
• The contribution of Fat to the energy
intake
– even if it is Monounsaturated (olive oil)
• The Mediterranean Diet Index
– the higher the better