DIA Port Development Program - c.ymcdn.comc.ymcdn.com/sites/ · PDF file• Portside Layout...
57
1 PAGE Overview of the Proposed Durban Dig-Out Port Project (DDOP) Dr Andrew A Mather Pr Eng. 17 Sept 2013 PMSA
Transcript of DIA Port Development Program - c.ymcdn.comc.ymcdn.com/sites/ · PDF file• Portside Layout...
1 PAGE
Overview of the Proposed Durban Dig-Out Port Project (DDOP)
Dr Andrew A Mather Pr Eng.
17 Sept 2013
PMSA
2 PAGE
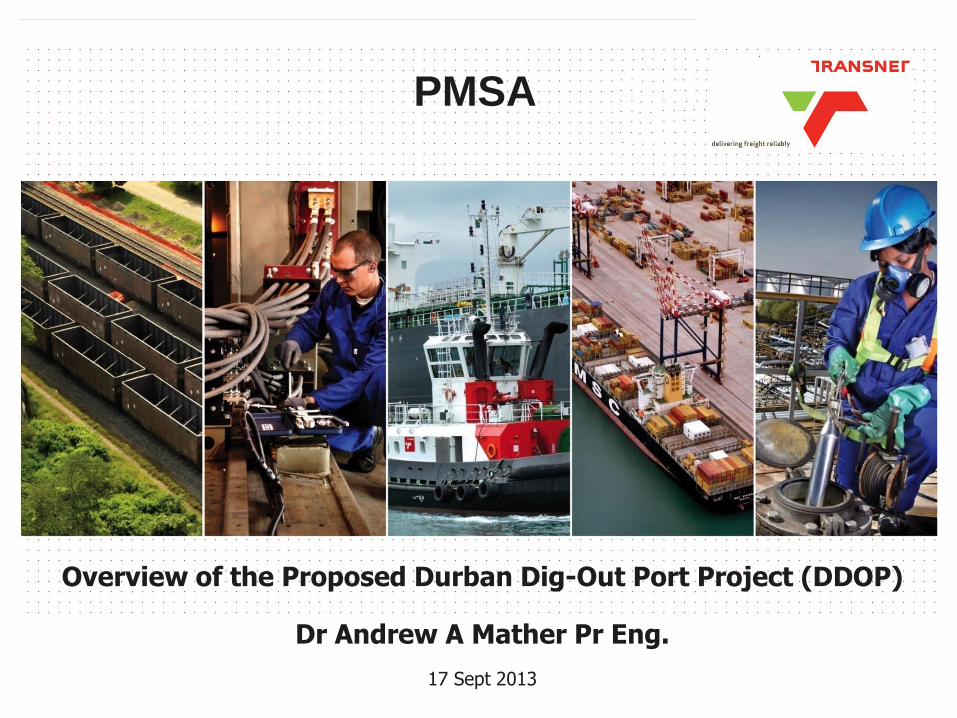
Outline of presentation
• High-level scope & location
• The BIG picture
• Key drivers for development
• Timelines for port capacity developments in Durban
• The port development process & critical milestones
• High level layout options
• Critical success factors
3 PAGE
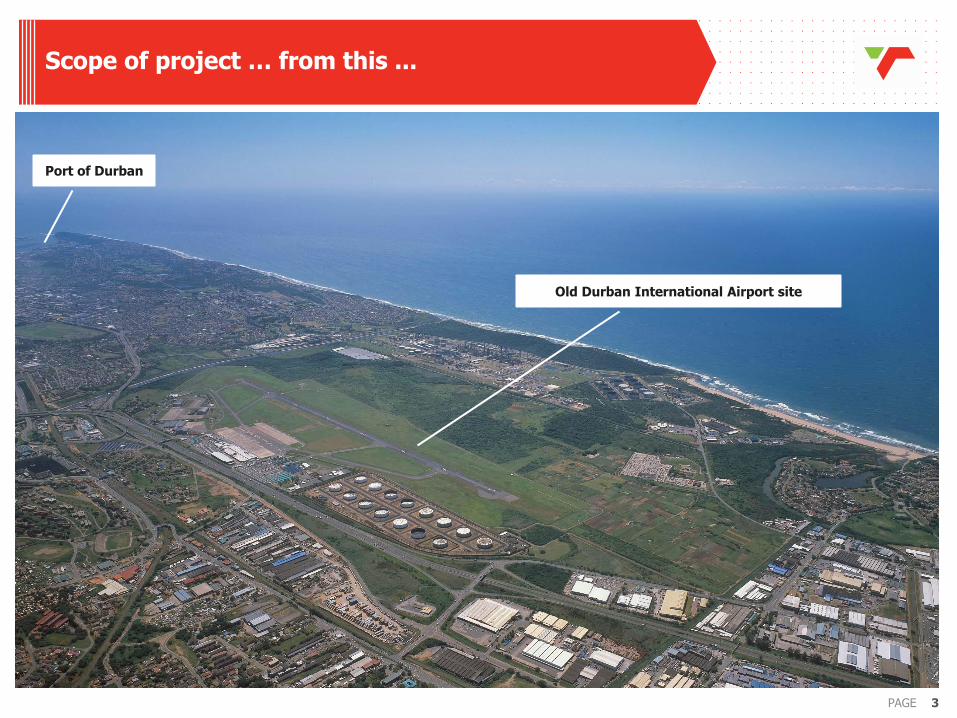
Scope of project … from this ...
Port of Durban
Old Durban International Airport site
4 PAGE
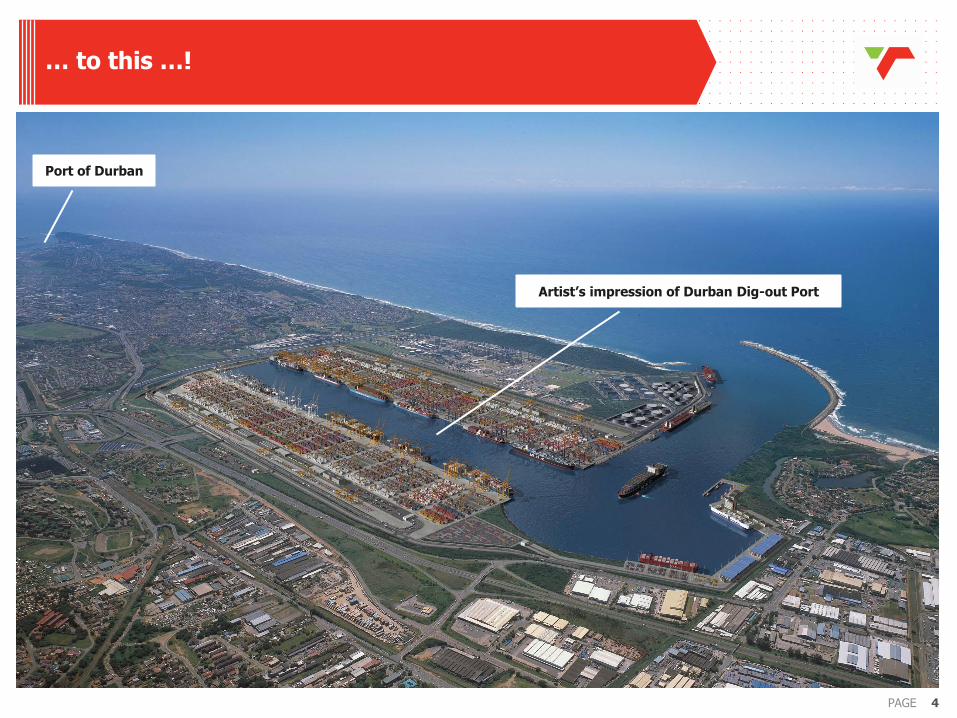
… to this …!
Port of Durban
Artist’s impression of Durban Dig-out Port

5 PAGE
Location of the proposed new port
We are here
Port of Durban
Proposed Durban Dig-out Port site
View from here
N

6 PAGE
View of current Port of Durban (from West)
Pier 2
Pier 1
9 PAGE
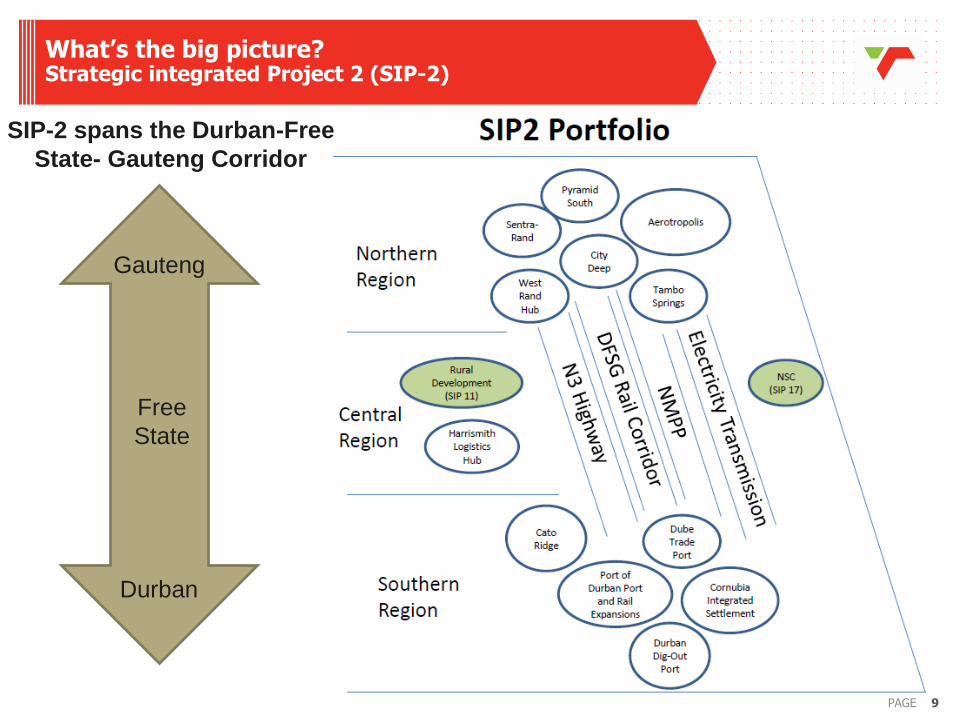
What’s the big picture? Strategic integrated Project 2 (SIP-2)
Gauteng
Free
State
Durban
SIP-2 spans the Durban-Free
State- Gauteng Corridor
10 PAGE
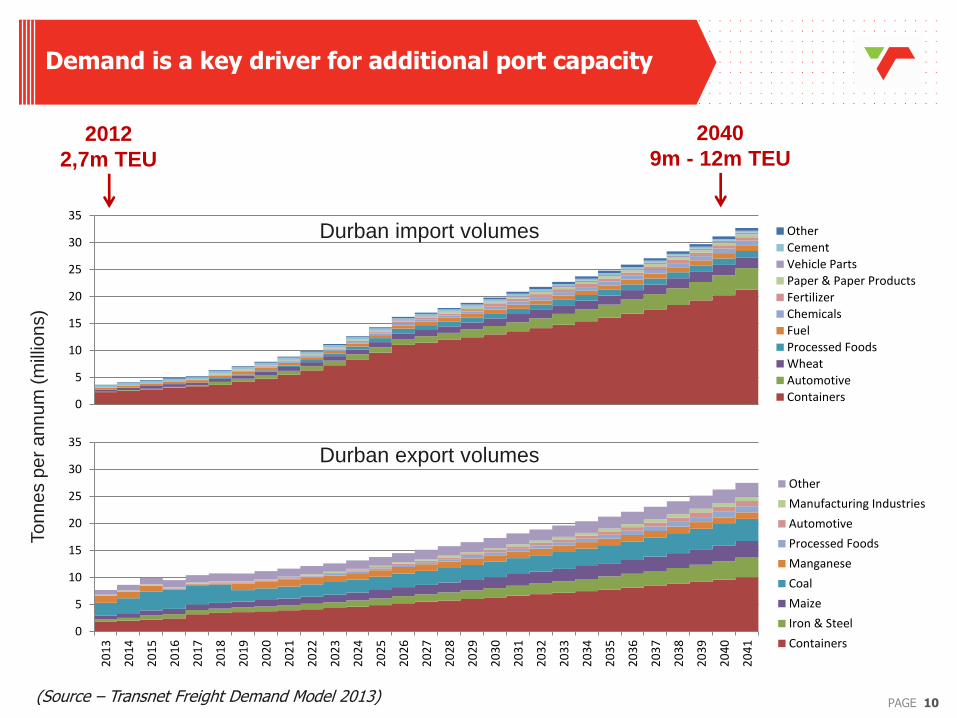
Demand is a key driver for additional port capacity
0
5
10
15
20
25
30
35Other
Cement
Vehicle Parts
Paper & Paper Products
Fertilizer
Chemicals
Fuel
Processed Foods
Wheat
Automotive
Containers
0
5
10
15
20
25
30
35
20
13
20
14
20
15
20
16
20
17
20
18
20
19
20
20
20
21
20
22
20
23
20
24
20
25
20
26
20
27
20
28
20
29
20
30
20
31
20
32
20
33
20
34
20
35
20
36
20
37
20
38
20
39
20
40
20
41
Other
Manufacturing Industries
Automotive
Processed Foods
Manganese
Coal
Maize
Iron & Steel
Containers
(Source – Transnet Freight Demand Model 2013)
2012
2,7m TEU
2040
9m - 12m TEU
To
nn
es p
er
an
nu
m (
mill
ion
s)
Durban import volumes
Durban export volumes

11 PAGE
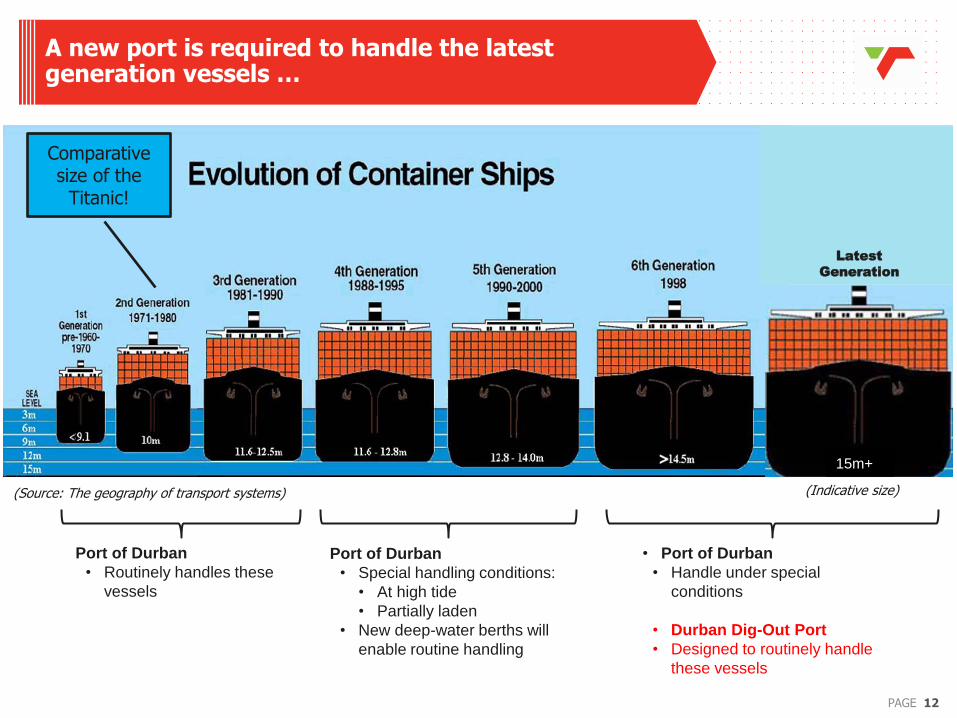
Container vessel sizes have more than doubled in the last decade …
(Source: The geography of transport systems)
12 PAGE
A new port is required to handle the latest generation vessels …
Port of Durban
• Routinely handles these
vessels
(Source: The geography of transport systems)
Port of Durban
• Special handling conditions:
• At high tide
• Partially laden
• New deep-water berths will
enable routine handling
• Port of Durban
• Handle under special
conditions
• Durban Dig-Out Port
• Designed to routinely handle
these vessels
15m+
(Indicative size)
Latest
Generation
Comparative size of the
Titanic!

13 PAGE
Maersk Line has ordered 10 x 18,000 TEU ships to be delivered between 2013 & 2015 …
Triple-E's - energy efficiency, economy of scale, environment
Less than 60 days to delivery!
Will reduce CO2 emissions by about 50 percent per container moved
Length = 400m
Beam = 59m
Draft = 15,5m
14 PAGE
0.0
1.0
2.0
3.0
4.0
5.0
6.0
7.0
8.0
9.0
10.0
TE
U (
mil
lio
ns)
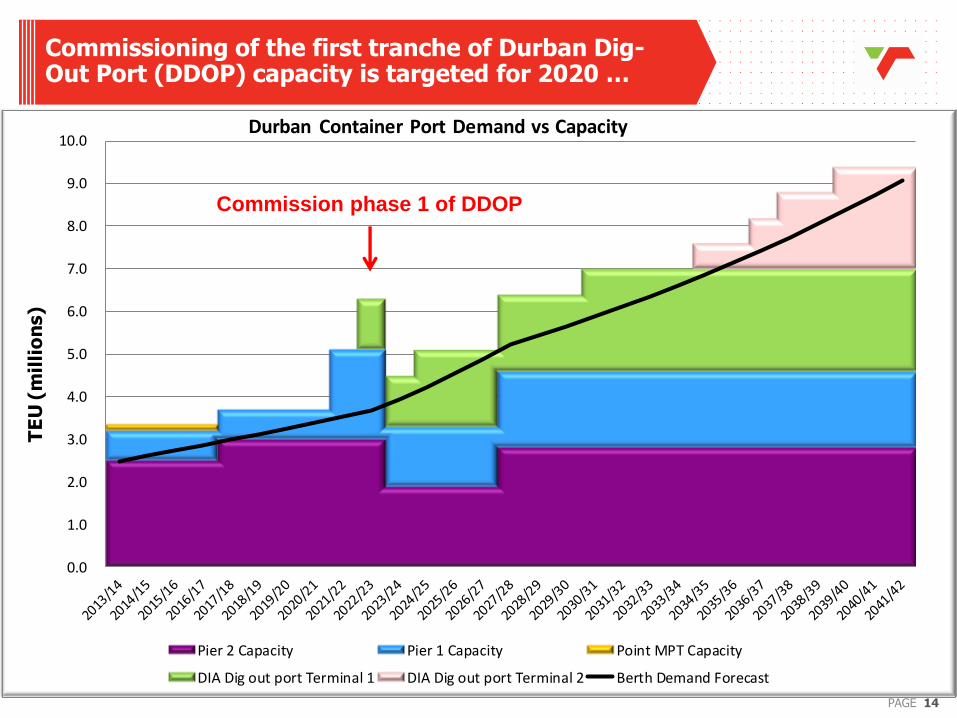
Durban Container Port Demand vs Capacity
Pier 2 Capacity Pier 1 Capacity Point MPT Capacity
DIA Dig out port Terminal 1 DIA Dig out port Terminal 2 Berth Demand Forecast
Commissioning of the first tranche of Durban Dig-Out Port (DDOP) capacity is targeted for 2020 …
Commission phase 1 of DDOP

15 PAGE
PIER 1
PIER 2
PIER 1: 0.7m TEU : 2 berths : 680m PIER 2: 2.1m TEU : 6 berths : 2110m TOTAL: 2.8m TEU : 8 berths : 2790m
Port of Durban - current Existing Pier 1 and Pier 2 container terminals
MAYDON WHARF MPT
POINT MPT

16 PAGE
PIER 1 WITH SALISBURY ISLAND INFILL
PIER 2 WITH NORTH QUAY DEEPENED
MAYDON WHARF MPT
POINT MPT
PIER 1: 2.0m TEU : 5 berths : 1890m PIER 2: 3.0m TEU : 6 berths : 2110m TOTAL: 5.0m TEU : 11berths : 4000m
Port of Durban – 2017/18 Pier 1 with Salisbury Island infill, Pier 2 with new cranes and north quay deepened
17 PAGE
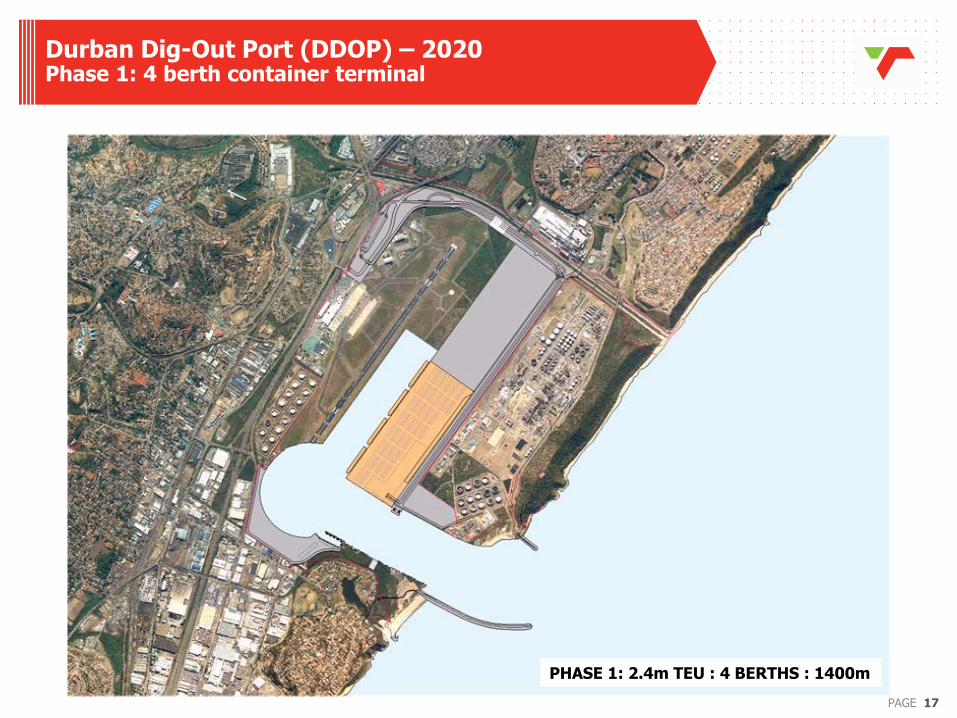
PHASE 1: 2.4m TEU : 4 BERTHS : 1400m
Durban Dig-Out Port (DDOP) – 2020 Phase 1: 4 berth container terminal

18 PAGE
INFILL BETWEEN PIER 1 + PIER 2
PIER 1 + PIER 2: 4.8m TEU : 8 BERTHS : 2760m
Port of Durban - 2024 Infill between Pier 1 and Pier 2
19 PAGE
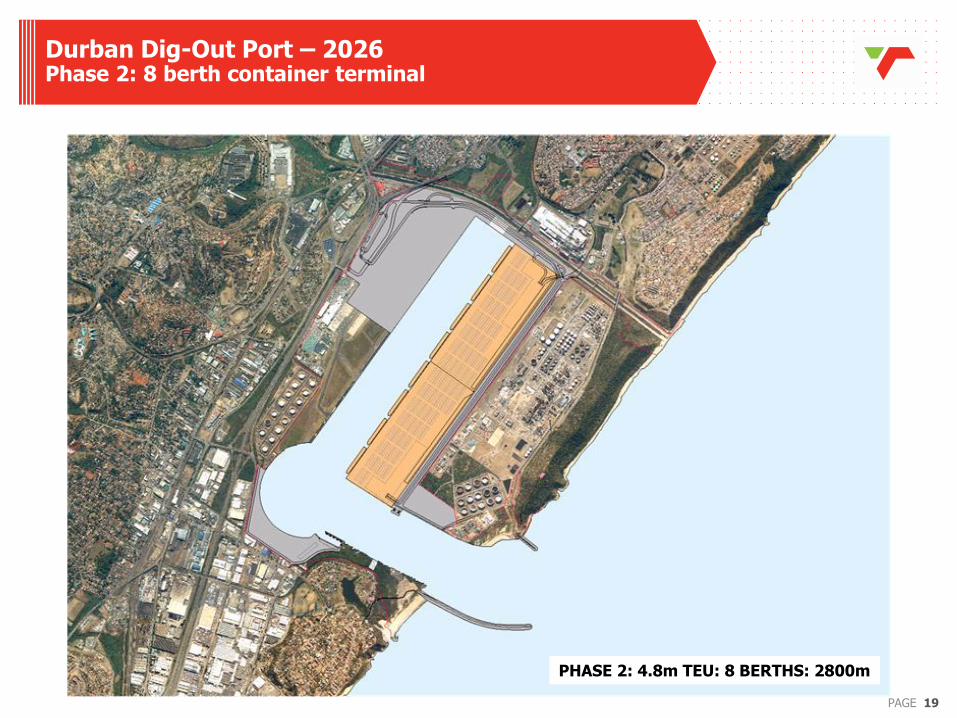
PHASE 2: 4.8m TEU: 8 BERTHS: 2800m
Durban Dig-Out Port – 2026 Phase 2: 8 berth container terminal
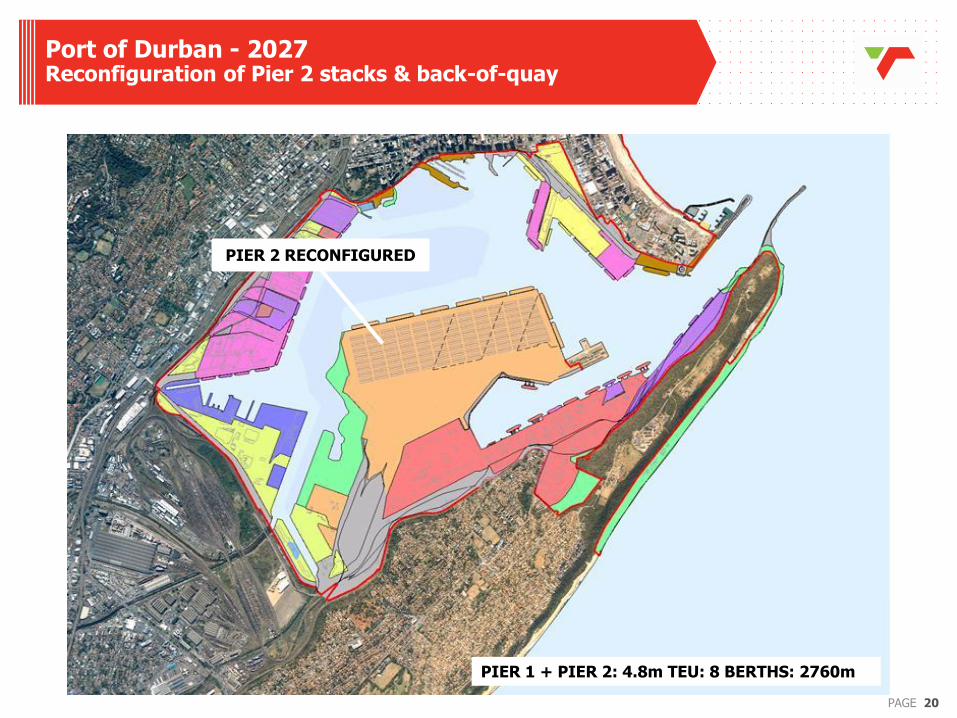
20 PAGE
PIER 2 RECONFIGURED
PIER 1 + PIER 2: 4.8m TEU: 8 BERTHS: 2760m
Port of Durban - 2027 Reconfiguration of Pier 2 stacks & back-of-quay
21 PAGE
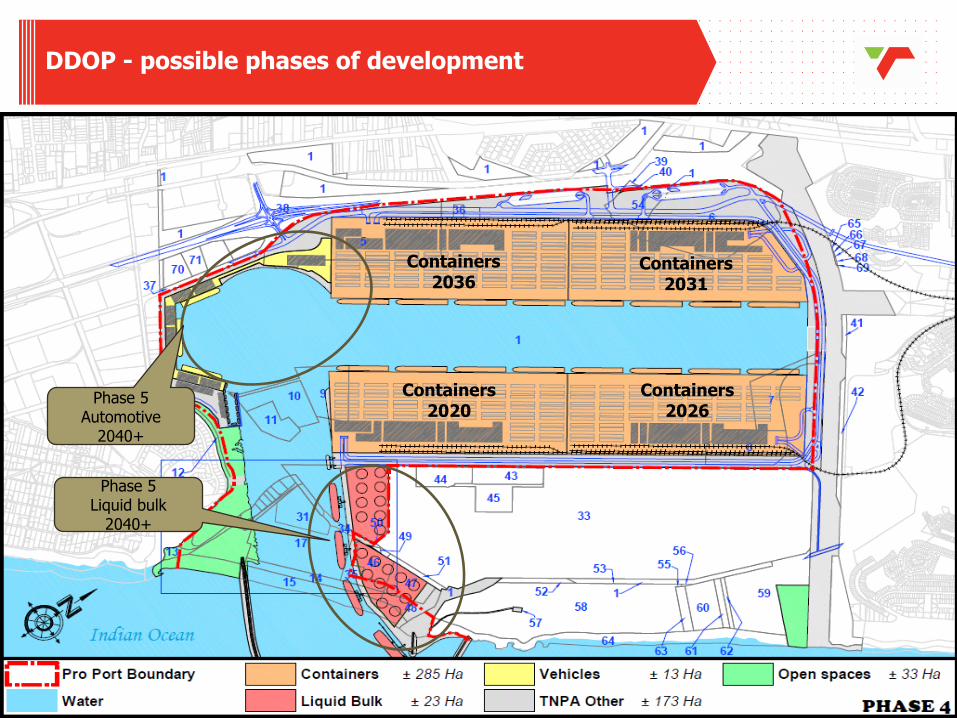
DDOP - possible phases of development
Phase 5 Automotive
2040+
Phase 5 Liquid bulk
2040+
Containers 2020
Containers 2026
Containers 2031
Containers 2036
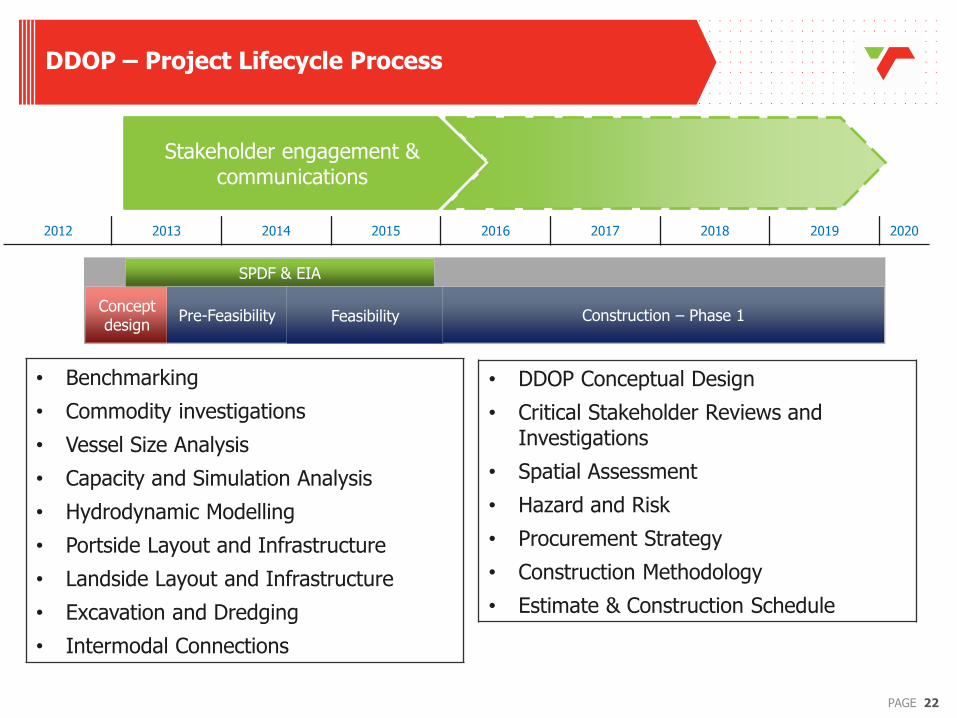
22 PAGE
DDOP – Project Lifecycle Process
2
2
2012 2013 2014 2015 2016 2017 2018 2019 2020
Concept design
Stakeholder engagement & communications
SPDF & EIA
Pre-Feasibility Feasibility Construction – Phase 1
• Benchmarking
• Commodity investigations
• Vessel Size Analysis
• Capacity and Simulation Analysis
• Hydrodynamic Modelling
• Portside Layout and Infrastructure
• Landside Layout and Infrastructure
• Excavation and Dredging
• Intermodal Connections
• DDOP Conceptual Design
• Critical Stakeholder Reviews and Investigations
• Spatial Assessment
• Hazard and Risk
• Procurement Strategy
• Construction Methodology
• Estimate & Construction Schedule
23 PAGE
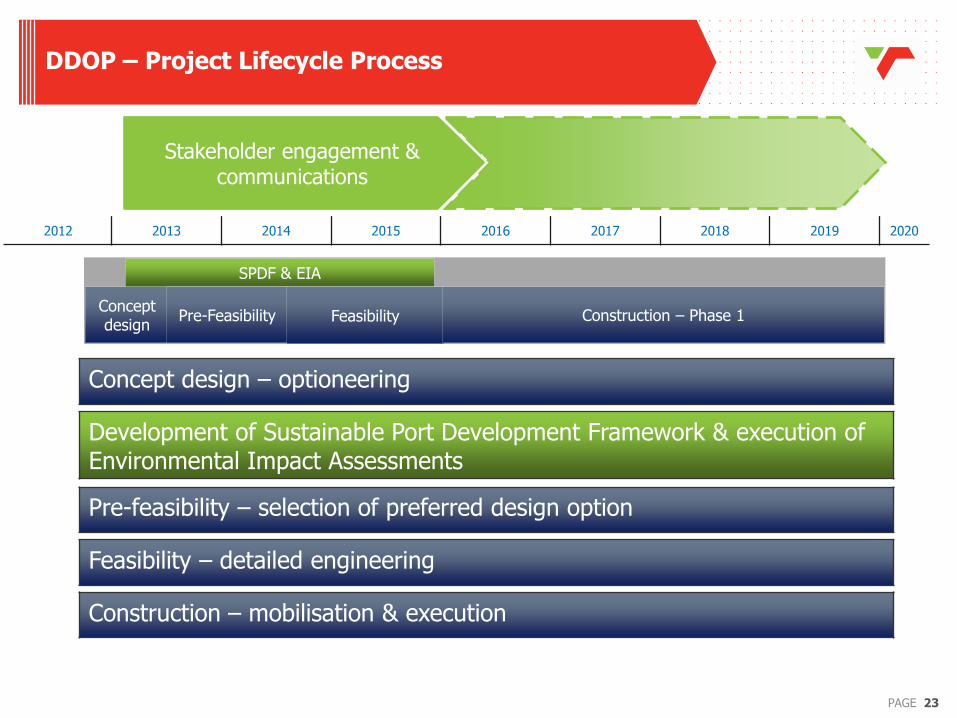
DDOP – Project Lifecycle Process
2
3
2012 2013 2014 2015 2016 2017 2018 2019 2020
Concept design
Concept design – optioneering
Development of Sustainable Port Development Framework & execution of Environmental Impact Assessments
Stakeholder engagement & communications
SPDF & EIA
Pre-feasibility – selection of preferred design option
Pre-Feasibility Feasibility Construction – Phase 1
Feasibility – detailed engineering
Construction – mobilisation & execution

24 PAGE
DDOP – Project Lifecycle Process
2
4
2012 2013 2014 2015 2016 2017 2018 2019 2020
Concept design
• Development of the remaining phases will span ± 20 years after the
completion of phase 1
• Phases will be developed to provide capacity ahead of demand
Stakeholder engagement & communications
SPDF & EIA
Pre-Feasibility Feasibility Construction – Phase 1
25 PAGE
Stakeholder Engagement (EIA)
Pre-Feasibility Concept design
Feasibility Construction Phase
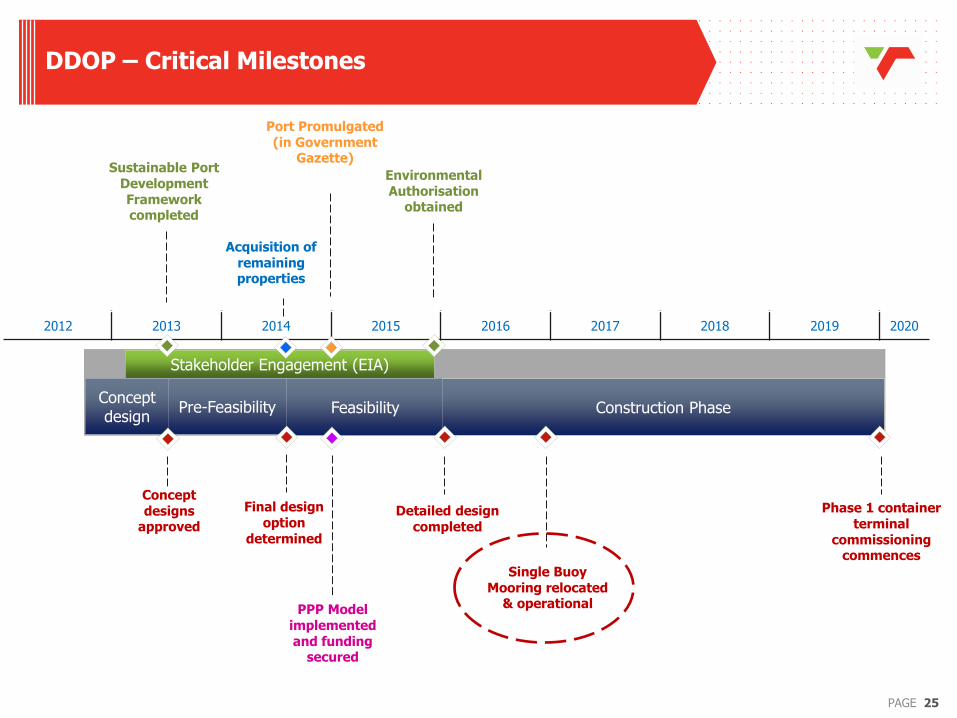
DDOP – Critical Milestones
2
5
2012 2013 2014 2015 2016 2017 2018 2019 2020
Acquisition of remaining properties
Port Promulgated (in Government
Gazette) Sustainable Port
Development Framework completed
Environmental Authorisation
obtained
Single Buoy Mooring relocated
& operational
Phase 1 container terminal
commissioning commences
Concept designs
approved
Final design option
determined
Detailed design completed
PPP Model implemented and funding
secured
26 PAGE
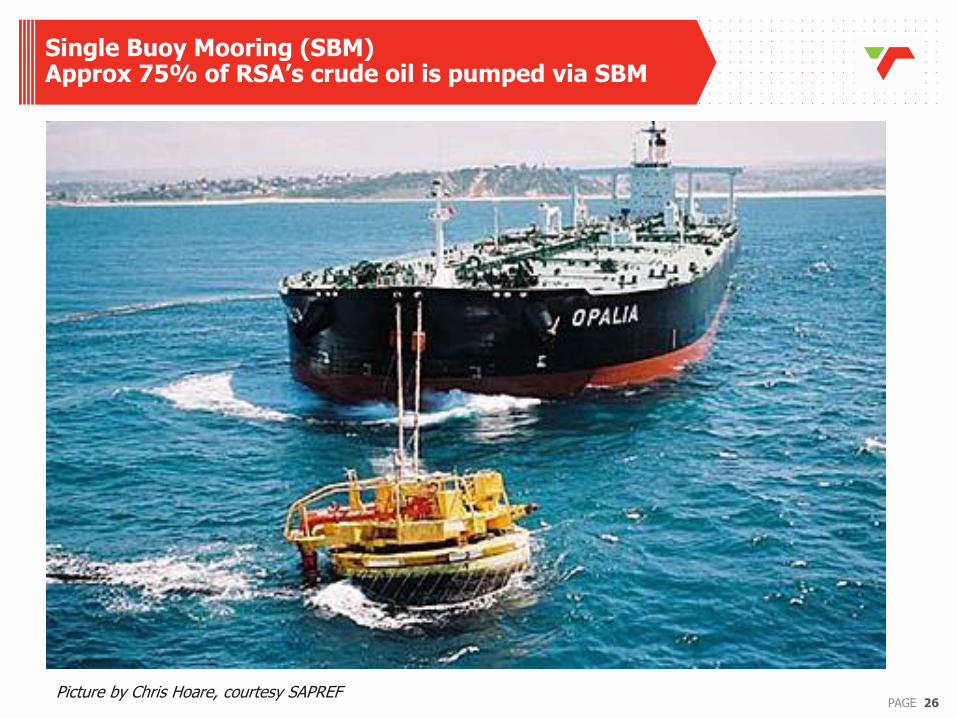
Single Buoy Mooring (SBM) Approx 75% of RSA’s crude oil is pumped via SBM
Picture by Chris Hoare, courtesy SAPREF

27 PAGE
SBM Exclusion Zone
Irrespective of the final
port entrance geometry,
the SBM will have to be
relocated
SBM must be relocated
before construction of
the breakwater can
commence
28 PAGE
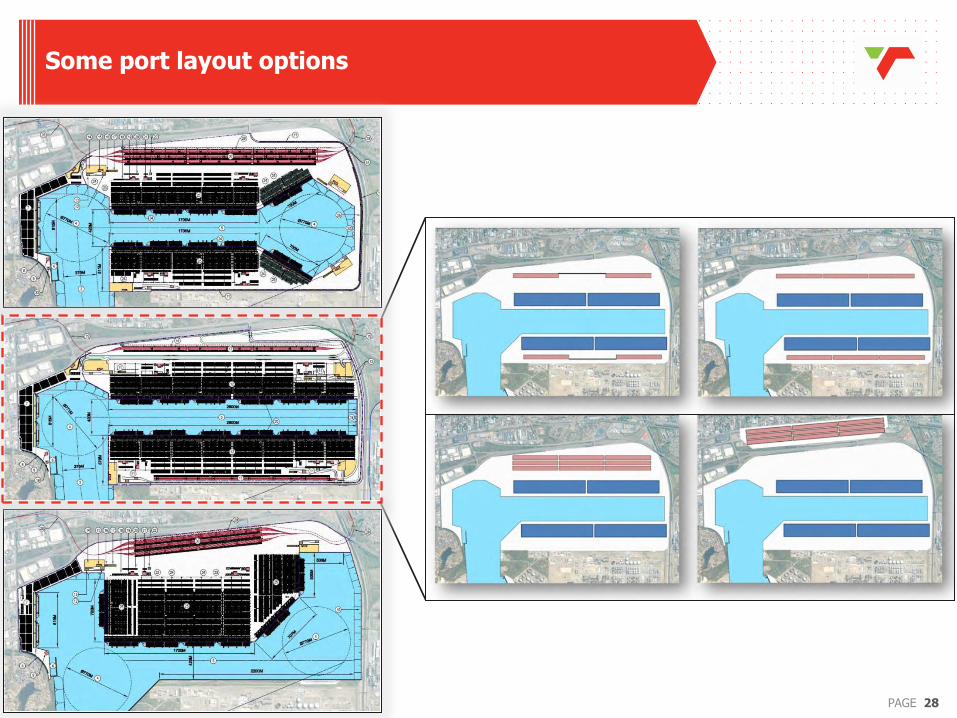
Some port layout options

29 PAGE
Possible breakwater orientations

30 PAGE
Marine Infrastructure
65%
Landside Infrastructure
19%
Terminal Equipment
16%
Relative investment - Phase 1
3
0
Circa ZAR 37 billion
(unescalated)
(Source: Transnet – Durban
Airport Site Expansion, Port
Panning Study, March 2011)

31 PAGE
Relative investment - Phase 1
Circa ZAR 30 billion
(unescalated)
(Source: Transnet – Durban
Airport Site Expansion, Port
Panning Study, March 2011)

32 PAGE
Relative investment - Phase 1
3
2
Circa ZAR 7 billion
(unescalated)
(Source: Transnet – Durban
Airport Site Expansion, Port
Panning Study, March 2011)

33 PAGE
Critical success factors to be addressed
Development and implementation of an integrated Sustainable Port
Development Framework, e.g.
Eco-systems services
Socio-political systems
Economy
Governance
• Cost mitigation/ offsets for eco-system services impacts
• Design imperatives
• Social impact • Corporate Social responsibility &
Investments
• Contribution to GDP & growth • Skills development & job creation
• Compliance – Constitution, authorisations
34 PAGE
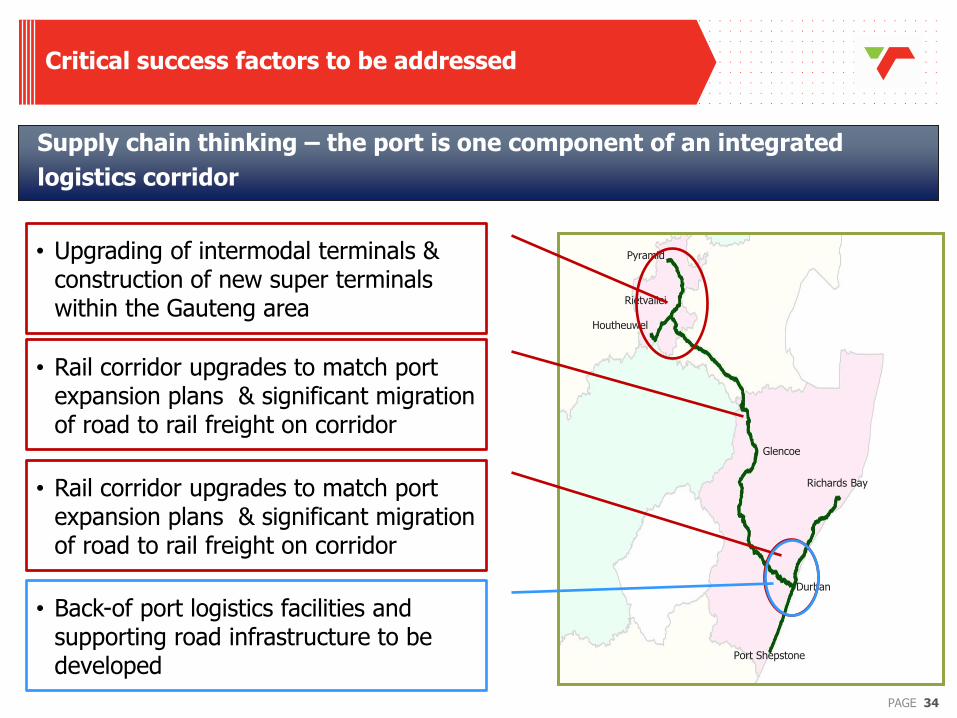
Critical success factors to be addressed
Supply chain thinking – the port is one component of an integrated
logistics corridor
Richards Bay
Port Shepstone
Durban
Pyramid
Rietvallei
Houtheuwel
Glencoe
• Upgrading of intermodal terminals & construction of new super terminals within the Gauteng area
• Rail corridor upgrades to match port expansion plans & significant migration of road to rail freight on corridor
• Rail corridor upgrades to match port expansion plans & significant migration of road to rail freight on corridor
• Back-of port logistics facilities and supporting road infrastructure to be developed

35 PAGE
Proposed super-terminals & freight ring

36 PAGE
Proposed Natcor upgrades
Development Strategy:
Short term: 2013 – 2020: 18 to 42Mtpa
•Additional block signals to allow for more trains
•Electrical supply (3 kV DC) and transformer
upgrades
Medium Term: 2020 -2025: 42Mtpa to 51Mtpa
•Relieving of gradients and curves
•Upgrade of Johannesburg to Newcastle section
to heavy haul
•Upgrade of Kroonstad to Ladysmith section
Long term: 2025 – 2041: 51 to 84Mtpa
•Converting Johannesburg - Newcastle section
to 25kVAC
•Migration to CBA (in cab) train control
•Cato Ridge to Durban new bypass line and
modifications to segregate PRASA from TFR
services

37 PAGE
Durban Rail-in-Port Plans

38 PAGE
Interesting statistics (approximate) …..
• 800 hectares of land to be acquired
• 70 million m3 of material to be dredged
• 3,5 million tonnes of rock
• 2,5 million m3 of cement
• 52 000 tonnes of reinforcing steel
• 14,5 million m3 earthworks
(Source: Transnet – Durban Airport Site Expansion, Port Panning Study, March 2011)

39 PAGE
Our Vision
Vision
•Largest container port in Africa
•World-class port in terms of
efficiency
•World-class supply chain
•Leading-edge “green” port
•“Community” port
•State-of-the-art security
Expected Benefits •Expected Capex Impact on GDP of
R 48 billion
•Expected Operational Impact on
GDP of R 56 billion (per annum at
full operation).
•Income/wages generation during
construction – KZN impact –
estimated at R 24 billion
•Expected to create approximately
64 000 construction jobs
•Expected to create approximately
28 000 operational jobs
•Reduced total logistics cost
(Source: Transnet – Durban Airport Site
Expansion, Port Panning Study, March 2011)
City inputs

Evolution of a Port:
The Beginning:
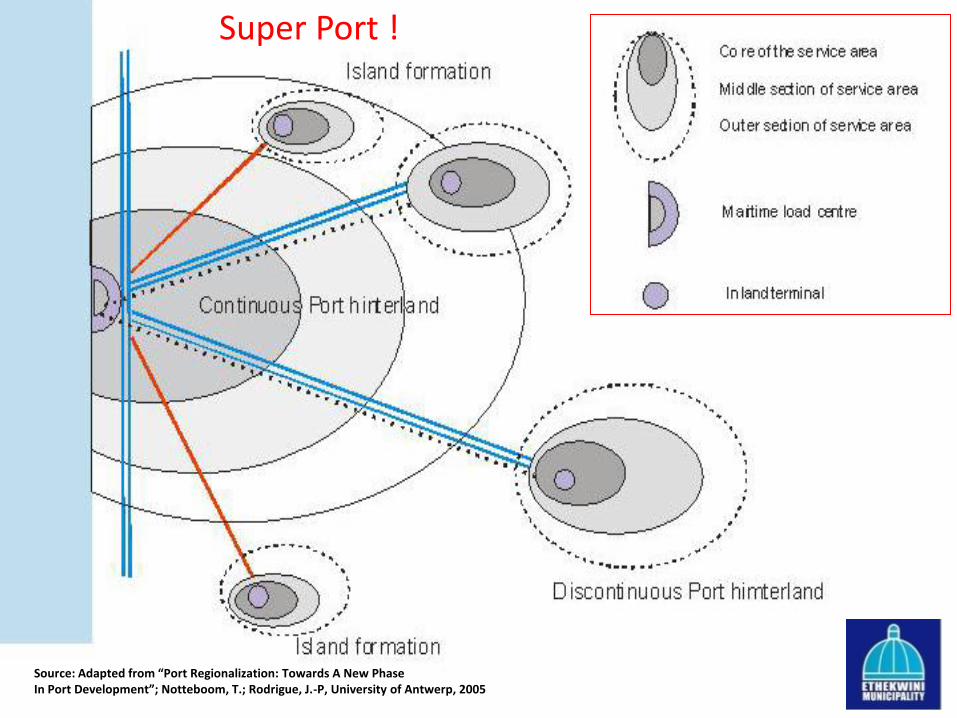
The Future: Super Port!
Now: ???
Source: Adapted from “Port Regionalization: Towards A New Phase In Port Development”; Notteboom, T.; Rodrigue, J.-P, University of Antwerp, 2005
Source: Adapted from “Port Regionalization: Towards A New Phase In Port Development”; Notteboom, T.; Rodrigue, J.-P, University of Antwerp, 2005
Super Port !

Major Road Needs
PRIORITY DUE BY DESCRIPTION LENGTH (km)
COST (2010 Rands)
1 2020 Cato Ridge to PMB to 6 lanes & PMB I/C’s upgrade
21,5 R2,05bn
2 2020 De Beers Pass 98 R3,44bn
3 2020* Freight Route Phases 1& 2 44 R2,76bn
4 2030* Freight Route Phase 3 23 R1,92bn
5 2030* PMB Bypass 60 R3,65bn
6 2025 Heidelberg - Germiston 40 R1,0bn
7 2035 Germiston - End 5 R0,5bn
TOTAL R15,32bn
* Current investigation underway on an N3 8-lane option
and how this could extend the start date of these projects
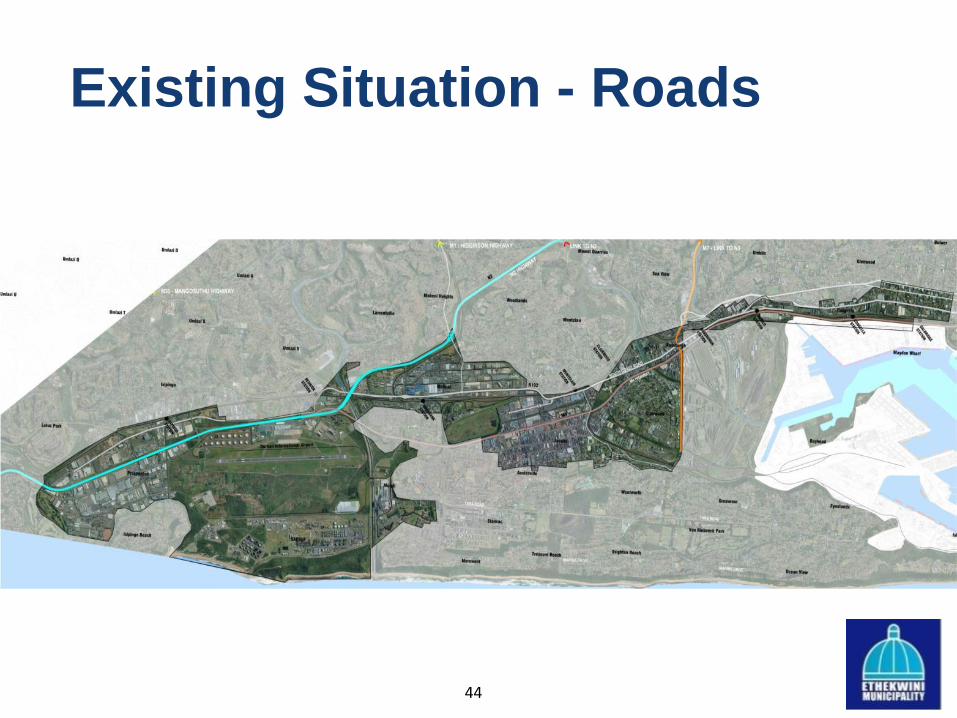
Existing Situation - Roads
44
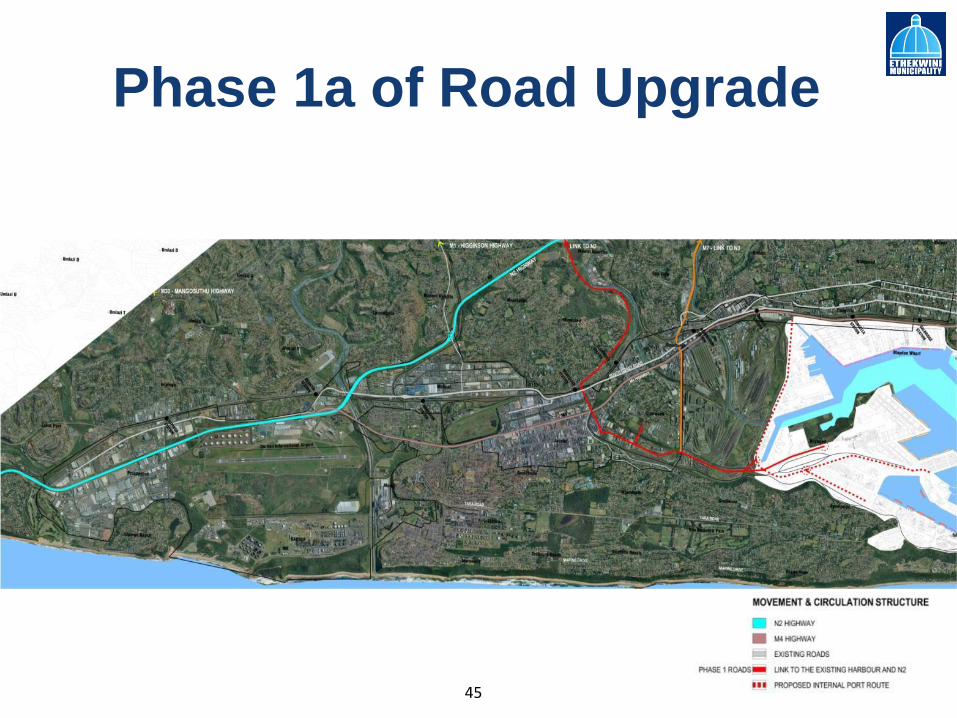
Phase 1a of Road Upgrade
45

Phase 1b of Road Upgrade
46
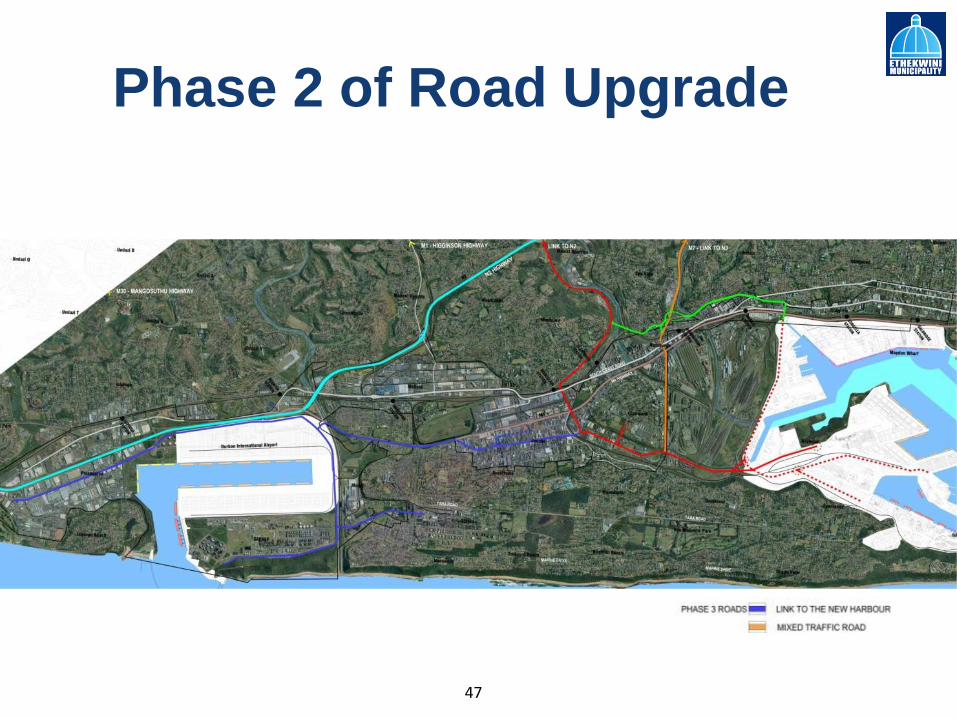
Phase 2 of Road Upgrade
47

Phases 1-2 of Roads (with all residential lower priority routes also shown)
48

Phase 1c:
Mariannhill to Cato
Ridge
Port of Durban
Legend
2010-2025 : Implementation Phasing
: :
: Dedicated Road Freight Route
Major Road Infrastructure Proposals from Port of Durban to Cato
Ridge
Phase 1a: Port to
Mariannhill
Phase 1b: North – South Freight
Route

ETA FREIGHT CORRIDOR
STUDY 50
URBAN PLANNING AND ECONOMIC POTENTIAL ASSESSMENT
Broad Land Cover Key Industrial Clusters Industrial Accessibility
Typical Route Impact Analyses
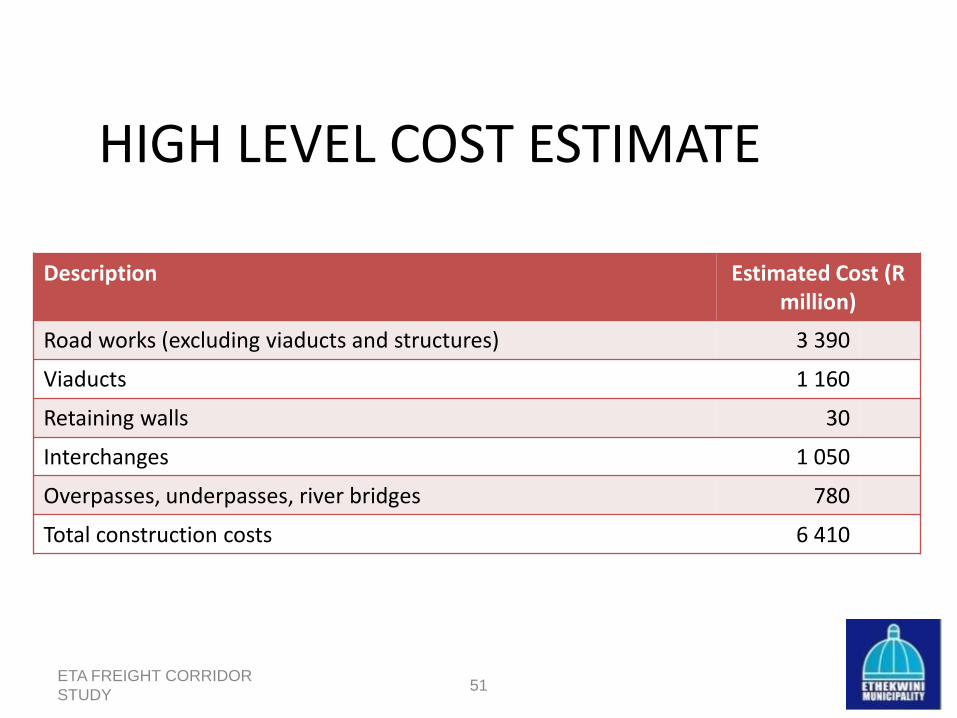
ETA FREIGHT CORRIDOR
STUDY 51
Description Estimated Cost (R million)
Road works (excluding viaducts and structures) 3 390
Viaducts 1 160
Retaining walls 30
Interchanges 1 050
Overpasses, underpasses, river bridges 780
Total construction costs 6 410
HIGH LEVEL COST ESTIMATE

Broad Spatial Location of Logistics Companies
and proposed Intermodal hubs
54
50.6%
3.9%
5.9%
8.7%

Back of Port land use changes

QU
AY
ZONE 2 Rail export buffer
stacks for: • Containers • Motor vehicles
ZONE 2
Maintenance area Workshops Staff facilities Export buffers* for:
Break bulk Motor
vehicles Containers: • Full • Empties
ZONE 1
• Container terminals
• Break bulk terminals • Liquid bulk terminals
ZONE 2 • Intelligent truck
staging • A-check
SAR
S/SAP
S
ZONE 3 •3rd party parking/un-packing •Empty container depots •Intermodal logistics area for import / export buffers for pipelines •Export buffers for break bulk cargo •Export buffers for motor vehicles •Shipment buffers for coastwise petroleum
Private road
TNPA Port Entrance – NAVIS Municipal / TNPA Gate
Rail marshalling yards
Ro
ad fo
r no
n-p
ort related
traffic
Dedicated truck arterial
Weigh Bridge
Truck Stop Truck Yard
* Can be located in zone 3 if space is limited
N.B. This sketch does not indicate land ownership - the location of BoP activities is independent of whomsoever owns the land
Requirements for Back Of Port Facilities:
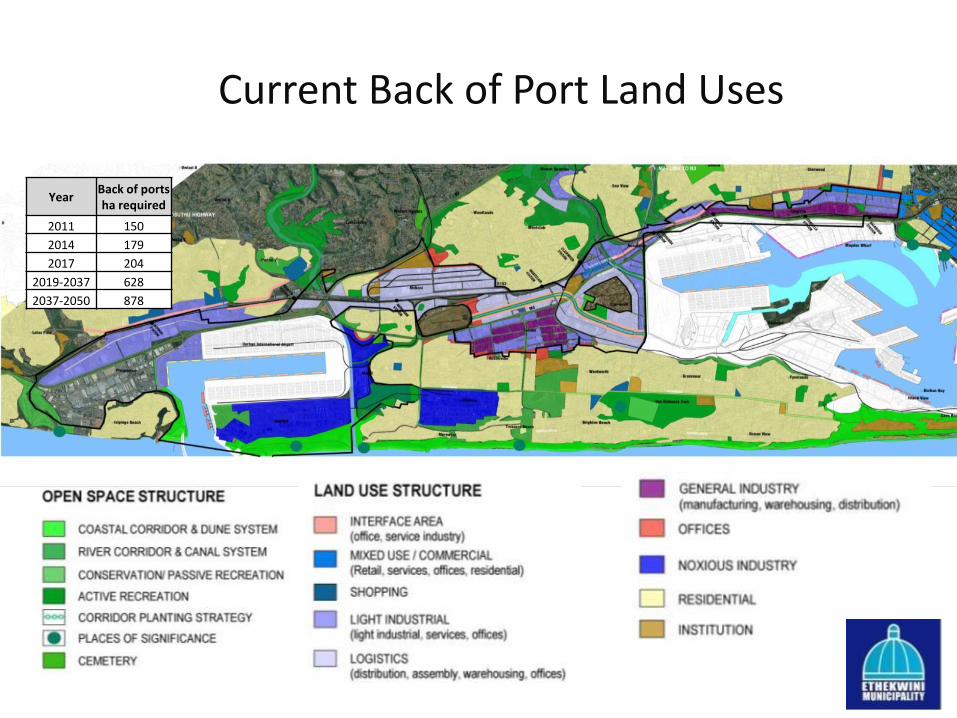
Current Back of Port Land Uses
5
8
Year Back of ports ha required
2011 150
2014 179
2017 204
2019-2037 628
2037-2050 878

INTEGRATED LONG-TERM PORT, RAIL, ROAD AND LAND-USE PLAN
Integrated Freight & Logistics Framework & Action Plan
60

Aim of the project
• Build on freight plans already developed by eThekwini Municipality, Transnet & Dube Tradeport;
• Develop a set of interventions that will essentially address freight & logistics infrastructure & operations within the municipal area;
• Minimize logistics costs; &
• Enhance the cities industrial competitiveness by taking advantage of freight & logistics infrastructure & operators located in the municipal area.
61
62 PAGE
Thank you!
Do you have any
questions!