DHC Q2'21 Investor Presentation
26
1 INVESTOR PRESENTATION August 2021
Transcript of DHC Q2'21 Investor Presentation

1
INVESTOR PRESENTATIONAugust 2021

2
WARNING CONCERNING FORWARD LOOKING STATEMENTSThis presentation contains statements that constitute forward‑looking statements within the meaning of the Private Securities Litigation Reform Act of 1995 and other securities laws. Also, whenever we use words such as “believe”, “expect”, “anticipate”, “intend”, “plan”, “estimate”, “will”, “may” and negatives or derivatives of these or similar expressions, we are making forward‑looking statements. These forward‑looking statements are based upon our present intent, beliefs or expectations, but forward‑looking statements are not guaranteed to occur and may not occur. Forward-looking statements in this presentation relate to various aspects of our business, including the COVID‑19 pandemic and its impact on us and our tenants’, managers’ and operators’ businesses and the healthcare sector, including the ability of our tenants and senior living community residents to pay rent to us, our ability to pay distributions to our shareholders and to sustain the amount of such distributions, the ability of our senior living community managers to minimize the negative impact from the COVID‑19 pandemic on our senior living communities and to manage them profitably and increase our returns, our belief that we are well positioned to weather the present disruptions facing the real estate industry and, in particular, the real estate healthcare industry, including the senior living industry, our belief that the healthcare sector and many of our tenants, managers and operators provide essential services across the United States and the implication that our and our tenants’, managers’ and operators’ businesses will remain open to provide such essential service, our expectations regarding the quality and future performance of the new third party managers of the 51 senior living communities we have recently transitioned from Five Star Senior Living Inc. (Five Star) and the 33 senior living communities we expect to transition from Five Star in the near term, our expectation that we will execute agreements to transition 24 of our senior living communities that are currently being managed by Five Star to new managers by the end of 2021, whether the aging U.S. population and increasing life spans of seniors will increase the demand for senior living communities and other medical and healthcare related properties and healthcare services, our ability to retain our existing tenants, attract new tenants and maintain or increase current rental rates on terms as favorable to us as our prior leases, our leasing pipeline, the credit qualities of our tenants, our ability to compete for tenancies and acquisitions effectively, our potential receipt of any additional funding under the Coronavirus Aid, Relief, and Economic Security Act, our expectation that our redevelopment projects will be completed on budget by the estimated completion dates, our acquisitions and sales of properties, our closures of senior living communities, our ability to raise debt or equity capital, our ability to complete dispositions, the future availability of borrowings under our revolving credit facility, our policies and plans regarding investments, financings and dispositions, whether we may contribute additional properties to our joint venture and receive proceeds from the other investors in the joint venture in connection with those contributions, our ability to pay interest on and principal of our debt, our ability to appropriately balance our use of debt and equity capital, our credit ratings, our expected management fees and the expected trading price of our common shares.
Our actual results may differ materially from those contained in or implied by our forward‑looking statements as a result of various factors, such as the impacts of the COVID‑19 pandemic and its aftermath on us and our tenants’, managers’ and operators’ businesses, the impact of conditions in the economy and the capital markets on us and our tenants, managers and operators, compliance with, and changes to, applicable laws, regulations and rules, limitations imposed on our business and our ability to satisfy complex rules in order for us to maintain our qualification for taxation as a real estate investment trust (REIT) for U.S. federal income tax purposes, competition within the healthcare and real estate industries, actual and potential conflicts of interest with our related parties and acts of terrorism, outbreaks, pandemics, including the COVID‑19 pandemic, or other manmade or natural disasters beyond our control. For example: (a) (i) under the current economic conditions, our tenants, managers and operators may not be able to profitably operate their businesses at our properties, our tenants may become unable or unwilling to pay rent owed to us, or the managers or operators of our senior living communities may be unable to generate our minimum returns for sustained periods as a result of the COVID-19 pandemic or otherwise; (ii) if we default under our credit facility or other debt obligations due to the impacts of the COVID‑19 pandemic or otherwise, we may be required to repay our outstanding borrowings and other debt; and (iii) although we have taken steps to enhance our ability to maintain sufficient liquidity, unanticipated events, such as emergencies in addition to, or as an expansion of, the current impacts of the COVID‑19 pandemic, may require us to expend amounts not currently planned; (b) even though vaccinations have been administered at senior living communities in our senior housing operating portfolio (SHOP) segment, the senior living industry may not recover to pre-pandemic levels for an extended period of time or at all if market preferences and practices result in older adults utilizing less services of the type offered at our communities; (c) Five Star has experienced, and our other senior living community managers may experience, operating and financial challenges resulting from a number of factors, some of which are beyond Five Star's or any such other manager's control, and which challenges impact our operating results from our managed senior living communities; (d) we may be unable to identify new managers for the 24 remaining communities that we believe are sufficiently qualified or we may be unable to reach agreement with any such managers on management terms before year end 2021 or at all, and any agreement we may reach with any such managers may not be on the terms we currently expect or desire, and may not be equal to or more favorable to us than the terms of our current management arrangements with Five Star, and further, transitions may not be successful and such managers may not be able to manage our senior living communities profitably or increase our returns; (e) we may sell some or all of our Five Star common shares, or our ownership interest in Five Star may otherwise be diluted in the future; (f) our distributions to our shareholders are set by our Board of Trustees, which considers many factors when setting or resetting our distribution rate, including our historical and projected net income, normalized funds from operations (Normalized FFO), requirements to maintain our qualification for taxation as a REIT, limitations in the agreements governing our debt, the availability to us of debt and equity capital, our expectation of our future capital requirements and operating performance, our expected needs for and availability of cash to pay our obligations and other factors deemed relevant by our Board of Trustees in its discretion, and our projected cash available for distribution in the future may change and may vary from our expectations; accordingly, future distributions may be increased or decreased and we cannot be sure as to the rate at which future distributions will be paid; (g) our ability to make future distributions to our shareholders and to make payments of principal and interest on our indebtedness depends upon a number of factors, including our future earnings, the capital costs we incur to lease and operate our properties and our working capital requirements; accordingly, we may be unable to pay our debt obligations when they become due or to maintain our current rate of distributions on our common shares and future distributions may be reduced or eliminated; (h) we cannot be sure we will sell any properties we plan to sell or what the terms or timing of any such sales may be, including as a result of current market conditions related to the COVID‑19 pandemic, and we cannot be sure that we will acquire replacement properties that improve the quality of our portfolio or our ability to increase our distributions to shareholders and we may sell properties at prices that are less than expected and less than their carrying values and therefore incur losses; (i) contingencies in our acquisition and sale agreements that we may enter may not be satisfied and any acquisitions and sales pursuant to such agreements and any related management arrangements we may expect to enter may not occur, may be delayed or the terms of such transactions or arrangements may change; (j) the capital investments we are making at our senior living communities and our plan to invest additional capital into our senior living communities to better position them in their respective markets in order to increase our future returns may not be successful and may not achieve our expected results, and our senior living communities may not be competitive despite these capital investments, or these capital investments may be delayed due to the COVID‑19 pandemic; (k) our redevelopment projects may not be successful and may cost more or take longer to complete than we currently expect, and we may not realize the returns we expect from these projects and we may incur losses from these projects, and any letters of intent we entered and may enter into to lease our redevelopment projects may not materialize; (l) we may spend more for capital expenditures than we currently expect; (m) our existing joint venture and any other joint ventures that we may enter may not be successful; (n) our tenants may experience losses and default on their rent obligations to us; (o) some of our tenants may not renew expiring leases, and we may be unable to obtain new tenants to maintain or increase the historical occupancy rates of, or rents from, our properties; (p) we may be unable to identify properties that we want to acquire or to negotiate acceptable purchase prices, acquisition financing, management agreements or lease terms for new properties, and we are currently subject to restrictions on our ability to make acquisitions pursuant to the agreement governing our revolving credit facility; (q) rents that we can charge at our properties may decline because of changing market conditions or otherwise; (r) although we have obtained a waiver from compliance with certain financial covenants under our credit agreement through June 2022, if our operating results and financial condition are further significantly and adversely impacted by current economic conditions or otherwise, we may fail to comply with the terms of the waiver and other requirements under our credit agreement, and we may also fail to satisfy certain financial requirements under the agreements governing our public debt (for example, our ratio of consolidated income available for debt service to debt service was below the 1.5x incurrence requirement under our credit agreement and our public debt covenants as of June 30, 2021, and we cannot be certain how long this ratio will remain below 1.5x; we are prohibited from incurring additional debt while this ratio is below 1.5x, but are not required to repay outstanding debt as a result of failure to comply with this financial requirement; we are currently fully drawn under our revolving credit facility and could also be required to repay our outstanding debt in the event of non-compliance with certain other requirements of our credit agreement or the agreements governing our public debt); (s) actual costs under our revolving credit facility or other floating rate debt will be higher than the stated rates because of fees and expenses associated with such debt; (t) our options to extend the maturity date of our revolving credit facility is subject to our payment of a fee and meeting other conditions that may not be met; (u) further changes in our credit ratings may cause the interest and fees we pay to further increase; (v) our residents and patients may become unable to fund our charges with private resources and we may be required or may elect for business reasons to accept or pursue revenues from government sources, which could result in an increased part of our NOI and revenue being generated from government payments and our becoming more dependent on government payments; (w) circumstances that adversely affect the ability of seniors or their families to pay for our managers’ or operators’ services, such as economic downturns, weak housing market conditions, higher levels of unemployment among our residents’ family members, lower levels of consumer confidence, stock market volatility and/or changes in demographics generally could affect the profitability of our senior living communities; (x) our unspent leasing related obligations may cost more or less and may take longer to complete than we currently expect, and we may incur increasing amounts for these and similar purposes in the future; (y) operating deficiencies or a license revocation at one or more of our senior living communities may have an adverse impact on our ability to obtain licenses for, or attract residents to, our other communities; (z) the trading price of our common shares is beyond our control and may increase or decrease more than we currently expect; and (aa) the advantages we believe we may realize from our relationships with related parties may not materialize.Our Annual Report on Form 10‑K for the year ended December 31, 2020 and our other filings with the Securities and Exchange Commission (SEC) identify other important factors that could cause differences from our forward‑looking statements. Our filings with the SEC are available on the SEC’s website at www.sec.gov. You should not place undue reliance upon our forward‑looking statements. Except as required by law, we do not intend to update or change any forward‑looking statements as a result of new information, future events or otherwise.
NON‑GAAP FINANCIAL MEASURES
This presentation contains non‑GAAP financial measures including Normalized FFO, adjusted EBITDA, NOI and cash basis NOI. Reconciliations for these metrics to the closest U.S. generally accepted accounting principles (GAAP) metrics are included in an appendix hereto.Note: Unless otherwise noted, data is presented as of June 30, 2021.

3
REASONS TO INVEST IN DHC
3
An institutional quality portfolio that is
diversified across the healthcare spectrum, and seeks long-term
stable growth.
Predominantly private pay assets with limited
exposure to Government reimbursement
programs such as Medicare and Medicaid.
Long-term, positive healthcare
demographics that offer potential for improved industry
fundamentals.
Diversified tenant credit profile with almost 600
tenants in the Office Portfolio Segment.
Strong management platform with efficiency
advantages.
Deep valuation disconnect, which creates an attractive
buying opportunity.

4
DHC seeks to capitalize on the healthcare demands of an aging U.S. population.
A WELL POSITIONED NATIONAL HEALTHCARE REIT
4
392Healthcare Related
Properties
$8.2BInvestment Portfolio
10.9M sfMedical Office & Life
Science Space
27,750Senior Living
Community Units
Focused growth◦ Well-located medical office and life science buildings, and private pay senior
living communities in diverse markets.
Scale and diversity◦ With an $8.2 billion national investment portfolio and almost 600 medical
office and life science tenants, DHC is well scaled with strong credit diversity.
4

5
PORTFOLIO PROFILE
DHC’s historically opportunistic approach to investing in quality healthcare related properties has created a portfolio that is broadly diversified with national scale.
5
Asset Class By NOI(1)(2)
(based on Q2 2021 NOI)
392 properties located in 36 states and Washington, D.C.
Life Science 39%
Medical Office 36%
Independent Living 14%
Assisted Living 7%
Wellness Centers 4%
Skilled Nursing Facilities <1%
Geographic Diversification By HoldingsMA 16% NC 4%CA 10% WI 3%
FL 8% IL 3%
TX 8% VA 3%
GA 5% 26 Other States + D.C. 36%
MD 4% Total 100%
Geographic Diversification By Gross Book Value Of Real Estate Assets
(1) Senior living communities are categorized by the type of living units which constitute a majority of the living units at the community.(2) Includes $772 thousand of revenues and $579 thousand of NOI from properties that we sold.
# of PropertyHoldings

6
HIGH QUALITY MEDICAL OFFICE AND LIFE SCIENCE PORTFOLIO
6
Almost 600 tenants with same property occupancy of 92.3%(1)
at June 30, 2021.
Maryland Heights, MOTenant: Magellan Health Care
Square feet: 232,521
(1) Occupancy data is as of quarter end and includes (i) space which is leased but is not occupied or is being offered for sublease by tenants, and (ii) space being fitted out for occupancy.
Overland Park, KSMain Tenant: IQVIASquare feet: 239,366
Boston, MATenant: Vertex PharmaceuticalsSquare feet: 1,134,479
Los Angeles, CAMain Tenant: Cedars-Sinai Medical Center
Square feet: 330,892
Washington, DCMulti-tenant MOBSquare feet: 139,748

7
Patient Care39.5%
Life Science52.0%
Other8.5%
OFFICE PORTFOLIO
7
(1) Includes both medical office and life science properties. Based on Q2 2021 NOI. See Appendix for the calculation of NOI and a reconciliation of net income (loss) determined in accordance with GAAP to that amount.
(2) As of market close, August 6, 2021. Source: S&P Global.(3) LTM GAAP total revenues as reported by Vertex for the period ended June 30, 2021.
• Pharmaceutical company with a focus on medicines that treat cystic fibrosis.
• Market Cap. of approximately $51.6 billion(2).
• LTM revenues of $6.7 billion(3).
TENANTS INCLUDEOffice Portfolio Segment(1)

8
Bill
ions
($)
Q2
2005
Q4
2005
Q2
2006
Q4
2006
Q2
2007
Q4
2007
Q2
2008
Q4
2008
Q2
2009
Q4
2009
Q2
2010
Q4
2010
Q2
2011
Q4
2011
Q2
2012
Q4
2012
Q2
2013
Q4
2013
Q2
2014
Q4
2014
Q2
2015
Q4
2015
Q2
2016
Q4
2016
Q2
2017
Q4
2017
Q2
2018
Q4
2018
Q2
2019
Q4
2019
Q2
2020
Q4
2020
Q2
2021
0.00
2.50
5.00
7.50
10.00
12.50
MEDICAL OFFICE AND LIFE SCIENCE DYNAMICS
Strong demographic tailwinds driving healthcare real estate demand.
8
• Between now and 2030, more than 20% (or the equivalent of 10,000 Baby Boomers per day) of the total U.S. population will reach the age of 65(1).
• Physician and clinical services spending is projected to grow at an average rate of 5.4% per year and reach $1.2 trillion by 2027.
• The demand for life science innovation is rapidly growing. Real estate is becoming a key component for collaborative R&D environments such as incubator spaces in innovation clusters(3).
• Venture capital funding to the life science industry has surged over the past few years, driving employment growth and increased attention from new investors. VC Funding is up 16.6% CAGR since 2005(3).
(1) Source: U.S. Census Bureau.(2) Source: Centers for Medicare & Medicaid Services, Office of the Actuary, September 2018.(3) Source: Bloomberg, August 2021. Includes venture capital transactions where at least one entity involved is a biotechnology, healthcare-products or pharmaceutical company.
Life Science VC Transactions(3)
16.6% CAGR

9
25%
75%51%
49%
GROWING MEDICAL OFFICE AND LIFE SCIENCE EXPOSURE
DHC has been shifting its portfolio mix toward high quality Medical Office and Life Science properties.
9
• As of June 30, 2021, our same property Office Portfolio occupancy was 92.3%(4).
• Geographically diversified Medical Office portfolio with no market exposure greater than 10%(3).
• Well laddered lease expiration schedule.
• Weighted average remaining lease term is 6 years(5).
Diversifying into Medical Office & Life Sciences NOI(1) Medical Office & Life Science Annualized Rental Income Expiring(2)
Geographically Diversified Medical Office Portfolio(3)
(1) See Appendix for the calculations of NOI and cash basis NOI and a reconciliation of net income (loss) determined in accordance with GAAP to those amounts. Includes $772K of revenues and $529K of NOI from properties we sold.(2) Annualized rental income is based on rents pursuant to existing leases as of June 30, 2021. Annualized rental income includes estimated percentage rents, straight line rent adjustments and estimated recurring expense
reimbursements for certain net and modified gross leases; excludes lease value amortization at certain of our medical office and life science properties. Annualized rental income amounts for our medical office and life science properties also include 100% of rental income as reported under GAAP from the life science property owned in a joint venture arrangement in which we own a 55% equity interest.
(3) Medical office and life science geographic exposure data is on a square foot basis and is as of June 30, 2021, and includes (i) out of service assets undergoing redevelopment, (ii) space which is leased but is not occupied or is being offered for sublease by tenants and (iii) space being fitted out for occupancy.
(4) Medical office and life science same property occupancy data is as of June 30, 2021 and includes space which is leased but is not occupied or is being offered for sublease by tenants and space being fitted out for occupancy.(5) Average remaining lease term is weighted by annualized rental income as of June 30, 2021.
Strong Life Science Concentration in Top 3 Life
Science Markets(3)
2008 2015 Q2 2021
100%
8%5%
14%
7% 7%4%
32%
4%
17%
2022 2023 2024 2025 2026 2027 2028 2029 2030+—%
10%
20%
30%
40%
50%
10%
8%
8%
5%
5%5%
59%
39%
11%10%
40%

10
Project LocationType of Property
Square Feet (1)
Estimated Project Costs (2)
Total Costs Incurred as of June 30,
2021(3)Estimated
Completion (4)
4 Maguire Road Lexington, MA Life Science 53,905 $ 28.7 $ 9.4 Q4 2021
1415 West 3rd Street Tempe, AZ Life Science 82,257 $ 11.4 $ 0.7 Q2 2022
OFFICE PORTFOLIO - SECOND QUARTER UPDATE
10
As of June 30 2021, our Office Portfolio represents 75% of our total NOI.
Leasing: ◦ During the second quarter of 2021, we executed approximately 632,000 square feet of new and renewal
leases at the highest level in our history. These leases were signed at a weighted average lease term of 9.1 years with leasing costs of approximately $4.60 per square foot per year.
◦ Our leasing pipeline contains approximately one million square feet, which is roughly in line with the 2019 average of 1.2 million square feet.
◦ Subsequent to quarter end, we signed a full-building life sciences tenant for a 10-year lease at our Lexington, Massachusetts redevelopment at a roll-up in rent of 46%.
Redevelopments:
(1) Represents estimated square footage upon project completion.(2) Project costs include estimated leasing capital up to stabilization, $ in millions.(3) $ in millions.(4) Estimated completion date can depend on various factors, including when lease agreements are signed with tenants. Therefore, the actual completion dates may vary.
Rendering of 4 Maguire RoadLexington, MA

11
SENIOR LIVING PORTFOLIO
11
The Palms at Lake SpiveyJonesboro, GA200 Units
Five Star Premier ResidencesPompano Beach, FL170 Units
The Forum at Deer CreekDeerfield Beach, FL288 Units
Fieldstone PlaceClarksville, TN
102 Units
Granite GatePrescott, AZ123 Units

12
IL55%AL
36%
MC9%
IL7%
AL55%
MC19%
SNF19%
RESTRUCTURED SHOP SEGMENT
12
DHC's plan to transition management of 108 communities with approximately 7,500 units to a diverse group of best-in-class operators remains on schedule
"Transitioning" Communities:• After dividing communities into smaller portfolios, new managers are being chosen based on the following criteria:
◦ Operating experience.◦ Experience with higher acuity residents and smaller communities.
• As of August 23, 2021:◦ Signed four new management agreements for a total of 84 communities, representing approximately 78% of the
transitioning communities.◦ Of these 84 communities, 45 have been transitioned to new third party managers.
"Retained" Communities• Five Star will continue to manage 120 of our senior living communities with approximately 18,000 living units. • Approximately 1,500 skilled nursing units in 27 continuing care retirement communities have been closed and will be
repositioned.
Timeline• The transition of management to other operators is expected to be completed before year end 2021.
Unit Mix Unit Mix(1)108 Transitioning Communities 120 FVE Retained Communities
(1) Does not include approximately 1,500 skilled nursing units in continuing care communities that were recently closed and are expected to be repositioned.

13
(bp
s)
Monthly Occupancy Change
Aug-20
Sep-20
Oct-20
Nov-20
Dec-20
Jan-21
Feb-21
Mar-21
Apr-21
May-21
Jun-21
Jul-2
1-200
-150
-100
-50
0
50
SENIOR LIVING PORTFOLIO OVERVIEW
13
Current Portfolio (as of June 30, 2021)Operator Community Mix Number of
Communities(1) Units(1)
Five Star Managed - SHOP IL, AL, MC 120 17,898
Transitioning to New Operators - SHOP IL, AL, MC, SNF, CCRC 108 7,525
SHOP SegmentIL, AL, MC, SNF, CCRC
228 25,423
NNN SubtotalIL, AL, MC, SNF, CCRC
29 2,327
Total Senior Living 257 27,750
(1) Excludes properties classified as held for sale or closed.(2) Same property includes those properties classified as same property for the three months ended June 30, 2021 for all periods presented.
• Same property SHOP monthly occupancy hit a pandemic low of 70.3% in February 2021.
• The pace of occupancy declines slowed in 2021 and recently increased for the first time since the pandemic began.
SHOP Occupancy is Beginning to Recover...• Despite the pandemic, average monthly rate in our same property
communities has remained resilient over the past four consecutive quarters.• We believe this will help preserve margins as senior living occupancy begins
to recover.
Year-over-Year Same Property Monthly Rate Growth
3Q2020 4Q2020 1Q2021 2Q2021-1.0%
0.0%
1.0%
2.0%
...While SHOP Rate Has Remained Resilient
(2)

14
CURRENT ENVIRONMENT & FUTURE DEMOGRAPHICS
14
Age 85+ Population Growth(1) COVID-19 Presents Short-Term Challenges, But Long-Term Demographics Remain
Compelling
• Senior living demographic of 85+ population is projected to grow over 30% in the next five years.
• National healthcare spending is projected to grow at an average rate of 5.7% per year and reach $6.0 trillion by 2027(2).
(1) Source: U.S. Census Bureau, “2014 National Population Projections”. (2) Source: Centers for Medicare & Medicaid Services, www.cms.gov.(3) Source: NIC Map © Data Service, as of Q2 2021. For more information on the NIC MAP © Data Service, please visit
www.nic.org/NIC-map.
2020E – 2035E
Primary & Secondary Market Senior Living Supply: Units Started as a % of Inventory(3)
Supply Trends Favorable Amidst COVID-19
• Primary & Secondary market senior living unit construction starts as a percentage of inventory have fallen significantly since the outset of the COVID-19 pandemic.
• We expect unit construction starts as a percentage of inventory to remain muted.
2008
Q1
2008
Q4
2009
Q3
2010
Q2
2011
Q1
2011
Q4
2012
Q3
2013
Q2
2014
Q1
2014
Q4
2015
Q3
2016
Q2
2017
Q1
2017
Q4
2018
Q3
2019
Q2
2020
Q1
2020
Q4
—%
1.00%
2.00%
3.00%
4.00%
5.00%

15
Floating Rate Debt Unsecured Fixed Rate Debt Secured Fixed Rate Debt
2021 2022 2023 2024 2025 2026 2027 2028 2029 Thereafter$0
$200
$400
$600
$800
$1,000
$1,200
FINANCIAL PROFILE: WELL LADDERED DEBT MATURITIES
15
Debt Maturity Schedule(as of June 30, 2021)
(1)
(1) Represents outstanding borrowings under our revolving credit facility as of June 30, 2021. Upon payment of an extension fee and our meeting certain conditions, we have two, one-year options which, if both are executed, would extend the maturity date of our revolving credit facility to January 2024.
(2) Includes $7.2M of finance lease obligations due through April 2026.
(2)
16
FINANCIAL PROFILE: LIQUIDITY
16
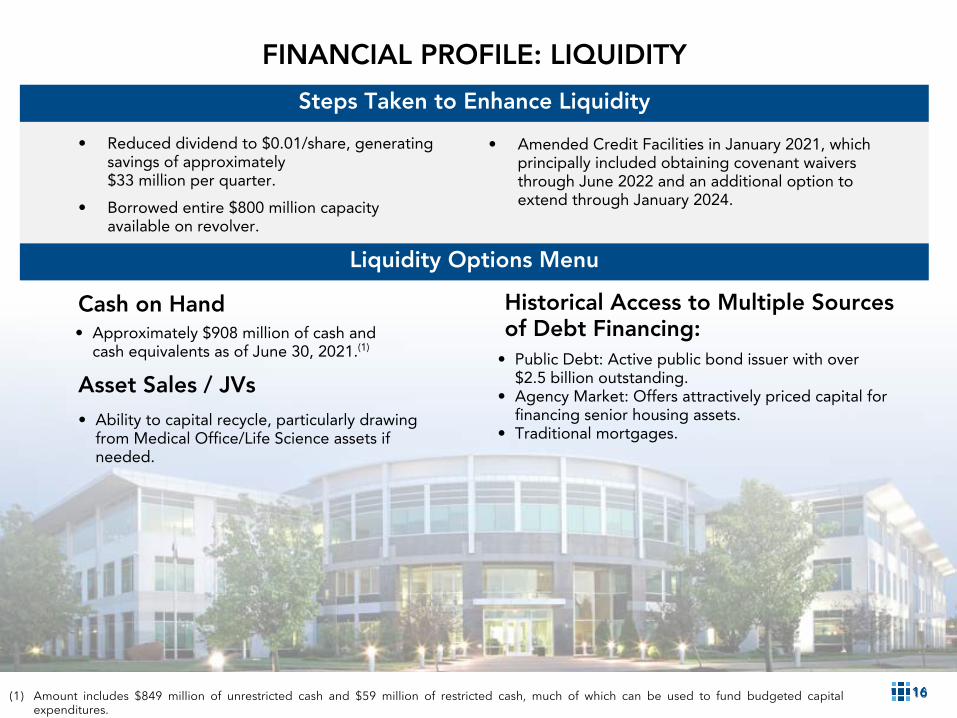
Steps Taken to Enhance Liquidity
Liquidity Options Menu
• Amended Credit Facilities in January 2021, which principally included obtaining covenant waivers through June 2022 and an additional option to extend through January 2024.
• Reduced dividend to $0.01/share, generating savings of approximately $33 million per quarter.
Asset Sales / JVs• Ability to capital recycle, particularly drawing
from Medical Office/Life Science assets if needed.
• Public Debt: Active public bond issuer with over $2.5 billion outstanding.
• Agency Market: Offers attractively priced capital for financing senior housing assets.
• Traditional mortgages.
Historical Access to Multiple Sources of Debt Financing:• Approximately $908 million of cash and
cash equivalents as of June 30, 2021.(1)
Cash on Hand
(1) Amount includes $849 million of unrestricted cash and $59 million of restricted cash, much of which can be used to fund budgeted capital expenditures.
• Borrowed entire $800 million capacity available on revolver.

17
STRONG MANAGEMENT PLATFORM ADVANTAGES
17
Financial Services: Real Estate Services: Business Services:
Accounting Acquisitions/ Dispositions Administration
Capital Markets Asset Management Human Resources
Compliance/ Audit Construction/Development
Information Technology (IT)
Finance/ Planning Engineering Investor Relations
Treasury Leasing Marketing
Tax Property Management
Legal/Risk Management
RMR’s Operations Include:
Approximately
43,000 Employees
Nearly 2,100 Properties
Approximately $10 Billion in Annual Revenues
Combined RMR Managed Companies:
Office Industrial Government Medical Office Life Sciences Senior Living Hotels Retail
THE RMR GROUP LLC(1)
$32.4 Billion in AUM
Over 600 CRE Professionals
More than 30 Offices Throughout the U.S.
(1) As of June 30, 2021.
DHC IS MANAGED BY THE RMR GROUP, AN ALTERNATIVE ASSET MANAGER.
NATIONAL MULTI-SECTOR INVESTMENT PLATFORM

18
EPA’S ENERGY STAR Partner of the Year 2019 - 2021.
63 properties with EPA ENERGY STAR certifications
66 properties with BOMA designations.
Ranked #1 for portfolio with most designations
33 properties with LEED designations
Boston Globe’s Top Places to Work; ranked 28th in Large
Company category 2020
Commercial Property Executive
Top Commercial
Property Managers;
ranked 9th 2020
Women on Boards; Winning
Organization 2020
Fortune Magazine’s
Fastest Growing
Companies ranked 75th
2019
IREM Real Estate
Management Excellence
Award (REME) for Leadership
& Development 2019
A WINNING TRADITION
The RMR Group Recognition
Sustainability
Boston Business Journal Middle Market Leader
2020, 2021
Globe St. Real Estate Forum's Best Places to
Work 2021

19
DHC BENEFITS FROM RELATIONSHIP WITH THE RMR GROUP
19
RMR Provides DHC with scale and efficiencies
◦ DHC has no employees; RMR provides all services.
◦ RMR’s acquisitions team sees a substantial number of properties marketed for sale in every market across the United States.
◦ RMR attracts very strong real estate professionals (acquisitions, asset management, property management, finance, accounting, etc.) because of the size of the portfolios for which they will be responsible.
◦ RMR provides job growth opportunities for employees which is a benefit when hiring.
◦ RMR property management employees focus only on assets managed by RMR, with no conflicting responsibilities for other owners.
◦ DHC benefits from the scale of a $32.4 billion platform(1). Examples:
▪ Centralized procurement.
▪ Centralized services.
▪ Banking and capital markets.
DHC’s G&A as a percent of total revenues compares favorably to its peer group(2):
(1) As of June 30, 2021(2) Source: S&P Global Market Intelligence and company filings. Data is as of the most recently reported quarter.
2.6% 2.7% 3.6%5.4% 5.5% 5.5% 5.7% 6.2% 6.6% 7.5% 7.9%
9.3% 10.0%12.5% 12.6%
16.0% 16.8%
DHC WELL VTR PEAK SBRA NHI HTA HR OHI SNR DOC MPW CTRE CHCT LTC GMRE GBCS—%
10.0%
20.0%

20
MANAGEMENT AGREEMENT PROVIDES FOR ALIGNMENT OF INTERESTS
20
RMR base management fee tied to DHC share price performance• Consists of an annual fee based on 50 bps of the lower of: (1) DHC’s
historical cost of real estate, or (2) DHC’s total market capitalization.
– As of June 30, 2021, the run rate of lost revenues for RMR was $14.6 million dollars per year as DHC’s shares traded lower.
• There is no incentive for RMR to complete any transaction that could reduce DHC’s share price.
RMR incentive fees contingent on total shareholder return outperformance• Equal to 12% of value generated by DHC in excess of the benchmark
index total returns (SNL US Healthcare REIT Index)(1) per share over a three year period, subject to a cap (1.5% of equity market cap).
• Outperformance must be positive: it can’t be the best of the worst.
• Shareholders keep 100% of benchmark returns and at least 88% of returns in excess of the benchmark.
Other fees
• Property management fee: consists of an annual fee based on 3.0% of rents collected at DHC’s medical office and life science properties.
• Construction supervision fee based on project costs.
(1) As of August 7, 2021, the SNL US Healthcare REIT Index was discontinued. We are currently working with S&P Global to identify an alternative with the goal of finding REIT indices that most closely replicate the performance of the expiring legacy SNL benchmarks.
(2) Data as of June 30, 2021.
Alignment of Interests
If DHC’s total market cap exceeds historical cost of real estate, base fee is paid on assets.
If DHC’s total market cap is less than historical cost of real estate, base fee fluctuates with share price.
Incentive fee structure keeps RMR focused on increasing total shareholder return.
Members of RMR senior management are holders of DHC shares, some subject to long term lock up agreements.
DHC shareholders have visibility into publicly traded RMR.
DHC benefits from RMR’s national footprint and economies of scale of $32.4 billion(2) platform.

APPENDIX
Rendering of Muse at Torrey Pines

22
For the Three Months Ended June 30,
For the Six Months Ended June 30,
(Dollars in thousands, except per share data) 2021 2020 2021 2020
Rental income $ 102,394 $ 106,207 $ 205,152 $ 216,705
Residents fees and services 243,947 304,104 503,913 636,073
Total revenues 346,341 410,311 709,065 852,778
Net loss (32,645) (24,742) (98,828) (13,599) Net loss attributable to common shareholders $ (34,222) $ (26,072) $ (101,727) $ (16,337)
NOI(2) 81,709 108,396 157,042 234,278
NOI margin % 23.6 % 26.4 % 22.1 % 27.5 %
Adjusted EBITDAre(3) $ 87,789 $ 111,640 $ 160,992 $ 233,280
Normalized FFO attributable to common shareholders(4) $ 12,215 $ 59,709 $ 18,038 $ 132,726
Per share data:
Common dividend $ 0.01 $ 0.01 $ 0.02 $ 0.02
Normalized FFO attributable to common shareholders(4) $ 0.05 $ 0.25 $ 0.08 $ 0.56
Normalized FFO attributable to common shareholders payout ratio(4) 20.0 % 4.0 % 25.0 % 3.6 %
(1) See Definitions of Certain Non-GAAP Financial Measures in the appendix for a description of why we believe they are appropriate supplemental measures and a description of how we use these measures.
(2) See appendix for the calculation of NOI and a reconciliation of net income (loss) determined in accordance with GAAP to these amounts.(3) See appendix for the calculation of EBITDA, EBITDAre and Adjusted EBITDAre and a reconciliation of net income (loss) determined in accordance with GAAP to these amounts.(4) See appendix for the calculation of Normalized FFO attributable to common shareholders and a reconciliation of net income (loss) attributable to common shareholders
determined in accordance with GAAP to these amounts.
FINANCIAL SUMMARY(1)

(1) See Definitions of Certain Non-GAAP Financial Measures in appendix for a definition of NOI and Cash Basis NOI, a description of why we believe they are appropriate supplemental measures and a description of how we use these measures.
(Dollars in thousands)
CALCULATION AND RECONCILIATION OF NOI AND CASH BASIS NOI(1)
23
For the Three Months Ended6/30/2021 3/31/2021 12/31/2020 9/30/2020 6/30/2020
Calculation of NOI and Cash Basis NOI:
Revenues:Rental income $ 102,394 $ 102,758 $ 106,272 $ 104,238 $ 106,207 Residents fees and services 243,947 259,966 278,637 290,101 304,104
Total revenues 346,341 362,724 384,909 394,339 410,311 Property operating expenses (264,632) (287,391) (302,207) (315,650) (301,915)
NOI 81,709 75,333 82,702 78,689 108,396
Non-cash straight line rent adjustments included in rental income (1,321) (804) (3,040) (491) (1,385) Lease value amortization included in rental income (1,849) (1,866) (1,846) (1,856) (1,830) Non-cash amortization included in property operating expenses (199) (199) (200) (199) (199)
Cash Basis NOI $ 78,340 $ 72,464 $ 77,616 $ 76,143 $ 104,982
Reconciliation of Net Income (Loss) to NOI and Cash Basis NOI:
Net (loss) income $ (32,645) $ (66,183) $ (14,920) $ (105,788) $ (24,742)
Income tax expense 191 238 202 365 1,126
Loss on early extinguishment of debt 370 2,040 — — 181 Gain on lease termination — — — — — Interest expense 67,657 60,091 57,768 58,091 43,974
Interest and other income (16,038) (2,835) (10,213) (134) (7,736) Losses (gains) on equity investments, net 3,849 8,339 (19,565) (12,510) (11,974)
(Gain) loss on sale of properties (30,760) 122 (4,084) 211 168 Impairment of assets — (174) 361 64,202 31,175 Acquisition and certain other transaction related costs 12,071 — 11 53 87 General and administrative 9,126 7,542 7,461 6,988 7,312 Depreciation and amortization 67,888 66,153 65,681 67,211 68,825
NOI 81,709 75,333 82,702 78,689 108,396
Non-cash straight line rent adjustments included in rental income (1,321) (804) (3,040) (491) (1,385) Lease value amortization included in rental income (1,849) (1,866) (1,846) (1,856) (1,830)
Non-cash amortization included in property operating expenses (199) (199) (200) (199) (199) Cash Basis NOI $ 78,340 $ 72,464 $ 77,616 $ 76,143 $ 104,982

For the Three Months Ended
6/30/2021 3/31/2021 12/31/2020 9/30/2020 6/30/2020
Net loss $ (32,645) $ (66,183) $ (14,920) $ (105,788) $ (24,742)
Interest expense 67,657 60,091 57,768 58,091 43,974
Income tax expense (benefit) 191 238 202 365 1,126
Depreciation and amortization 67,888 66,153 65,681 67,211 68,825
EBITDA 103,091 60,299 108,731 19,879 89,183
(Gain) loss on sale of properties (30,760) 122 (4,084) 211 168
Impairment of assets — (174) 361 64,202 31,175
Adjustments to reflect our share of EBITDAre attributable to an equity method investment (2,673) 2,310 1,967 2,419 1,705
EBITDAre 69,658 62,557 106,975 86,711 122,231
General and administrative expense paid in common shares 675 228 402 502 415
Acquisition and certain other transaction related costs 12,071 — 11 53 87
Gain on lease termination — — — — —
Loss on early extinguishment of debt 370 2,040 — — 181
Costs and payment obligations related to compliance assessment at one of our senior living communities — — (402) 6,172 —
Losses (gains) on equity securities, net 3,849 8,339 (19,565) (12,510) (11,974)
Adjustments to reflect our share of Adjusted EBITDAre attributable to an equity method investment $ 1,166 39 (203) (100) 700
Adjusted EBITDAre $ 87,789 $ 73,203 $ 87,218 $ 80,828 $ 111,640
(1) See Definitions of Certain Non-GAAP Financial Measures in the appendix for a definition of EBITDA, EBITDAre and Adjusted EBITDAre and a description of why we believe they are appropriate supplemental measures.
CALCULATION AND RECONCILIATION OF EBITDA, EBITDAre, AND ADJUSTED EBITDAre(1)
(Dollars in thousands)
24

(1) See Definitions of Certain Non-GAAP Financial Measures in the appendix for a definition of FFO attributable to common shareholders and Normalized FFO attributable to common shareholders, a description of why we believe they are appropriate supplemental measures and a description of how we use these measures.
CALCULATION AND RECONCILIATION OF FFO AND NORMALIZED FFO ATTRIBUTABLE TO COMMON SHAREHOLDERS(1)
25
For the Three Months Ended
(Dollars in thousands, except per share data) 6/30/2021 3/30/2021 12/31/2020 9/30/2020 6/30/2020
Net loss attributable to common shareholders $ (34,222) $ (67,505) $ (16,228) $ (106,888) $ (26,072)
Depreciation and amortization 67,888 66,153 65,681 67,211 68,825
(Gain) loss on sale of properties (30,760) 122 (4,084) 211 168
Impairment of assets — (174) 361 64,202 31,175
Losses (gains) on equity securities, net 3,849 8,339 (19,565) (12,510) (11,974)
FFO adjustments attributable to noncontrolling interest (5,275) (5,273) (5,275) (5,275) (5,275)
Adjustments to reflect our share of FFO attributable to an equity method investment (3,005) 2,036 1,743 1,910 1,601
FFO attributable to common shareholders (1,525) 3,698 22,633 8,861 58,448
Acquisition and certain other transaction related costs 12,071 — 11 53 87
Costs and payment obligations related to compliance assessment at one of our senior living communities — — (402) 6,172 —
Gain on lease termination — — — — —
Loss on early extinguishment of debt 370 2,040 — — 181
Adjustments to reflect our share of Normalized FFO attributable to an equity method investment 1,299 85 12 48 993
Normalized FFO attributable to common shareholders $ 12,215 $ 5,823 $ 22,254 $ 15,134 $ 59,709
Weighted average common shares outstanding (basic) 237,871 237,834 237,834 237,752 237,700
Weighted average common shares outstanding (diluted) 237,871 237,834 237,834 237,752 237,700
Per Common Share Data (basic and diluted):
Net loss attributable to common shareholders $ (0.14) $ (0.28) $ (0.07) $ (0.45) $ (0.11)
FFO attributable to common shareholders $ (0.01) $ 0.02 $ 0.10 $ 0.04 $ 0.25
Normalized FFO attributable to common shareholders $ 0.05 $ 0.02 $ 0.09 $ 0.06 $ 0.25

NOI and Cash Basis NOI
The calculations of NOI and Cash Basis NOI exclude certain components of net income (loss) in order to provide results that are more closely related to our property level results of operations. We calculate NOI and Cash Basis NOI as shown in this appendix. We define NOI as income from our real estate less our property operating expenses. NOI excludes amortization of capitalized tenant improvement costs and leasing commissions that we record as depreciation and amortization. We define Cash Basis NOI as NOI excluding non-cash straight line rent adjustments, lease value amortization, lease termination fee amortization, if any, and non-cash amortization included in property operating expenses. We use NOI and Cash Basis NOI to evaluate individual and company wide property level performance. Other real estate companies and REITs may calculate NOI and Cash Basis NOI differently than we do.
EBITDA, EBITDAre and Adjusted EBITDAre
We calculate EBITDA, EBITDAre and Adjusted EBITDAre as shown in this appendix. EBITDAre is calculated on the basis defined by the National Association of Real Estate Investment Trusts, or Nareit, which is EBITDA, excluding gains or losses on the sale of properties, impairment of assets, if any, including adjustments to reflect our proportionate share of EBITDAre of our equity method investment in Five Star, as well as certain other adjustments currently not applicable to us. In calculating Adjusted EBITDAre, we adjust for the items shown in the appendix. Other real estate companies and REITs may calculate EBITDA, EBITDAre and Adjusted EBITDAre differently than we do.
FFO and Normalized FFO Attributable to Common Shareholders
We calculate FFO attributable to common shareholders and Normalized FFO attributable to common shareholders as shown in this appendix. FFO attributable to common shareholders is calculated on the basis defined by Nareit, which is net income (loss) attributable to common shareholders, calculated in accordance with GAAP, excluding any gain or loss on sale of properties, loss on impairment of real estate assets and gains or losses on equity securities, net, if any, including adjustments to reflect our proportionate share of FFO of our equity method investment in Five Star, plus real estate depreciation and amortization and minus FFO adjustments attributable to noncontrolling interest, as well as certain other adjustments currently not applicable to us. In calculating Normalized FFO attributable to common shareholders, we adjust for the items shown in this appendix. FFO attributable to common shareholders and Normalized FFO attributable to common shareholders are among the factors considered by our Board of Trustees when determining the amount of distributions to our shareholders. Other factors include, but are not limited to, requirements to maintain our qualification for taxation as a REIT, limitations in the agreements governing our debt, the availability to us of debt and equity capital, our expectation of our future capital requirements and operating performance, and our expected needs for and availability of cash to pay our obligations. Other real estate companies and REITs may calculate FFO attributable to common shareholders and Normalized FFO attributable to common shareholders differently than we do.
Non-GAAP Financial Measures
We present certain "non-GAAP financial measures" within the meaning of applicable rules of the SEC, including net operating income, or NOI, Cash Basis NOI, earnings before interest, income tax, depreciation and amortization, or EBITDA, EBITDA for real estate, or EBITDAre, Adjusted EBITDAre, funds from operations attributable to common shareholders, or FFO attributable to common shareholders, and normalized funds from operations attributable to common shareholders, or Normalized FFO attributable to common shareholders. These measures do not represent cash generated by operating activities in accordance with GAAP and should not be considered alternatives to net income (loss) or net income (loss) attributable to common shareholders as indicators of our operating performance or as measures of our liquidity. These measures should be considered in conjunction with net income (loss) and net income (loss) attributable to common shareholders as presented in our condensed consolidated statements of income (loss). We consider these non-GAAP measures to be appropriate supplemental measures of operating performance for a REIT, along with net income (loss) and net income (loss) attributable to common shareholders. We believe these measures provide useful information to investors because by excluding the effects of certain historical amounts, such as depreciation and amortization, they may facilitate a comparison of our operating performance between periods and with other REITs and, in the case of NOI, Cash Basis NOI, reflecting only those income and expense items that are generated and incurred at the property level may help both investors and management to understand the operations of our properties.
DEFINITIONS OF CERTAIN NON-GAAP FINANCIAL MEASURES
26