DG SYSTEM SELECTION IN URBAN AREA
20
TRADEOFF BETWEEN PV AND WIND TURBINE: DG SYSTEM SELECTION IN URBAN RESTRICTED SPACE Presented by: Haryo Agung Wibowo (15862703)* Danilo Coelho Mendes (15853609) * Email: [email protected]
-
Upload
haryo-agung-wibowo -
Category
Engineering
-
view
75 -
download
2
Transcript of DG SYSTEM SELECTION IN URBAN AREA

TRADEOFF BETWEEN PV AND WIND TURBINE: DG SYSTEM SELECTION IN URBAN RESTRICTED SPACEPresented by:Haryo Agung Wibowo (15862703)*Danilo Coelho Mendes (15853609)* Email: [email protected]

STUDY MOTIVATION
•Lack of spacious land in typical urban region but high demand to explore more renewable energy (RE)
•To advise which technology among PV and Wind Turbine gives more energy per m2 of land area

THE ATTRACTIVENESS OF RE
•RE devices are now sold freely in the generic market store, and the price is affordable.
•People thinking RE to reduce electric bill, or even making profit by selling energy.
•Utilities + own RE = redundant system to ensure continuous energy supply

THE UNIQUENESS OF URBAN AREA•High rise building, great number of
residential house, affect RE primary energy sources quality:1. Wind gust >> subject to turbulence2. Solar illumination >> shaded by
adjacent building
• To represent this situation, weather data taken from AUT weather station (WS Building) are used in the analysis

BUILDING COMPLEX
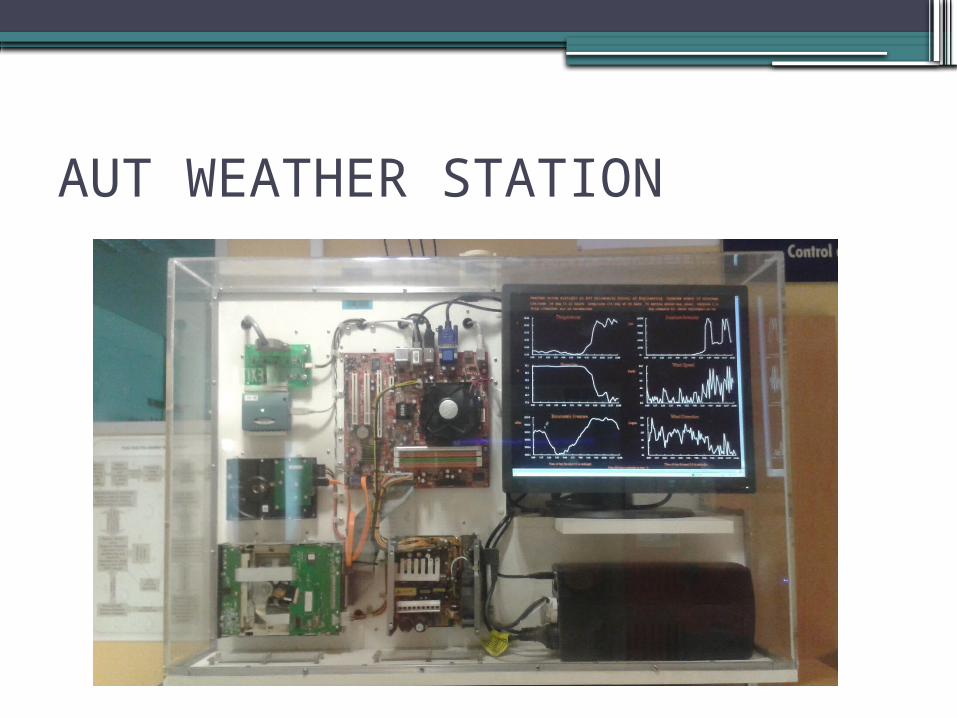
AUT WEATHER STATION

PARAMETER ACQUIRED FROM AUT WEATHER STATION•Wind Speed•Solar Intensity •Ambient Temperature•Wind Direction•Humidity•Barometric Pressure
All data are presumably measured 2 m above WS Building
INPUT FOR WIND TURBINE SOLUTION
INPUT FOR PV SOLUTION

CALCULATING ENERGY DENSITY
•First, predict the annual energy produced by single RE unit (1 wind turbine or 1 solar module)
•Where the point of energy prediction will be made
Load

CALCULATING ENERGY DENSITY
•First, predict the annual energy produced by single RE unit (1 wind turbine or 1 solar module)
•Where the point of energy prediction will be made
Power Converter
+
-
Assume:Converter efficiency 90%

CALCULATING ENERGY DENSITY•Relying on study proposed by literatures
[1-2], derive a minimum necessary area that should be provided to build single RE unit
•Energy density is then expressed asAnnual EnergyEnergy Density
Minimum Area per Single RE

ENERGY FROM WIND TURBINE• Five different type of wind turbine ranging from 5
– 25 kW at hub height 18 m, are used in assessment.
• Original wind speed data therefore must be corrected from 2 to 18 m altitude.
• Energy calculation are based on power curve and time span between successive wind speed data sampling.
• Sum it up for one year to get annual production.• From [1], the spacing between wind turbine to
enable wind speed recover in the downstream side should be 9Dx5D

WIND TURBINE PERFORMANCE ANALYSIS
No Wind Turbine Annual
Electricity
kWh
Annual
Wind Energy
kWh
Turbine
efficiency (ηWT)
Energy Density
(εwind) - kWh/m2
1. Eoltec Wind Runner 25 kW 13915.49 35832.56 38.83% 3.87
2. Fortis Montana 5.6 kW 1986.54 8958.14 22.18% 2.21
3. Gaia 11 kW 8689.72 60557.02 14.35% 1.43*
4. Iskra 5 kW 3119.72 10448.77 29.86% 2.97
5. Aircon 10 kW 5360. 02 18063.19 29.67% 2.95
• From the table: A bigger wind turbine capacity is not assuring better energy density.• Better performance wind turbine, are normally posing:
low cut in speed, high cut out speed, high power to rotor diameter ratio

ENERGY FROM PHOTOVOLTAIC• Energy calculation are based on corrected power
output from STC rating
• Multiplying power output with time span between successive solar data sampling and sum it up for one year to get annual energy production.
• It is suggested in [2], the ratio between land occupied for module installation to land for maneuver, access, services facilities, etc are 1:1.89.
max * max, STC21000
GP P
W m max max* 1 25cellP P T C

PV SYSTEM PERFORMANCE ANALYSIS
•Refer to that assumption, the kWh/m2 of PV system then become:34.6% .
Total PV EnergyOutputpanel year
Surface Areaof Single PV Module
Photovoltaic Annual Electricity
kWh/Module
Annual Solar Energy
kWh/Module
Module
efficiency (ηPV)
Energy Density
(εPV) - kWh/m2
ND-220E1J 180.68 1575 11.46% 38.07

PV SYSTEM PERFORMANCE ANALYSIS
•Refer to that assumption, the kWh/m2 of PV system then become:
•Best Wind Turbine Energy Density: 3.87kWh/m2
•Best Wind Turbine Efficiency: 38.83 %
34.6% .Total PV EnergyOutput
panel yearSurface Areaof Single PV Module
Photovoltaic Annual Electricity
kWh/Module
Annual Solar Energy
kWh/Module
Module
efficiency (ηPV)
Energy Density
(εPV) - kWh/m2
ND-220E1J 180.68 1575 11.46% 38.07

THE ANALYSIS RESULT INTERPRETATIONWhy WT comes with low power density?
• The quality of wind speed in urban area overall is poor. It causes WT annual production is low as well
• Although efficiency of a wind turbine is better than solar panel, wind turbine demand large area free from interference.
Why PV better?• Radiation received in WS building at 0.5 sun is up to
1000hrs/year, and PV works at cell temperature less than 25⁰C (yield better power output) have 75%+ of chance, make this place suitable for PV operation
• Though PV has lower efficiency, it doesn’t require so much space, as long as it fits with the module size plus for miscellaneous services

CONCLUSION• From the analysis it has been shown that in urban
area, PV outrank wind turbine energy density (kWh/m2) performance by the ratio of 38.07 : 3.87
• With less spacious land available in the urban area, PV is the best solution if RE are preferred for generating electricity.
• The presented result need further improvement, because as introduced earlier, several key factor that may cause reduction in PV and wind power output: humidity and wind direction so far remain unconsidered in calculation.

REFERENCES[1] G. M. Masters, Renewable and Efficient Electric Power Systems: Wiley, 2004.[2] K. Kurokawa, Energy from the Desert: Feasibility of Very Large Scale Photovoltaic Power Generation (VLS-PV) Systems: James & James (Science Publishers), 2003.

THAT’S ALL